RUNX1, a transcription factor mutated in breast cancer, controls the fate of ER-positive mammary luminal cells
- Brigham and Women's Hospital, United States
- Harvard Medical School, United States
- Jilin University, China
Figures
Figure 1 with 1 supplement
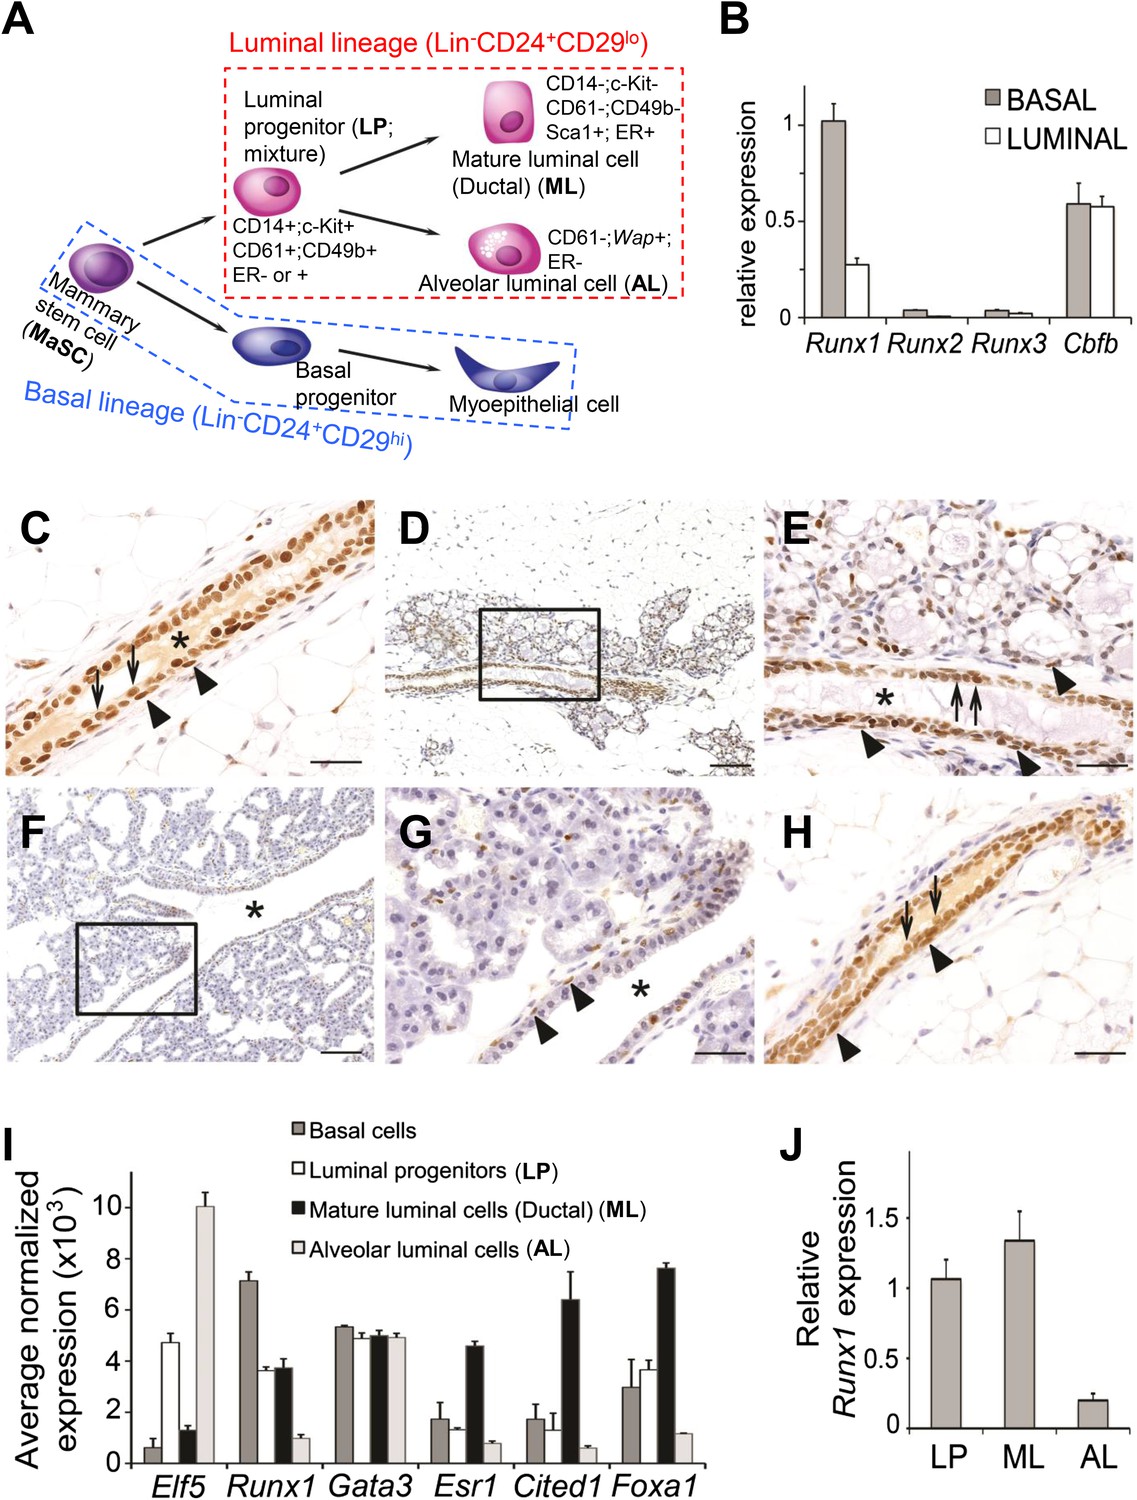
Expression pattern of Runx1 in murine MGs.
(A) Schematic diagram of a simplified version of the MEC hierarchy. MECs can be separated into the luminal and basal lineages. Major MEC subpopulations, their names and name abbreviations, as well as their marker expression patterns are shown. Note: ‘luminal progenitor (LP)’ has been used to refer to progenitor cells for the luminal lineage defined based on either CD61 (Asselin-Labat et al., 2007), or CD14 and c-Kit (Asselin-Labat et al., 2011), or CD49b (Li et al., 2009; Shehata et al., 2012), and is therefore a mixture of overlapping progenitor cell populations and may include common or separate progenitors for ductal and alveolar luminal cells. (B) qRT-PCR analysis of Runx1, Runx2, Runx3, and Cbfb transcripts isolated from luminal and basal cells of adult virgin female mice. (C–H) IHC staining for RUNX1 on sections of MGs at different developmental stages: (C) adult virgin, (D–E) mid-gestation (the region highlighted in D is shown in E), (F–G) lactation (the region highlighted in F is shown in G), and (H) after involution. Arrows and arrowheads indicate RUNX1-expressing luminal and basal cells, respectively; * indicates lumen. Scale bars = 20 μm. (I) Relative expression values of indicated genes determined by microarray analysis of the indicated MEC subpopulations isolated from the MGs of adult virgin female mice. ALs were isolated as YFP+ cells from Wap-Cre;R26Y females (i.e., MECs genetically marked by the Wap-Cre transgene) during mid-gestation. Affymetrix probes used to estimate expression of each indicated gene are 1419555_at, 1422864_at, 1448886_at, 1435663_at, 1449031_at, and 1418496_at for Elf5, Runx1, Gata3, Esr1, Cited1, and Foxa1, respectively. (J) Runx1 expression levels were confirmed in sorted LPs, MLs, and ALs (as in I) by qRT-PCR.
Figure 1—figure supplement 1
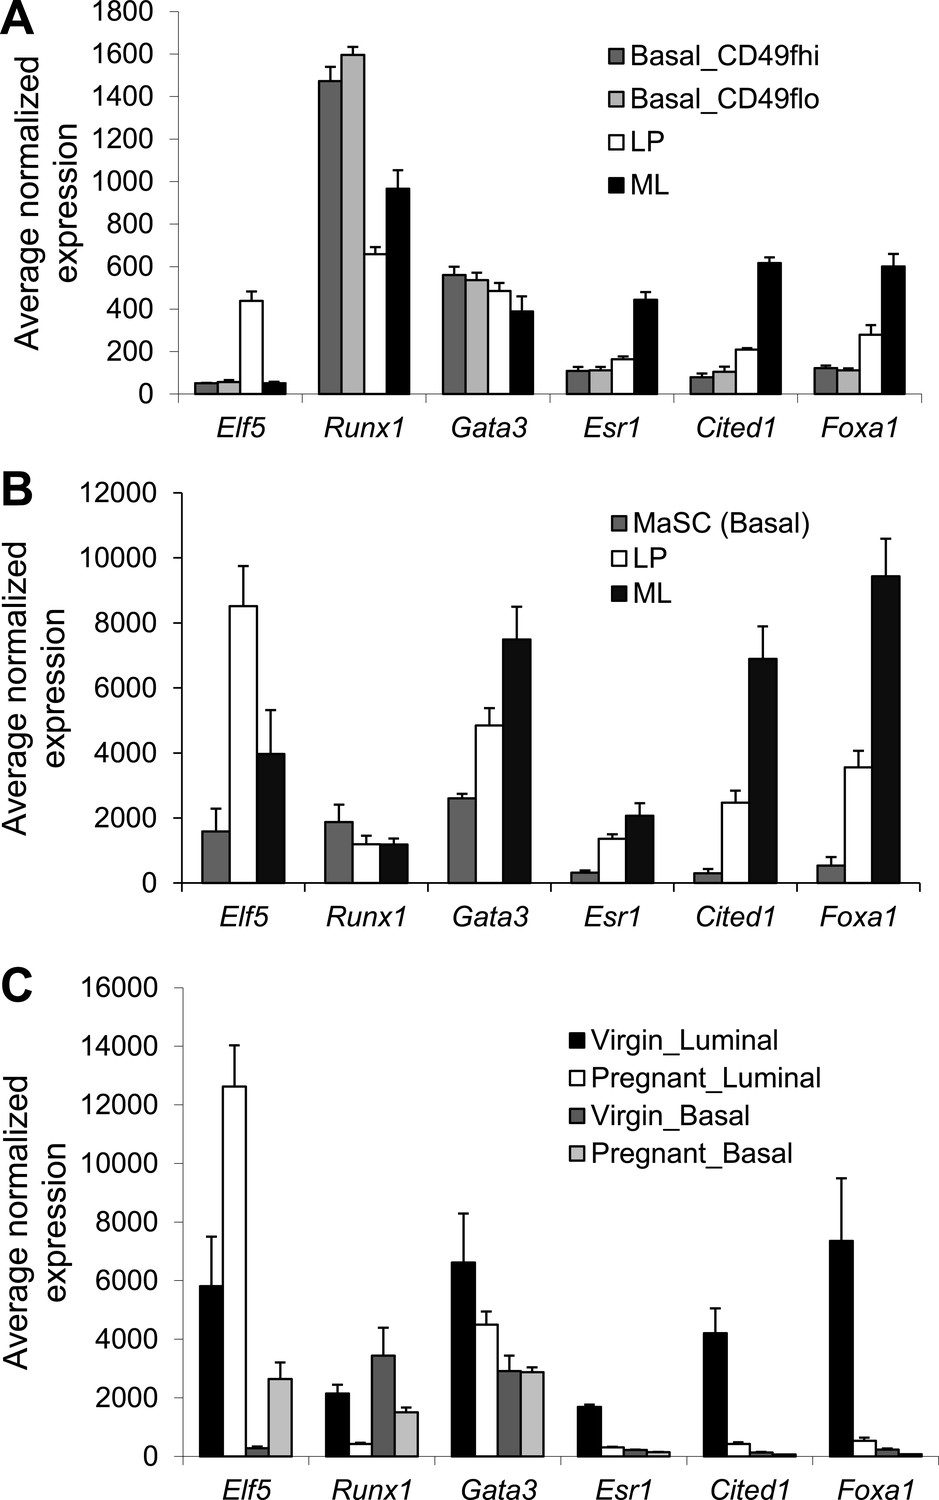
Expression analysis of Runx1 and other select luminal transcription factor (TF) genes based on microarray.
Relative expression values of indicated genes determined by microarray analysis of the indicated mammary epithelial cell (MEC) subpopulations isolated from the mammary glands (MGs) of adult female mice from multiple published datasets. (A) Based on GEO database accession # GSE40875 (only showing the nulliparous subsets). Basal_CD49hi and Basal_CD49flo are two subpopulations in the lin−CD24loSca1− basal lineage based on higher or lower CD49f expression, respectively. (B) Based on GEO database accession # GSE19446. (C) Based on GEO database accession # GSE20402.
Figure 2
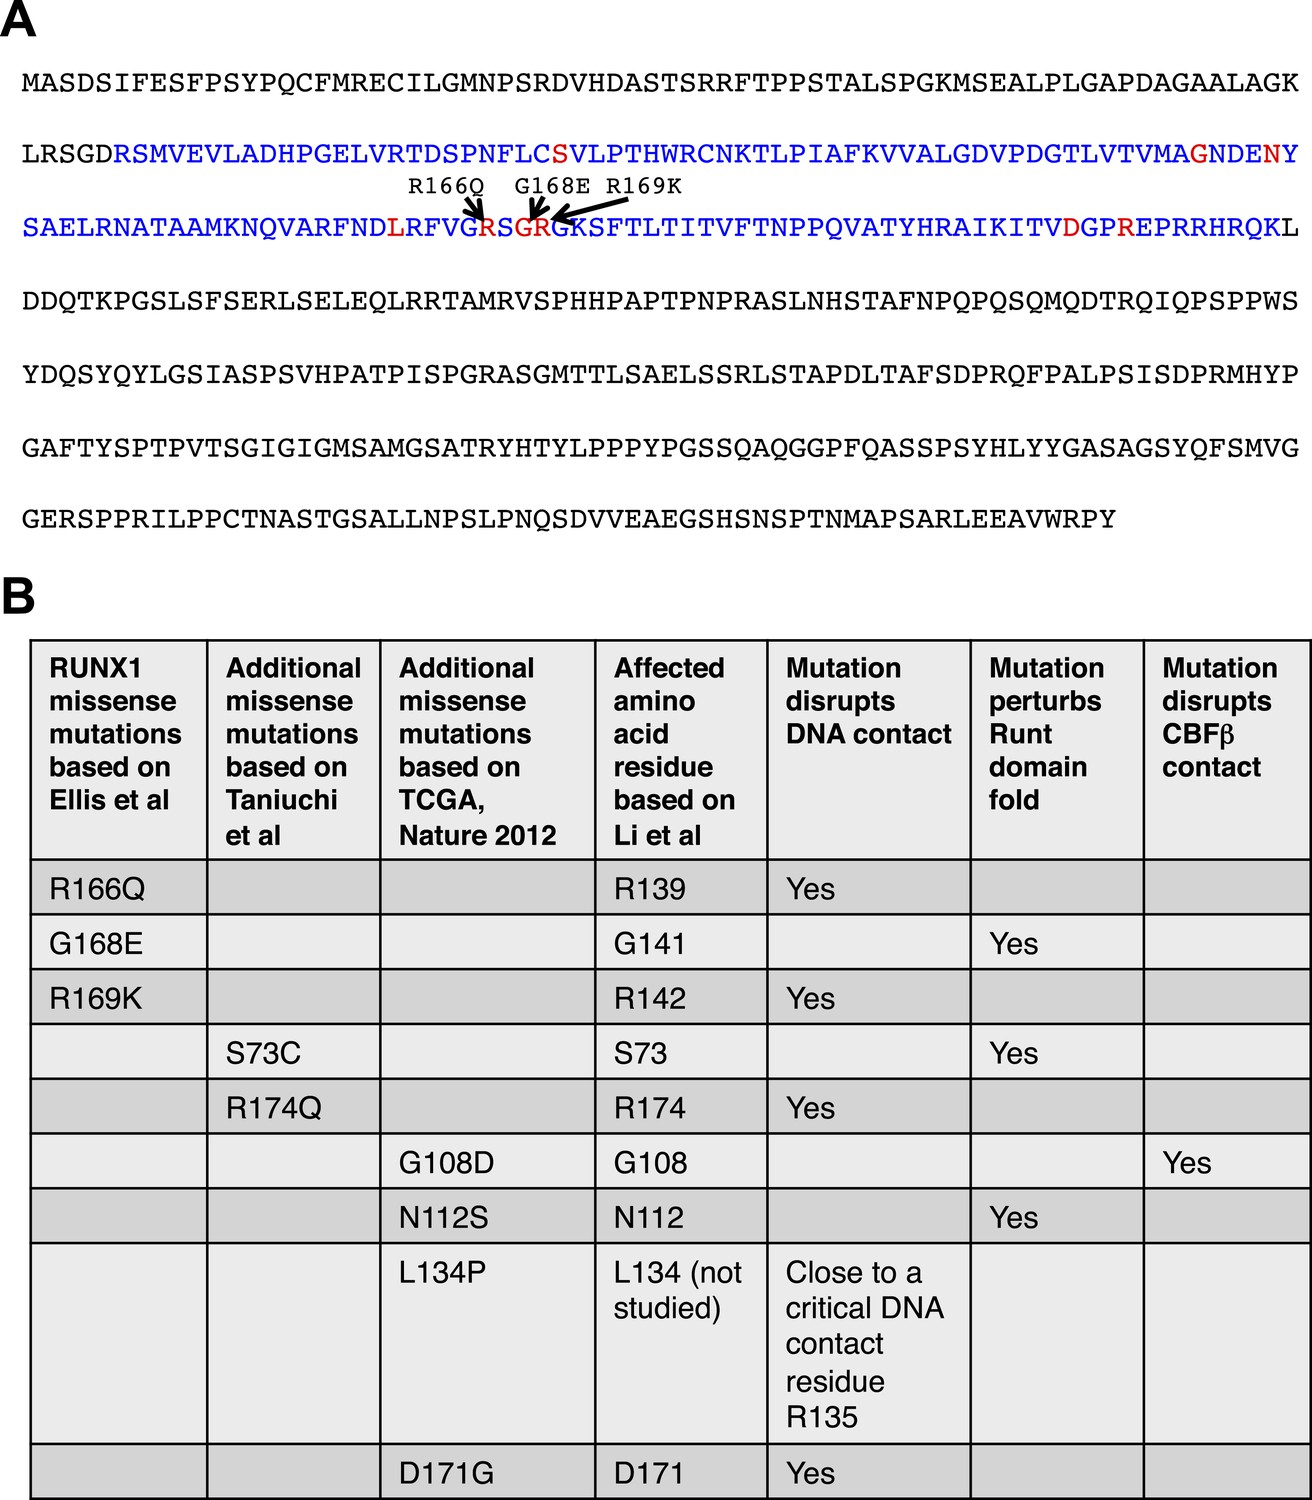
Analysis of RUNX1 mutations.
RUNX1 somatic missense mutations identified in human breast cancers disrupt its DNA-binding either directly (disrupting direct DNA contact) or indirectly (disrupting the overall protein fold of its DNA-binding RUNT domain or disrupting CBFβ binding). (A) RUNX1 full-length protein sequence; RUNT domain is highlighted in blue. The three amino acid residues affected by point mutations in luminal breast cancers (based on Ellis et al. (2012)) are shown in red. Several additional missense mutations (based on Cancer Genome Atlas Network (2012); Taniuchi et al. (2012)) are also highlighted with red font. (B) How these missense mutations affect RUNX1 DNA-binding is predicted based on a previous structural and biochemical analysis of the RUNT domain (Li et al., 2003).
Figure 3 with 1 supplement

Runx1-loss leads to a reduction in the luminal MEC population.
(A) Schematic representation of the Runx1 conditional knockout allele in which its exon 4 is flanked by loxP sites, as well as the R26Y conditional Cre-reporter. STOP: transcriptional stopper cassette. Subsequent breeding with MMTV-Cre resulted in mice in which selected subsets of MECs express YFP and lack expression of functional RUNX1. (B) FACS gating strategy for detecting lin−YFP+ (lin: lineage markers) MECs, as well as YFP+ lin−CD24+CD29lo luminal (Lu), and lin−CD24+CD29hi basal (Ba) MECs in MMTV-Cre;R26Y females. Str: stromal cells. (C) qRT-PCR analysis confirming the loss of Runx1 expression in YFP+ MECs sorted from MMTV-Cre;Runx1L/L;R26Y females (L/L). (D) FACS analysis showing the reduced lin−YFP+ MEC population (left plots), as well as the reduced lin−YFP+ luminal population (right plots), in MMTV-Cre;Runx1L/L;R26Y female compared to those in MMTV-Cre;Runx1+/+;R26Y control female. (E–F) The percentages of lin−YFP+ MEC population (E), as well as the ratios of luminal/basal subpopulations among the lin−YFP+ gate (F), are significantly reduced in MMTV-Cre;Runx1L/L;R26Y females (n = 9) (L/L) compared to those in MMTV-Cre;Runx1+/+;R26Y control females (n = 10) (+/+). p values: *: p ≤ 0.05; error bars represent mean ± S.E.M.
Figure 3—figure supplement 1
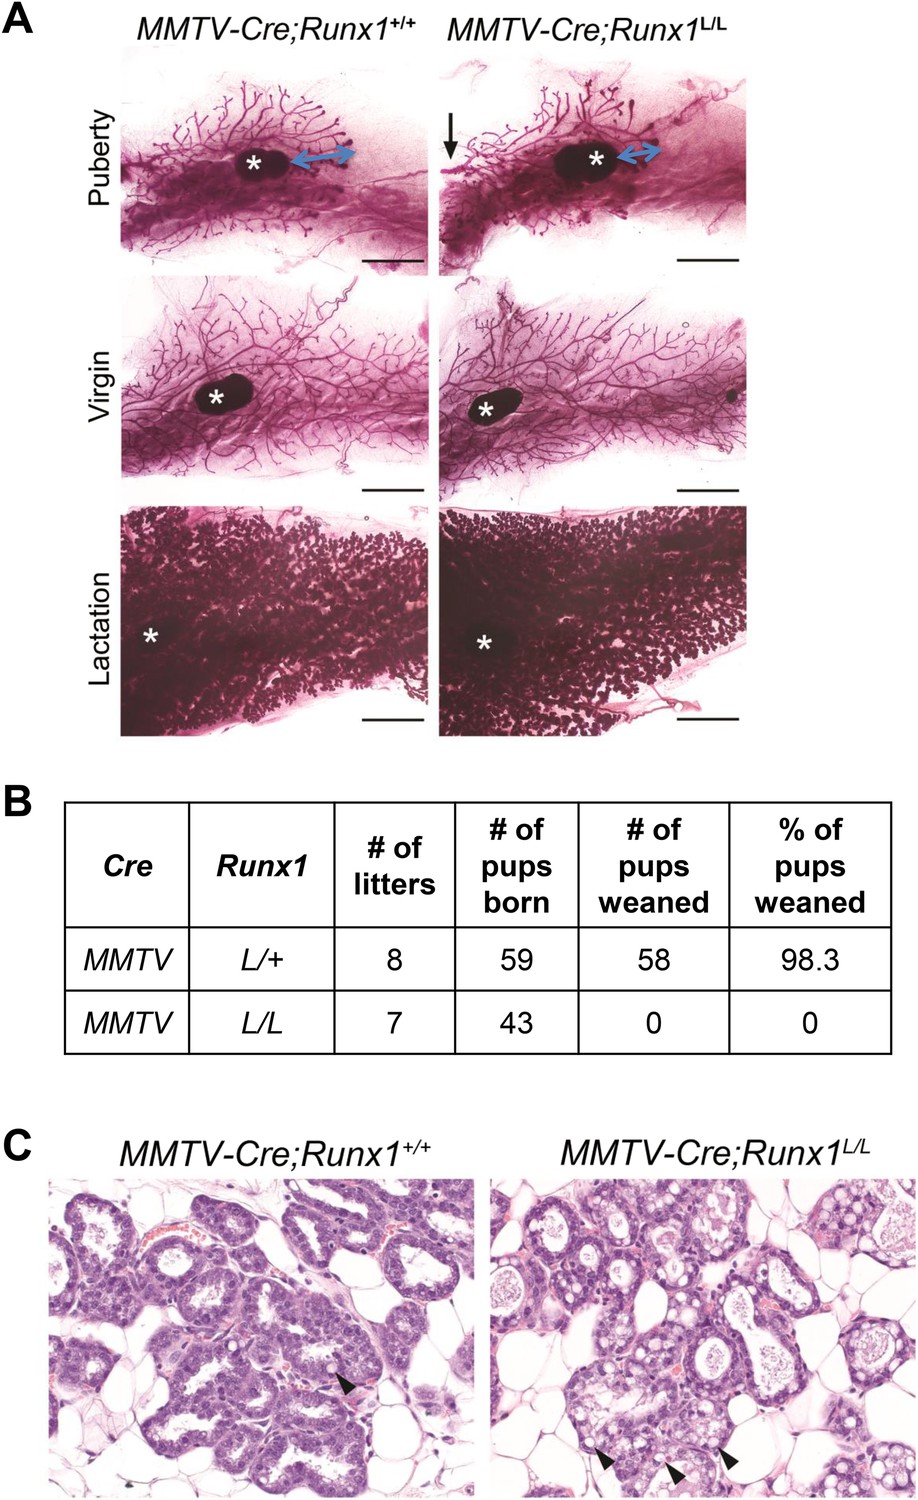
Conditional knockout study of Runx1 in murine MGs.
(A) Whole-mount carmine staining of inguinal MGs of pubertal (top), adult virgin mice (middle), and lactation day-0 dams (bottom). Scale bars indicate 3 mm. Black arrow indicates the main duct coming from the nipple; * indicates the lymph node. Blue arrow indicates the distance between the front of the expanding ductal tree and the lymph node (used as a reference point). (B) Weaning record showing MMTV-Cre;Runx1L/L females failed to nurse their pups. (C) Hematoxylin and eosin (H&E) staining of sections of MGs from MMTV-Cre;Runx1+/+ (left) and MMTV-Cre;Runx1L/L (right) dams on lactation day-0. Note the increasing number of cytoplasmic lipid droplets and milk in the lumen of the MMTV-Cre;Runx1L/L dam. Arrowheads point to lipid droplets.
Figure 4 with 1 supplement
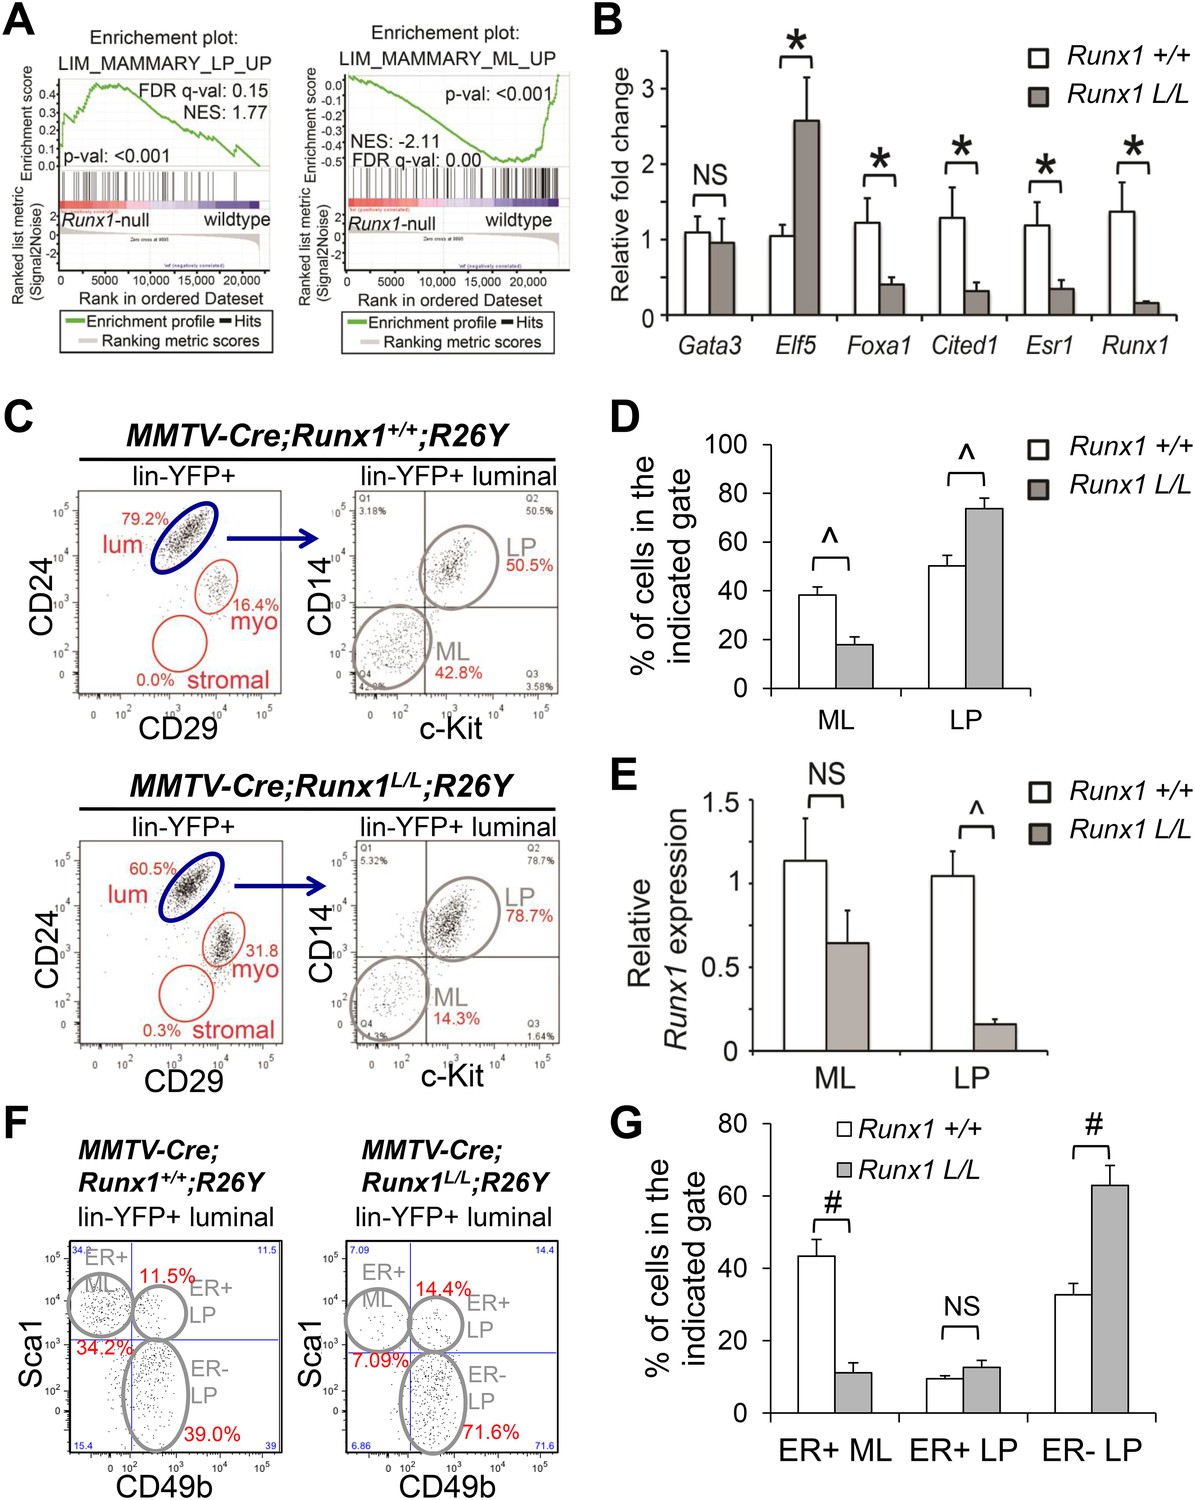
Runx1 disruption leads to a profound reduction in ER+ MLs.
(A) GSEA enrichment plots showing correlation of the expression profiles of Runx1-null or WT luminal MECs with previously published conserved human and mouse signatures of LPs (left) or MLs (right) (Lim et al., 2010). (B) qRT-PCR validation of TF/co-factor genes known to play roles in luminal lineage specification and maintenance. RNA was isolated from YFP+ Runx1-null and WT primary luminal MECs. (C) FACS plots of expression of CD14 and c-Kit, two LP markers (Asselin-Labat et al., 2011), in the gated YFP+ luminal MECs (Lin−CD24+CD29lo) of adult MMTV-Cre;Runx1L/L;R26Y virgin females and MMTV-Cre;Runx1+/+;R26Y control females. Note the CD14−c-Kit− mature luminal (ML) subpopulation was largely lacking in the lower right plot. (D) Quantification of the percentages of the ML and LP subpopulations as indicated in C, showing significant reduction in the ML subpopulation in MMTV-Cre;Runx1L/L;R26Y females (n = 13) compared to that in MMTV-Cre;Runx1+/+;R26Y control females (n = 10). (E) qRT-PCR analysis showing significantly reduced Runx1 expression in the LP subpopulation but not in the ML subpopulation in MMTV-Cre;Runx1L/L;R26Y females. (F) FACS plots of expression of CD49b, a LP marker, and Sca1, an ER+ ML marker (Shehata et al., 2012) in the gated YFP+ luminal MEC population. Note the CD49b−Sca1+ ER+ ML subpopulation was dramatically reduced, whereas the CD49b+Sca1− ER− LP subpopulation was increased in MMTV-Cre;Runx1L/L;R26Y females. (G) Quantification of the percentages of the ER+ ML, ER+ LP, and ER− LP subpopulations as indicated in F, showing significant reduction in the ER+ ML subpopulation in MMTV-Cre;Runx1L/L;R26Y females (n = 4) compared to those in MMTV-Cre;Runx1+/+;R26Y control females (n = 4). p values: *: p ≤ 0.05; #: p ≤ 0.005; ^: p ≤ 0.0005; NS = not significant; error bars represent mean ± S.E.M.
-
Figure 4—source data 1
(A) Gene sets from the MSigDB database C2-CGP (chemical and genetic perturbations, v3.1) enriched in Runx1-null luminal cells.
(B) Gene sets from the MSigDB database C2-CGP (chemical and genetic perturbations, v3.1) enriched in Runx1-WT luminal cells. (C) Gene sets from the MSigDB database C2-CP:KEGG (KEGG gene sets, v3.1) enriched in Runx1-null luminal cells.
- https://doi.org/10.7554/eLife.03881.009
Figure 4—figure supplement 1
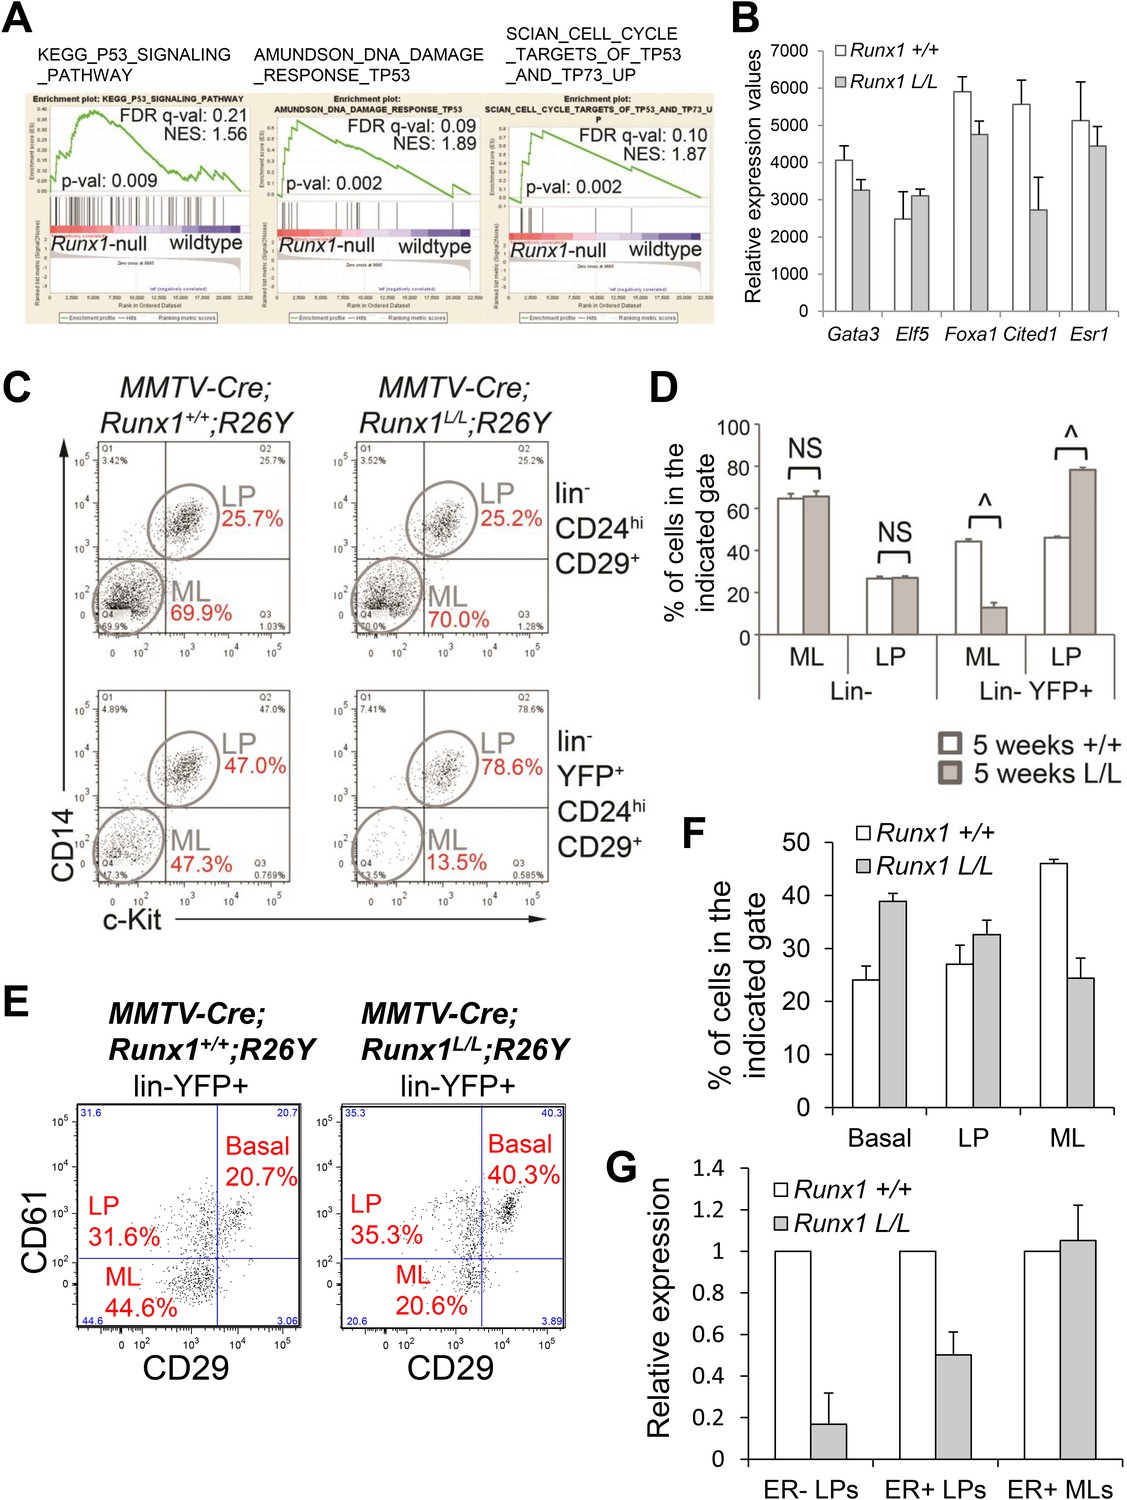
Analysis of the luminal phenotype in MMTV-Cre;Runx1L/L;R26Y females.
(A) GSEA analysis of Runx1-null and WT luminal MECs showing enrichment of several gene sets related to the p53 signaling pathway in Runx1-null luminal MECs compared to WT luminal MECs. (B) Relative expression values of the indicated genes determined by microarray analysis of Runx1-null (Runx1 L/L) and WT (Runx1 +/+) luminal MECs. Affymetrix probes used to estimate expression of each indicated gene are 1448886_at, 1419555_at, 1418496_at, 1449031_at, and 1460591_at for Gata3, Elf5, Foxa1, Cited1, and Esr1, respectively. (C) FACS plots of CD14 and c-Kit expression in the lin− luminal (upper plots) and lin−YFP+ luminal (bottom plots) MECs of 5-week old MMTV-Cre;Runx1+/+;R26Y and MMTV-Cre;Runx1L/L;R26Y females showing reduced CD14−c-Kit− ML subpopulation within the lin−YFP+ luminal population in MMTV-Cre;Runx1L/L;R26Y female (bottom right plot). (D) Quantifications (for C) of the percentages of ML or LP subpopulations within the indicated gates showing significantly reduced ML and increased LP subpopulations within the lin−YFP+ luminal gate in 5-week old MMTV-Cre;Runx1L/L;R26Y females (n = 4) (L/L) compared to those in 5-week old MMTV-Cre;Runx1+/+;R26Y control females (n = 4) (+/+). (E) FACS plots showing the reduced YFP-marked lin−CD29loCD61− ML subpopulation in adult MMTV-Cre;Runx1L/L;R26Y virgin females (n = 2) compared to MMTV-Cre;Runx1+/+;R26Y control females (n = 3). (F) Quantifications for the basal, LP and ML subpopulations based on CD61 and CD29 staining in E. (G) qRT-PCR analysis showing significantly reduced Runx1 expression in the ER− LP subpopulation, partial Runx1 reduction in the ER+ LP subpopulation, and no reduction in the ER+ ML subpopulation from MMTV-Cre;Runx1L/L;R26Y (Runx1 L/L) females, based on CD49b and Sca1 staining, compared to those from MMTV-Cre;Runx1+/+;R26Y (Runx1 +/+) control females. p values: ^: p ≤ 0.0005; NS = not significant; error bars represent mean ± S.E.M.
Figure 5 with 1 supplement
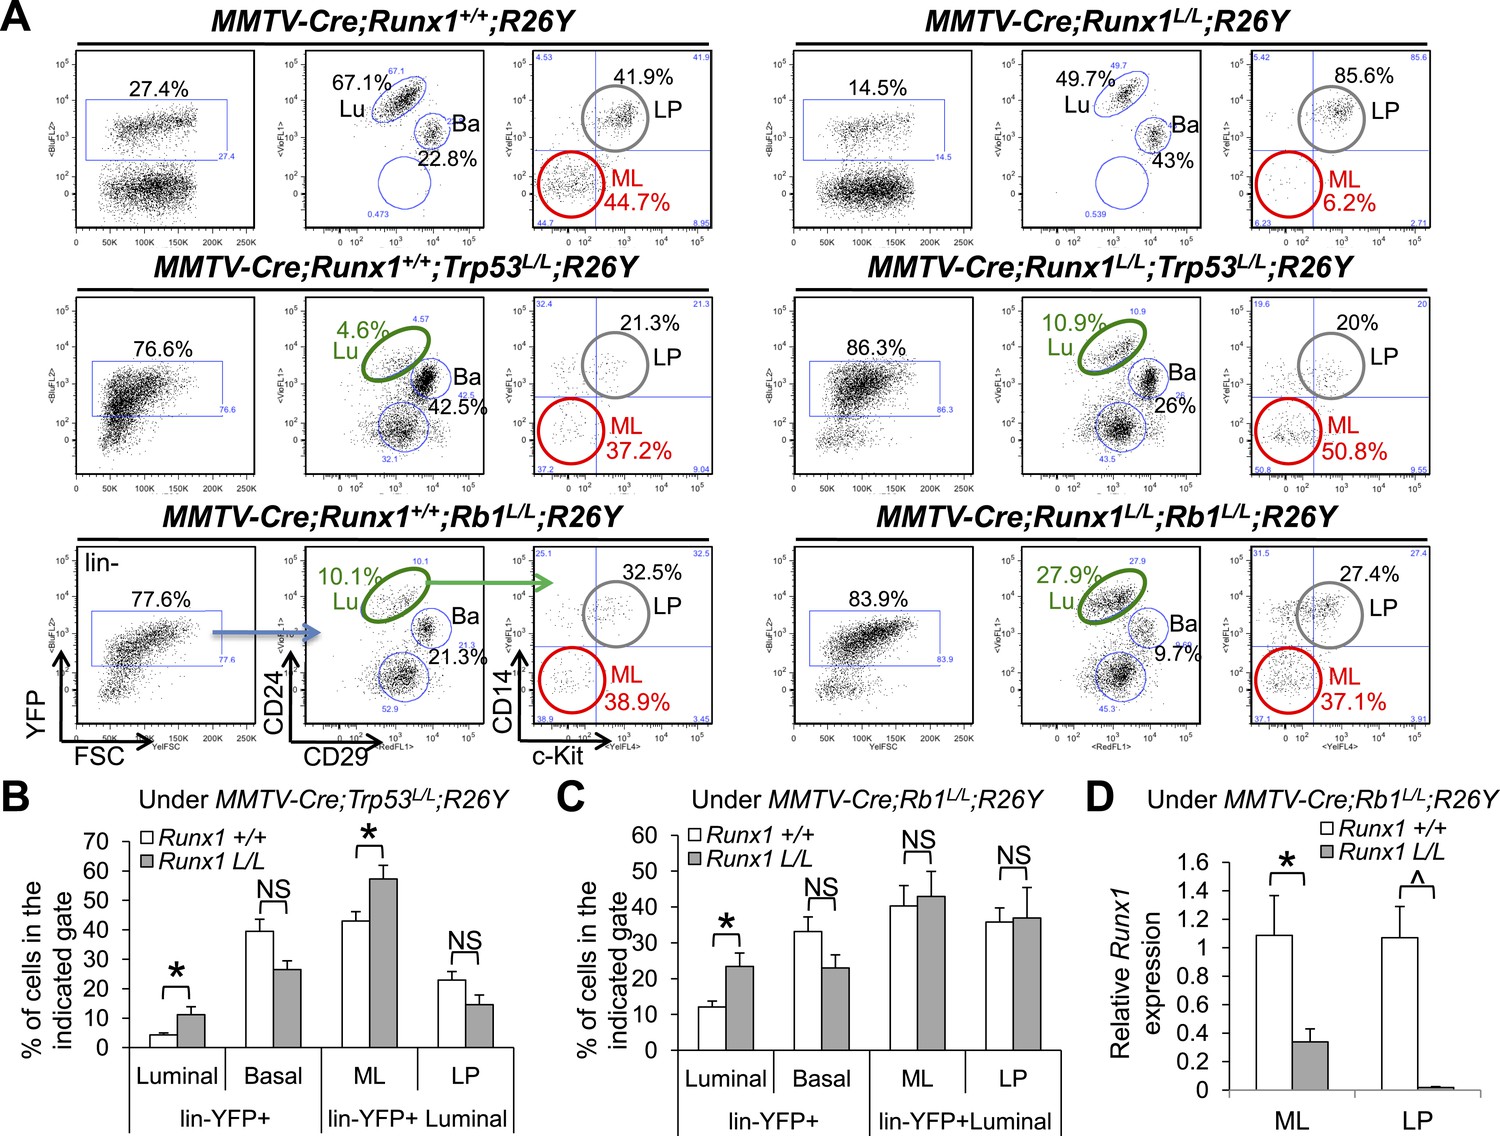
Reduction in ER+ MLs upon Runx1 disruption can be rescued by Trp53 or Rb1 loss.
(A) FACS analysis showing total lin−YFP+ MEC population, lin−YFP+ luminal population, and lin−YFP+ ML and LP subpopulations (from left to right for each genotype, an example of the gating strategy is indicated in the bottom left plots) in female mice with the indicated genotypes. Those highlighted in green show increased lin−YFP+ luminal populations upon the loss of both Runx1 and Trp53 or Rb1 (middle and bottom right plots, respectively) compared to those of Trp53 or Rb1 loss alone (middle and bottom left plots, respectively); those highlighted in red show increased lin−YFP+ ML subpopulations upon the loss of both Runx1 and Trp53 or Rb1 (middle and bottom right plots, respectively) compared to that of Runx1-loss alone (upper right plot). Lu: luminal; Ba: basal; LP: luminal progenitor; ML: mature luminal cell. (B–C) Quantifications for the percentages of each indicated subpopulation in A under either the Trp53-loss (B) or Rb1-loss background (C); in (B) Trp53-loss alone (n = 5), Trp53/Runx1-loss (n = 3); in (C) Rb1-loss alone (n = 5), Rb1/Runx1-loss (n = 5). (D) qRT-PCR analysis showing significantly reduced Runx1 expression in both the YFP-marked ML and LP subpopulations in MMTV-Cre;Runx1L/L;Rb1L/L;R26Y females. p values: *: p ≤ 0.05; ^: p ≤ 0.0005; NS = not significant; error bars represent mean ± S.E.M.
Figure 5—figure supplement 1
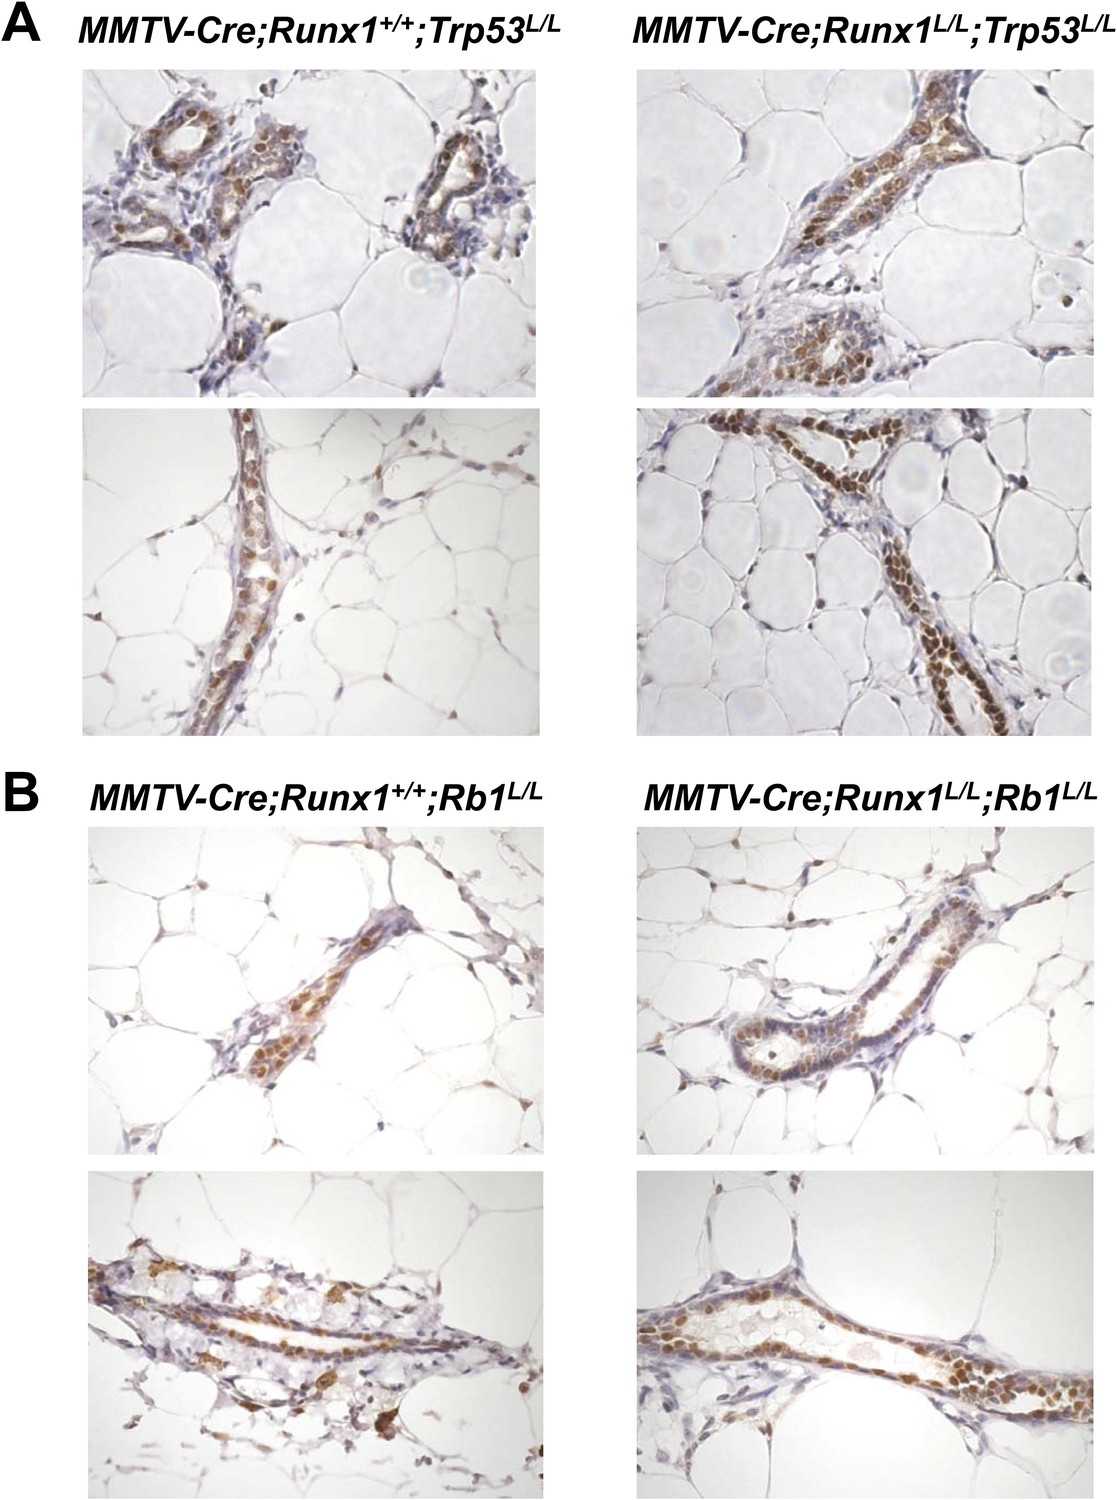
Abundant ER+ MECs are present in both Runx1/Trp53-null and Runx1/Rb1-null MGs.
(A–B) IHC staining for ERα showing abundant ER+ MECs (brown cells) in MMTV-Cre;Runx1L/L females upon simultaneous loss of either Trp53 (A) or Rb1 (B).
Figure 6 with 1 supplement
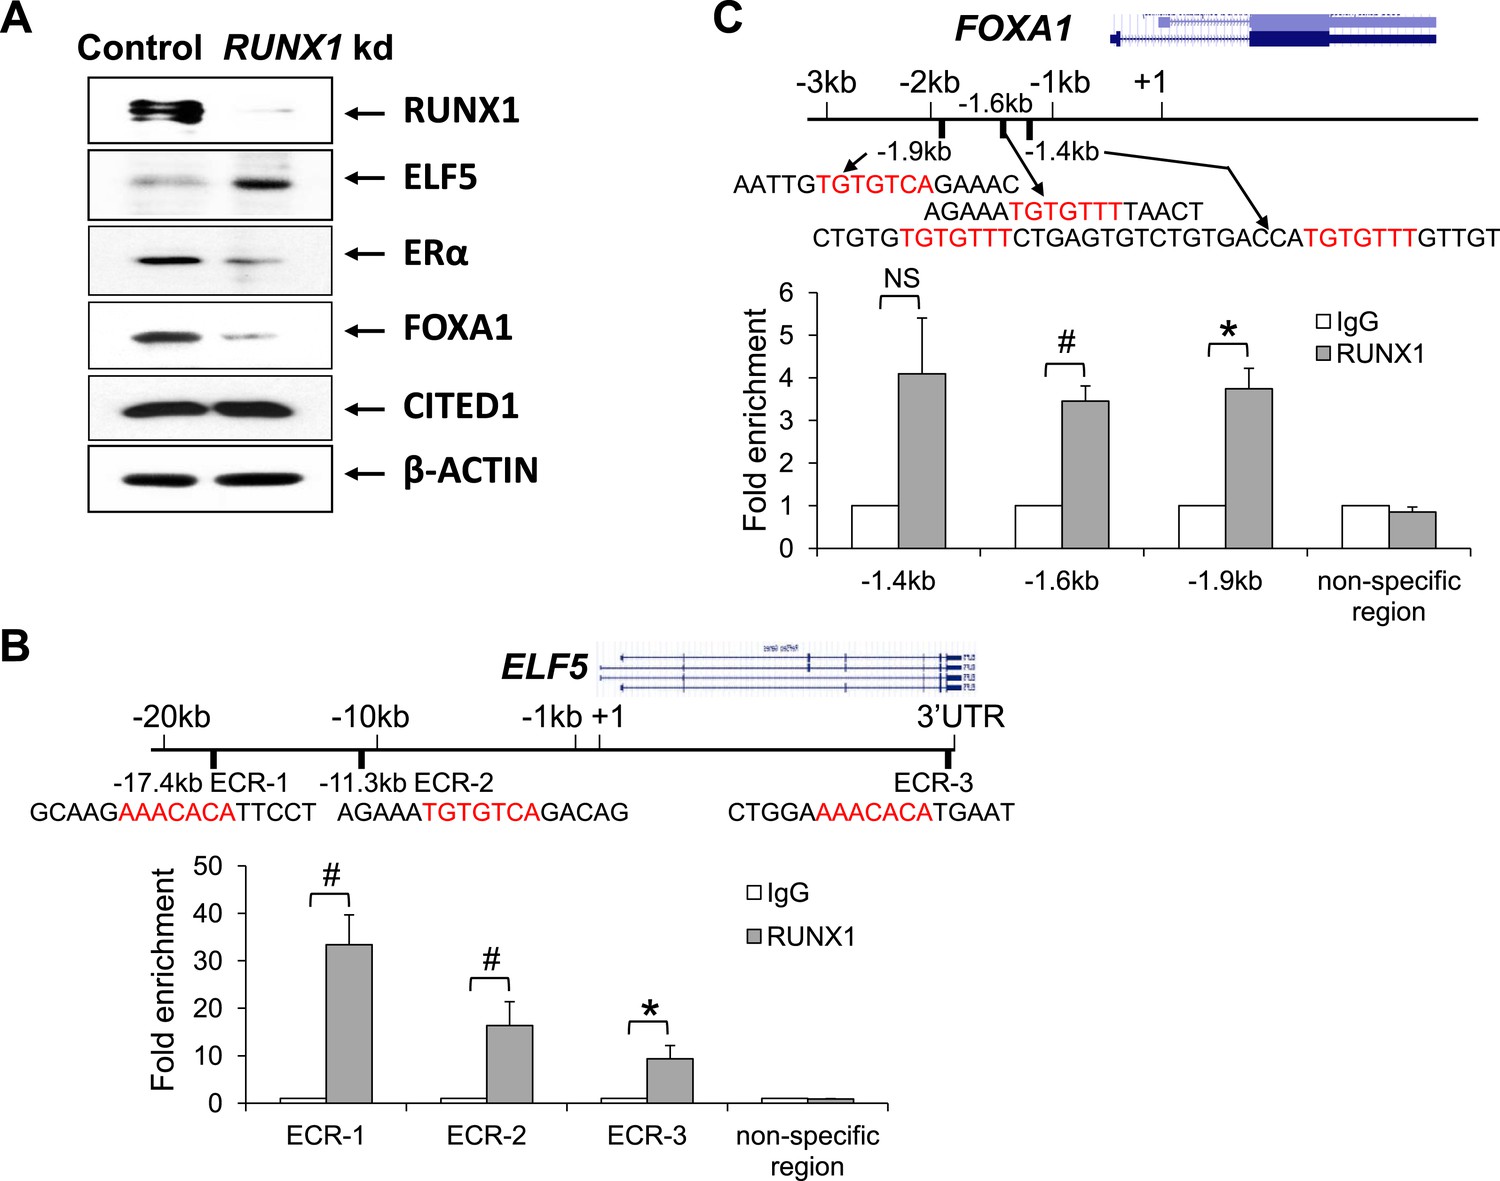
RUNX1 controls transcription of select target genes in human ER+ breast cancer cells.
(A) Western blot showing upregulation of ELF5 and downregulation of ERα and FOXA1 upon RUNX1 knockdown (kd) in T47D luminal breast cancer cells. (B) ChIP analysis showing significant binding of RUNX1 to multiple ECRs (evolutionarily conserved regions) with RUNX-binding sites in the ELF5 locus in T47D cells. (C) ChIP analysis showing significant binding of RUNX1 to the −1.6 kb and −1.9 kb regions of FOXA1 in T47D cells. RUNX1-binding to the −1.4 kb region is marginally significant (p = 0.08). In (B–C), RUNX1-binding motifs (highlighted in red) and their flanking sequences are shown; note RUNX1-binding motifs in ECR-1 and ECR-3 of ELF5 (B) are in the reverse strand. p values: *: p ≤ 0.05; #: p ≤ 0.005; NS = not significant; error bars represent mean ± S.E.M.
Figure 6—figure supplement 1
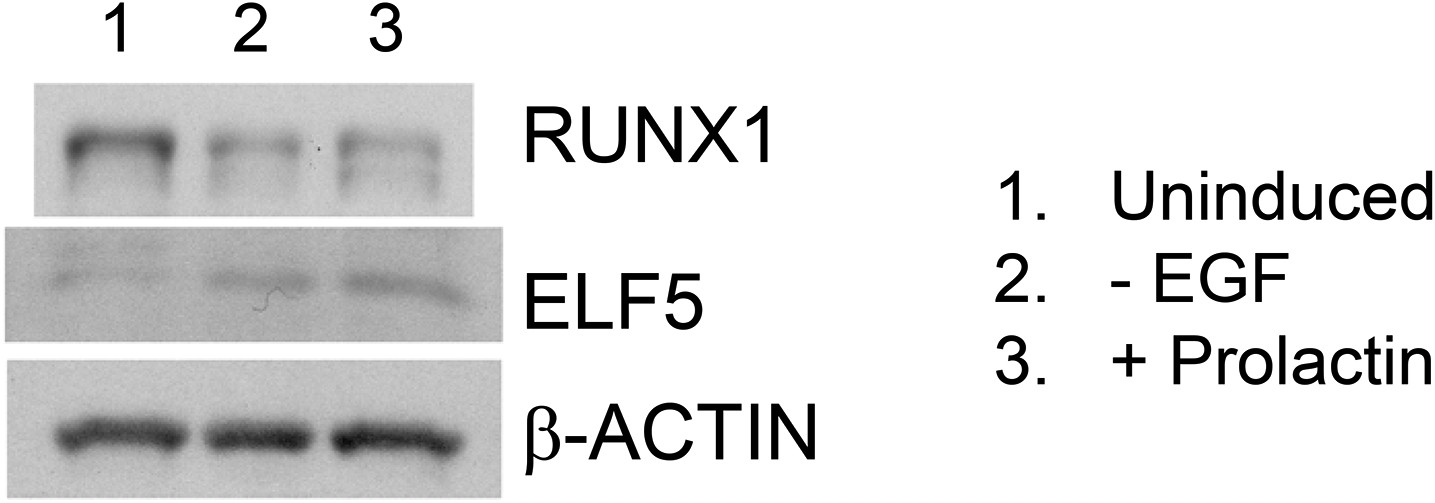
Opposite expression patterns of RUNX1 and ELF5 proteins upon alveolar differentiation of HC11 cells.
Western blot showing downregulation of RUNX1 and upregulation of ELF5 protein levels upon induced alveolar differentiation in HC11 cells.
Figure 7 with 2 supplements
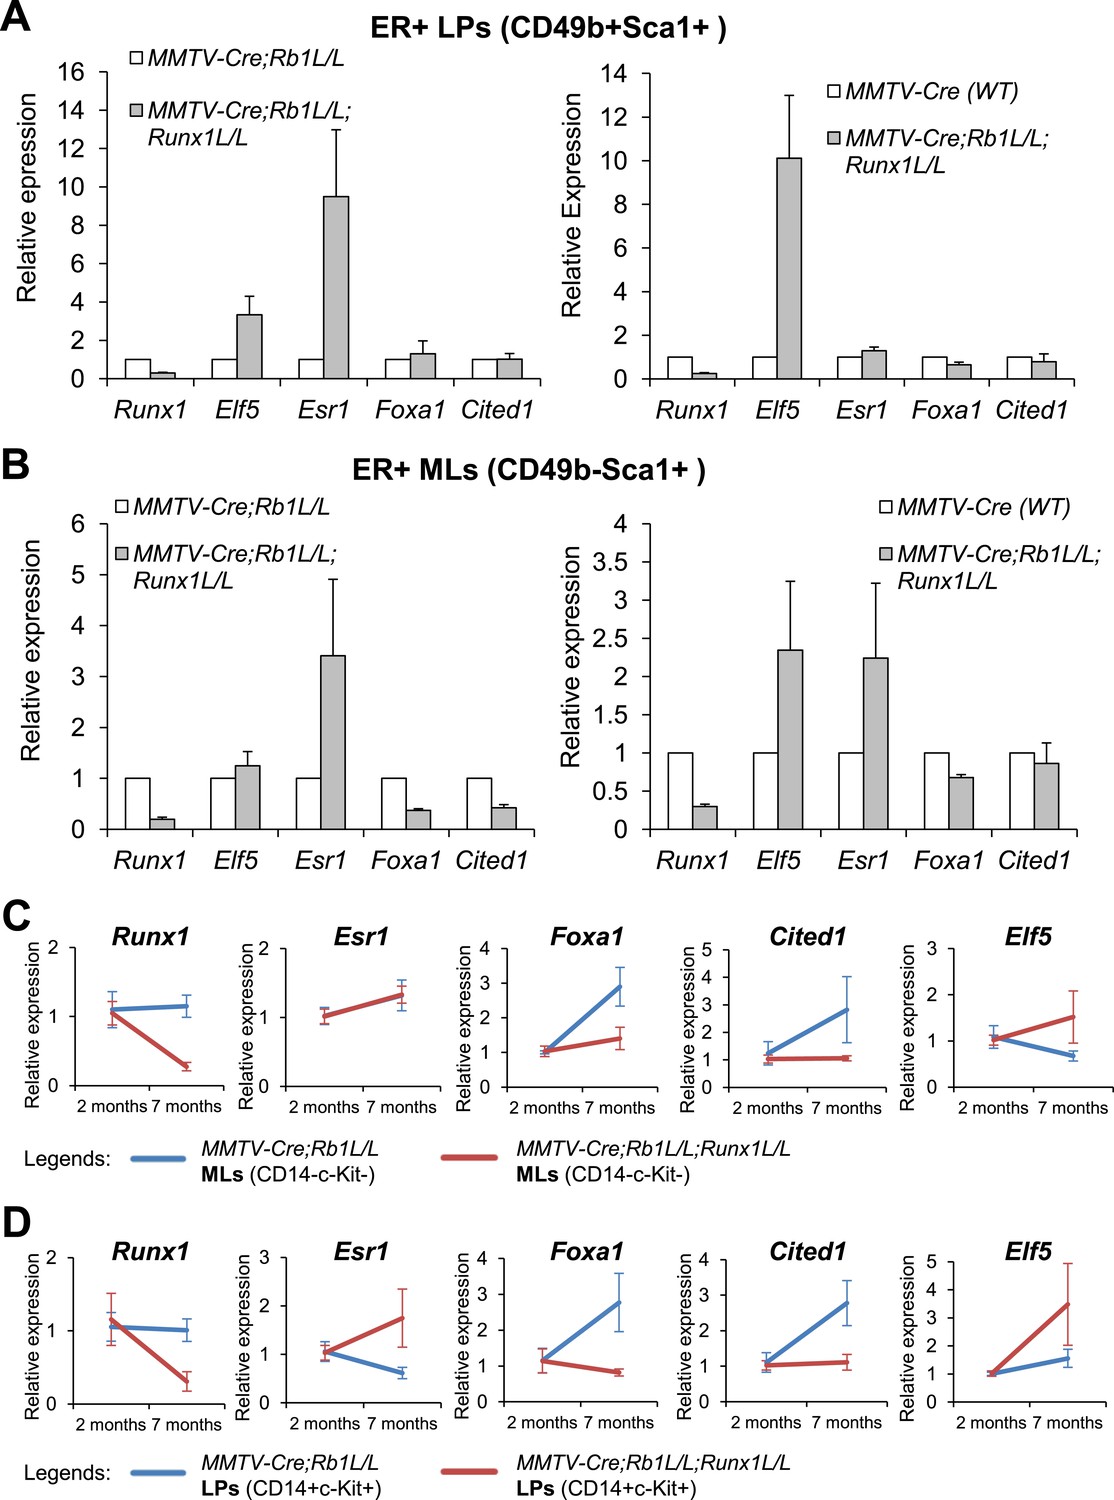
Target genes of RUNX1 in ER+ luminal MECs revealed by in vivo expression analysis.
(A–B) qRT-PCR analysis showing changes in expression of the indicated genes in sorted YFP+ ER+ LPs (A) and ER+ MLs (B) (based on CD49b and Sca1 expression) from 4- to 5-month old MMTV-Cre;Rb1L/L;Runx1L/L;R26Y double mutant females, compared to those from either MMTV-Cre;Rb1L/L;R26Y single mutant females (left plots) or MMTV-Cre;R26Y WT females (right plots). (C–D) qRT-PCR analysis comparing expression of the indicated genes in CD14−c-Kit− MLs (C) and CD14+c-Kit+ LPs (D) from 7-month to 2-month old MMTV-Cre;Rb1L/L;Runx1L/L;R26Y double mutant and MMTV-Cre;Rb1L/L;R26Y single mutant (control) females. Expression was normalized to those of the corresponding 2-month old double or single mutant females, respectively. Error bars: mean ± S.E.M.
Figure 7—figure supplement 1
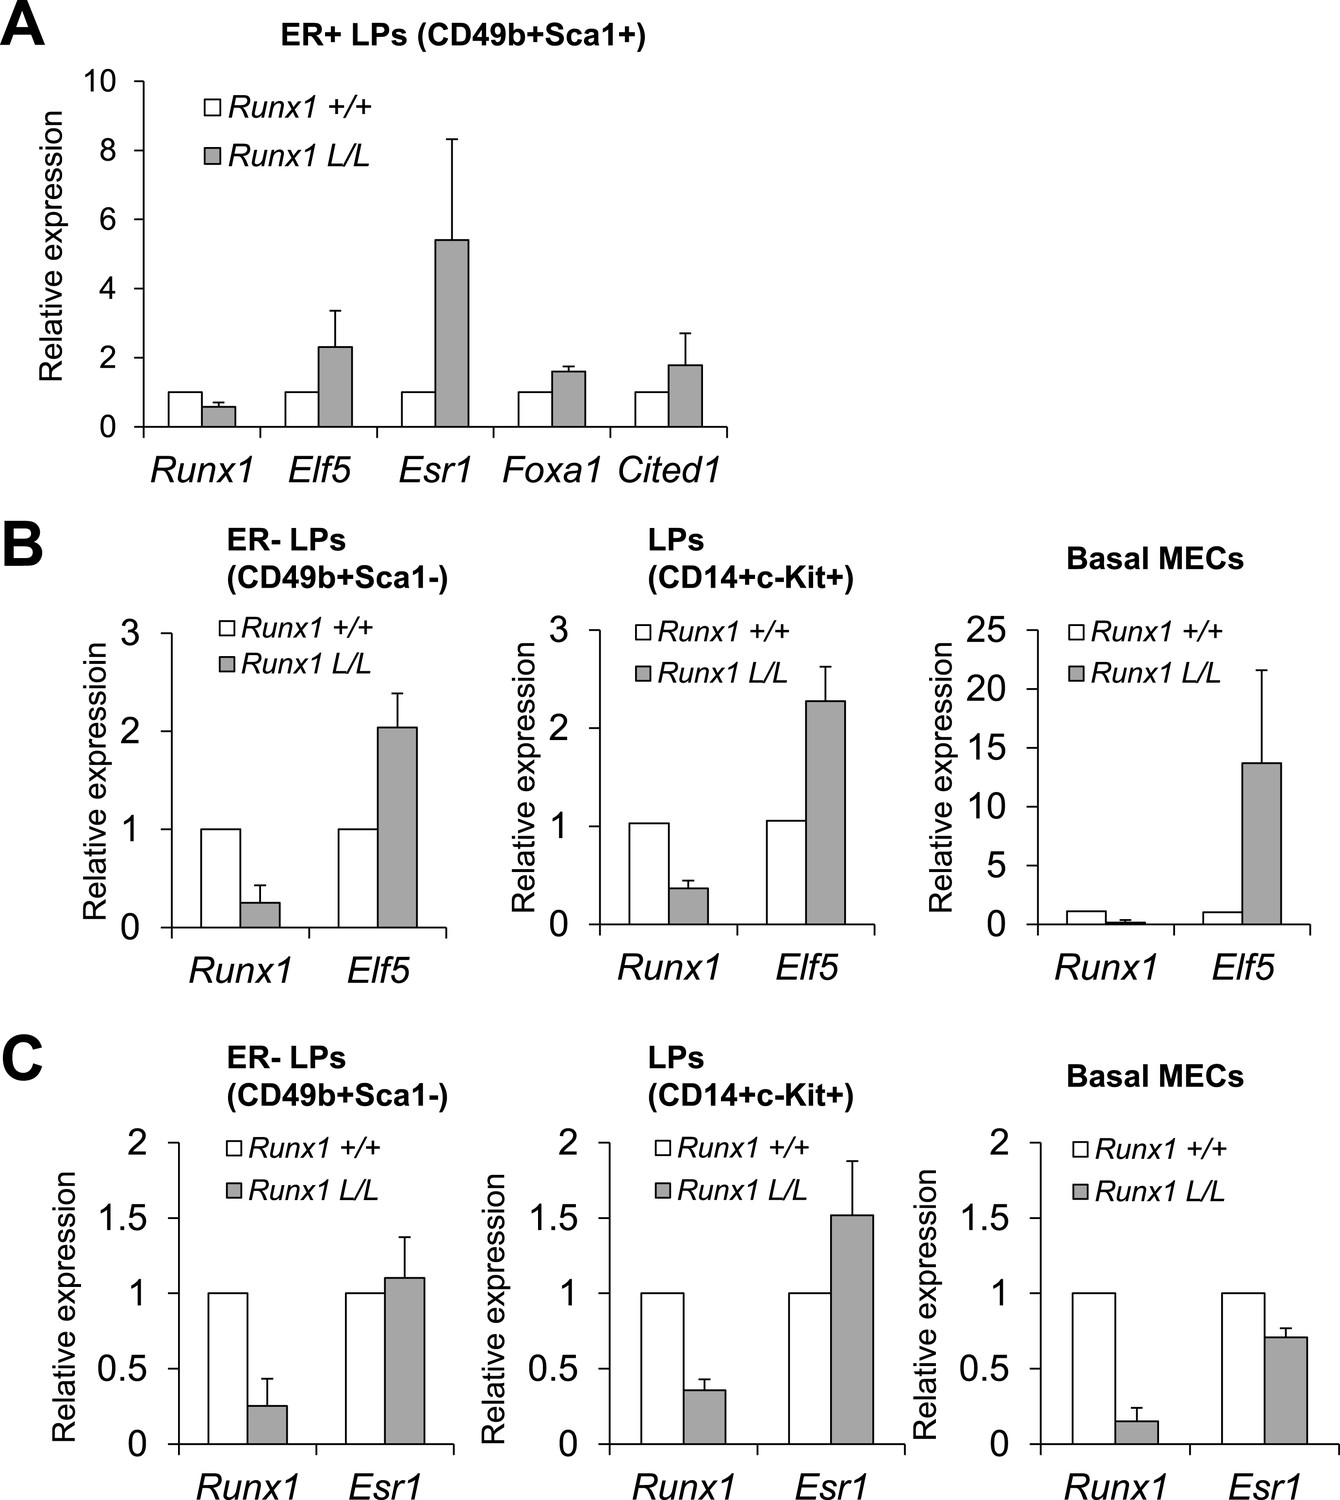
Loss of Runx1 in vivo leads to changes in expression of ER program-related genes.
(A) Changes in expression of the indicated genes in the ER+ LP subpopulation from MMTV-Cre;Runx1L/L;R26Y females (Runx1 L/L) compared to MMTV-Cre;Runx1+/+;R26Y WT females (Runx1 +/+). (B) Elf5 expression is de-repressed upon Runx1-loss in all ER− MEC subsets examined, including CD49b+Sca1− ER− LPs, CD14+c-Kit+ LPs enriched for ER− cells (both sorted from MMTV-Cre;R26Y females) and ER− basal MECs (sorted from Krt14-Cre;R26Y females). (C) Compared to ER+ LPs shown in A, Esr1 expression is not increased in CD49b+Sca1− ER− LPs, CD14+c-Kit+ LPs (enriched for ER− cells), and ER− basal MECs with Runx1-loss. Note Esr1 expression in CD14+c-Kit+ LPs with Runx1-loss is slightly elevated, possibly due to the fact that a small portion of CD14+c-Kit+ LPs are ER+ LPs (Shehata et al., 2012), which exhibit ostensibly higher Esr1 expression, as shown in A.
Figure 7—figure supplement 2
RUNX1 reduction leads to hyperproliferation of abnormal ER+ luminal cells in a context-dependent manner.
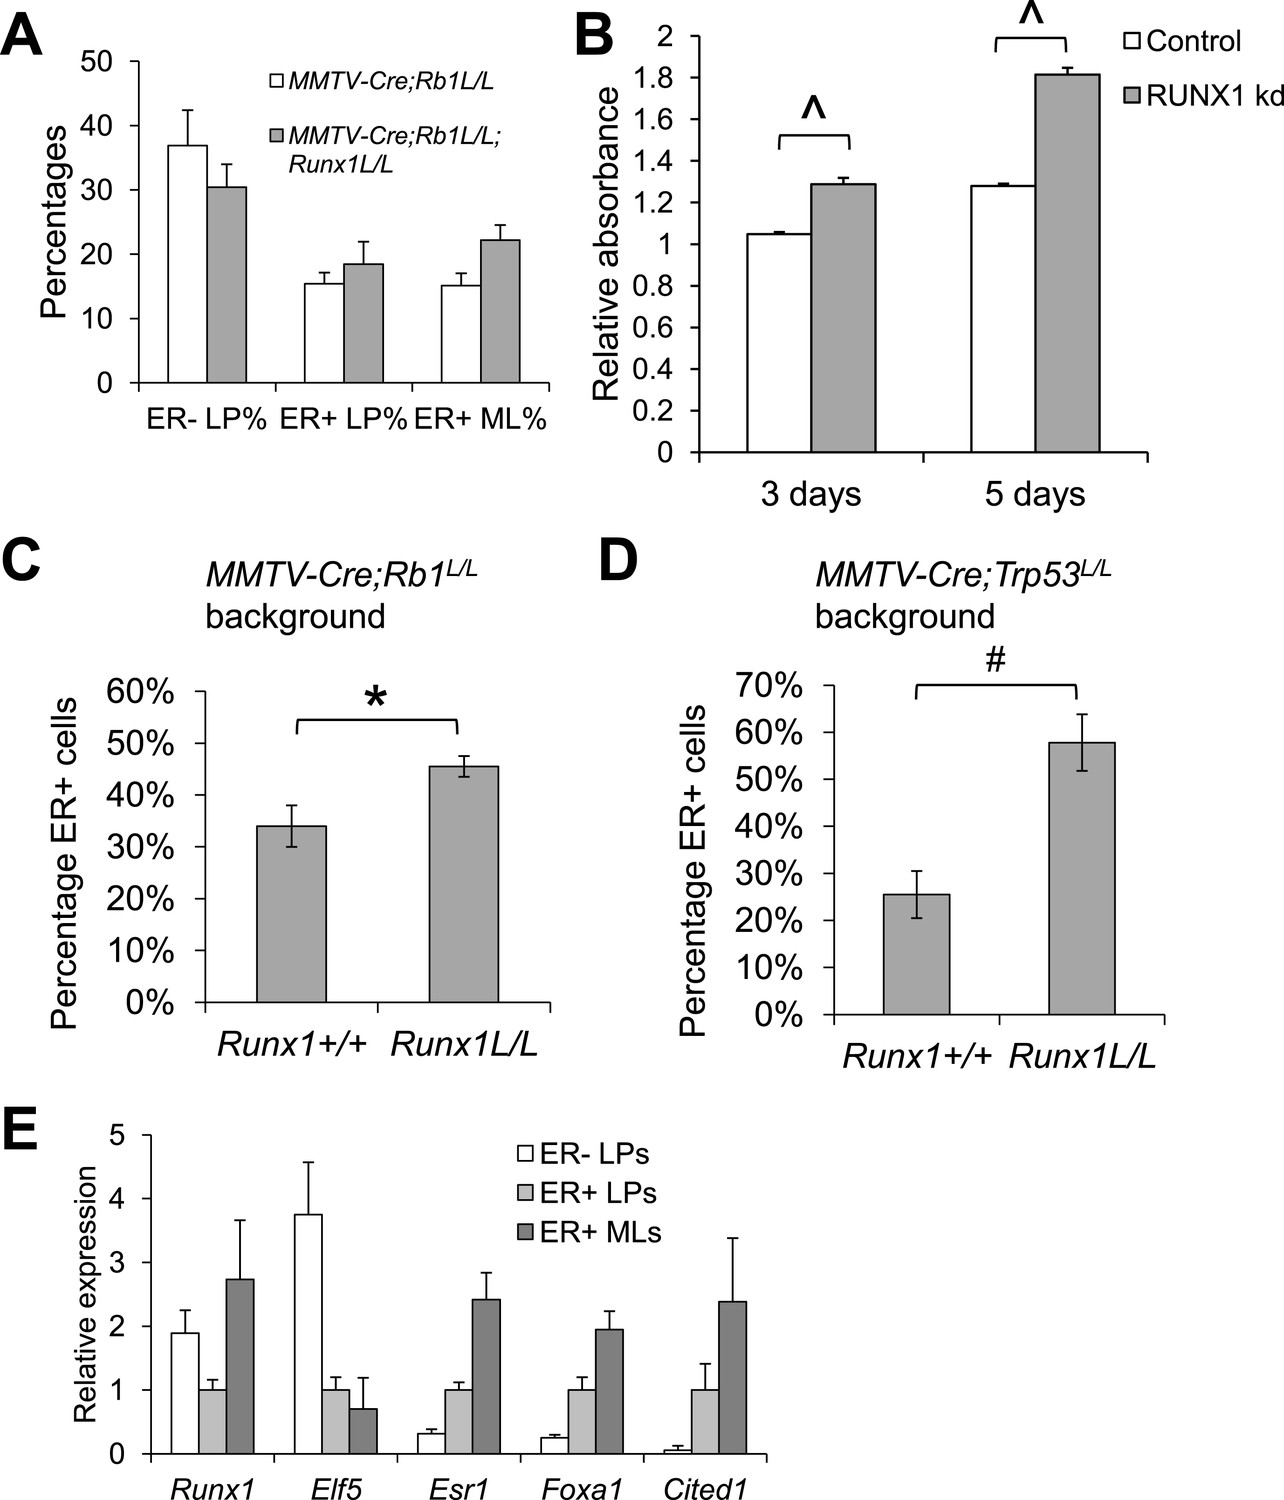
(A) Quantification of the percentages of the ER− LP, ER+ LP, and ER+ ML subpopulations sorted from MMTV-Cre;Rb1L/L;Runx1L/L;R26Y females (n = 4) compared to those from MMTV-Cre;Rb1L/L;R26Y control females (n = 4) showing slight upregulation of the ER+ LP and ER+ ML subpopulations from MMTV-Cre;Rb1L/L;Runx1L/L;R26Y females. (B) Knockdown (kd) of RUNX1 in T47D luminal breast cancer cells, which carry a TP53 mutation, increased their proliferation. (C–D) Quantification of IHC staining for ERα showing significant increase in the numbers of ER+ luminal MECs in MMTV-Cre;Rb1L/L;Runx1L/L;R26Y (C) and MMTV-Cre;Trp53L/L;Runx1L/L;R26Y (D) double mutant females compared to their corresponding single mutant control females. (E) qRT-PCR analysis showing expression of indicated genes in the ER− LP, ER+ LP, and ER+ ML subpopulations from MMTV-Cre;R26Y WT females. Expression was normalized to that of the ER+ LP subpopulation (=1). p values: *: p ≤ 0.05; #: p ≤ 0.005; ^: p ≤ 0.0005; error bars represent mean ± S.E.M. (error bars represent mean ± S.D. in B).
Figure 8

Model for the role of RUNX1 in ER+ mammary luminal cells and luminal breast cancer.
(A) Relative expression levels of key TFs in different subsets of MECs are indicated (‘+++’, ‘++’, ‘+’, ‘±’, ‘−’ indicate highest to low to no expression, based on [Figure 1I] and our single cell profiling data for sorted MECs [MPAvB and ZL, unpublished data]). RUNX1 or ELF5 controls the ductal or alveolar luminal cell fate, respectively, by antagonizing each other. RUNX1 further controls the fate of ER+ ductal luminal MECs by regulating the ER program via modulating FOXA1 expression. (B) Genetic interaction between the loss of RUNX1 and the loss of either TP53 or RB1 plays a key role in the development of RUNX1-mutant ER+ luminal breast cancer.
Additional files
-
Supplementary file 1
Primers and shRNAs used in this study (all sequences from 5′ to 3′).
- https://doi.org/10.7554/eLife.03881.020
Download links
A two-part list of links to download the article, or parts of the article, in various formats.
Downloads (link to download the article as PDF)
Open citations (links to open the citations from this article in various online reference manager services)
Cite this article (links to download the citations from this article in formats compatible with various reference manager tools)
RUNX1, a transcription factor mutated in breast cancer, controls the fate of ER-positive mammary luminal cells
eLife 3:e03881.
https://doi.org/10.7554/eLife.03881


