Recognition of tumor cells by Dectin-1 orchestrates innate immune cells for anti-tumor responses
- Institute of Industrial Science, The University of Tokyo, Japan
- Max Planck-The University of Tokyo Center for Integrative Inflammology, Japan
- Core Research for Evolution Science and Technology, Japan
- Yokohama City University Graduate School of Medicine, Japan
- Medical Mycology Research Center, Chiba University, Japan
- Research Institute for Biomedical Sciences, Tokyo University of Science, Japan
Figures
Figure 1 with 4 supplements
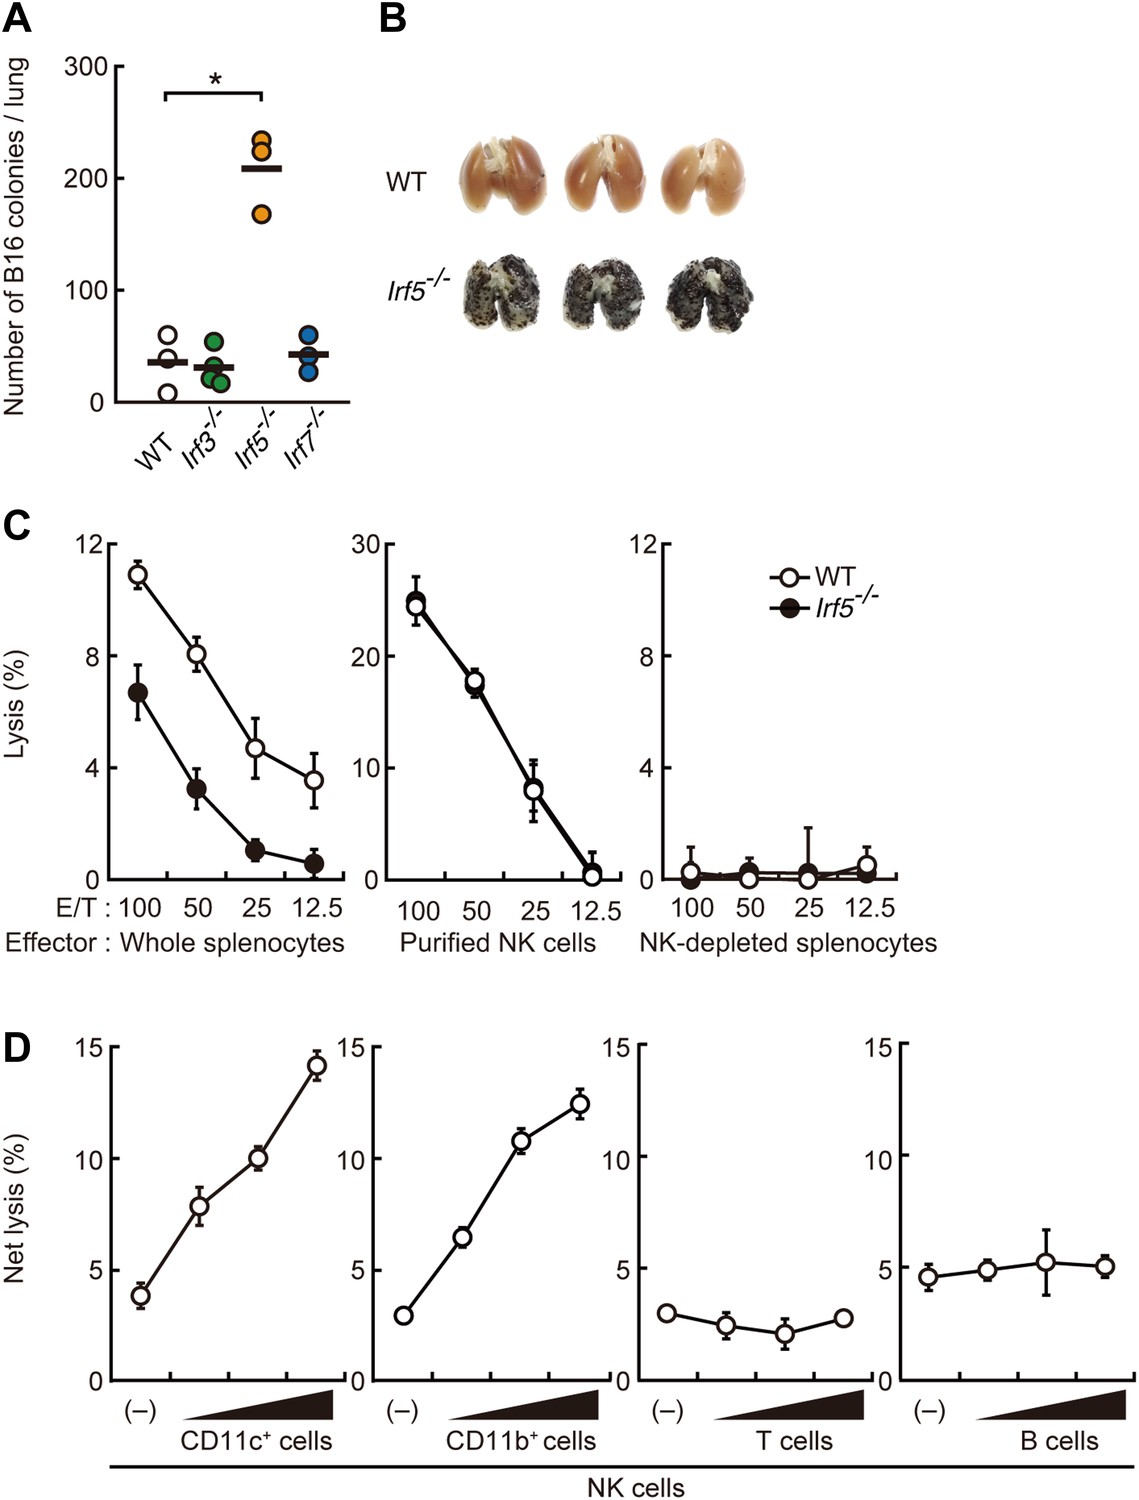
Critical contribution of IRF5 to the enhancement of NK cell-mediated anti-tumor responses.
(A) Selective contribution of IRF5 in the suppression of lung metastasis of B16F1 cells. Number of metastasized colonies in lungs from wild-type (WT), Irf3−/−, Irf5−/−, or Irf7−/− mice 14 days after intravenous injection of 1 × 10⁶ of B16F1 cells. Means are indicated as black bars. *p < 0.05 by Student's t test. (B) Representative images of lungs from WT or Irf5−/− mice 14 days after intravenous injection of 2 × 10⁶ of B16F1 cells. (C) In vitro killing assay of immune cells from WT or Irf5−/− mice against B16F1 cells. Whole splenocytes (left panel), purified NK cells (middle panel), or NK-depleted splenocytes (right panel) from WT or Irf5−/− mice are mixed with 51Cr-labeled target B16F1 cells at the indicated ratios. 4 hr later, 51Cr radioactivity released from target cells was monitored. E/T: effector/target cell ratio. (D) Purified NK cells (WT; 1 × 10⁵ cells) without or with 1 × 10⁵, 2 × 10⁵, or 4 × 10⁵ of WT splenic CD11c+, CD11b+, T, or B cells were subjected to in vitro killing assay for B16F1 cells. Target cell lysis was measured by co-culturing target cells and myeloid cells, with (total values) or without NK cells (background values), and background values were subtracted from the total values. Each background lysis was less than 6% of maximum release. The calculated percentage of cytotoxicity was represented as Net lysis (%). In all in vitro killing assays, 1 × 10⁴ of 51Cr-labeled B16F1 cells were used (C and D). All in vitro killing assays were performed at least three times with high reproducibility. Represented as means ± SD.
Figure 1—figure supplement 1
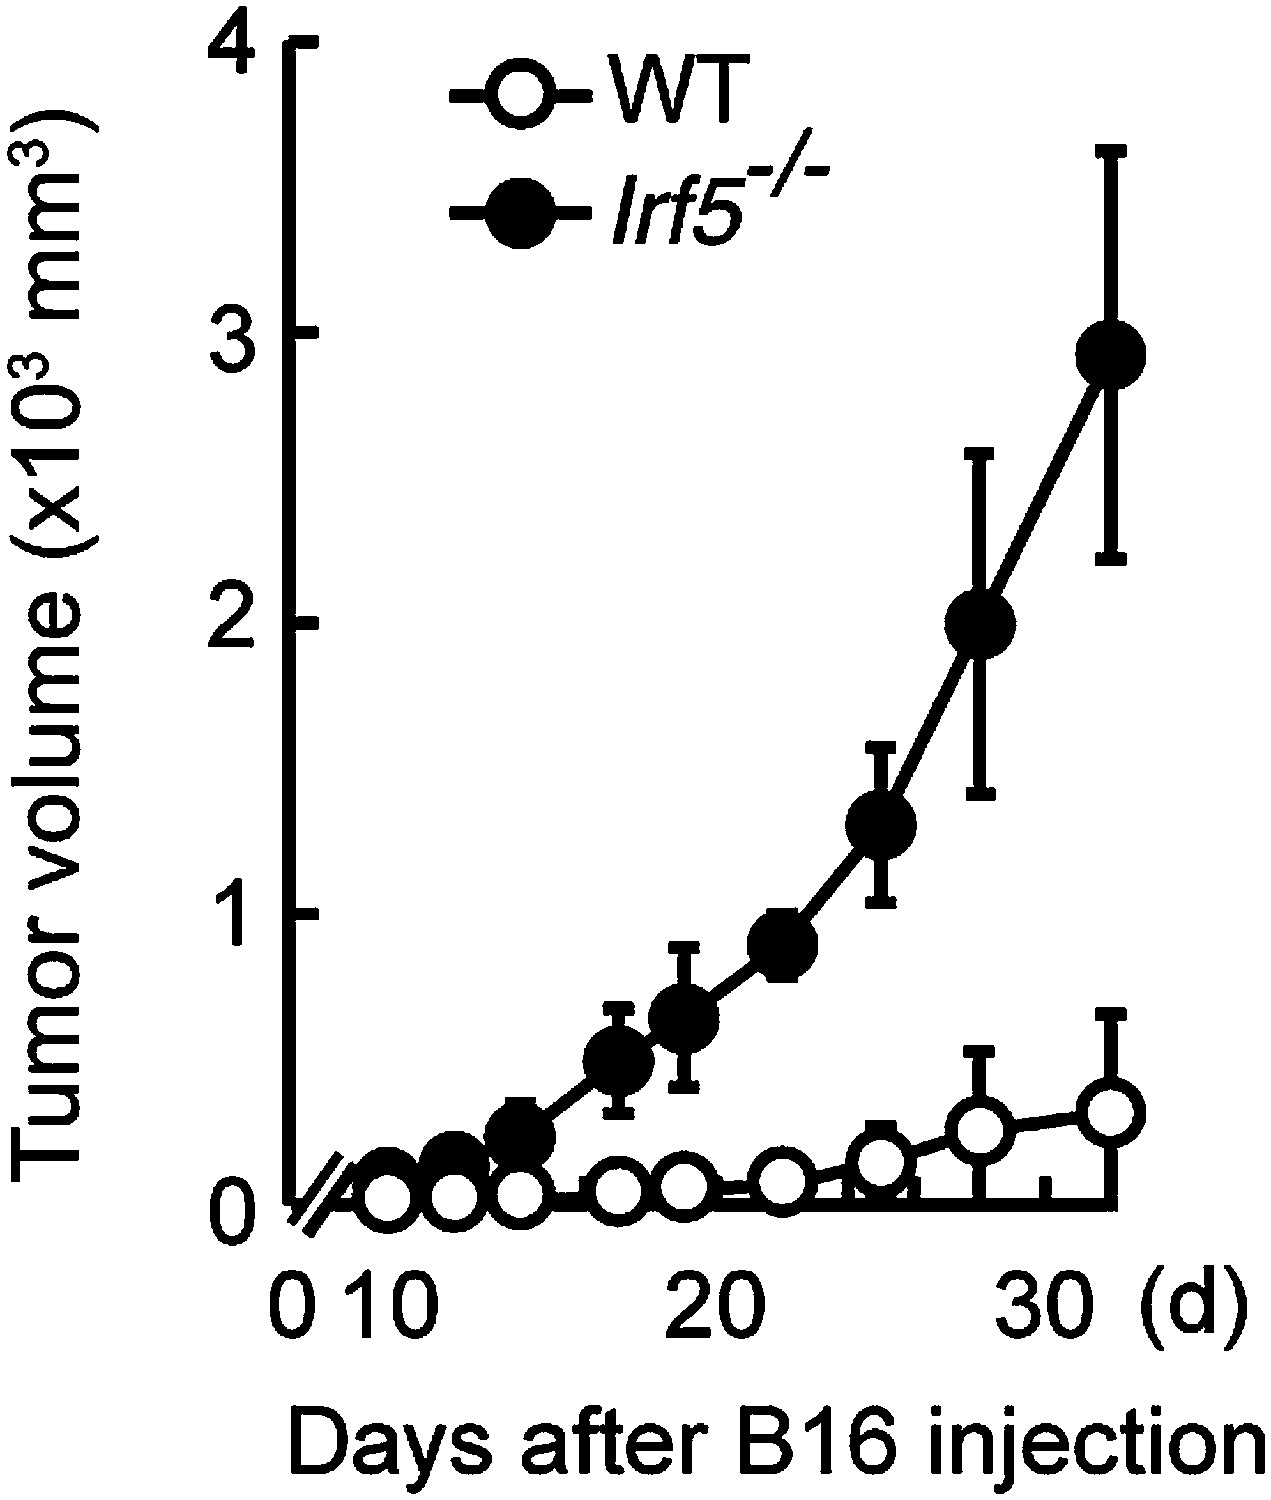
Critical role of IRF5 in the suppression of tumor growth.
Tumor growth in WT and Irf5−/− mice. Tumor volume of WT or Irf5−/− mice was monitored at the indicated days after subcutaneous injection of 1 × 10⁵ of B16F1 cells. Represented as means ± SD.
Figure 1—figure supplement 2
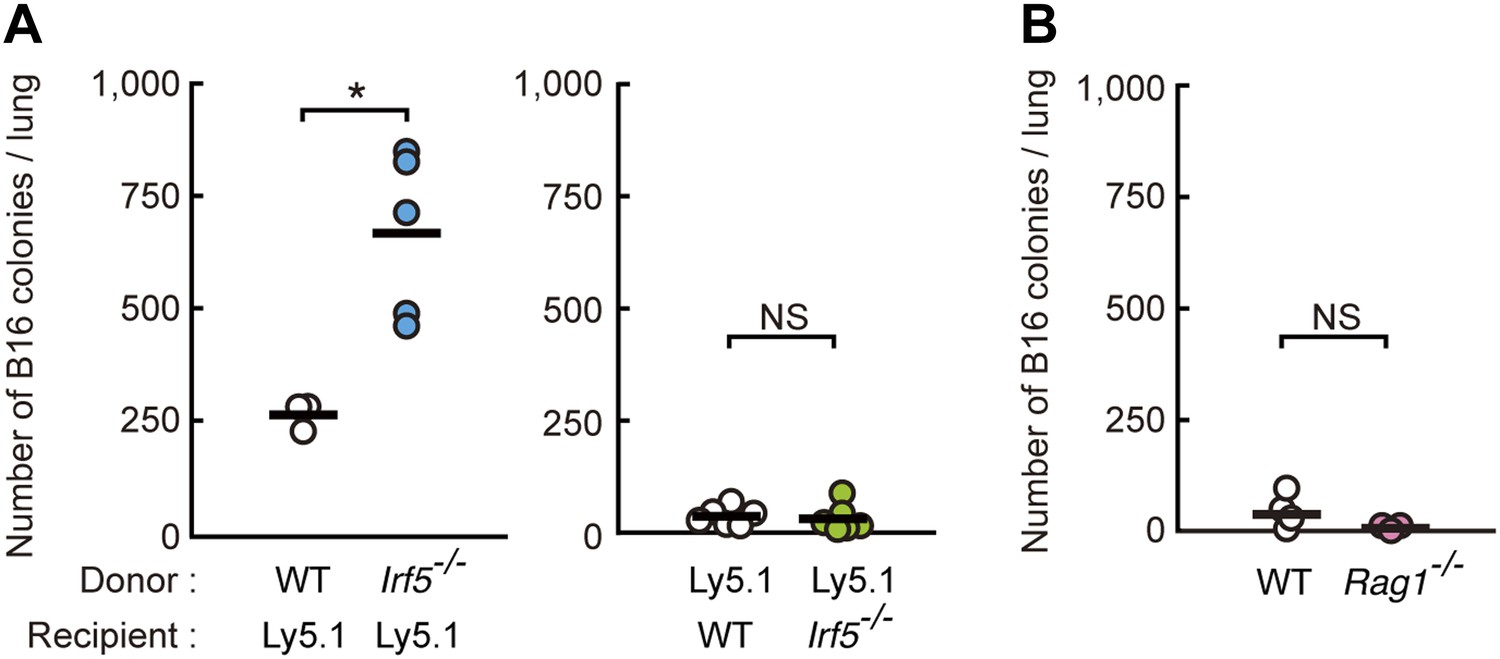
Requirement of IRF5 in myeloid cells for the suppression of tumor metastasis.
(A) Tumor metastasis in bone marrow chimera mice. Chimera mice were generated using WT, Irf5−/−, and C57BL/6-Ly5.1 (Ly5.1) mice. Numbers of metastasized colonies in lungs from the bone marrow chimera mice were counted 14 days after intravenous injection with 1 × 10⁶ of B16F1 cells. Means are indicated as black bars. *p < 0.05 by Student's t test. (B) Tumor metastasis in WT or Rag1−/− mice. Numbers of metastasized colonies in lungs from WT or Rag1−/− mice were counted 14 days after intravenous injection with 1 × 10⁶ of B16F1 cells. Means are indicated as black bars.
Figure 1—figure supplement 3
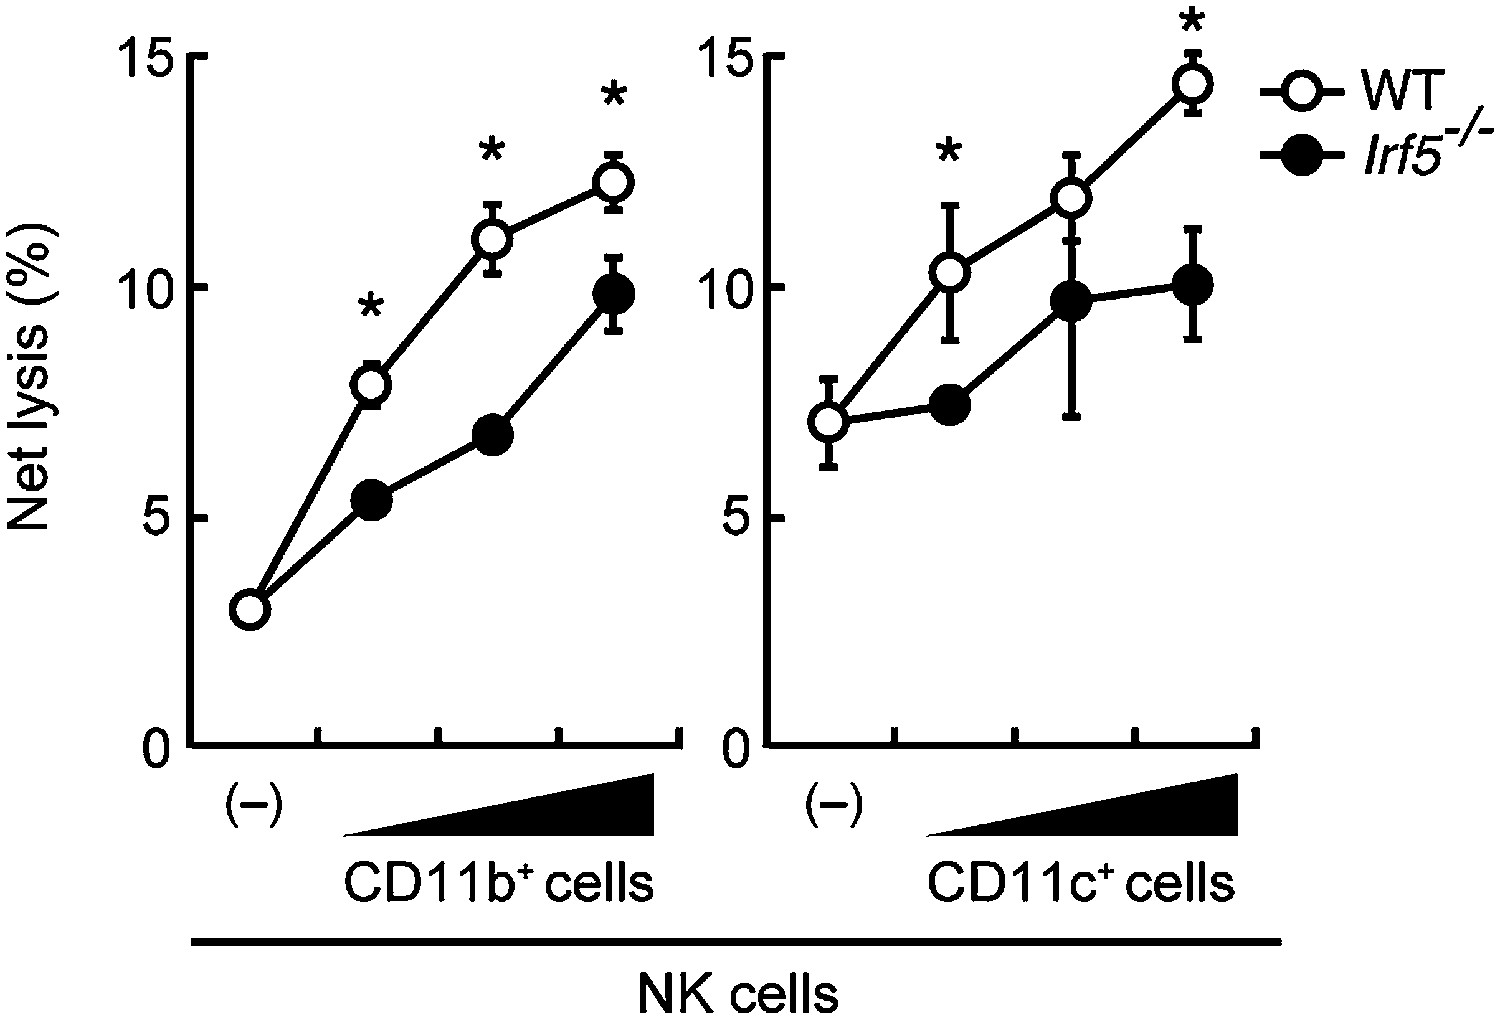
Involvement of IRF5 in CD11b+ and CD11c+ cells to the enhancement of NK cell-mediated anti-tumor responses.
Requirement of IRF5 in myeloid cells for the enhancement of NK cell's in vitro killing activity. In vitro killing activities of purified NK cells (WT; 1 × 10⁵ cells) against B16F1 cells were monitored in the absence or presence of 1 × 10⁵, 2 × 10⁵, or 4 × 10⁵ of WT or Irf5−/− splenic CD11b+ (left panel) or CD11c+ (right panel) cells. The percentage of cytotoxicity was calculated as described in the legend of Figure 1D and represented as Net lysis (%). Each background lysis was less than 6% of maximum release. Represented as means ± SD. *p < 0.05 by Student’s t test. In in vitro killing assays, 1 × 10⁴ of 51Cr-labeled B16F1 cells were used. All in vitro killing assays were performed at least three times and the results were highly reproducible.
Figure 1—figure supplement 4
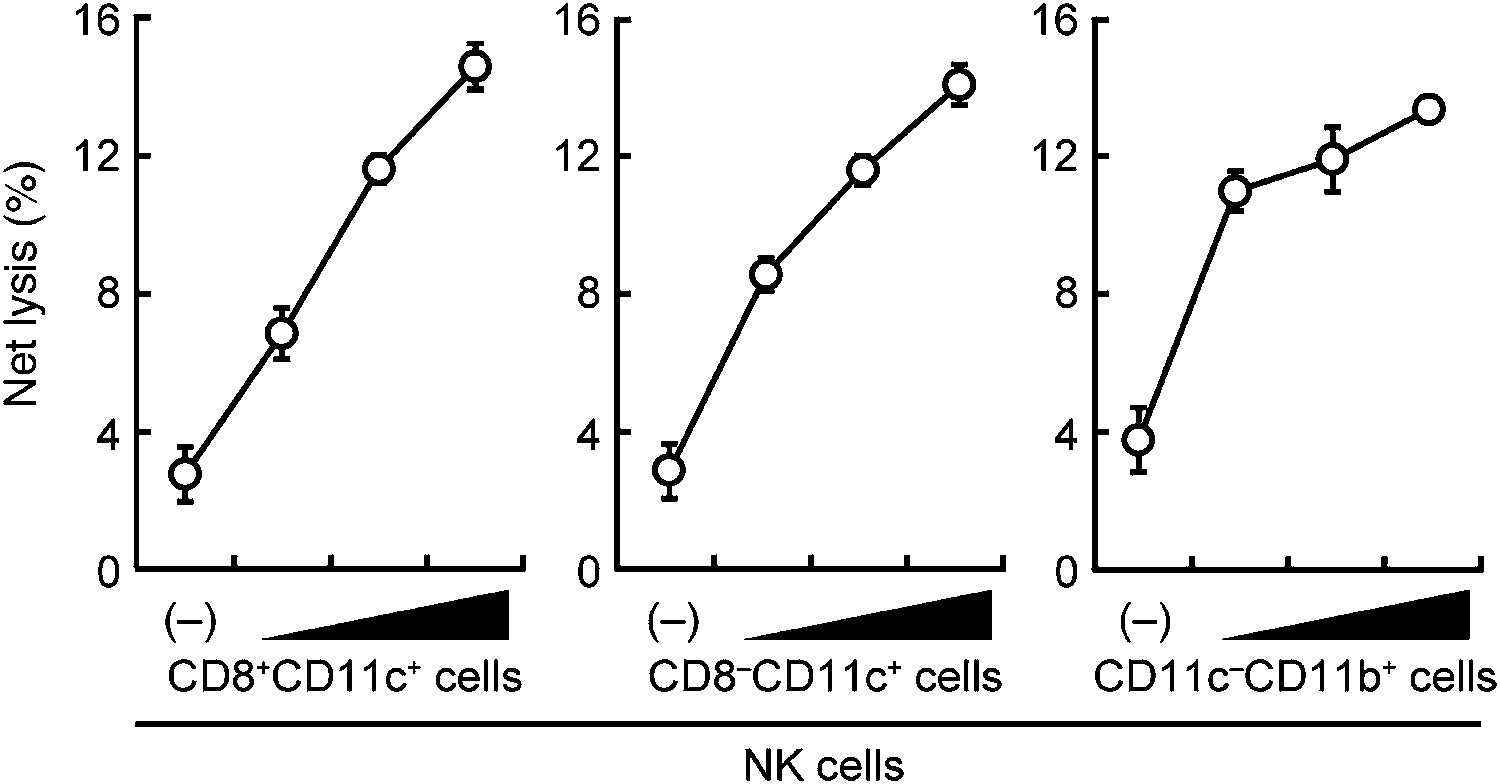
Contribution of DCs and macrophages to the NK cell-mediated tumor killing.
The effect of various myeloid cells on the enhancement of NK cell killing activities. In vitro killing activities of purified NK cells (WT; 1 × 10⁵ cells) were monitored in the absence or presence of 1 × 10⁵, 2 × 10⁵, or 4 × 10⁵ of splenic CD8+CD11c+ (left panel), CD8–CD11c+ (middle panel), or CD11c−CD11b+ (right panel) cells. CD11c−CD11b+ cells were purified from diphtheria toxin-treated CD11c-DTR mice. The percentage of cytotoxicity was calculated as described in the legend of Figure 1D and represented as Net lysis (%). Each background lysis was less than 5% of maximum release. Represented as means ± SD. 1 × 10⁴ of 51Cr-labeled B16F1 cells were used as target cells. All in vitro killing assays were performed at least three times and the results were highly reproducible.
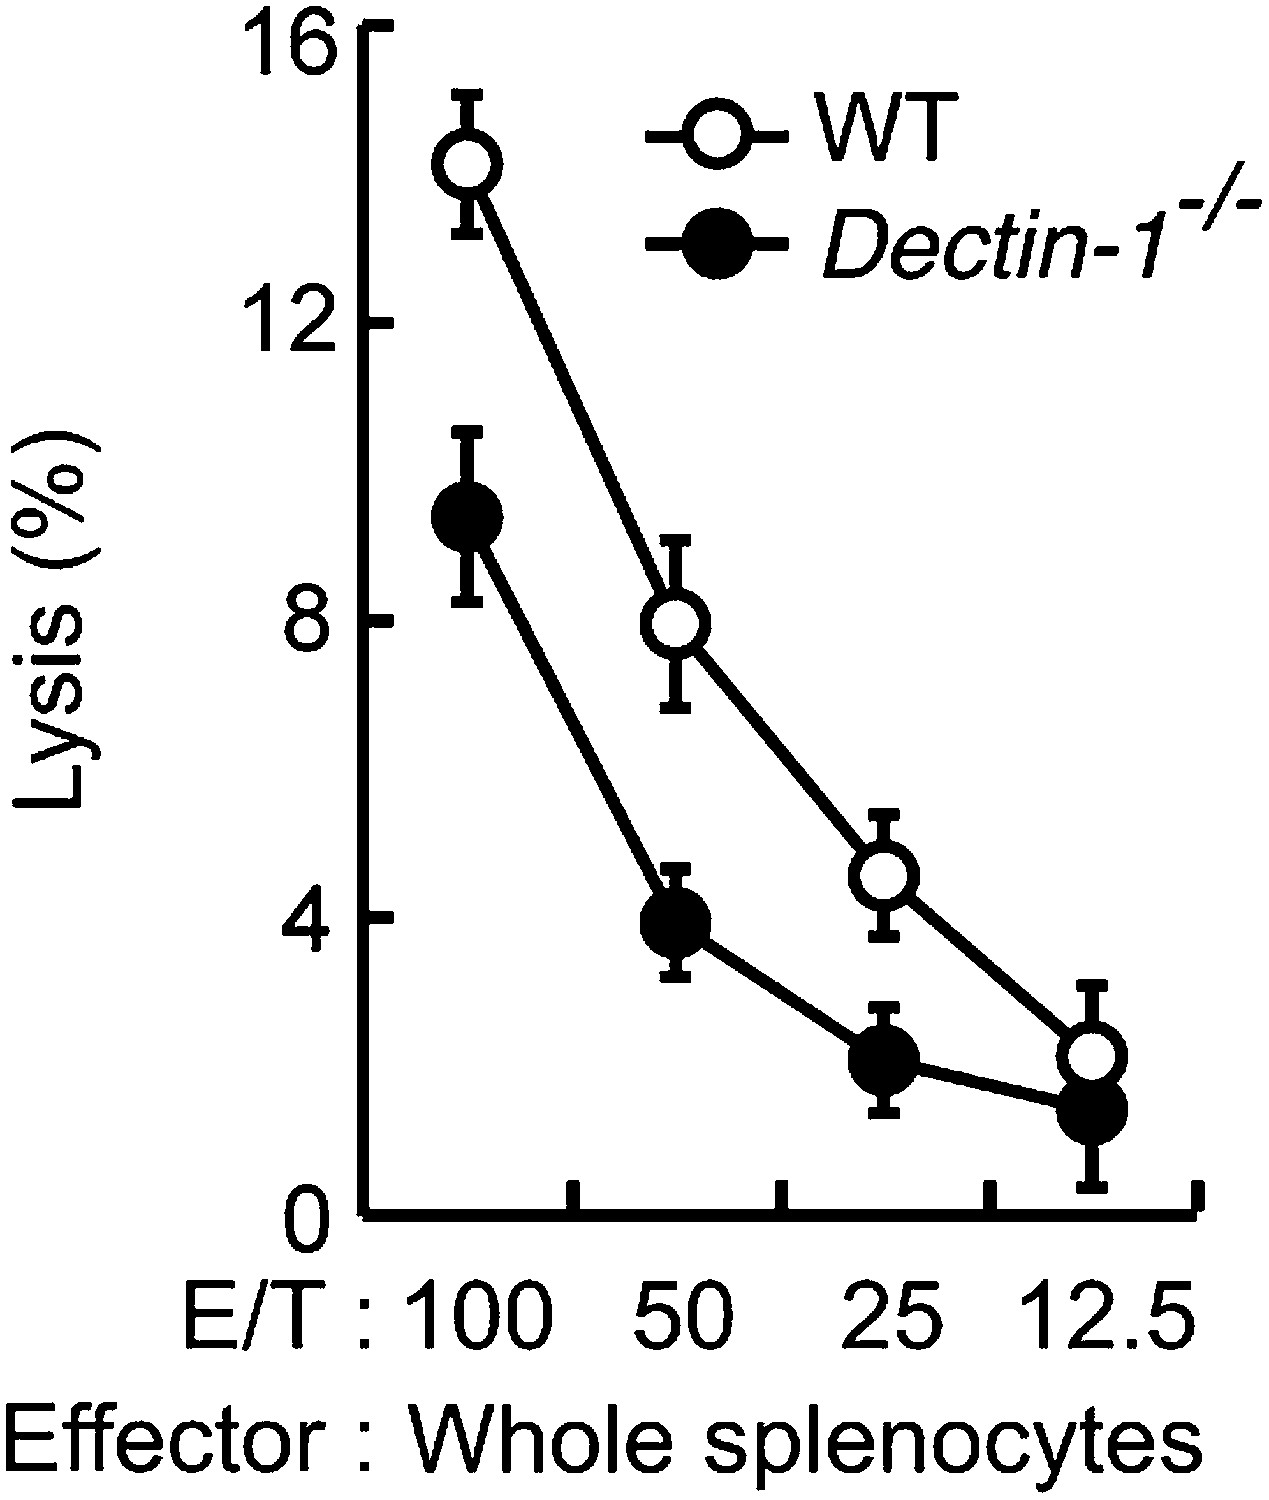
Figure 2 with 8 supplements
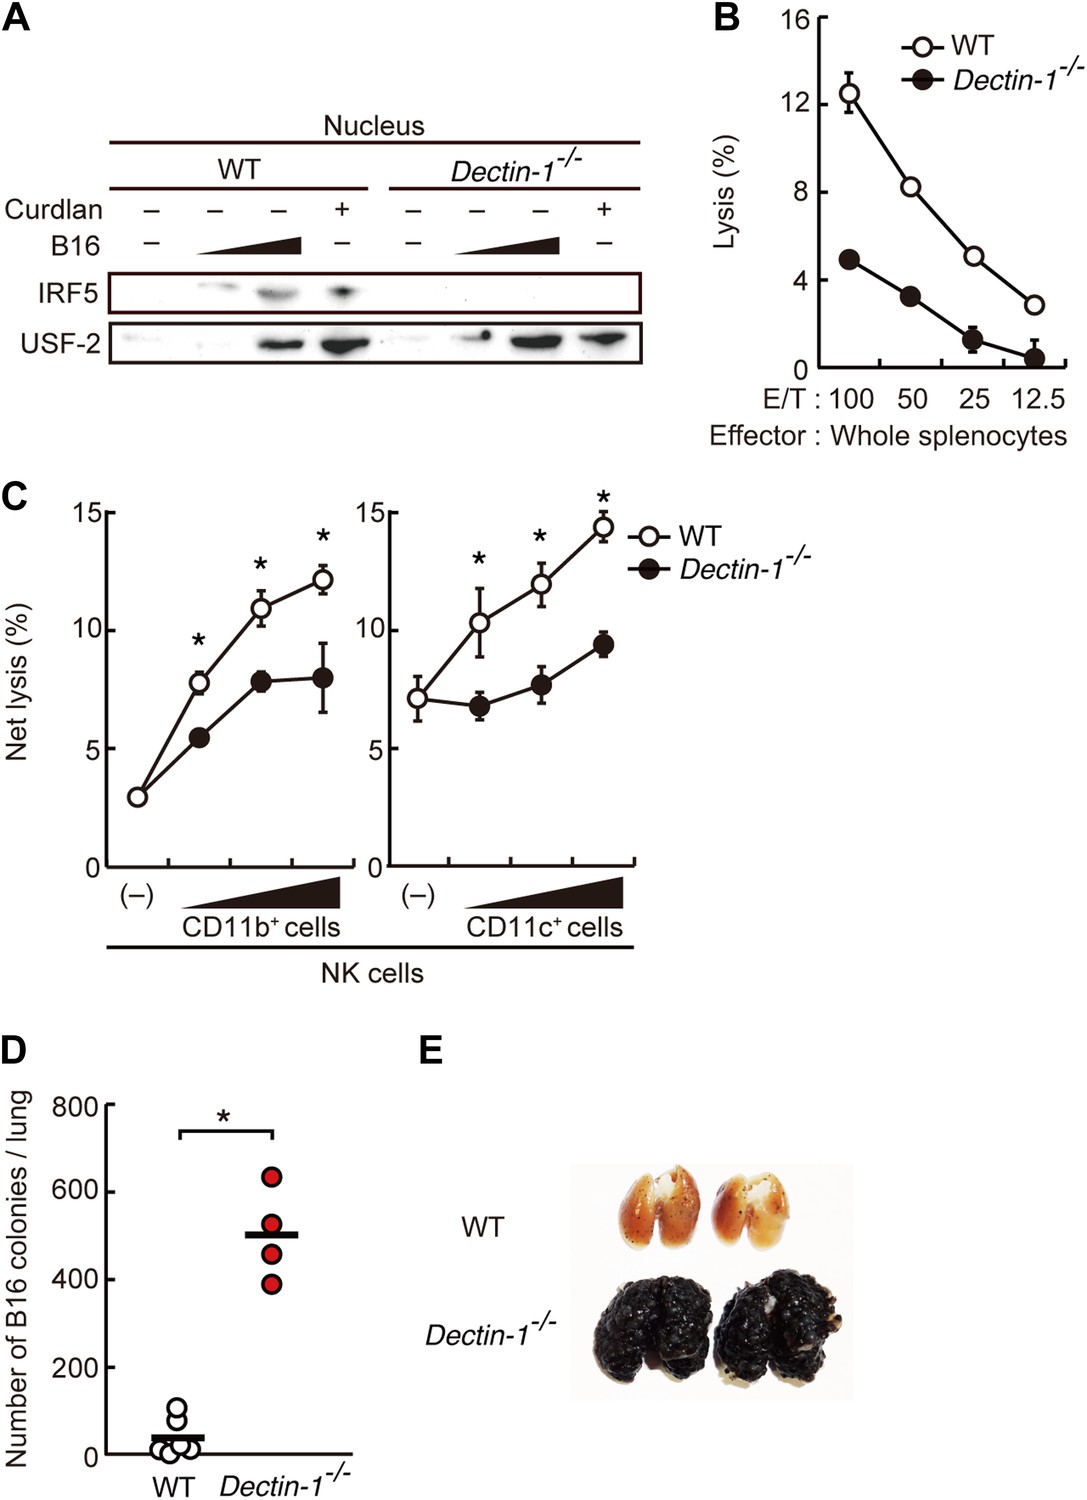
Critical role of Dectin-1 signaling in DCs and macrophages for IRF5 activation by and NK cell-mediated killing against B16F1 cells.
(A) Nuclear translocation of IRF5 in WT or Dectin-1−/− splenocytes (5 × 10⁷ cells) co-incubated with B16F1 cells (5 × 10⁵ or 1 × 10⁶ cells) or stimulated with curdlan (30 µg/ml) for 6 hr. Nuclear protein fraction from the culture was analyzed by immunoblotting for IRF5 and USF-2. USF-2 was used as a nuclear marker protein. (B) In vitro killing activity of whole splenocytes from WT or Dectin-1−/− mice against B16F1 cells. (C) In vitro killing activity of purified NK cells (WT; 1 × 10⁵ cells) against B16F1 cells was assessed in the absence or presence of 1 × 10⁵, 2 × 10⁵, or 4 × 10⁵ of WT or Dectin-1−/− splenic CD11b+ (left panel) or CD11c+ (right panel) cells. The percentage of cytotoxicity was calculated as noted in the legend of Figure 1D and represented as Net lysis (%). Each background lysis was less than 6% of maximum release. In all in vitro killing assays, 1 × 10⁴ of 51Cr-labeled B16F1 cells were used (B and C). All in vitro killing assays were performed at least three times with high reproducibility. Represented as means ± SD. *p < 0.05 by Student's t test. Of note, we could not found mRNA induction for typical inflammatory and cytotoxic mediators in the co-culture system, wherein the ratio of B16F1 cells, DCs, and NK cells is 1:30:10 (Figure 2—figure supplement 8). As such, from these analyses, it seems unlikely that Dectin-1 signaling in DCs affects the expression of these molecules in NK cells. (D) Number of metastasized colonies in lungs from WT or Dectin-1−/− mice intravenously injected with 1 × 10⁶ of B16F1 cells. Means are indicated as black bars. *p < 0.05 by Student's t test. (E) Representative images of lungs from WT or Dectin-1−/− mice 14 days after intravenous injection of 2 × 10⁶ of B16F1 cells.
Figure 2—figure supplement 1

Dispensable role of MyD88 in anti-tumor killing activity of NK cells.
In vitro killing activity of WT or Myd88−/− splenocytes against B16F1 cells. Represented as means ± SD. E/T: effector/target cell ratio. In in vitro killing assays, 1 × 10⁴ of 51Cr-labeled B16F1 cells were used. In vitro killing assays were performed at least three times, and the results were highly reproducible.
Figure 2—figure supplement 2
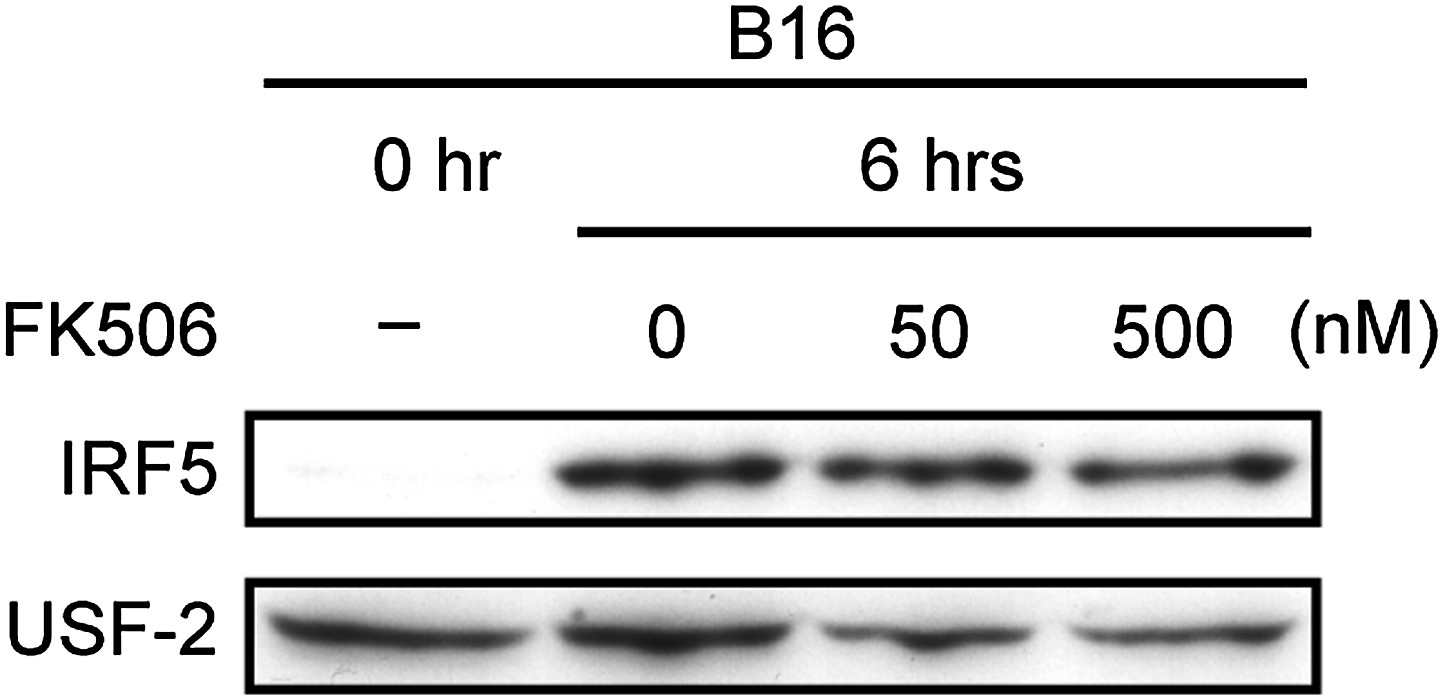
Effect of FK506 treatment on IRF5 activation in splenocytes.
Nuclear translocation of IRF5 of WT splenocytes (5 × 10⁷ cells) co-incubated with B16F1 cells (1 × 10⁶ cells) for 6 hr in the absence or presence of 50 or 500 nM of FK506. Nuclear protein extracts from the culture were analyzed by immunoblotting for IRF5 and USF-2.
Figure 2—figure supplement 3
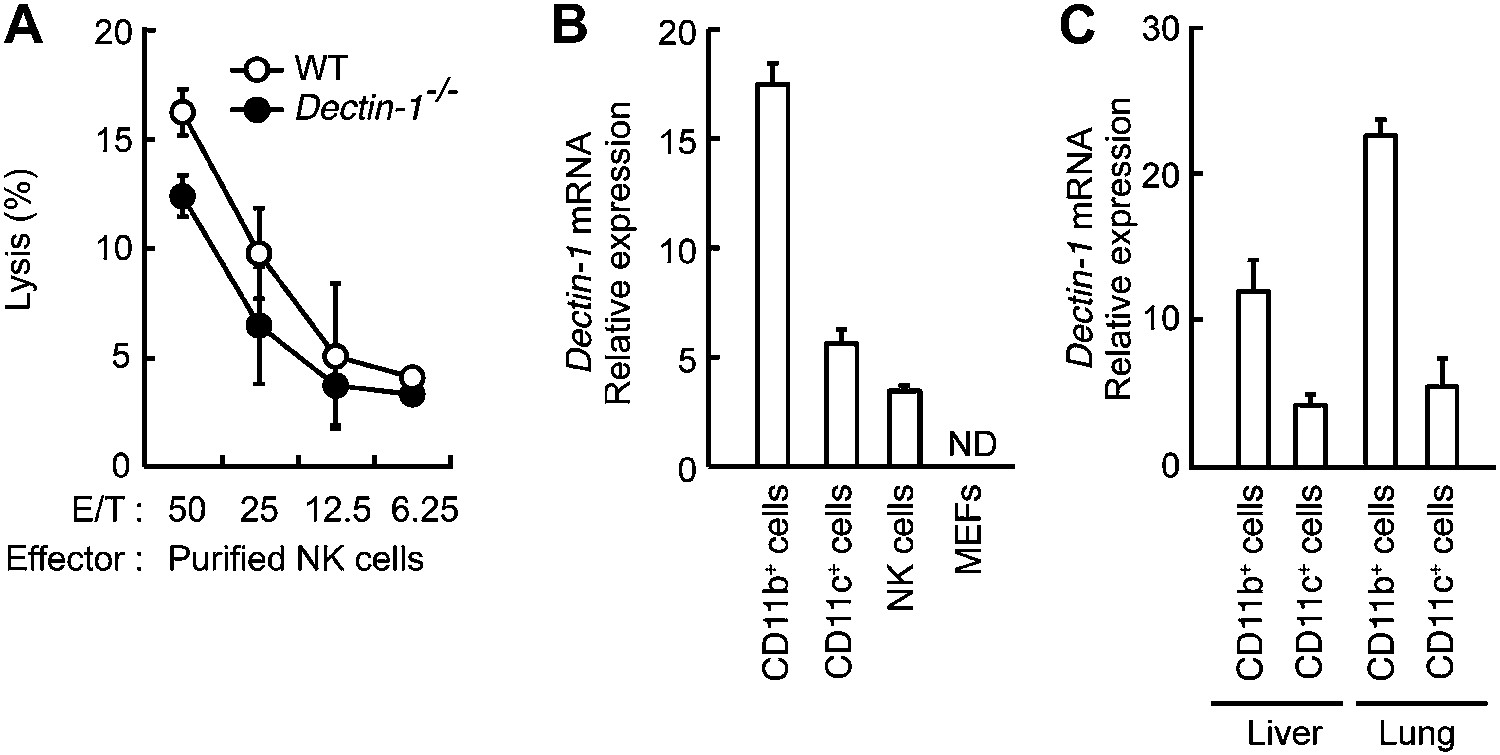
Minor effects of Dectin-1 expressed in NK cells on the tumor killing activity.
(A) In vitro killing activity of purified NK cells from WT or Dectin-1−/− mice against B16F1 cells. Represented as means ± SD. E/T: effector/target cell ratio. In in vitro killing assays, 1 × 10⁴ of 51Cr-labeled B16F1 cells were used. In vitro killing assays were performed at least three times, and the results were highly reproducible. (B) qRT-PCR analysis of Dectin-1 mRNA in WT splenic CD11b+ cells, CD11c+ cells and NK cells, and MEFs. Results are presented as relative to the expression of Gapdh mRNA. Represented as means ± SD. ND, none detected. (C) Expression levels of Dectin-1 mRNA in myeloid cells from liver and lungs. CD11b+F4/80+ cells and CD11c+ cells from liver and lung were isolated by cell sorting. Results are presented as relative to the expression of Gapdh mRNA. Represented as means ± SD.
Figure 2—figure supplement 4
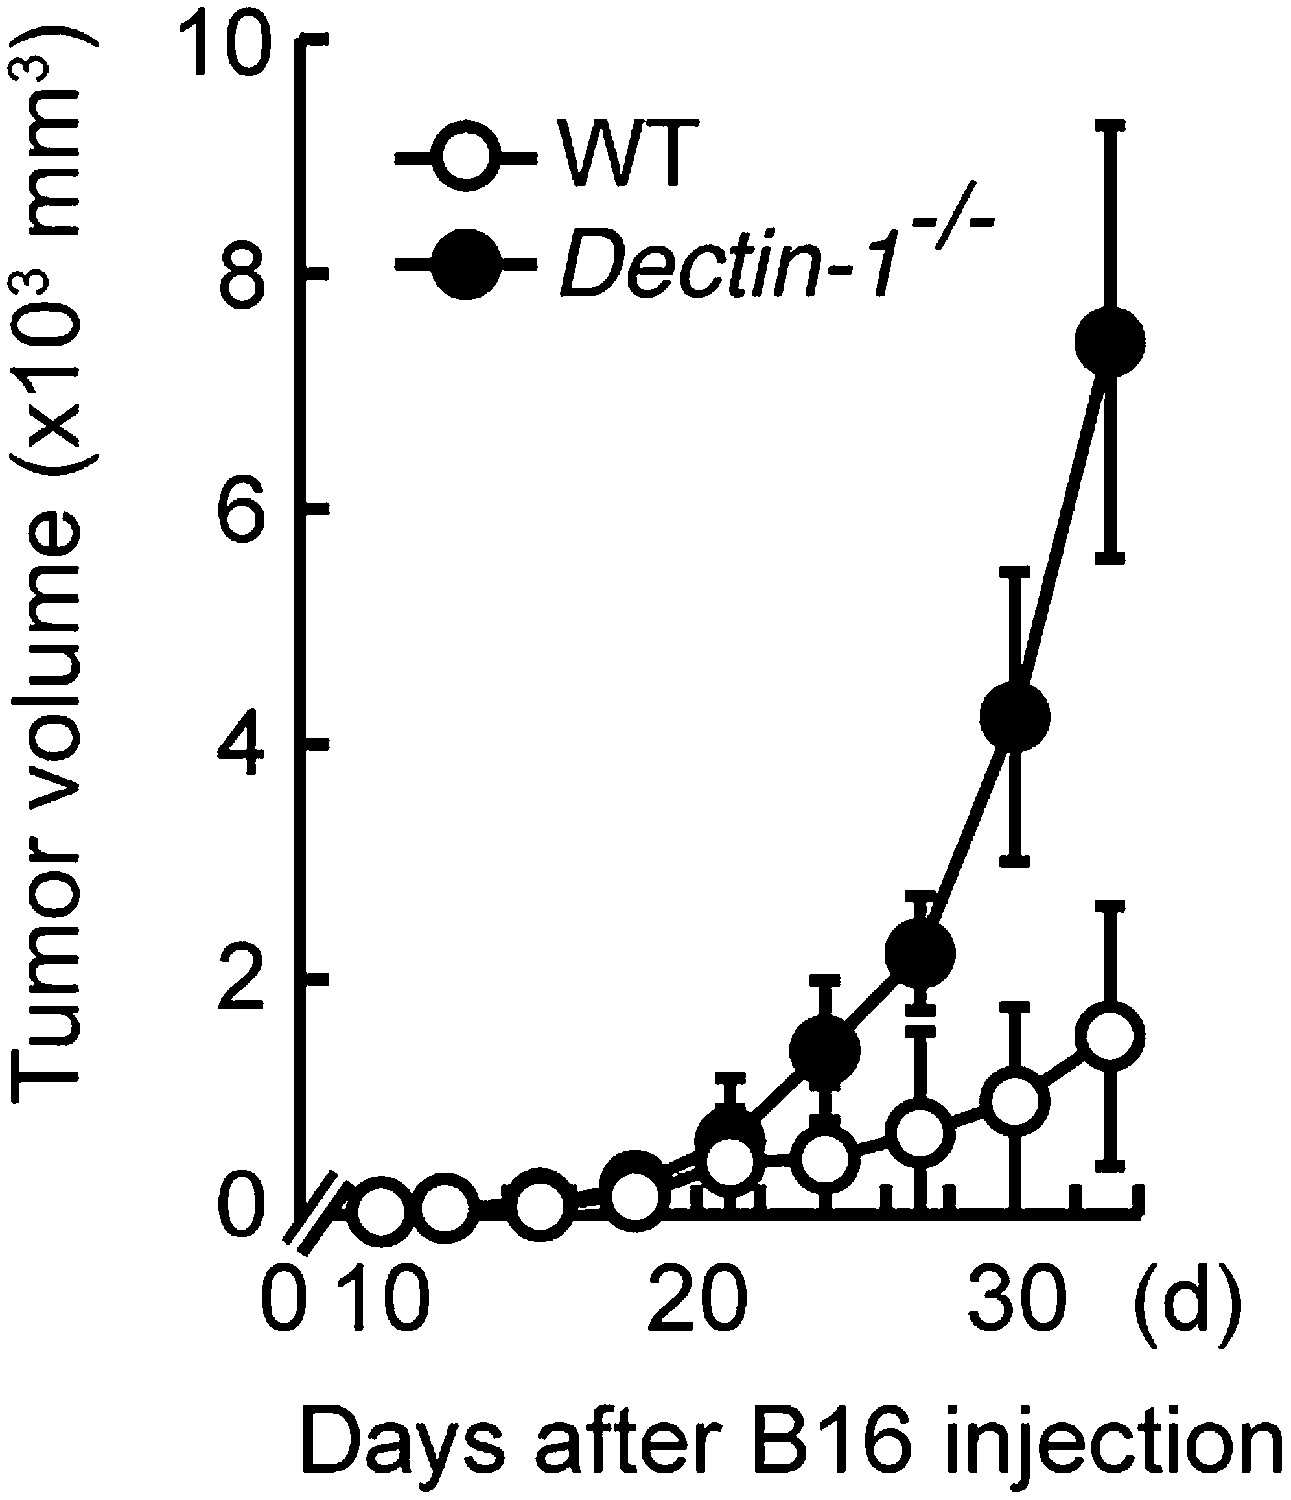
Essential role of Dectin-1 in the suppression of tumor growth.
Tumor growth in WT and Dectin-1−/− mice. Tumor volume of WT or Dectin-1−/− mice was monitored at the indicated days after subcutaneous injection of 1 × 10⁵ of B16F1 cells. Represented as means ± SD.
Figure 2—figure supplement 5
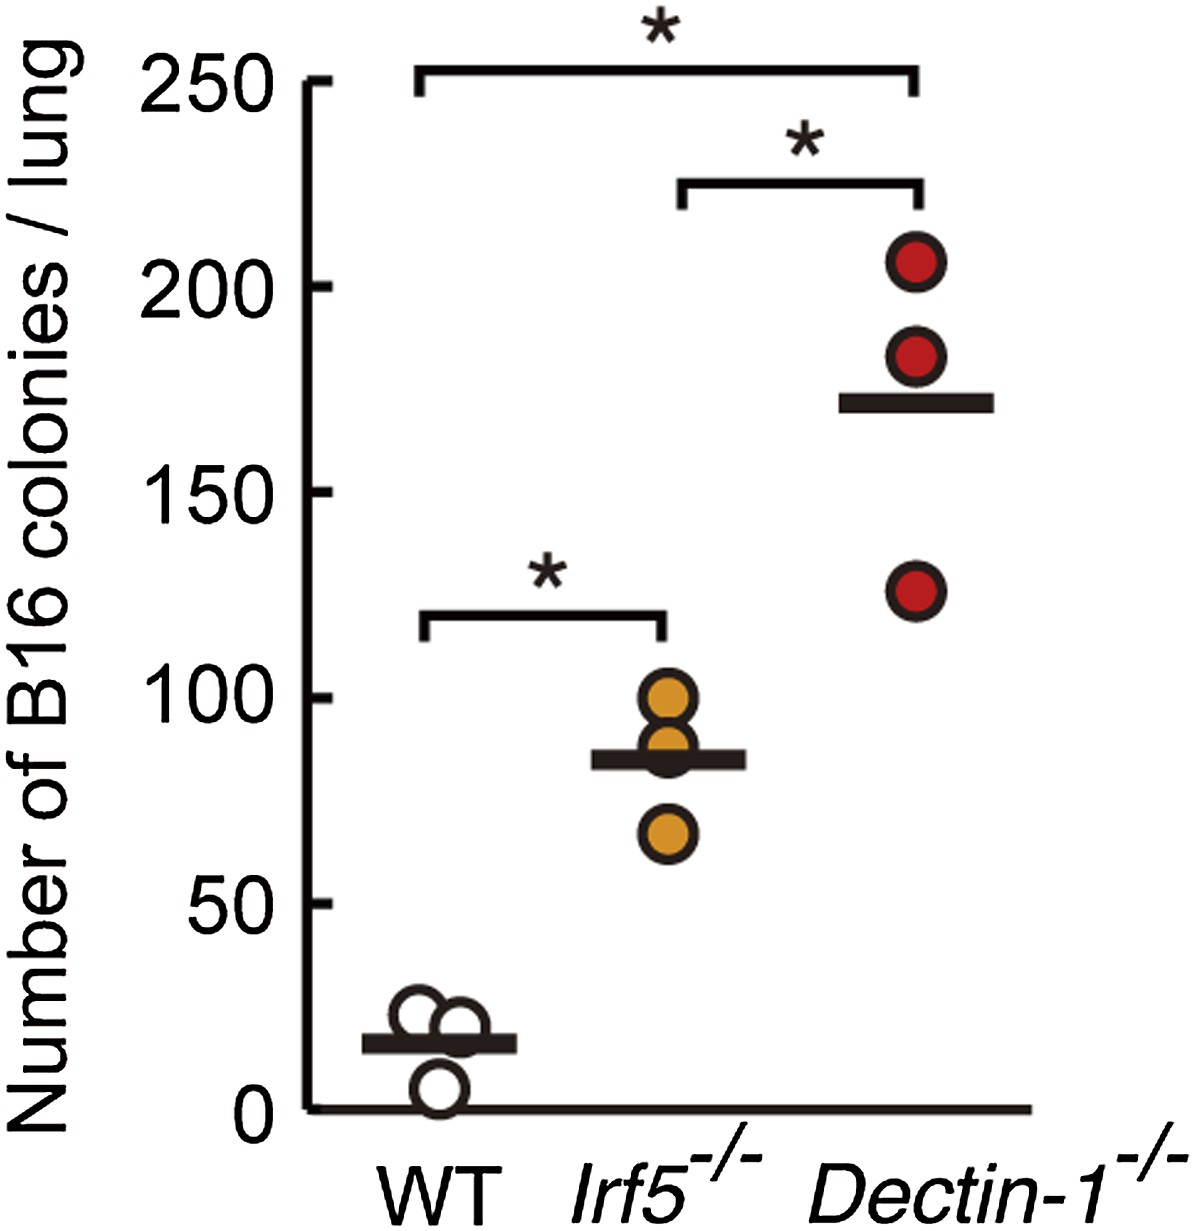
Contribution of Dectin-1 and IRF5 to the control of tumor metastasis.
Number of metastasized colonies in the lungs from WT, Irf5−/−, or Dectin-1−/− mice. Mice were intravenously injected with 1 × 10⁶ of B16F1 cells and, 14 days later, the number of metastasized colonies in lungs was measured. Means are indicated as black bars. *p < 0.05 (WT vs Irf5−/−, WT vs Dectin-1−/−, Irf5−/− vs Dectin-1−/−) by Student's t test.
Figure 2—figure supplement 6

Dispensable role of Dectin-1 in NK-cell-independent tumor suppression.
NK-depleted WT, or NK-depleted Dectin-1−/− mice were intravenously injected with 1 × 10⁶ of B16F1 cells. After 14 days, the numbers of metastasized colonies were counted in the lungs of each mouse. This result suggests that NK cells are indeed the effector cells and that Dectin-1 signaling in DCs and macrophages contributes to NK cell-mediated tumor killing. Means are indicated as black bars. NS, not significant.
Figure 2—figure supplement 7

Normal population and functions of Dectin-1-deficient NK cells.
(A) The population of splenic NK cells in Dectin-1−/− mice. Splenocytes were isolated from WT and Dectin-1−/− mice. The NK cell population (percentage of total cells) was then analyzed by flow cytometry using anti-DX5 and anti-CD3ε antibodies. Represented as means ± SD. NS, not significant. (B) IL12-induced IFN-γ production in NK cells. Purified NK cells (WT or Dectin-1−/−; 5 × 10⁴ cells) were stimulated with 10 or 100 ng/ml of IL12. IFN-γ levels in the cultured supernatants were measured by ELISA 24 hr after IL12 stimulation. Represented as means ± SD. NS, not significant. ND, none detected. (C) Viral loads in the spleens of WT and Dectin-1−/− mice after MCMV infection. WT, Dectin-1−/−, and NK-depleted WT mice were intraperitoneally infected with MCMV (5 × 10³ pfu). Mice were sacrificed 3 days after infection and MCMV titers were then examined by plaque forming assay. Means are indicated as black bars; NS, not significant. (D) Survival of the WT (n = 4), Dectin-1−/− (n = 4), and NK-depleted WT mice (n = 4) after MCMV infection. Mice were intraperitoneally infected with MCMV (3 × 10⁵ pfu) and their survival was monitored at the indicated periods.
Figure 2—figure supplement 8

Expression levels of cytotoxic mediators and inflammatory cytokines in co-culture system.
NK cells (WT; 1 × 10⁵ cells) and WT or Dectin-1−/− splenic CD11c+ cells (3 × 10⁵ cells) were co-cultured with B16F1 cells (1 × 10⁴ cells). Total RNA was isolated at time zero and 4 hr after the co-culture and then mRNA expression levels for Granzyme B (Gzmb), Perforin-1 (Prf1), IFN-γ (Ifng), IL-6 (Il6), and TNF-α (Tnf) were analyzed by qRT-PCR analysis. Results are presented relative to the expression of Gapdh mRNA. Represented as means ± SD.
Figure 3 with 6 supplements
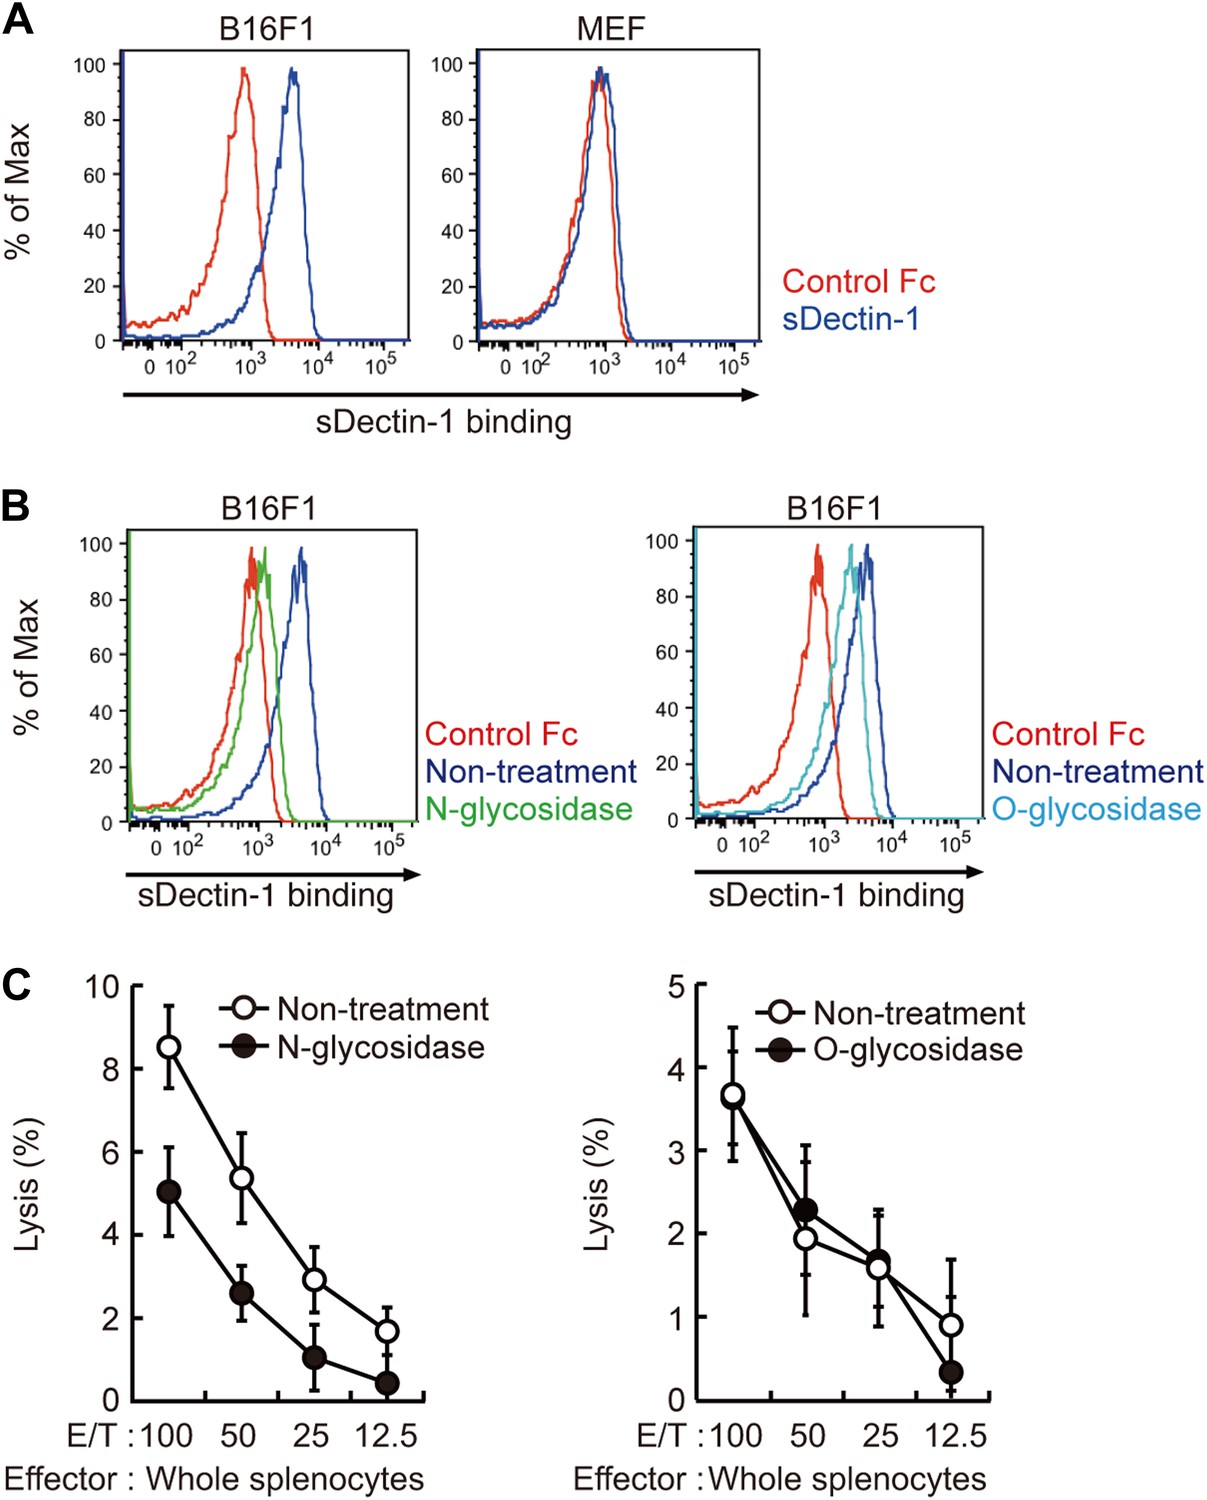
Recognition of N-glycan structures on B16F1 cells by Dectin-1 and its requirement for the enhancement of NK cell-mediated killing activity.
(A) Binding of sDectin-1 to B16F1 cells (left panel) and primary mouse embryonic fibroblasts (MEFs; right panel). The cells (4 × 10⁵ cells) were incubated with human IgG1 Fc (control Fc) or sDectin-1 (fused with the Fc) for flow cytometric analysis. (B) Effect of N-glycosidase treatment (left panel) or O-glycosidase in combination with neuraminidase (right panel) on the sDectin-1 binding to B16F1 cells. The cells (4 × 10⁵ cells) were treated with either N-glycosidase (25 U/ml) or O-glycosidase (25 mU/ml) with neuraminidase (250 mU/ml) for 1 hr and then subjected to the sDectin-1 binding assay. These enzymatic reactions were performed under the conditions wherein these cells remain alive. (C) The effect of N-glycosidase or O-glycosidase treatment of B16F1 cells on in vitro killing activity of WT splenocytes. B16F1 cells were treated with or without N-glycosidase (25 U/ml) for 1 hr in RPMI medium (left panel) or treated with or without the combination of O-glycosidase (25 mU/ml) and neuraminidase (125 mU/ml) for 1 hr in RPMI medium (right panel) and then subjected to in vitro killing assay. 51Cr radioactivity released from target cells was measured. Represented as means ± SD. E/T: effector/target cell ratio. In in vitro killing assays, 1 × 10⁴ of 51Cr-labeled B16F1 cells were used.
Figure 3—figure supplement 1
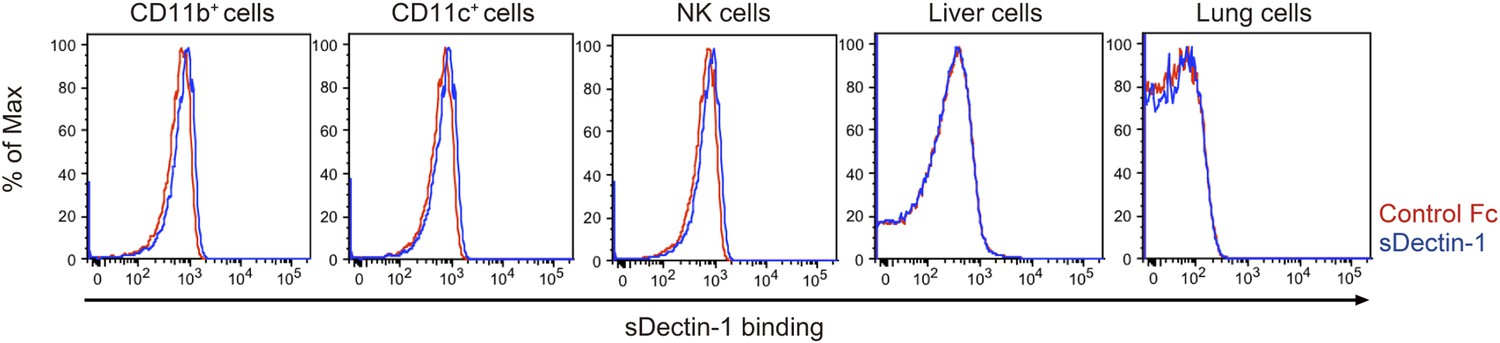
Binding of sDectin-1 to various mouse primary cells.
The sDectin-1 binding to splenic CD11b+ cells, CD11c+ cells, NK cells, liver cells, or lung cells were examined as described in Figure 3A.
Figure 3—figure supplement 2
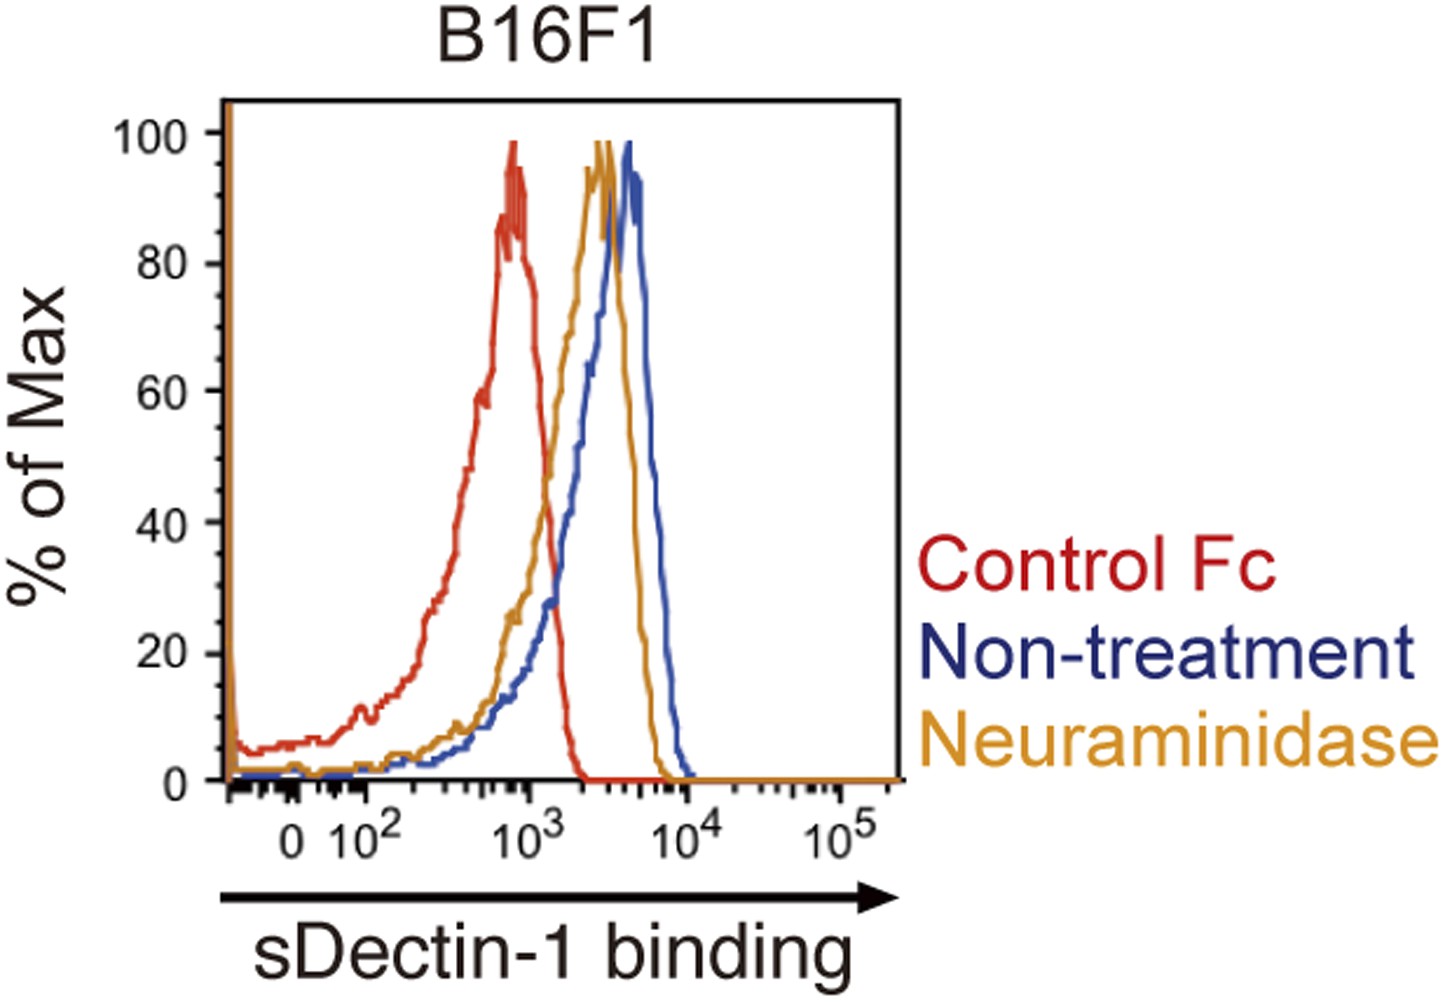
Effect of neuraminidase treatment on the sDectin-1 binding to B16F1 cells.
B16F1 cells (4 × 10⁵ cells) were treated with or without neuraminidase (250 mU/ml) for 1 hr and then subjected to the sDectin-1 binding assay.
Figure 3—figure supplement 3

Effect of N-glycosidase treatment of B16F1 cells on in vitro killing activity of purified NK cells.
B16F1 cells were treated with or without N-glycosidase (25 U/ml) for 1 hr in RPMI medium and then used as target cells for in vitro killing assay with purified NK cells from WT mice. 51Cr radioactivity released from the target cells was measured. Represented as means ± SD. E/T: effector/target cell ratio. In in vitro killing assays, 1 × 10⁴ of 51Cr-labeled B16F1 cells were used.
Figure 3—figure supplement 4
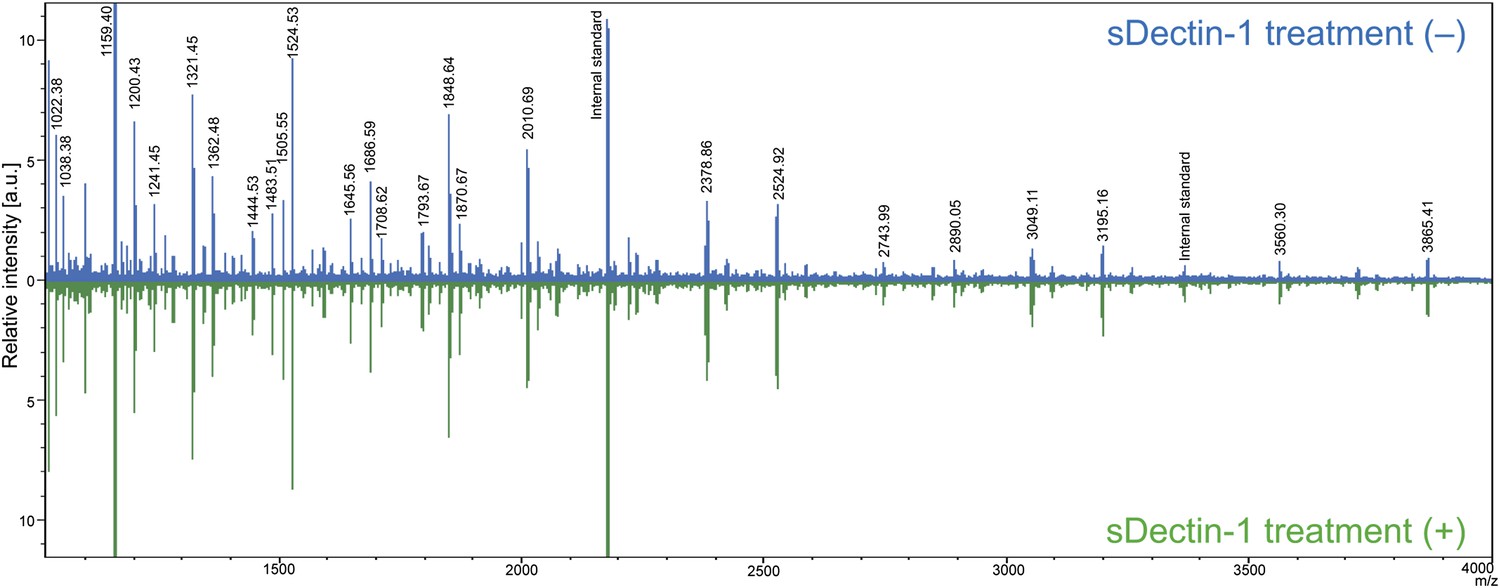
Mass spectrometric analysis of N-glycosidase-treated B16F1 cells.
The supernatant of B16F1 cells treated with N-glycosidase for 1 hr was collected and incubated with protein G-conjugated sepharose bound without (blue peaks) or with (green peaks) sDectin-1. N-glycans remained in the supernatant was then analyzed by mass spectrometry. The intensities of the spectra were normalized to that of glycan corresponding to the peak (m/z; 1159.40).
Figure 3—figure supplement 5
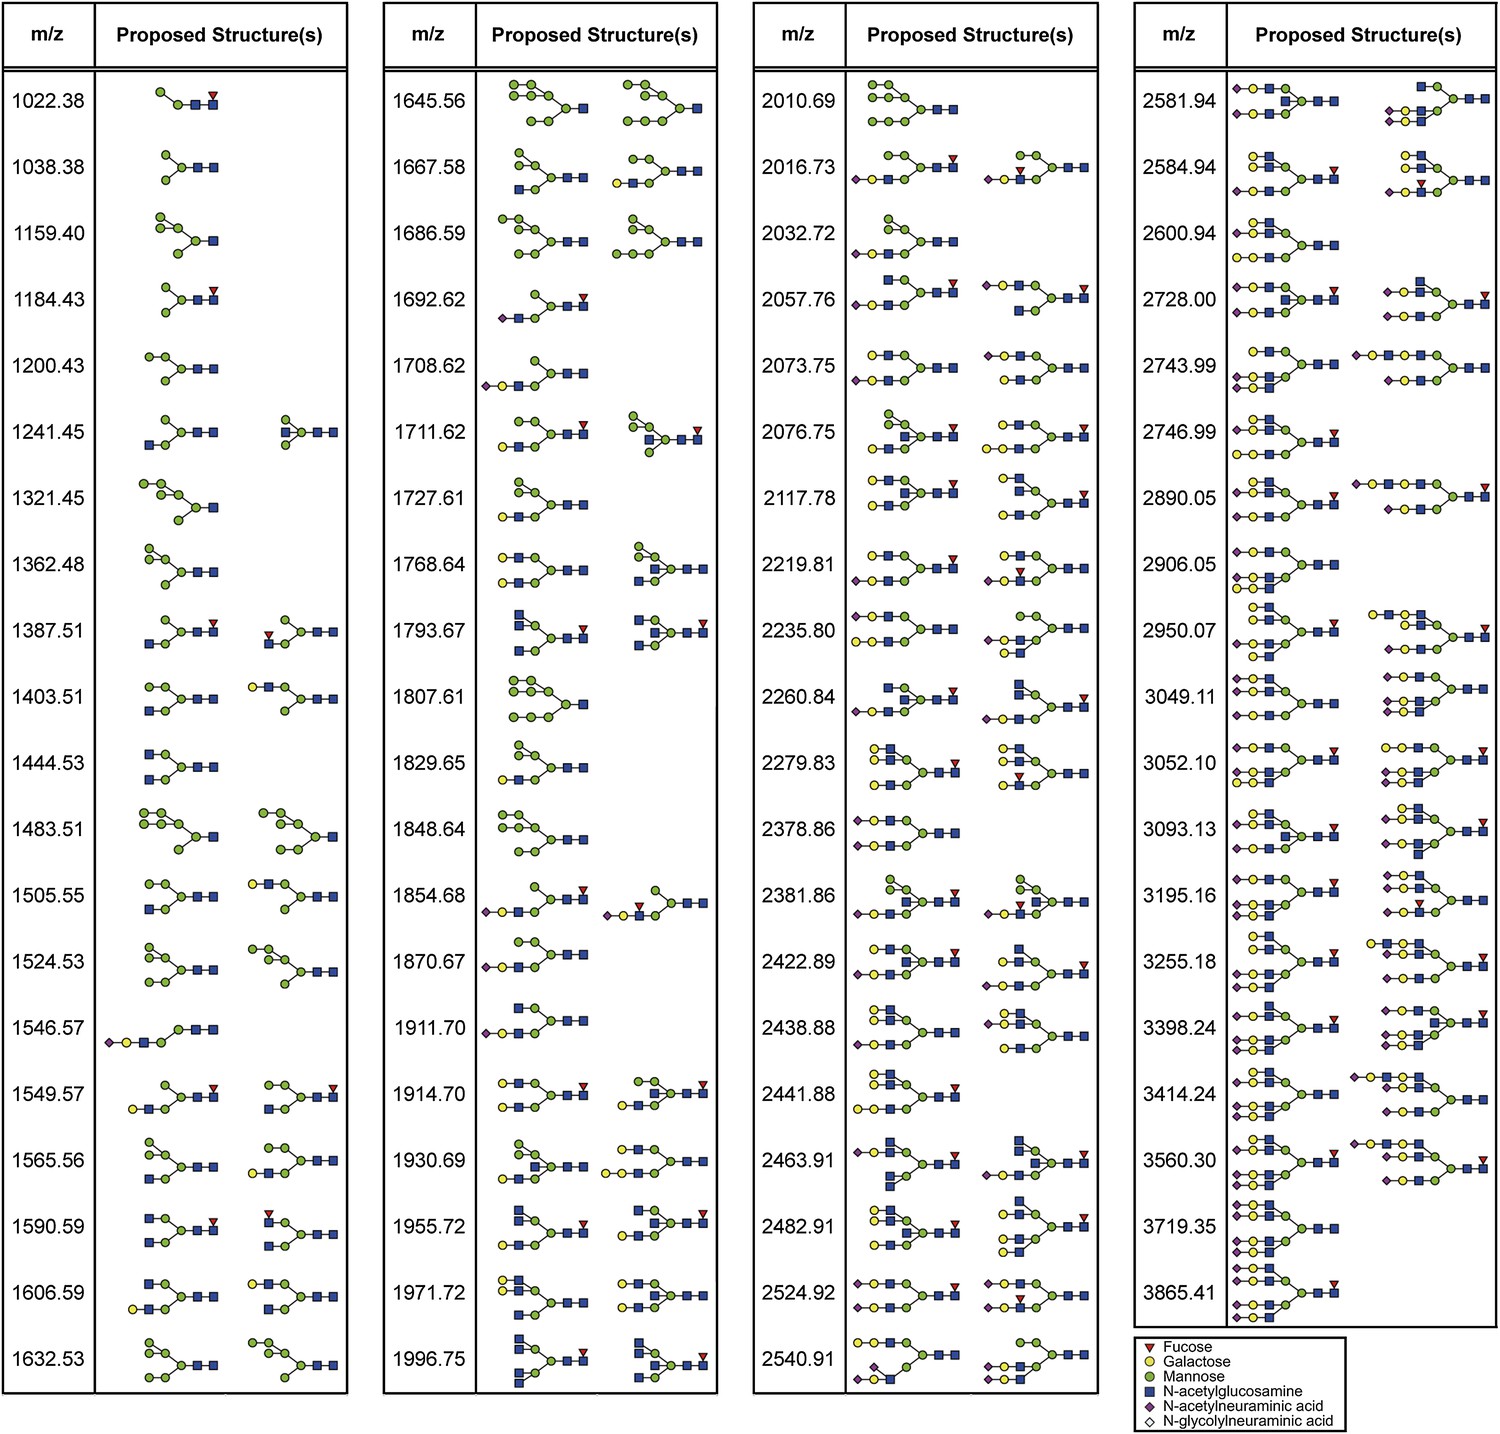
Proposed N-glycan structures detected by mass spectrometric analysis.
Proposed structures of N-glycans detected by the mass spectrometric analysis (Figure 3—figure supplement 4) are depicted.
Figure 3—figure supplement 6
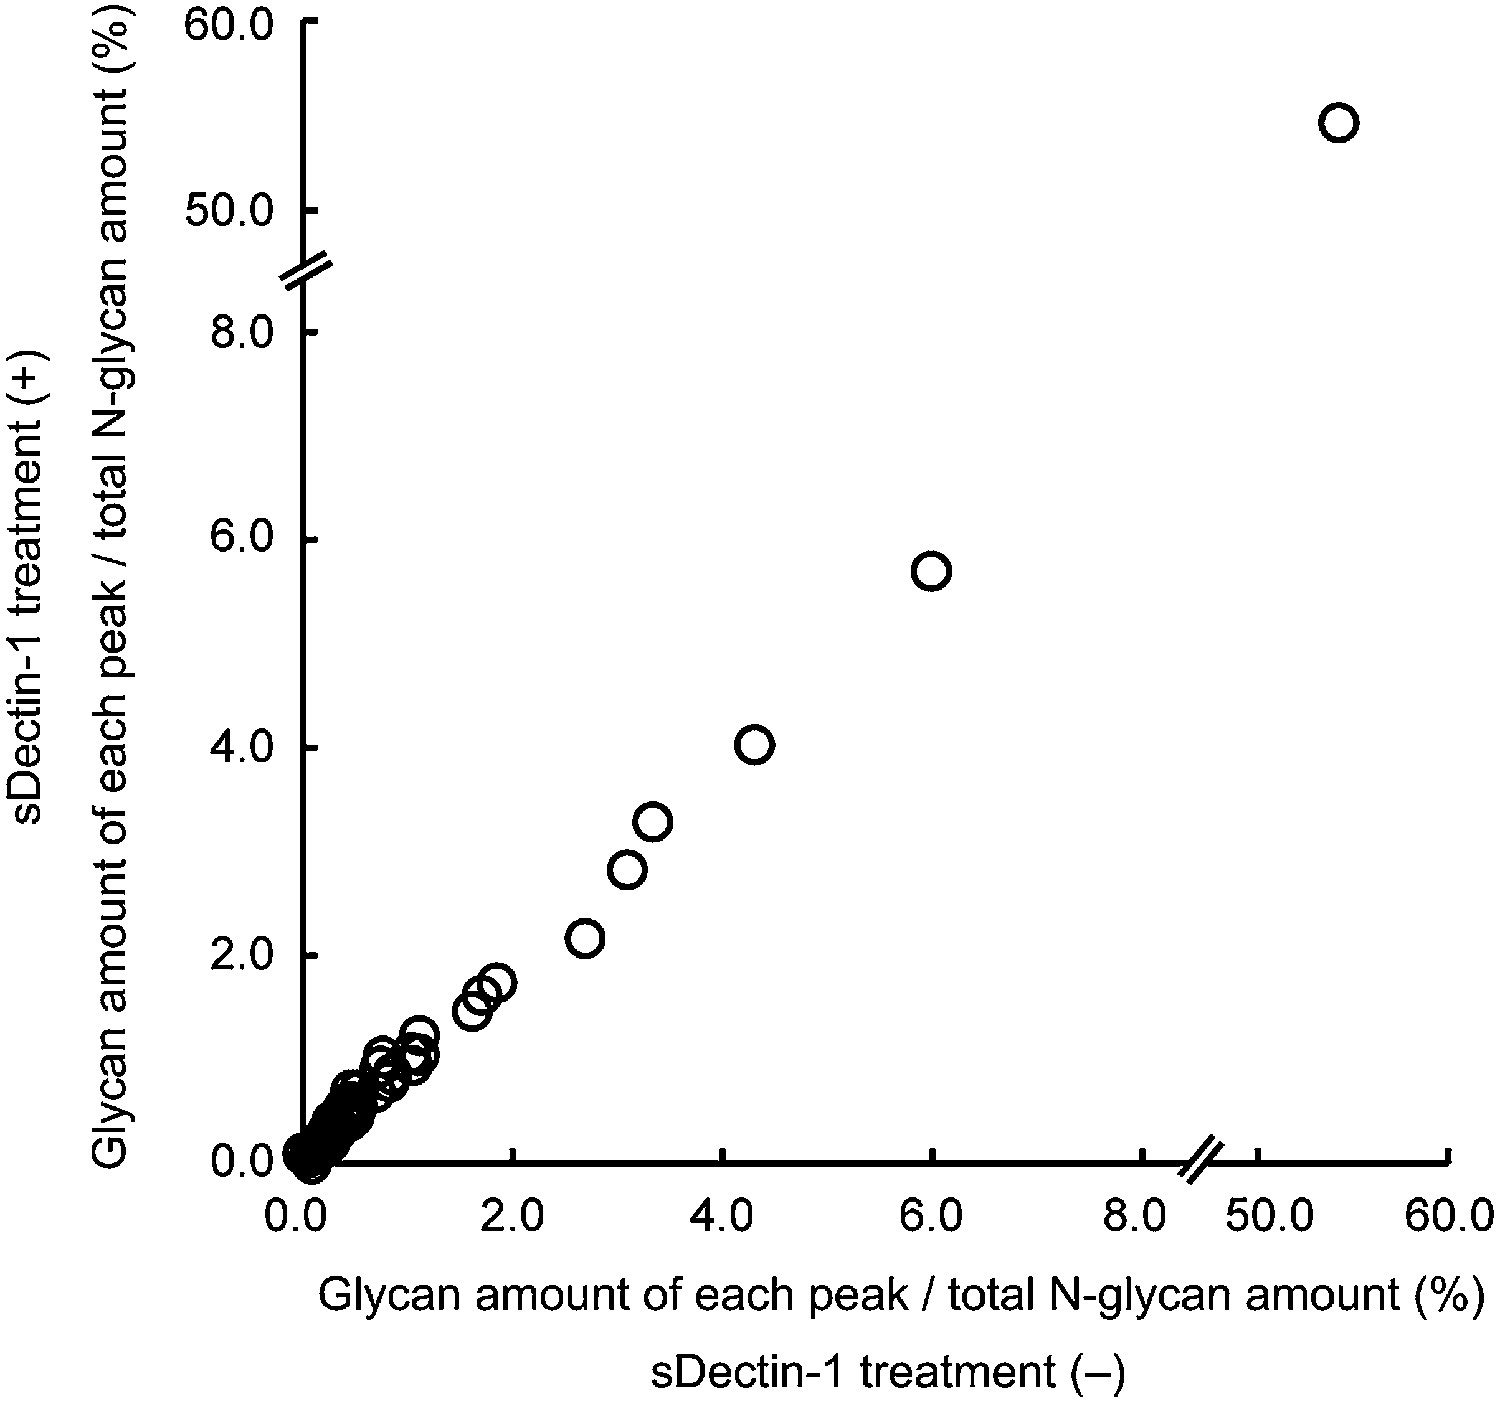
No differences in the amount of each N-glycan structure between samples with and without sDectin-1 treatment.
Effect of the incubation of sDectin-1 on the relative amount of N-glycan structures released from N-glycosidase-treated B16F1 cells. Relative amounts of each N-glycan structure to total N-glycan amount in the two samples in Figure 3—figure supplement 4 were plotted. Note that no differences are seen in the concentration of each glycan structure between the supernatants with or without treatment with sDectin-1 prior to the mass spectrometry analysis.
Figure 4 with 1 supplement
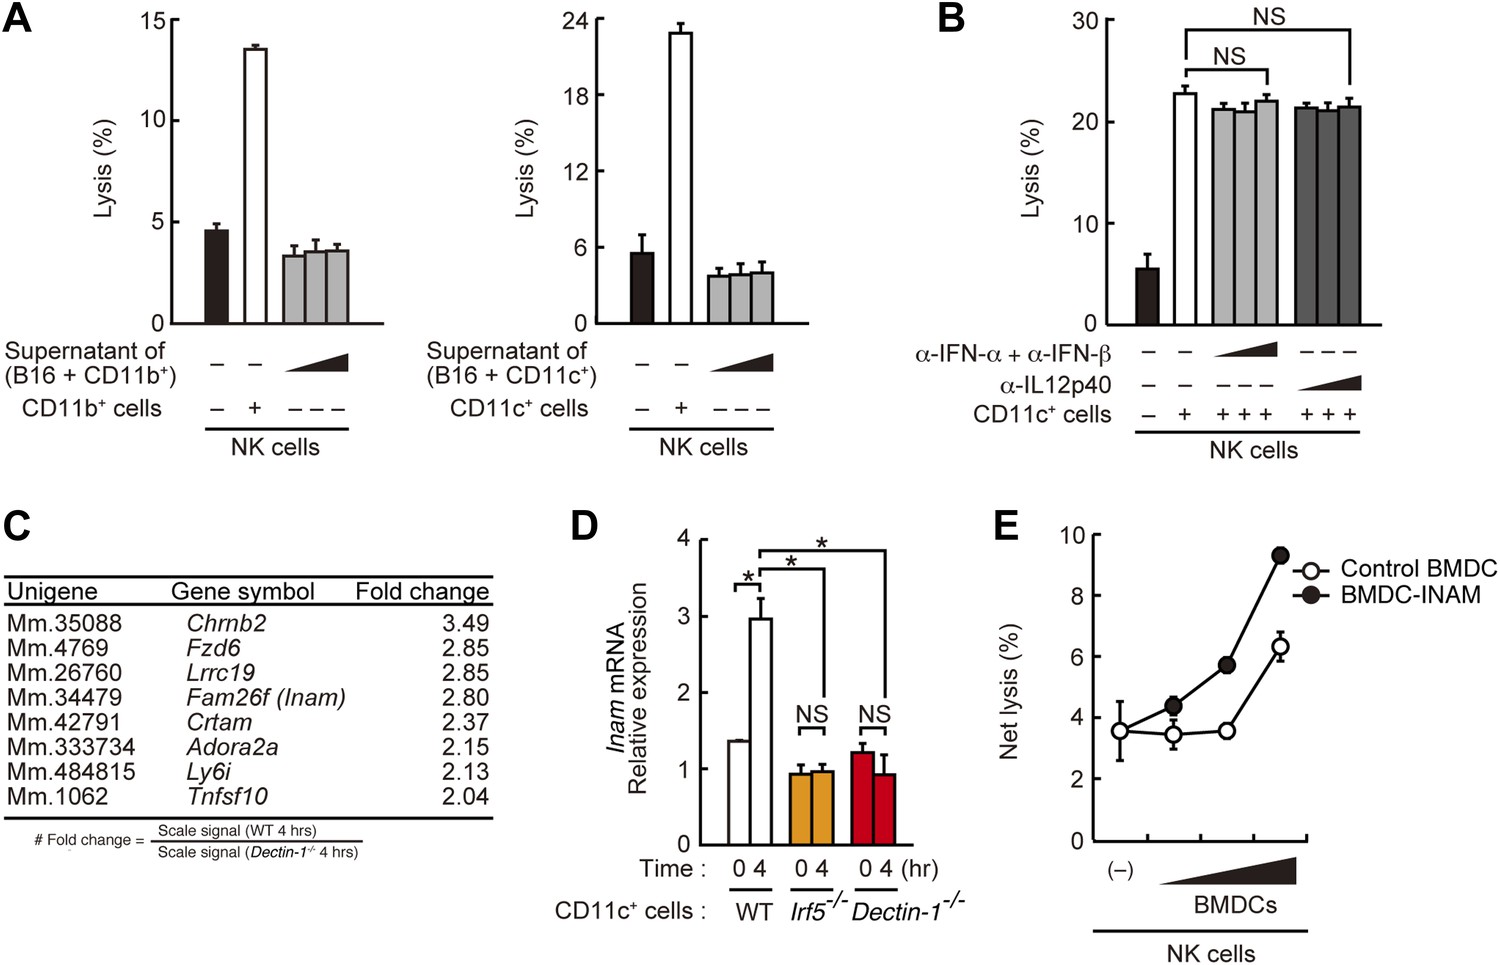
Requirement of cell-to-cell contact between NK cells and DCs for the enhancement of NK cell-mediated killing activity.
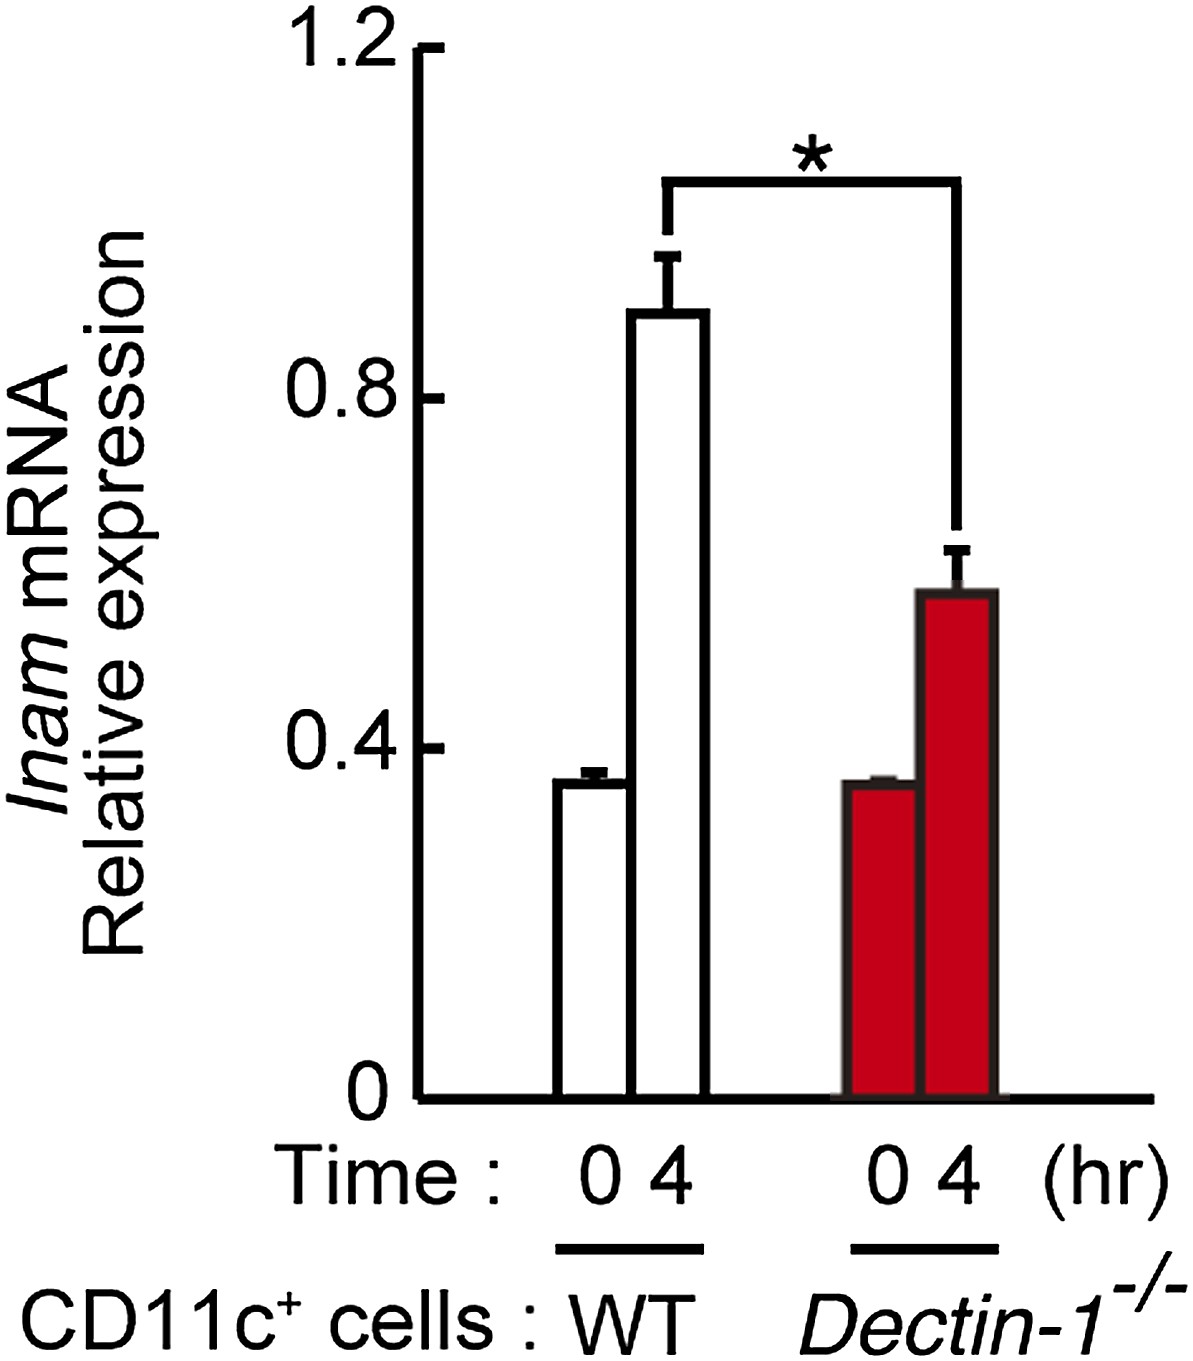
(A) Effect of the supernatant of myeloid cells after incubation with tumor cells. NK cell killing activity against B16F1 cells was assessed in the presence of supernatants from the co-culture of B16F1 cells with splenic CD11b+ cells (left panel) or CD11c+ cells (right panel). Represented as means ± SD. (B) Effect of antibodies against cytokines on NK cell-mediated killing activity. In vitro killing activity of purified NK cells (WT; 1 × 10⁵ cells) against B16F1 cells in the presence of 3 × 10⁵ of splenic CD11c+ cells was assessed without or with neutralizing antibodies for type I IFNs or IL12p40. (C) Induction of mRNAs in DCs co-cultured with B16F1 cells via Dectin-1 signaling. WT or Dectin-1−/− splenic CD11c+ cells (3 × 10⁵ cells) were co-cultured with B16F1 cells (1 × 10⁴ cells). Total RNA from those cells was then isolated at time zero and 4 hr after the co-culture and then subjected to microarray analysis. We first identified genes for which mRNA is induced more than two-fold in WT DCs co-cultured with B16F1 cells and then, of those, selected the genes whose mRNA levels are increased more than twofold in WT 4 hr sample compared to Dectin-1−/− 4 hr sample. Those selected genes are listed in the order of fold change (WT 4 hr/Dectin-1−/− 4 hr) (Table 1). Genes encoding a membrane-bound protein are listed. (D) Induction of Fam26f (Inam) mRNA by the Dectin-1-IRF5 pathway. The expression levels of Inam mRNA were monitored by qRT-PCR analysis of total RNA from splenic CD11c+ cells (WT, Irf5−/−, or Dectin-1−/−; 3 × 10⁵ cells) co-cultured with B16F1 cells (1 × 10⁴ cells) for 4 hr as described in ‘Materials and methods’. Results are presented relative to the expression of Gapdh mRNA. Represented as means ± SD. *p < 0.05 by Student's t test. NS, not significant. Although the IL15 cytokine system is known to promote growth and activity of NK cells, Il15 and Il15ra mRNA expression levels were affected only marginally in the Dectin-1−/− DCs (Figure 4—figure supplement 1). The results suggest that this cytokine system will not be involved in this particular experimental setting. (E) Effect of INAM expression in DCs on the enhancement of NK cell killing activity. Purified NK cells (WT; 1 × 10⁵ cells) were mixed with increasing amounts (1 × 10⁴, 3 × 10⁴, and 1 × 10⁵ cells) of INAM-transduced WT BMDCs (BMDC-INAM) or mock-transduced WT BMDCs (control BMDC) and killing activities against B16F1 cells were monitored. Represented as means ± SD. In all in vitro killing assays, 1 × 10⁴ of 51Cr-labeled B16F1 cells were used. 51Cr radioactivity released from target cells was measured. The percentage of cytotoxicity was calculated as described in the legend of Figure 1D and represented as Net lysis (%).
Figure 4—figure supplement 1
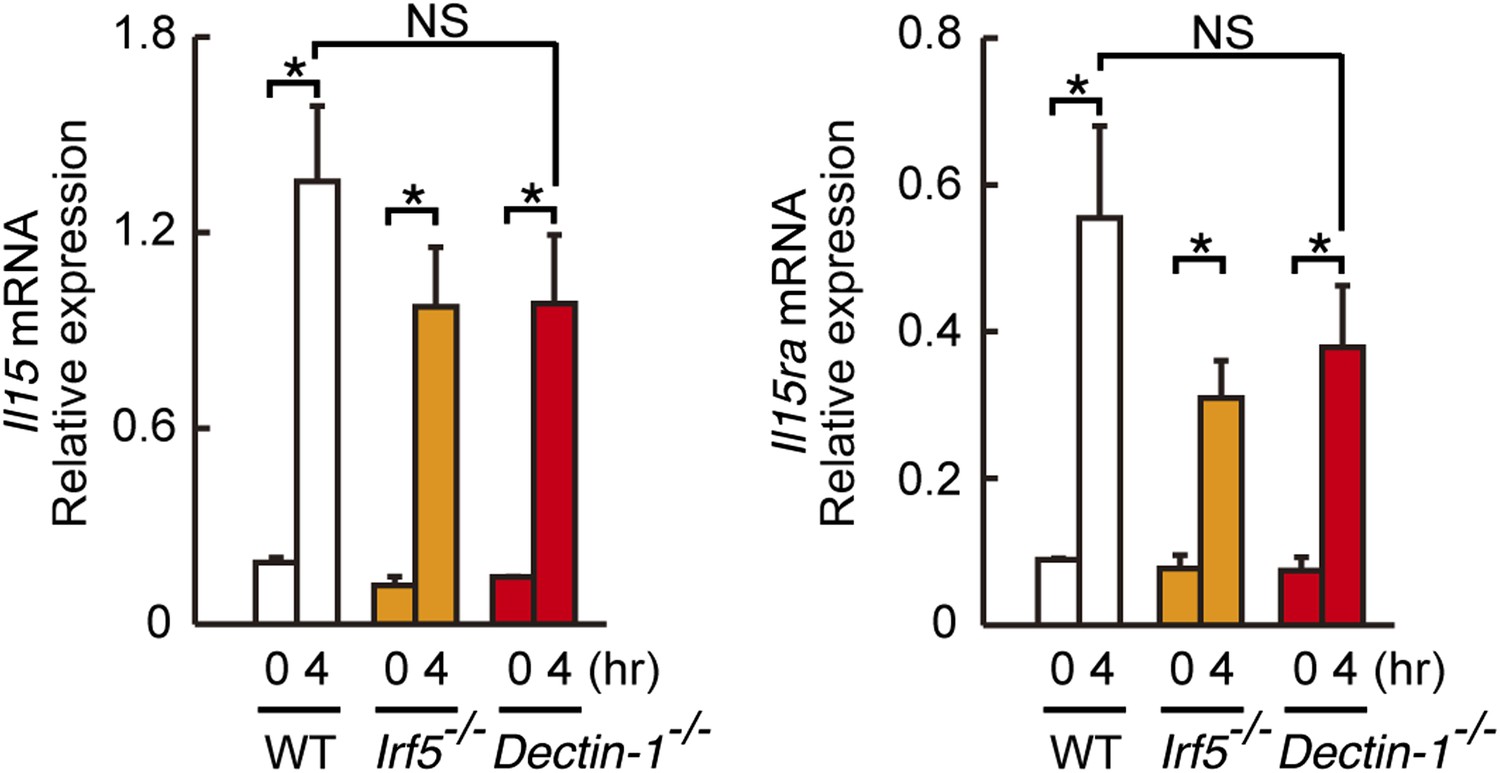
Induction of Il15 or Il15ra mRNAs in DCs co-cultured with B16F1 cells.
Il15 (left panel) or Il15ra (right panel) mRNA were monitored by qRT-PCR analysis as described in Figure 4D. Results are presented relative to the expression of Gapdh mRNA. Represented as means ± SD. *p < 0.05 by Student's t test. NS, not significant.
Figure 5 with 6 supplements
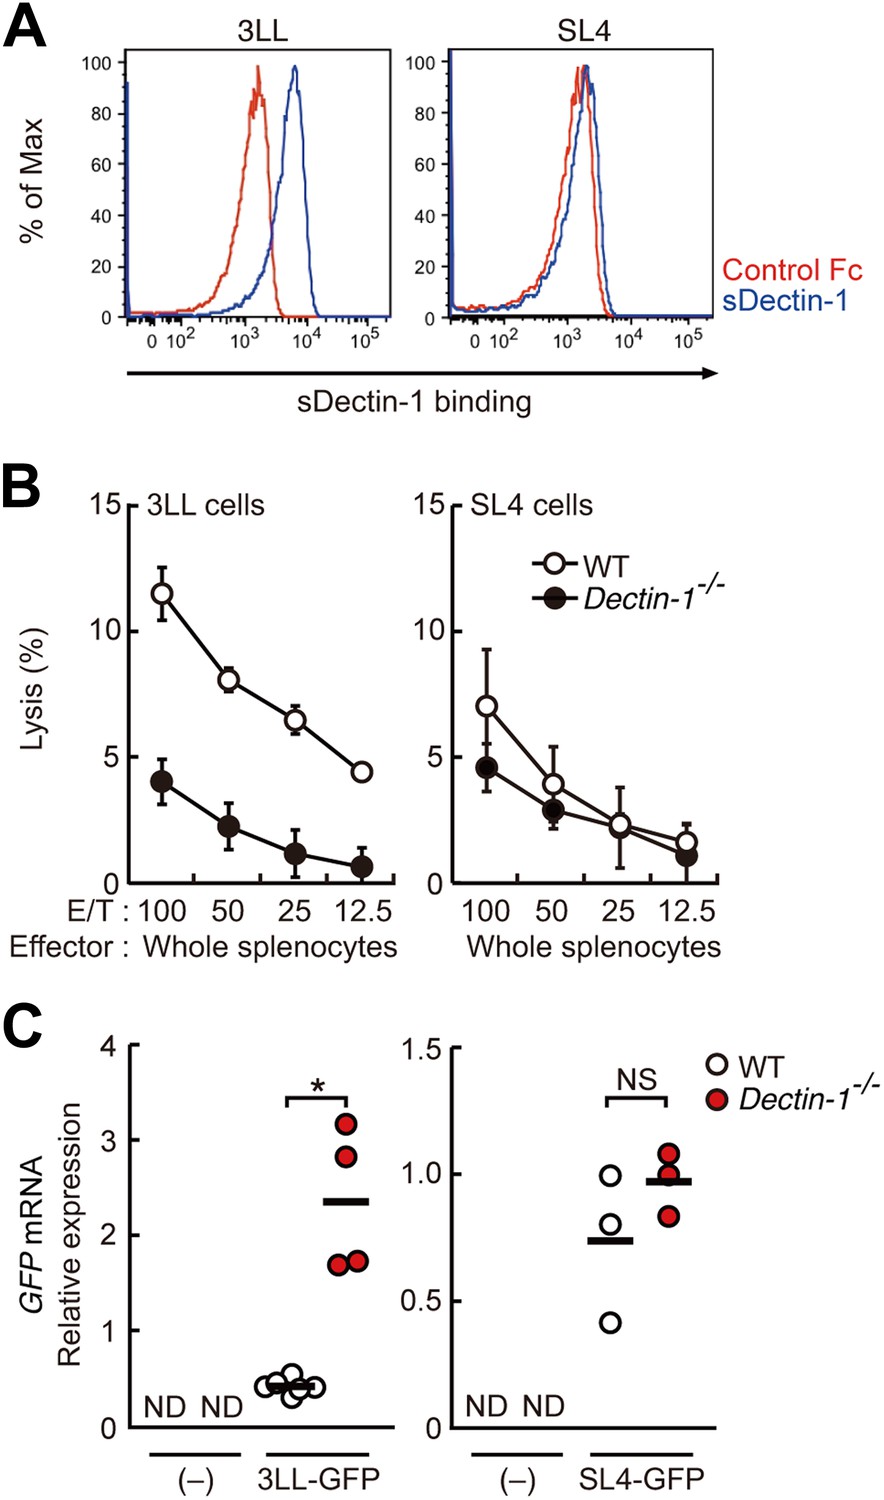
Dectin-1 binding on other tumor cells and its role in tumor suppression.
(A) Binding of sDectin-1 to 3LL (left panel) or SL4 cells (right panel). The sDectin-1 binding to these cell lines was examined as described in Figure 3A. (B) In vitro killing activity of WT or Dectin-1−/− splenocytes against 3LL (left panel) or SL4 cells (right panel) as indicated E/T ratio. Represented as means ± SD. In in vitro killing assays, 1 × 10⁴ of 51Cr-labeled target cells were used. (C) Quantification of metastasis of 3LL (left panel) or SL4 cells (right panel) in WT or Dectin-1−/− mice. WT and Dectin-1−/− mice were intravenously injected with GFP-expressing 3LL (3LL-GFP) or SL4 cells (SL4-GFP). GFP mRNA expression levels in lungs were assessed by qRT-PCR 12 (3LL cells) or 14 (SL4 cells) days after the injection. Means are indicated as black bars. *p < 0.05 by Student's t test; ND, none detected; NS, not significant.
Figure 5—figure supplement 1
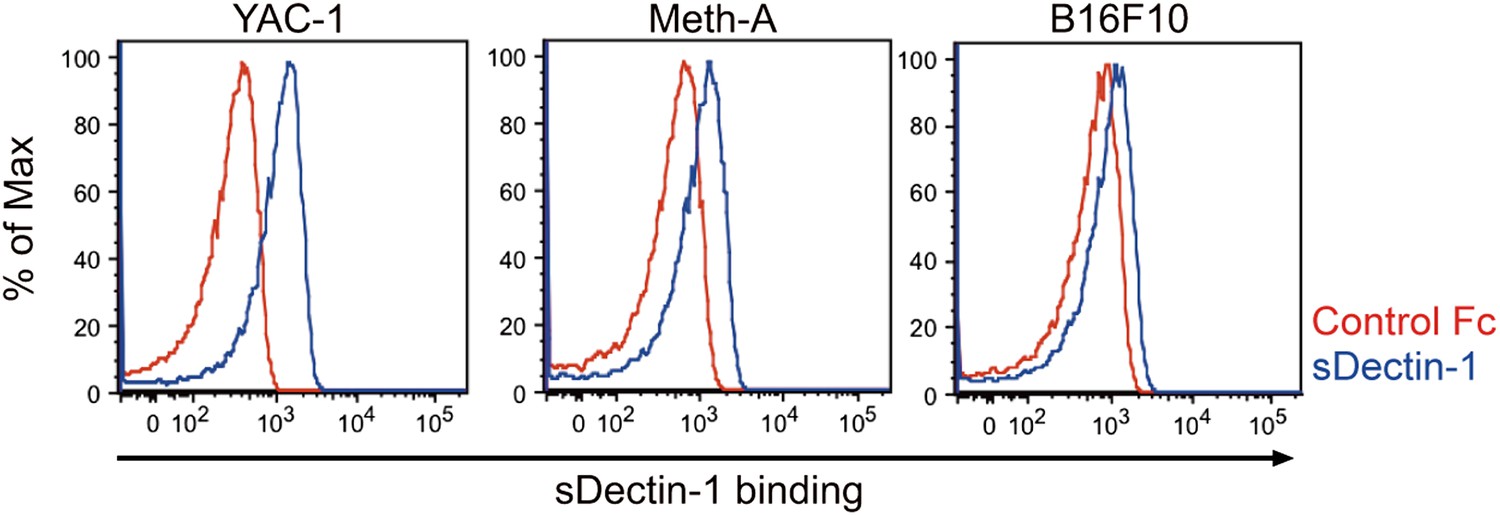
Binding of sDectin-1 to various mouse cancer cell lines.
The sDectin-1 binding to YAC-1 (left panel), Meth-A (middle panel), or B16F10 (right panel) cells were examined as described in Figure 3A.
Figure 5—figure supplement 2

Pull-down analysis of sDectin-1 binding on cancer cells.
B16F1, 3LL, B16F10 and MEF cells (4 × 10⁷ cells) treated with or without N-glycosidase (25 U/ml) for 1 hr were incubated with sDectin-1 (tagged with HA and human IgG1 Fc region), and then the sDectin-1 was chemically cross-linked to the cells. After that, cells were lysed and sDectin-1 was precipitated by protein G-conjugated sepharose. sDectin-1 binding was detected by immunoblot analysis using anti-HA antibody. Arrowhead indicates sDectin-1 protein.
Figure 5—figure supplement 3
In vitro killing activity of WT or Dectin-1−/− splenocytes against YAC-1 cells.
In vitro killing activity of WT or Dectin-1−/− splenocytes against YAC-1 cells as indicated E/T ratio. 51Cr radioactivity released from the target cells was measured. Represented as means ± SD. In in vitro killing assays, 1 × 10⁴ of 51Cr-labeled YAC-1 cells were used.
Figure 5—figure supplement 4

Contribution of Dectin-1 signaling to anti-tumor killing activity against B16F10 cells.
Number of metastasized colonies in lungs from WT or Dectin-1−/− mice intravenously injected with 5 × 10⁵ of B16F10 cells. Means are indicated as black bars. NS, not significant.
Figure 5—figure supplement 5
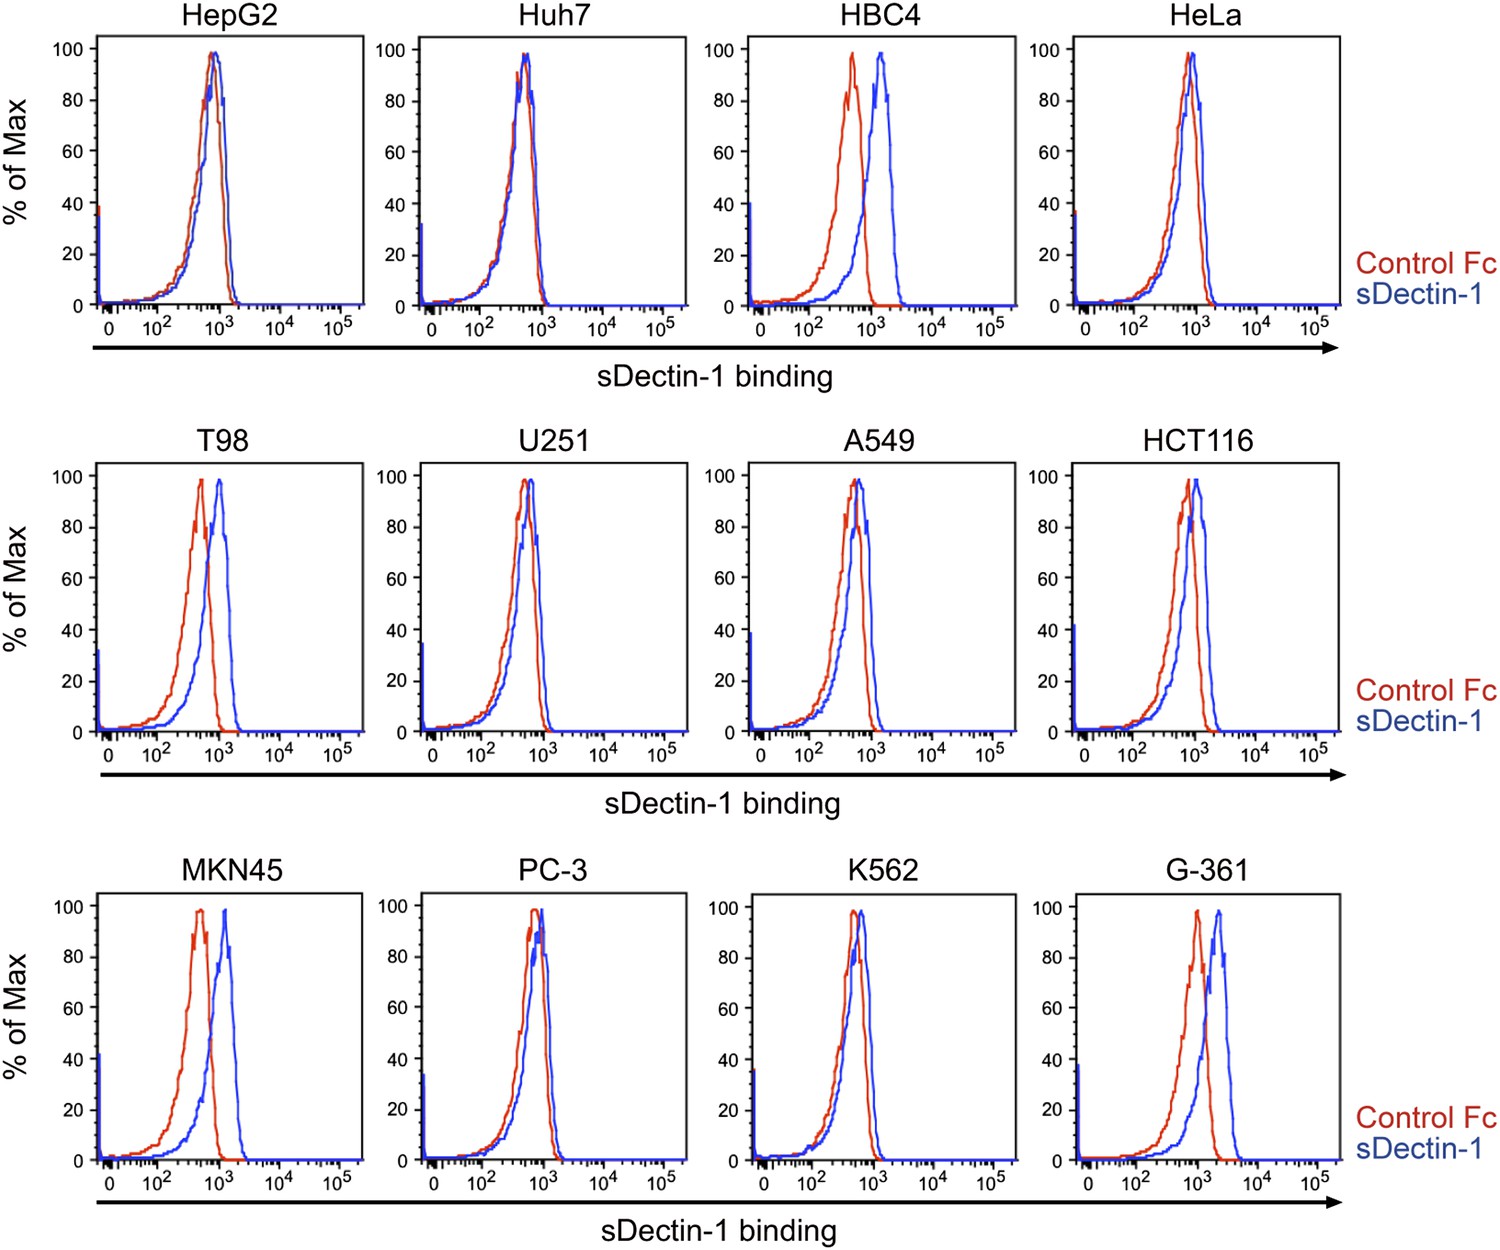
Binding of sDectin-1 to various human cancer cell lines.
Binding of human sDectin-1 to HepG2, Huh7, HBC4, HeLa, T98, U251, A549, HCT116, MKN45, PC-3, K562, or G-361 cells was examined as described in Figure 3A.
Figure 5—figure supplement 6
Induction of Inam mRNAs in DCs co-cultured with human cancer cells.
Dectin-1-dependent induction of Inam (Fam26f) mRNA by a human cancer cell line. Mouse splenic CD11c+ cells (3 × 10⁵ cells), either from WT mice or Dectin-1−/− mice, were co-cultured with HBC4 cells (1 × 10⁴ cells) for 4 hr and total RNA was subjected to qRT-PCR analysis for Inam mRNA induction. Results are presented relative to the expression of Gapdh mRNA. Represented as means ± SD. *p < 0.05 by Student's t test.
Figure 6
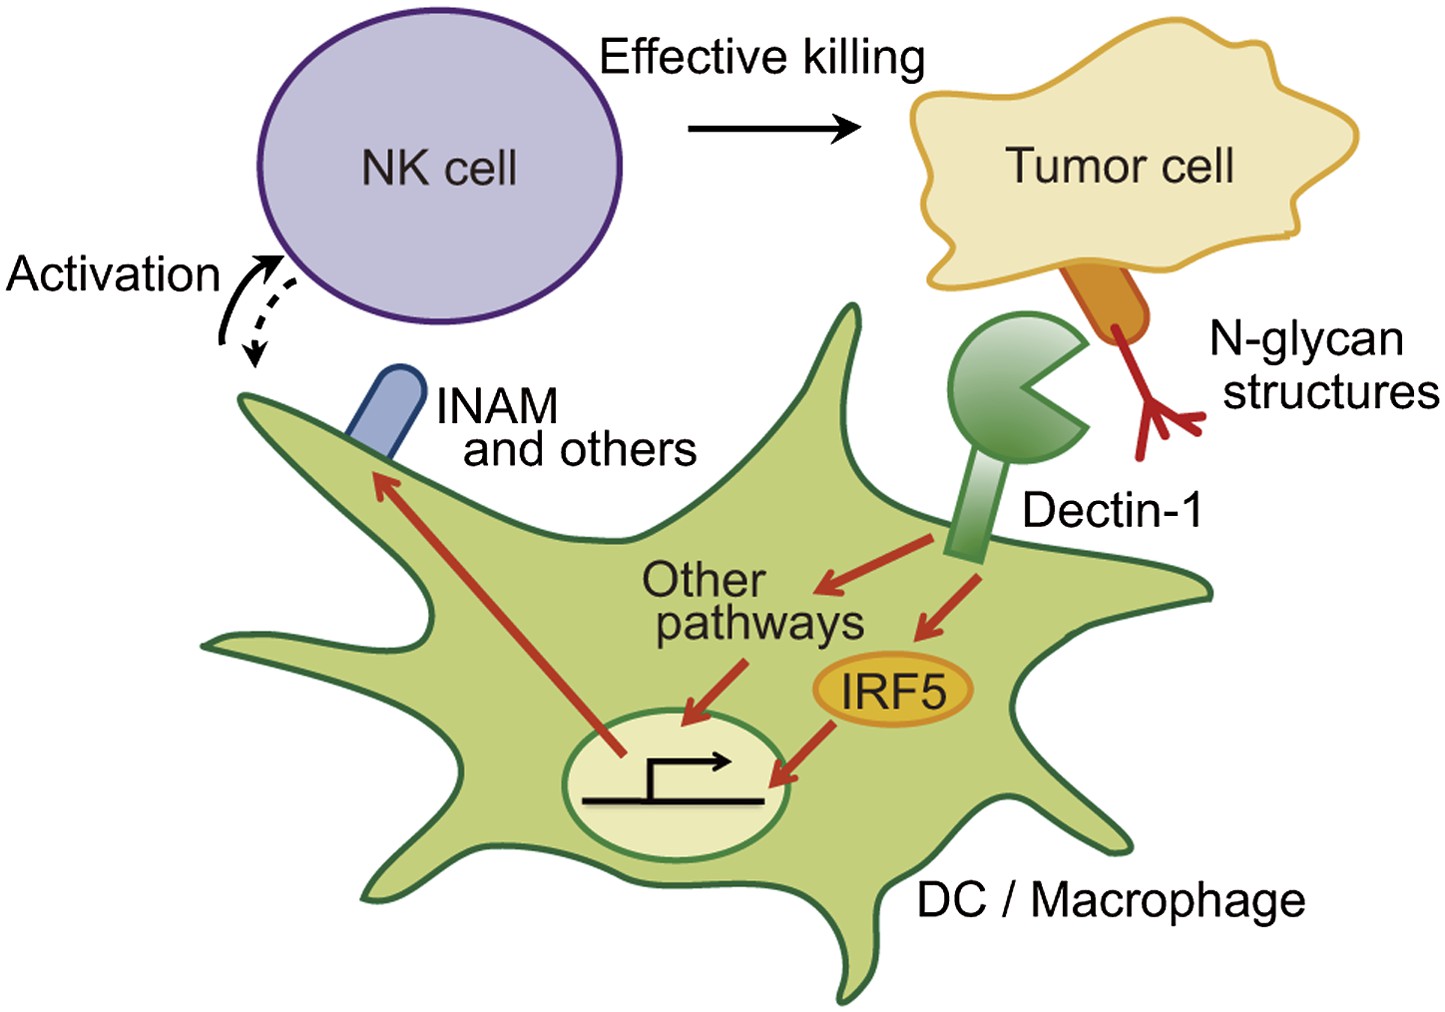
Schematic view of the orchestration of innate immune cells for NK cell-mediated tumor killing.
Dectin-1 expressed by DCs and macrophages recognizes N-glycan structures on tumor cells and signals to activate IRF5 pathway and other pathways, thereby activating NK cells. Thus, NK cells require tumor recognition and signaling by these innate immune cells for their effective tumoricidal action. Although INAM is depicted here, the DC-mediated activation of NK cells would involve other molecules and this Dectin-1-IRF5-INAM pathway may represent only a part of the entire picture. It remains to be further characterized as to whether and how this and/or other effector ligands induced by Dectin-1 signaling contribute to NK activation in full. It is possible that DCs/macrophages are secondarily activated by yet unknown factors from NK cells (see dashed arrow).
Tables
Table 1
Induction of mRNAs in DCs co-cultured with B16F1 cells via Dectin-1 signaling
| Unigene | Gene symbol | Fold change |
|---|---|---|
| Mm.275426 | Amy2a1///Amy2a2///Amy2a3///Amy2a4///Amy2a5 | 1995.76 |
| Mm.45316 | Cela2a | 173.36 |
| Mm.383263 | Try4///Try5 | 88.72 |
| Mm.475541 | Cela3b///Gm13011 | 61.79 |
| Mm.20407 | Pnlip | 21.28 |
| Mm.142731 | Reg1 | 16.65 |
| Mm.34374 | Ctrb1 | 16.42 |
| Mm.21160 | Clps | 14.85 |
| Mm.276926 | Prss2 | 13.67 |
| Mm.34692 | Cpb1 | 10.25 |
| Mm.450553 | Tpte | 9.99 |
| Mm.10753 | Pnliprp1 | 8.31 |
| Mm.46360 | Reg2 | 6.86 |
| Mm.1825 | Tff2 | 5.19 |
| Mm.867 | Ccl12///LOC100862578 | 4.96 |
| Mm.464256 | Tcl1b3 | 3.97 |
| Mm.2745 | Ctrl | 3.72 |
| Mm.14874 | Gzmb | 3.46 |
| Mm.159219 | Batf2 | 3.45 |
| Mm.439927 | Nol7 | 3.00 |
| Mm.4662 | Irg1 | 2.72 |
| Mm.4922 | Csf2 | 2.70 |
| Mm.2319 | Stmn3 | 2.70 |
| Mm.24375 | Ttpa | 2.70 |
| Mm.41416 | Rilp | 2.65 |
| Mm.159575 | Cdyl2 | 2.57 |
| Mm.261140 | Iigp1 | 2.44 |
| Mm.26730 | Hp | 2.32 |
| Mm.203866 | Ahnak | 2.30 |
| Mm.34520 | Gtpbp8 | 2.30 |
| Mm.32368 | Krit1 | 2.29 |
| Mm.116997 | Hmmr | 2.26 |
| Mm.208125 | Adamts6 | 2.17 |
| Mm.271830 | Dhx58 | 2.10 |
| Mm.131098 | Golga1 | 2.10 |
| Mm.131723 | Cxcl11 | 2.09 |
| Mm.5022 | Mmp13 | 2.09 |
| Mm.291595 | Klf9 | 2.09 |
| Mm.33691 | Reg3d | 2.08 |
| Mm.130 | Socs1 | 2.06 |
| Mm.10948 | Slfn1 | 2.05 |
| Mm.22213 | Glipr2 | 2.01 |
-
The genes identified in the microarray analysis in Figure 4C are listed in the order of fold change (WT 4 hr/Dectin-1−/− 4 hr). Genes encoding a membrane-bound protein are indicated in red letters.
Download links
A two-part list of links to download the article, or parts of the article, in various formats.
Downloads (link to download the article as PDF)
Open citations (links to open the citations from this article in various online reference manager services)
Cite this article (links to download the citations from this article in formats compatible with various reference manager tools)
Recognition of tumor cells by Dectin-1 orchestrates innate immune cells for anti-tumor responses
eLife 3:e04177.
https://doi.org/10.7554/eLife.04177


