Polycomb- and REST-associated histone deacetylases are independent pathways toward a mature neuronal phenotype
- Oregon Health and Science University, United States
- Howard Hughes Medical Institute, United States
- Baylor College of Medicine, United States
- Scripps Research Institute, United States
Figures
Figure 1 with 5 supplements
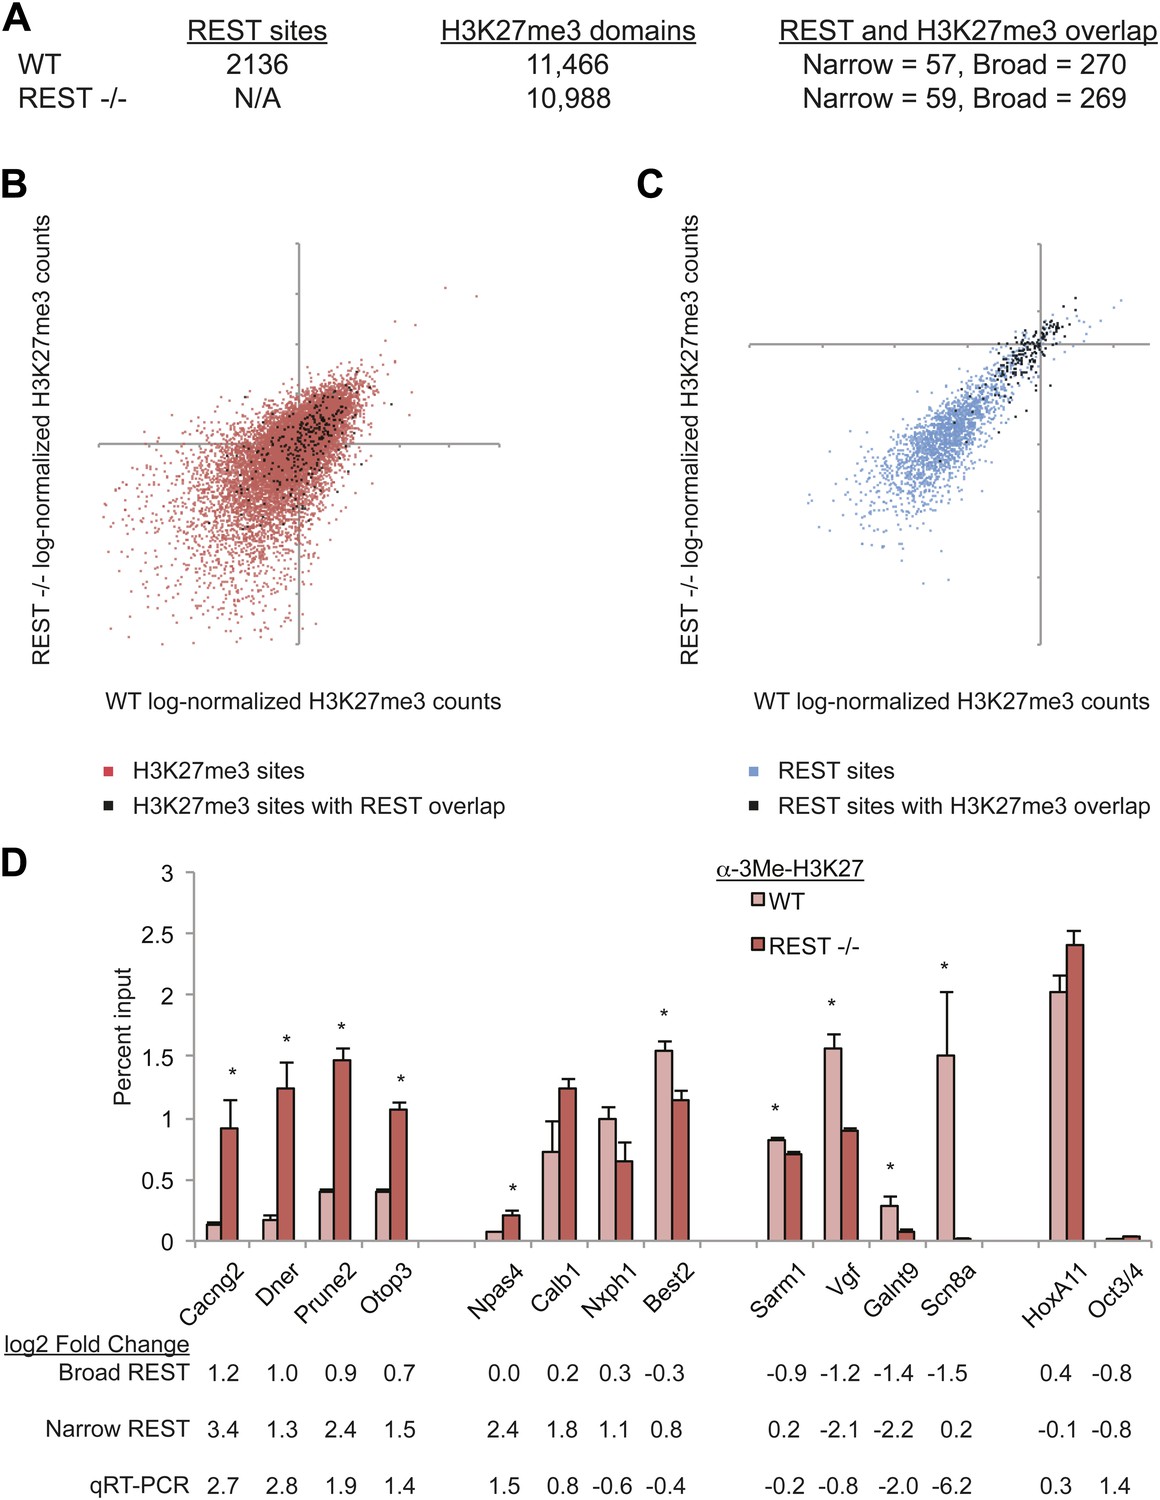
PRC2 establishes H3K27me3 in ESCs independent of REST repression.
(A) A limited number of REST-occupied sites are associated with domains of H3K27me3 enrichment in ESCs, even if defined more broadly (+/− 1 kb). (B) H3K27me3 levels are stable in Rest−/− ESCs in the majority of regions targeted by PRC2. The scatter-plot shows the relative enrichment of H3K27me3 ChIP-Seq signal in wild type (WT, x-axis) and Rest−/− ESCs (y-axis) at regions targeted by PRC2 in WT ESCs. (C) As in (B), but at identified REST-binding sites. (D) Chromatin immunoprecipitation analysis showing H3K27me3-enrichment changes at RE1 sites near PRC2-targeted regions in WT and Rest−/− ESCs (* indicates p < 0.05), normalized for H3 density.
Figure 1—figure Supplement 1
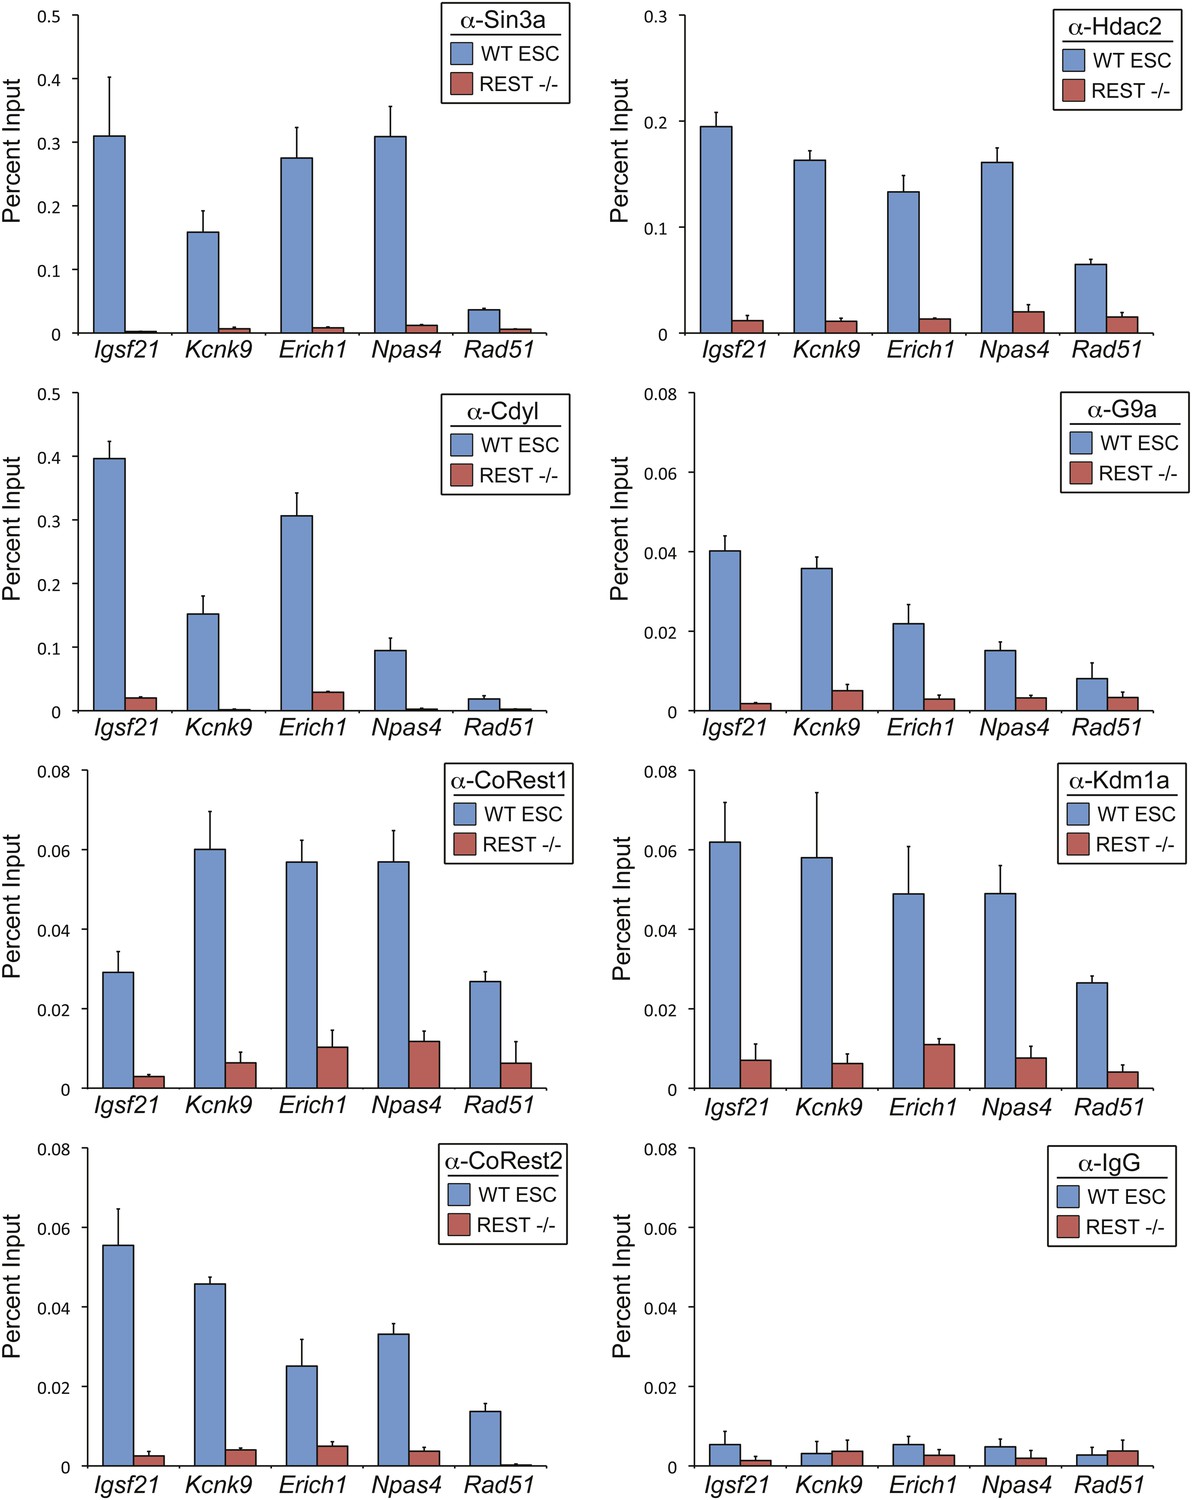
REST is required for recruitment of co-factors to RE1 sites in ESCs.
ChIP assays were performed in WT and Rest−/− ESCs using antibody against Sin3a, Cdyl, CoREST1, CoREST2, Hdac2, G9a, and Kdm1a to compare recruitment of endogenous co-factors at the RE1 sites near Igsf21, Kcnk9, Erich1, Npas4, and Rad51. ChIP assays done in parallel with normal rabbit IgG are included as a negative control.
Figure 1—figure Supplement 2
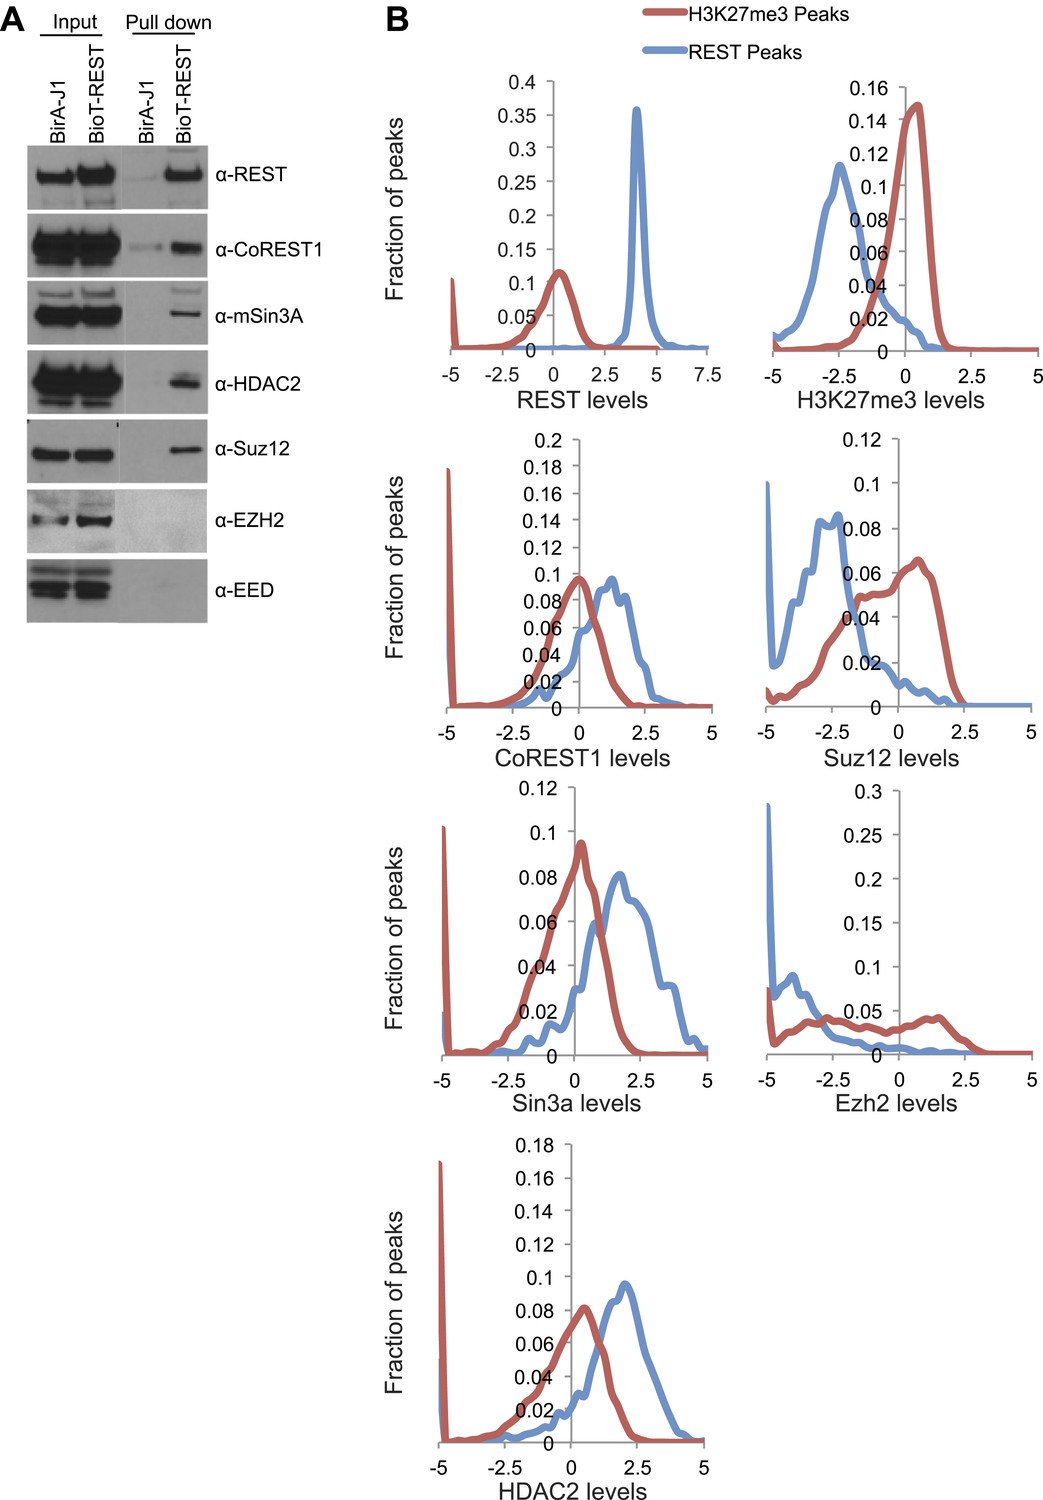
Detection of REST binding to PRC2 members is biochemically possible, but a true interaction is unlikely.
(A) Immunoprecipitation was performed with streptavidin beads from biotin-tagged REST ESCs or BirA control ESCs and the demarcated proteins were assayed by Western blot. (B) Previously published ChIP-seq data sets were interrogated over H3K27me3 peaks and REST peaks normalized to the signal found at the H3K27me3 peaks.
Figure 1—figure Supplement 3

Characteristics of REST-bound loci.
(A) Regions with multiple RE1 motifs show a strong association with REST. REST ChIP-Seq data displayed as sequence tags aligned to the mouse genome assembly (mm9) viewed in the UCSC genome browser. Green and red hash marks represent sequences matching the forward and reverse strands, respectively. Consensus RE1 sequence motifs are indicated by black hash marks. All views are shown at an equal size relative to the scale bar. (B) FIMO definition of the RE1 motif was derived from ChIP-seq peaks. (C) Relative enrichment of REST measured by ChIP-Seq was confirmed by ChIP-qPCR. ChIP assays were performed using antibody raised against a peptide corresponding to a fragment of mouse REST in WT (red bars) and Rest−/− (blue bars) in ESCs at regions associated with RE1 motifs and regions lacking an RE1 site (Oct4 and MageA8). (D) REST targets associated with trimethylation of histone H3K4 or H3K27 enrichment are preferentially localized near gene promoters. Graph shows the percentage of REST-bound regions that overlap with domains of the bivalent histone modification pattern consisting of H3K4me3 and H3K27me3 enrichment (red bars), H3K4me3 enrichment alone (green bars), or without overlap to either modification (tan bars).
Figure 1—figure Supplement 4
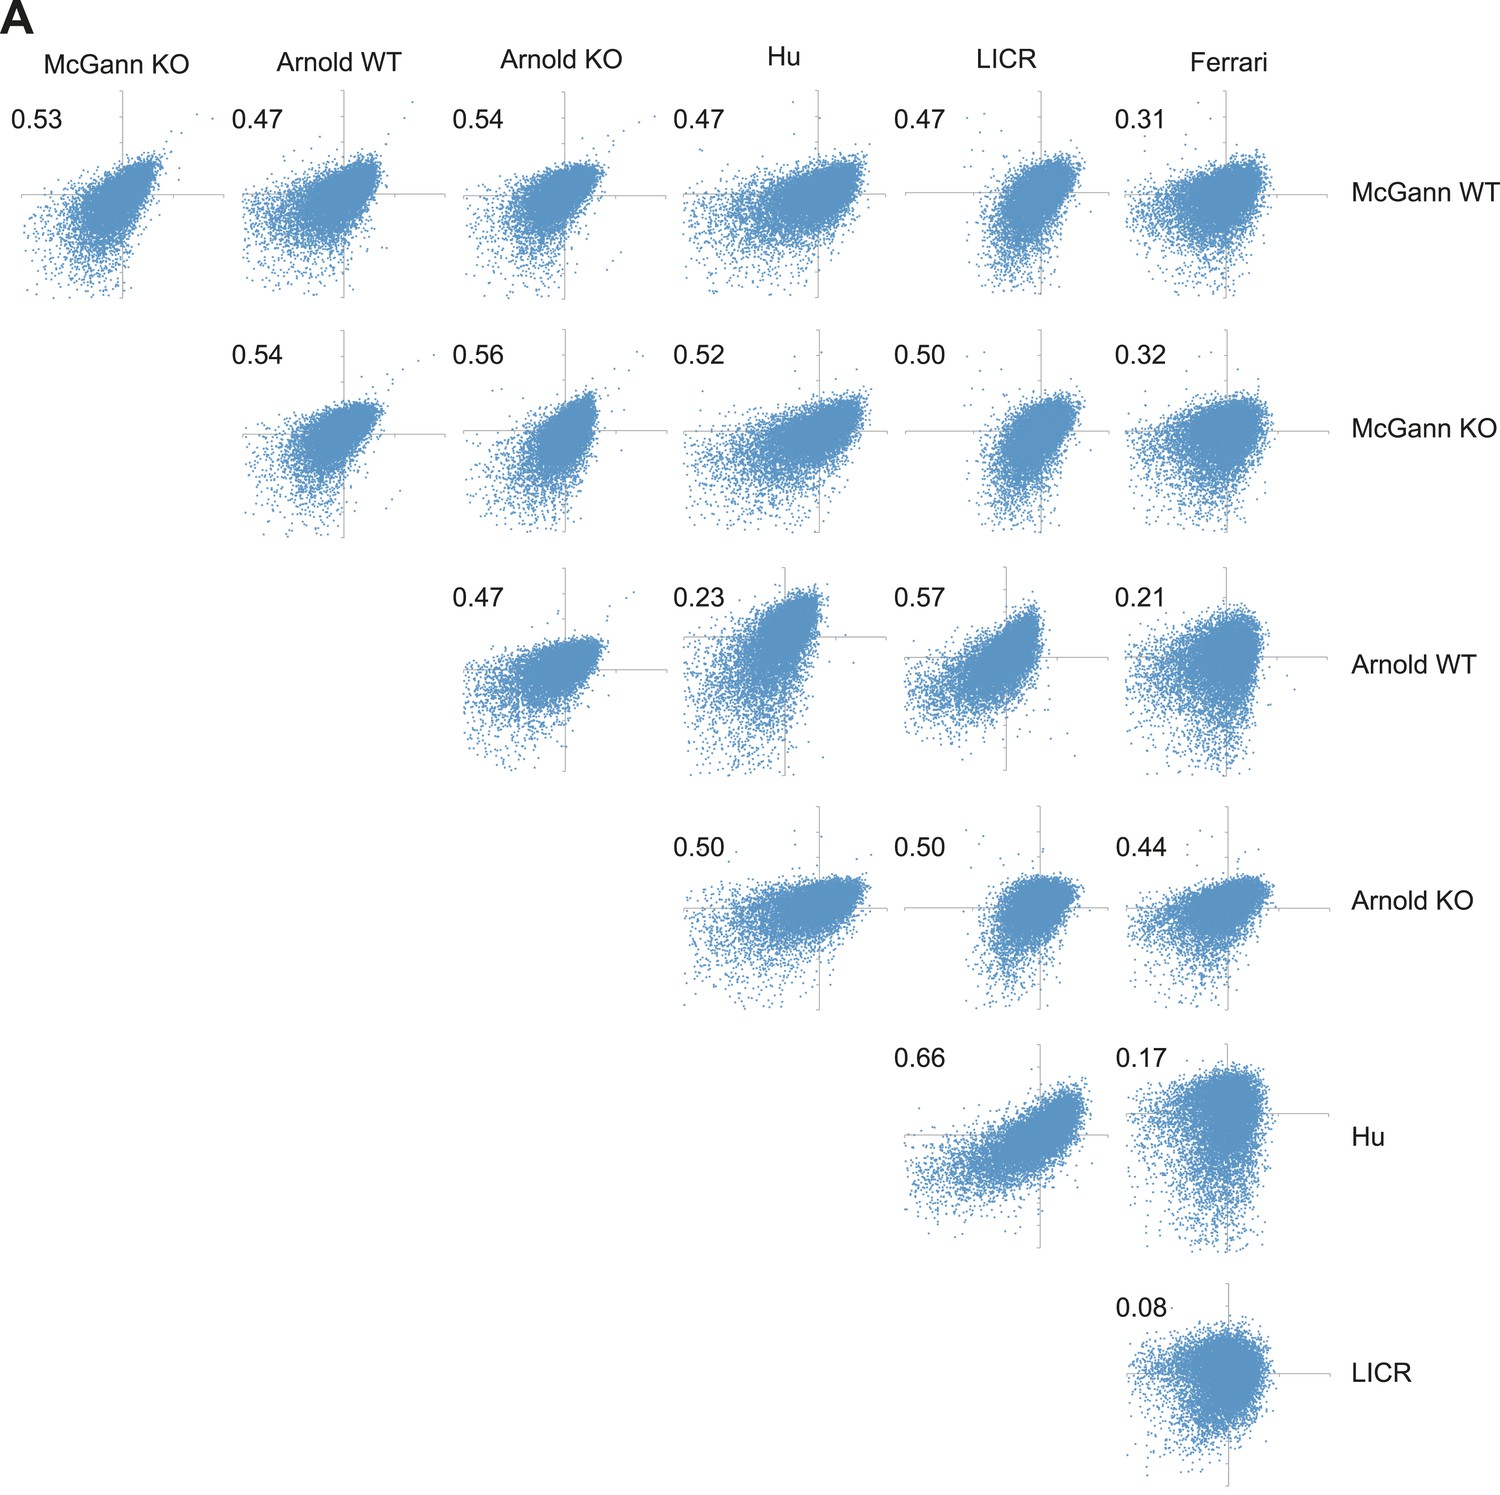
H3K27me3 levels from WT and Rest−/− ESCs are as similar as H3K27me3 levels from different published reports.
(A) Normalized enrichment values for H3K27me3 at defined H3K27me3 peaks were derived from several previously published data sets and plotted against one another. Numbers indicate Pearson coefficient.
Figure 1—figure Supplement 5
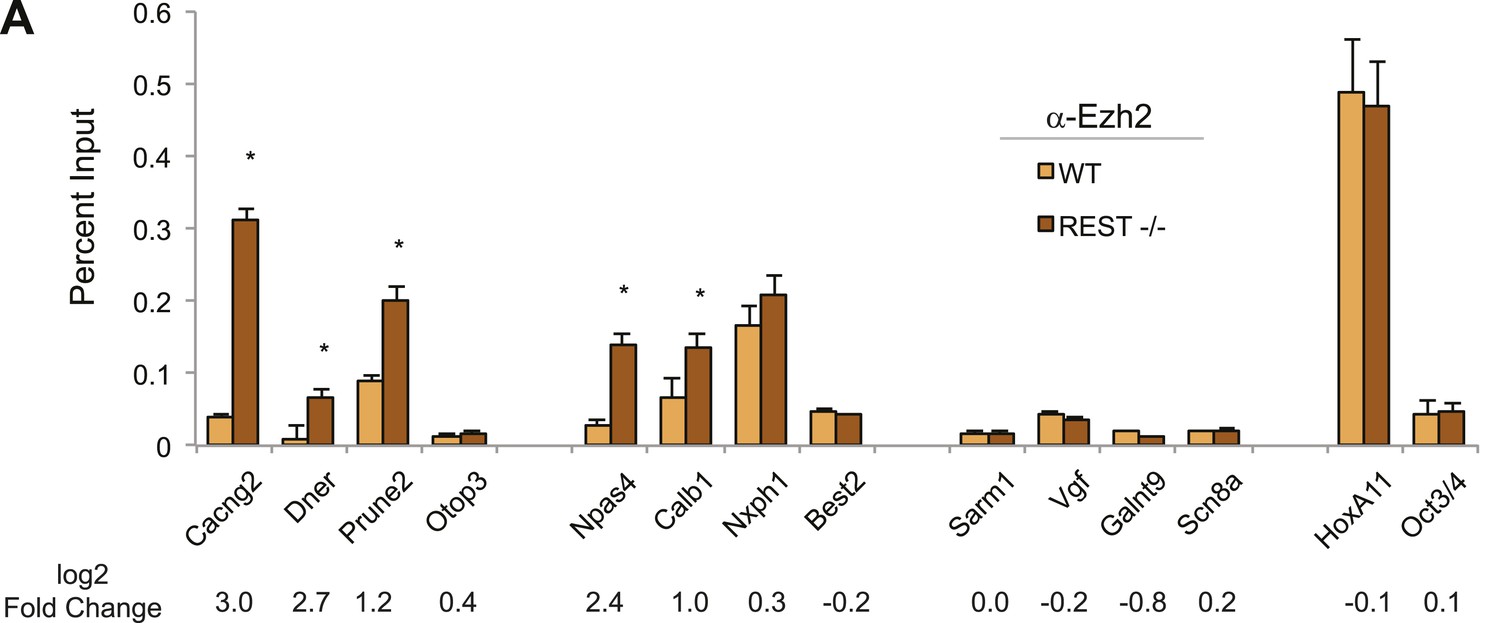
Ezh2-enrichment at REST-bound loci.
(A) Ezh2 occupancy was increased at RE1 sites within H3K27me3 domains that gained H3K27me3 in the absence of REST. ChIP assays were performed with anti-Ezh2 to compare enrichment at RE1 sites between WT (light orange) and Rest−/− (dark orange) ESCs.
Figure 2
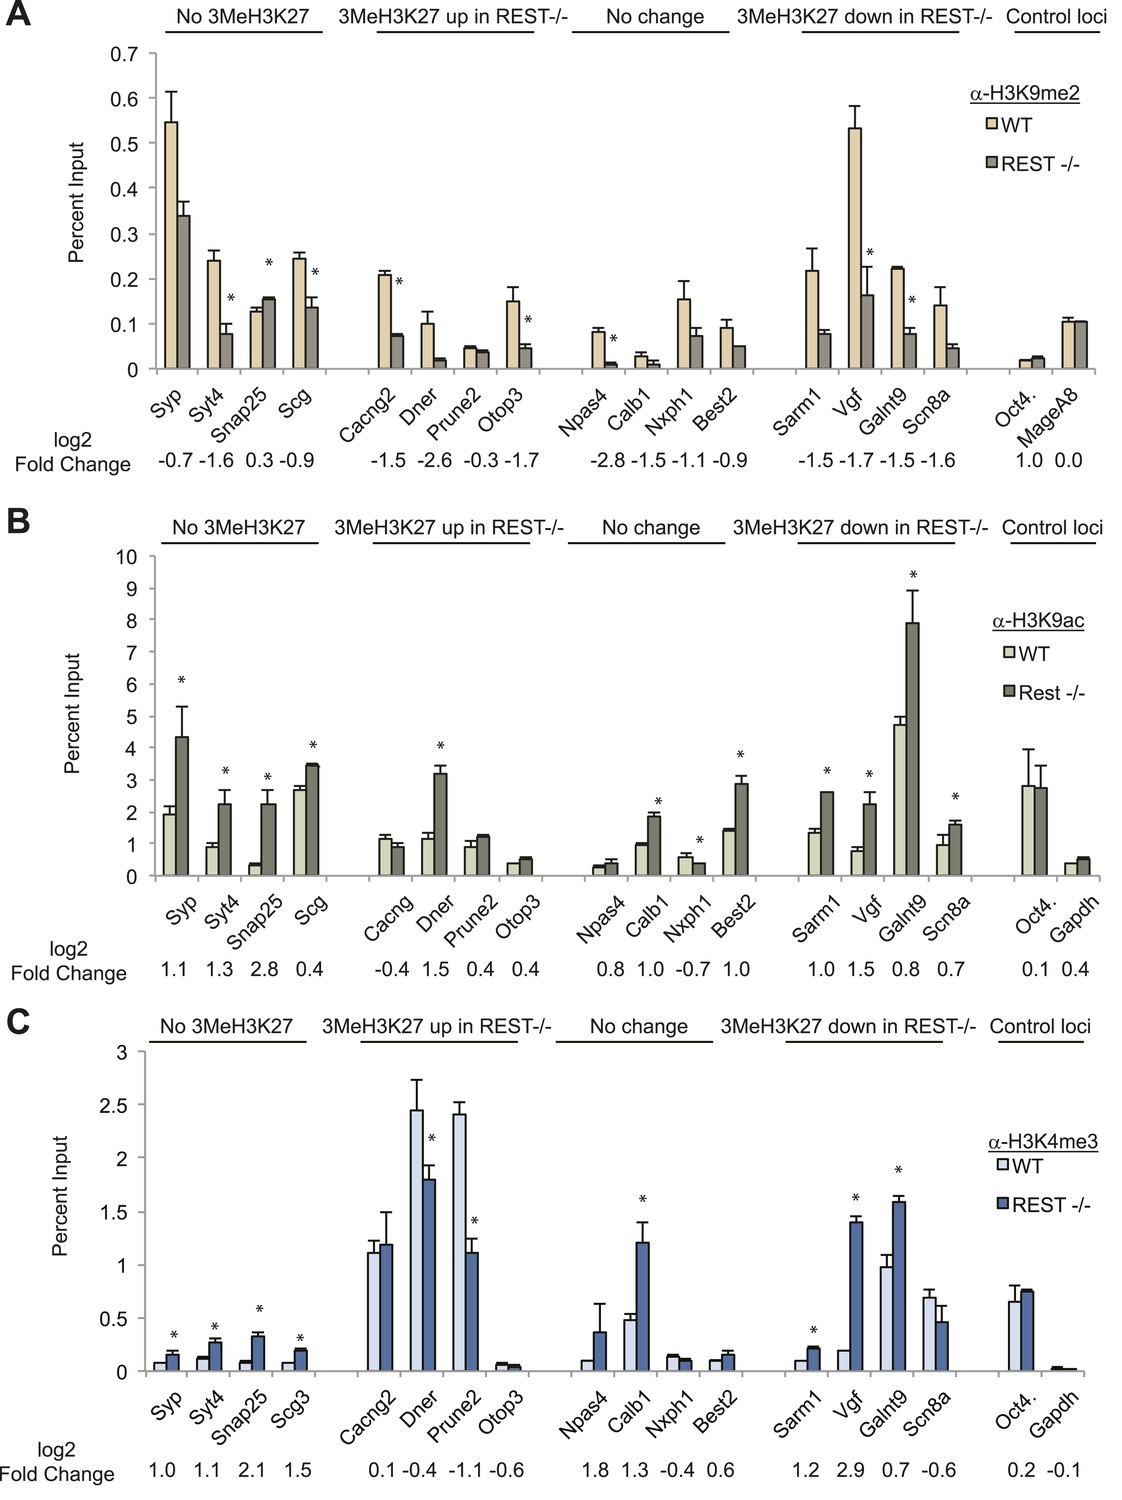
Chromatin modification changes due to loss of REST.
(A) REST-dependent establishment of 2Me-H3K9, measured by ChIP, is impaired at RE1 sites in Rest−/− ESCs irrespective of changes in H3K27me3 levels. Oct4 and MageA8 are genes expressed in ESCs that lack RE1 sites. (B) Increased histone acetylation is detected at most RE1-associated promoters in the absence of REST, irrespective of changes in H3K27me3 levels. Oct4 and Gapdh promoter regions are expressed in ESCs and lack RE1 sites. (C) H3K4me3 enrichment is increased at most RE1-associated promoters in Rest−/− ESCs, independent of H3K27me3 levels (* indicates p < 0.05).
Figure 3
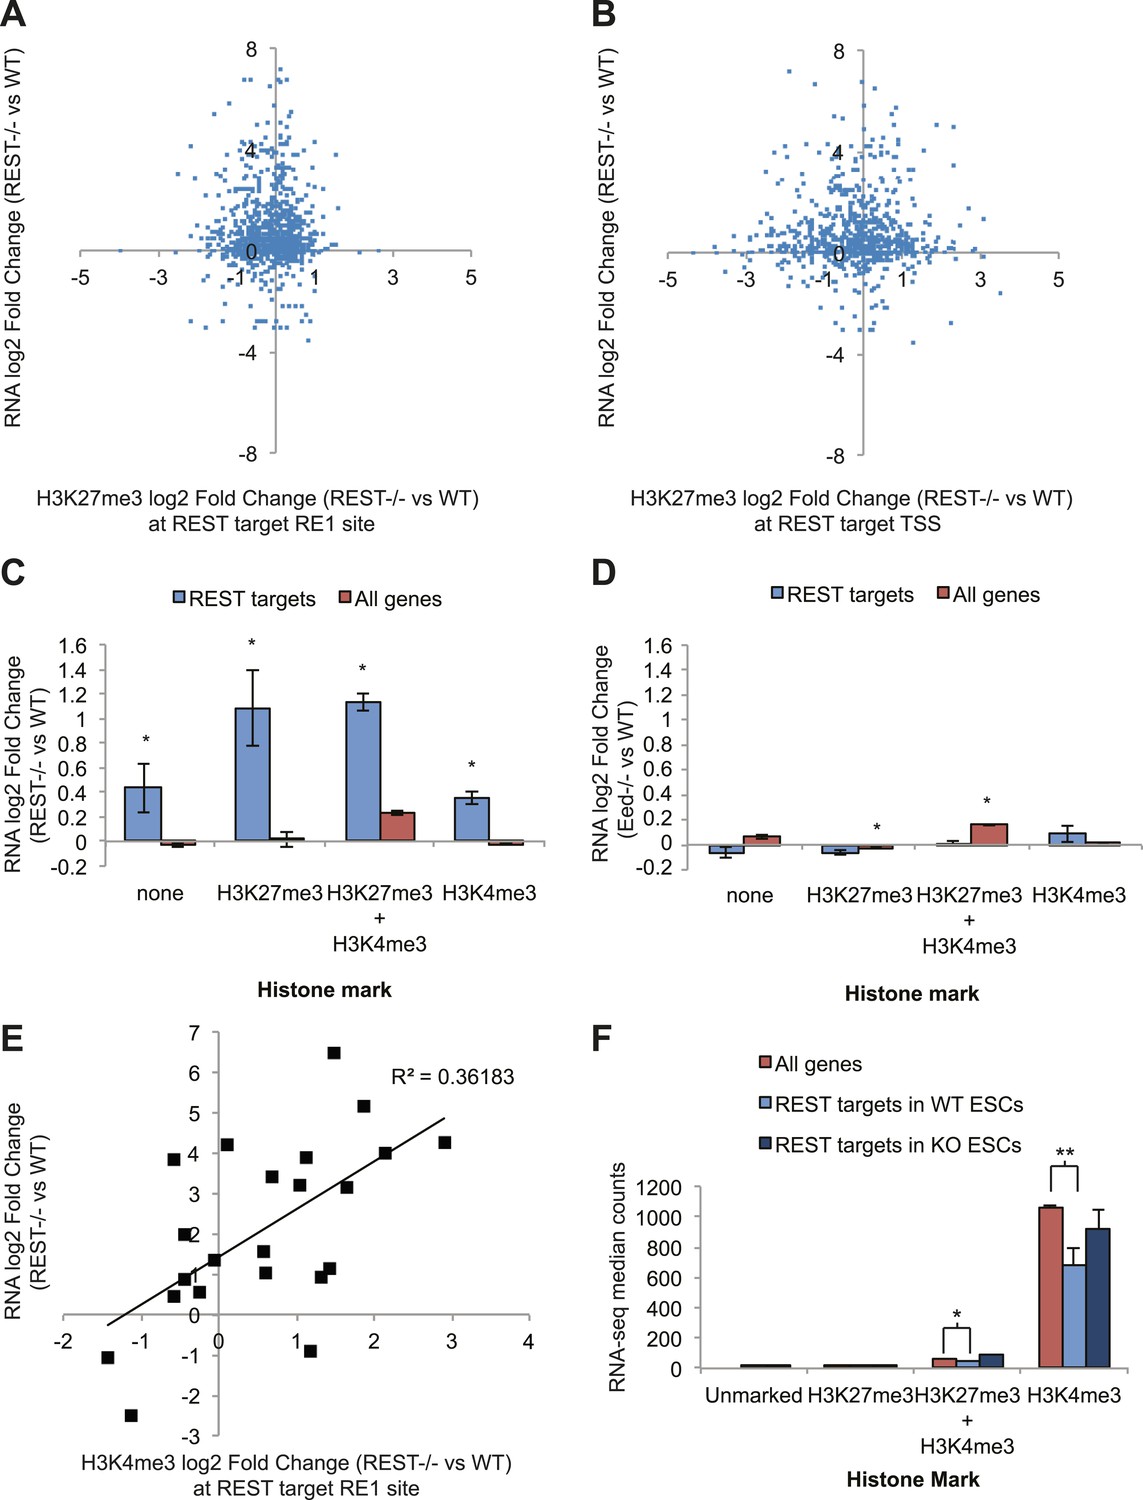
REST-dependent changes in expression of REST targets are correlated significantly with REST-dependent changes in H3K4me3, not H3K27me3.
(A) RNA-seq log2(Fold Change) results for Rest−/− ESCs are not correlated with changes in H3K27me3 levels at REST sites or (B) REST target transcriptional start sites (TSS). (C) All REST target genes are de-repressed in Rest−/− ESCs regardless of H3K27me3 or H3K4me3 status. (D) In contrast, REST targets show no transcriptional changes in Eed−/− ESCs, which have highly reduced levels of H3K27me3, and genes with this mark show significant increases in expression (p < 0.005). (E) Changes in H3K4me3 enrichment in Rest−/− ESCs strongly correlate with REST target gene expression changes (p < 0.01). (F) Expression levels of H3K4me3-marked REST target genes are significantly reduced relative to H3K4me3-marked genes and de-repressed in Rest−/− ESCs (*p < 0.05, **p < 0.001).
Figure 4 with 1 supplement

REST antagonizes H3K4me3 in ESCs through histone deacetylase activity.
(A) Only treatment with the histone deacetylase inhibitor trichostatin-A (TSA) results in the increased H3K4me3 enrichment seen in Rest−/− ESCs. The active Oct4 and GAPDH promoter regions that lack RE1 sites were included as control regions enriched for H3K4me3. (B) Changes in H3K4me3 enrichment at RE1 sites due to the loss of REST are significantly correlated with those due to TSA treatment (p < 0.01). (C) Microarray analysis reveals that HDAC inhibition by trichostatin-A (TSA) preferentially de-represses REST targets, unlike the loss of G9a or Kdm1a. (D) Changes in expression of select REST target genes due to REST loss significantly correlate with changes in expression due to HDAC inhibition with TSA (p < 0.001).
Figure 4—figure Supplement 1
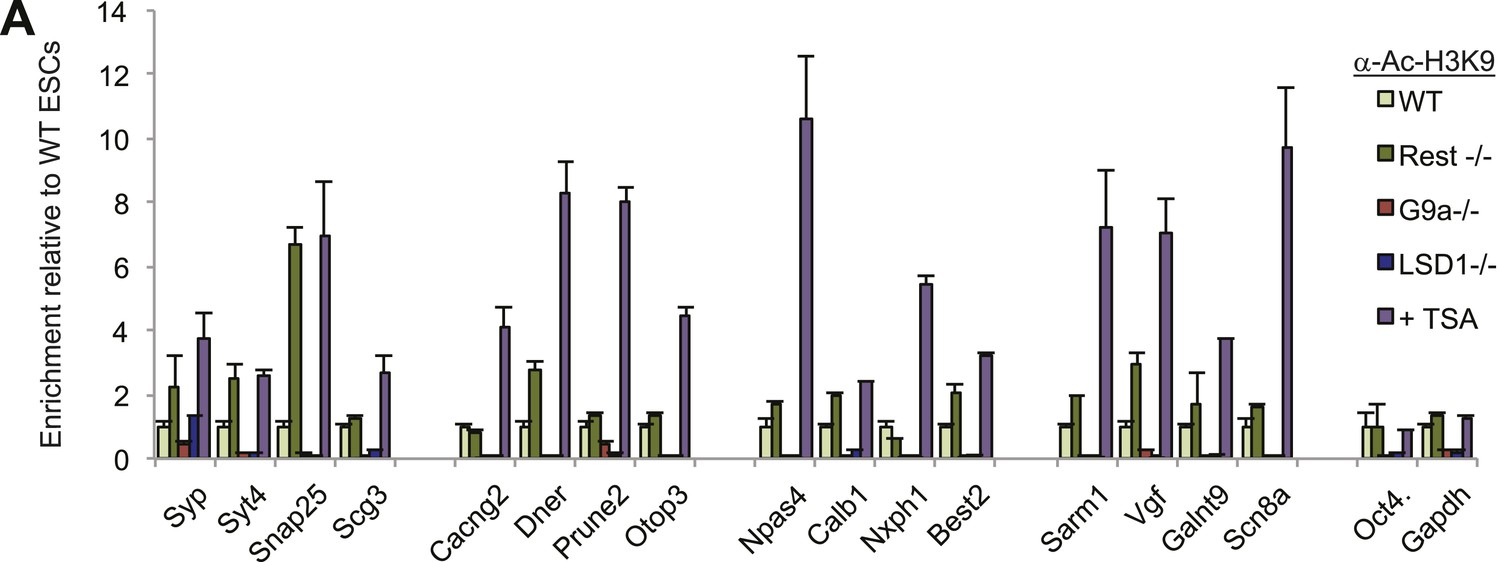
H3K9ac levels increase after TSA treatment.
(A)H3K9ac enrichment is increased after treatment with histone deacetylase inhibitor trichostatin-A (TSA) but not when other co-factors are eliminated from the REST complex.
Tables
Table 1
Co-factors identified within REST complexes were purified from ESCs
| Functional | Experiment 1 | Experiment 2 | Experiment 3 | ||||
|---|---|---|---|---|---|---|---|
| category | Gene | BioT REST | Control | BioT REST | Control | BioT REST | Control |
| Bait | REST | 41 | 37 | 27 | |||
| Corepressor | Rcori | 4 | 8 | 4 | |||
| Rcor2 | 8 | 2 | 19 | 3 | 8 | ||
| Sin3a | 8 | 11 | 6 | ||||
| Histone tail | HDAC1 | 11 | 12 | 7 | 3 | ||
| modifying | HDAC2 | 7 | 9 | 2 | 4 | ||
| enzyme | LSD1 | 18 | 26 | 21 | 3 | ||
| Prmt5 | 2 | 2 | 2 | ||||
| Wdr5 | 3 | 2 | |||||
| Ehmt2/G9a | 5 | 18 | 8 | ||||
| Ehmti | 4 | 6 | |||||
| Wiz | 4 | 6 | |||||
| Adaptor | Cdyl | 5 | 5 | 3 | |||
| Cdyl2 | 3 | 3 | |||||
| Chromatin | Smarca5 | 3 | 4 | 5 | 2 | ||
| remodeler | Supt16h | 3 | 4 | 4 | 6 | ||
| Ssrpi | 3 | 2 | |||||
| Other | Gata2b | 3 | 2 | ||||
| repressor | MBD3 | 2 | 4 | ||||
| F-box | Fbxwi 1 | 2 | 9 | 4 | |||
| protein | Btrc | 2 | 6 | ||||
| Transposase | Lin28A | 4 | 2 | ||||
| Trim71 | 2 | 2 | |||||
| DNA | Mdd | 2 | 2 | ||||
| binding | Bclafi | 2 | 2 | ||||
| Utf1 | 2 | 3 | |||||
| Unclear | Bxdc2 | 2 | 2 | 3 | |||
| D1Pas1 | 8 | 4 | 11 | ||||
| Gcdh | 3 | 6 | 2 | ||||
| Pdcd11 | 2 | 4 | 2 | ||||
| Pop1 | 2 | 2 | 2 | ||||
| Wwox | 2 | 4 | |||||
| Pura | 3 | 2 | |||||
| Dimti | 2 | 2 | |||||
-
Proteins are listed were identified in all streptavidin purifications of biotin-tagged REST (3 out of 3) but not represented in more than one of the negative control samples. Columns list the functional category, protein symbol, and the number of unique peptides detected in REST and negative control purifications.
-
Table 1—Source data 1
REST-bound genomic regions with repeated consensus RE1 motifs.
Columns list the chromosome and base pair coordinates (Region Start & Region End) of the REST-binding domain identified by PeakRanger analysis of ChIP-Seq read distribution. RE1 Start and RE1 End columns give the coordinates corresponding to the positions of individual RE1 motifs found by FIMO within the corresponding region. Orientation column lists whether the RE1 motif is on the forward (+) or reverse (−) DNA strand, and the p-value column gives the calculated log-odds score from the comparison of a discovered motif to a position weighted matrix corresponding to the full consensus RE1 motif.
- https://doi.org/10.7554/eLife.04235.004
Table 2
REST-associated genes with significant changes in H3K27me3 levels were measured in Rest−/− ESCs
| Gene Symbol | Gene Name | Change in Rest−/− ESC |
|---|---|---|
| Prune2 | Prune homolog 2 | 2.1 |
| Fosb | FBJ osteosarcoma oncogene B | 2.0 |
| Mast1 | Microtubule associated serine/threonine kinase 1 | 1.8 |
| Celf4 | Bruno-like 4, RNA binding protein | 1.7 |
| Kiaa1152 | Uncharacterized protein C14orf118 homolog | 1.7 |
| Dner | Delta/notch-like EGF-related receptor | 1.6 |
| Cacng2 | Stargazin | 1.6 |
| Bdnf | Brain derived neurotrophic factor | 1.6 |
| Hes3 | Hairy and enhancer of split 3 | 1.6 |
| Otop3 | Otopetrin 3 | 1.5 |
| A330050F15Rik | Uncharacterized protein LOC320722 | 1.5 |
| Skor2 | SKI family transcriptional corepressor 2 | 1.4 |
| Nmnat2 | Nicotinamide nucleotide adenylyltransferase 2 | −1.3 |
| Cnnm1 | Cyclin M1 | −1.3 |
| Cabp1 | Calcium binding protein 1 | −1.5 |
| Kcnb1 | K+ voltage gated channel, Shab-related subfamily | −1.6 |
| Celsr3 | Flamingo homolog 1 | −1.7 |
| Mapt | Microtubule-associated protein tau isoform a | −1.7 |
| Bsn | Bassoon | −2.2 |
| Vgf | VGF nerve growth factor inducible | −4.4 |
| Sarm1 | Sterile alpha and TIR motif containing 1 | −12.1 |
| Galnt9 | Polypeptide Gal NAc transferase 9 | Loss |
| Smpd3 | Sphingomyelin phosphodiesterase 3 | Loss |
| Scn8a | Na2+ voltage-gated channel, type VIM, alpha | Loss |
-
List of genes located near REST bound regions that were associated with PRC2 in WT ESCs and showed a significant difference in H3K27me3 enrichment relative to Rest−/− ESCs.
Download links
A two-part list of links to download the article, or parts of the article, in various formats.
Downloads (link to download the article as PDF)
Open citations (links to open the citations from this article in various online reference manager services)
Cite this article (links to download the citations from this article in formats compatible with various reference manager tools)
Polycomb- and REST-associated histone deacetylases are independent pathways toward a mature neuronal phenotype
eLife 3:e04235.
https://doi.org/10.7554/eLife.04235


