Structural basis of diverse membrane target recognitions by ankyrins
- Hong Kong University of Science and Technology, Hong Kong
- South University of Science and Technology of China, China
- Howard Hughes Medical Institute, Duke University Medical Center, United States
- Duke University Medical Center, United States
Figures
Figure 1
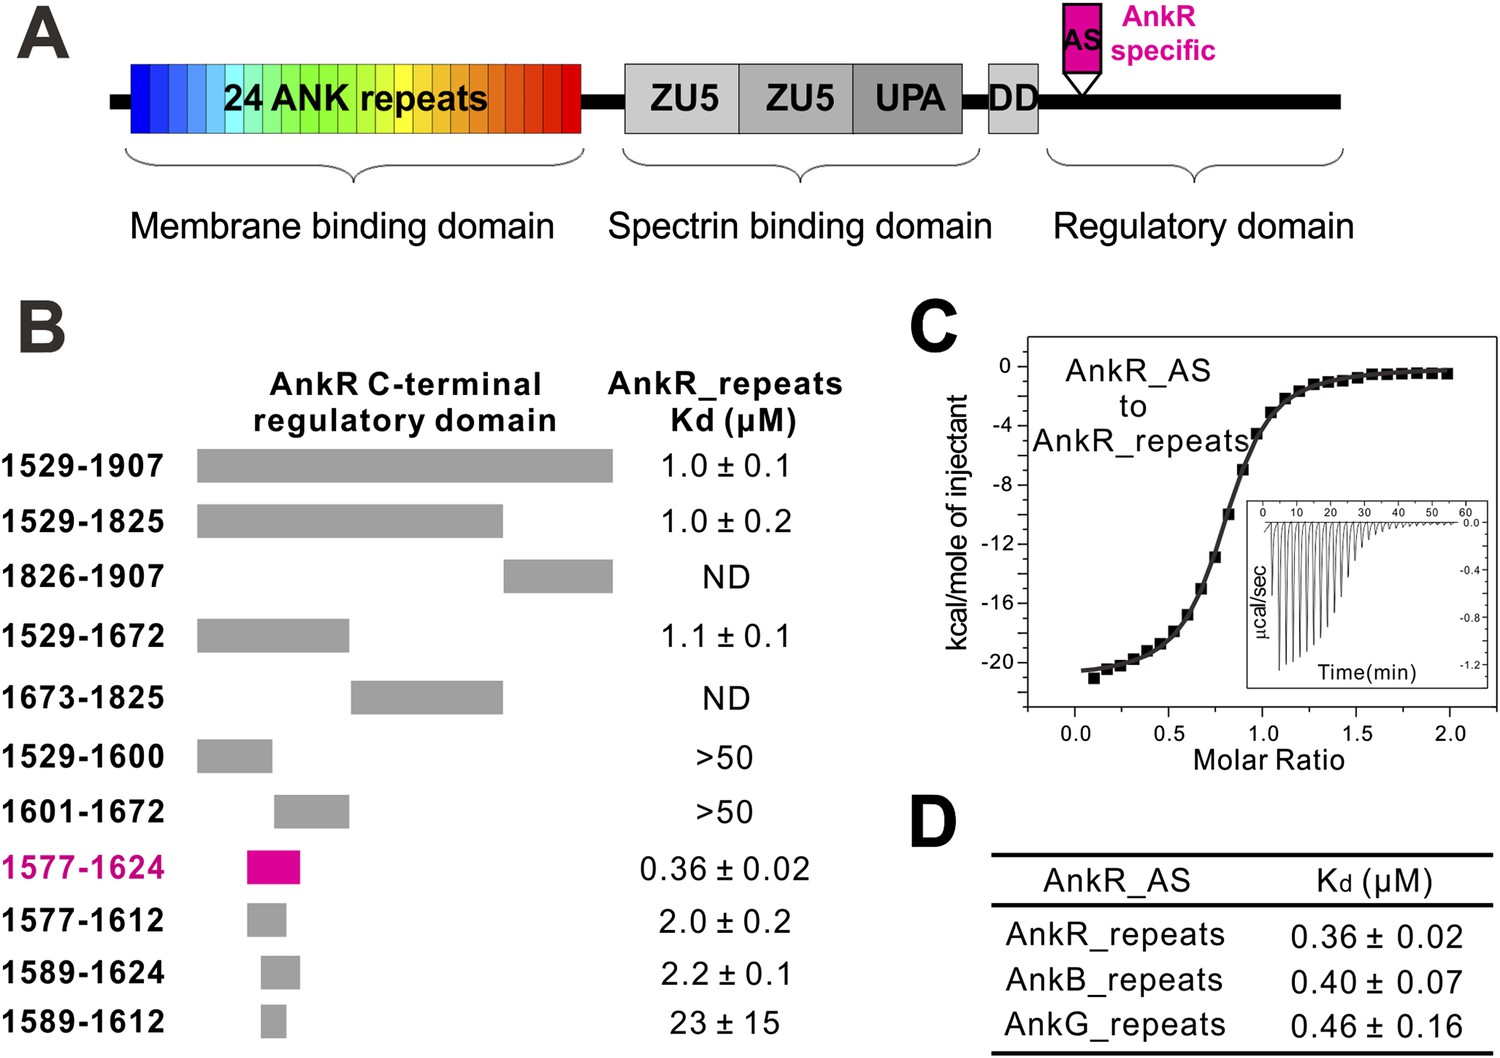
Identification of a 48-residue auto-inhibitory segment that binds to ANK repeats.
(A) Schematic diagrams showing the domain organization of ankyrins. The AnkR-specific auto-inhibitory segment (AS) is indicated within the C-terminal regulatory domain. The same color codes (24 ANK repeats in rainbow and the AnkR_AS in magenta) are used throughout the paper unless otherwise stated. (B) ITC-based mapping of the minimal AnkR_repeats binding region in the C-terminal regulatory domain. The minimal and complete AS identified is highlighted in magenta. ‘ND’ denotes that these constructs had no detectable binding to ANK repeats. (C) ITC-derived binding curve of AnkR_AS titrated to AnkR_repeats. (D) The binding affinities between AS and ANK repeats of the three ankyrin isoforms.
Figure 2 with 3 supplements
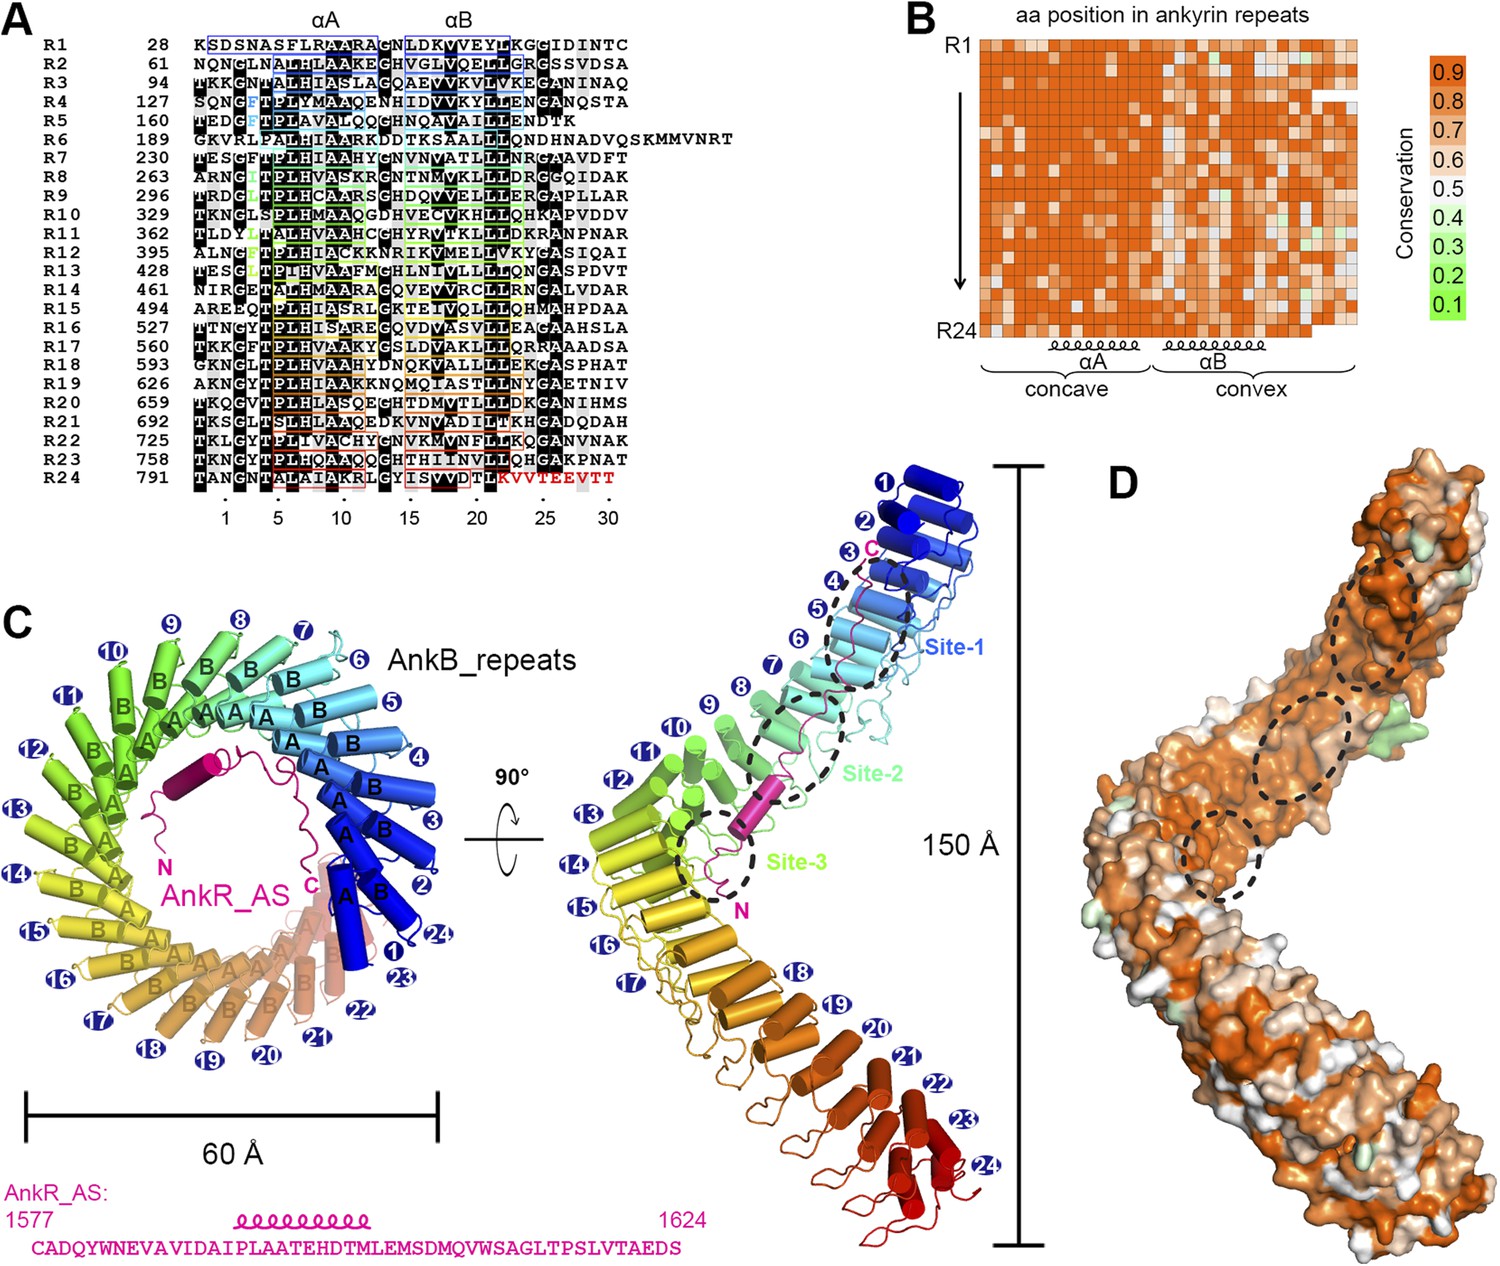
Vertebrate ANK repeats of ankyrins share the same architecture and target binding properties.
(A) Sequence alignment of the 24 ANK repeats of human AnkB. Similar and identical residues are labeled gray and black, respectively. The helix formation residues are boxed with corresponding colors. The hydrophobic residues selected for mutation studies described in Figure 3 and onwards are labeled with corresponding colors. The last nine amino acids labeled in red from R24 are used as the C-terminal capping sequence for designed truncation mutants of various lengths of ANK repeats used in this study. (B) Sequence conservation map of the 24 ANK repeats of vertebrate ankyrins. The conservation score for each residue is calculated based on the sequences of vertebrate ankyrins aligned in Figure 2—figure supplement 3 through the Scorecons server (http://www.ebi.ac.uk/thornton-srv/databases/cgi-bin/valdar/scorecons_server.pl). The position of each residue is the same as that shown in panel A. (C) Overall structure of the ANK repeats/AS complex viewed from the top (left) and side (right). The three AS-binding surfaces on ANK repeats are circled with black dashed ovals. The sequences of AnkR_AS are listed below. (D) Surface conservation map of ANK repeats viewed from the side. The conservation map is derived from the ankyrins from worm to human as shown in Figure 2—figure supplement 3 with the same color coding scheme as in panel (B).
Figure 2—figure supplement 1

The fusion of AnkR_AS to the N-terminus AnkB_repeats does not alter the conformation of the ANK repeats/AS complex.
(A) 1H-13C HSQC spectrum showing the 13CH3-Met-labeled, covalently linked AnkR_AS-AnkB_repeats fusion protein. The resolved Met methyl groups are labeled with blue asterisks. (B) Superposition plot of the 1H-13C HSQC spectra of the covalently linked (red) and thrombin-cleaved ANK repeats/AS complex, showing that the two spectra are essentially identical. The data also indicate that the fusion of AS to the N-terminal of ANK repeats, a step necessary for obtaining crystals of the complex, does not alter the conformation of the complex.
Figure 2—figure supplement 2

Crystallographic characterization of the ANK repeats/AS structure.
(A) Electron density (2Fo-Fc) map of ANK repeats/AS structure superimposed on the Cα model. The map is contoured at 1.5 σ. Insert, the Se-anomalous difference map contoured at 4 σ shows four Se peaks around R7–9 of the ANK repeats, indicating that three Met residues (Met1601, Met1604, and Met1607) of AnkR_AS are located at site 2 of the ANK repeats, which also contains a Met (Met338). (B) The 2Fo-Fc map of AnkR_AS contoured at 1 σ with the final structural model superimposed. The densities of three selected side-chain interactions from the AS and ANK repeats are shown in the inserts.
Figure 2—figure supplement 3
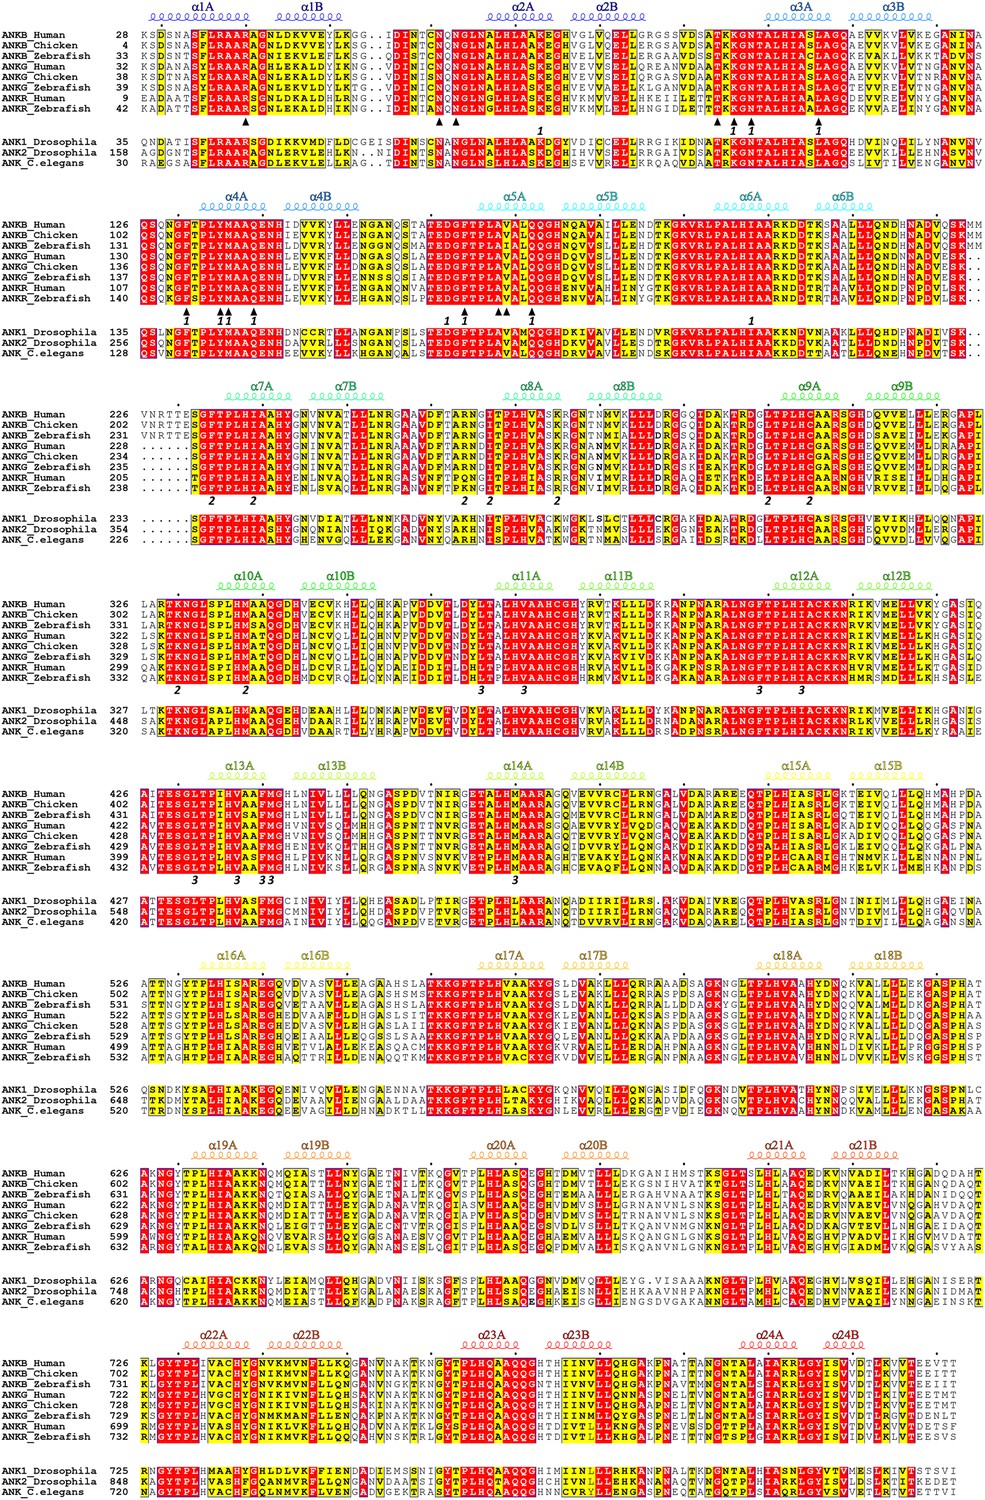
Amino acid sequence alignment of ANK repeats of ankyrins.
In this alignment, residues that are absolutely conserved and highly conserved are highlighted in red and yellow, respectively. The secondary structural elements are indicated above the alignment. The interface residues at sites 1, 2, and 3 for the binding of the ANK repeats to AnkR_AS are labeled with ‘1’, ‘2’, and ‘3’, respectively. The interface residues involved in the ANK repeats/Nav1.2_ABD-C interaction are marked by triangles. The vertebrate ankyrin ANK repeats are aligned together, and used to derive the ANK repeats conservation plot shown in Figure 2B.
Figure 3 with 4 supplements

Structural and biochemical characterizations of target binding properties of ANK repeats.
(A–C) Stereo views showing the detailed ANK repeats/AS interfaces of the three binding sites shown in Figure 1E. Hydrogen bonds and salt bridges are indicated by dashed lines. (D) Cartoon diagram of the first 14 repeats of the 24 ANK repeats. Different truncations used for the biochemical analyses are indicated below. Mutations of hydrophobic residues in the three AS binding sites are labeled. Red stars indicate the locations of the mutation sites. (E) Example ITC curves showing the bindings of Nav1.2_ABD or Nfasc_ABD to the wild-type or mutant ANK repeats. (F) The dissociation constants of the binding reactions of various mutants of ANK repeats to Nav1.2 and Nfasc derived from the ITC-based assays.
Figure 3—figure supplement 1
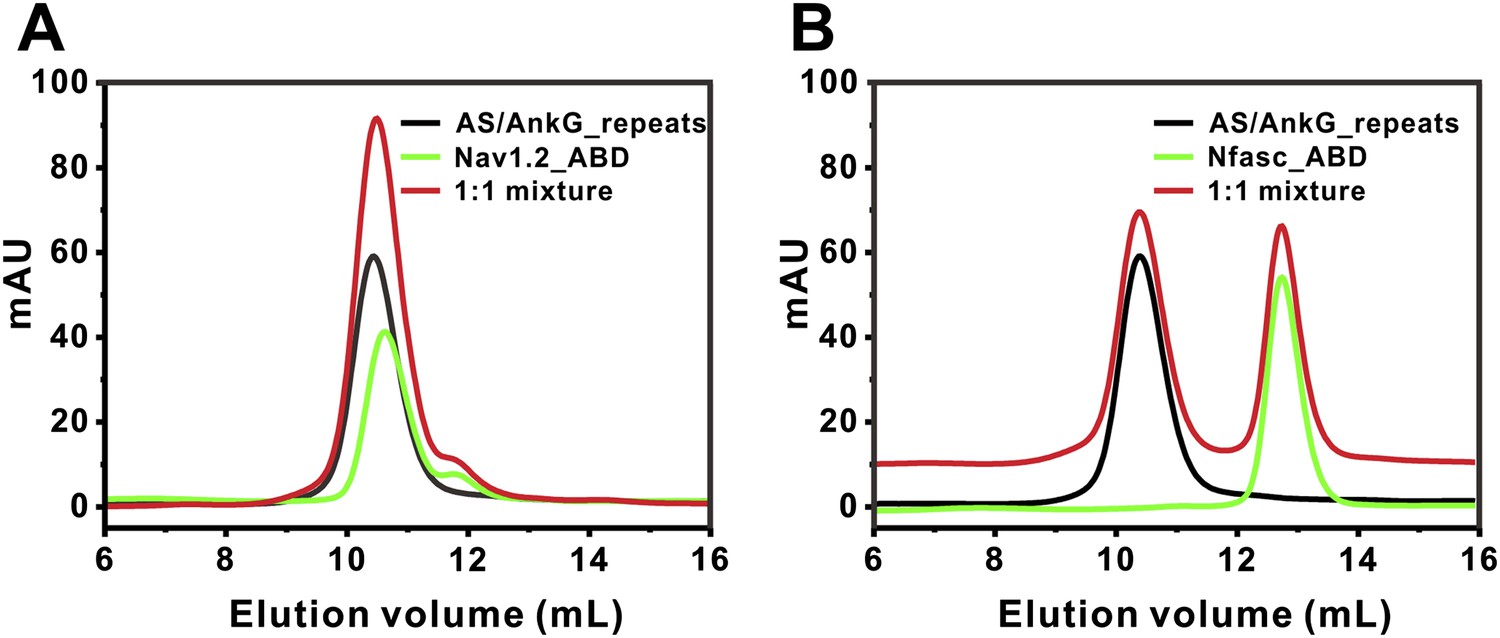
Analytical gel filtration analyses showing that binding of AS to AnkG_repeats prevents Nav1.2 and Nfasc ABDs from binding to AnkG_repeats.
The AS was fused to the N-terminus of AnkG_repeats. No complex peaks formed between the fusion protein and Nav1.2 ABD (A) or Nfasc ABD (B), as the mixture of the two proteins in each experiment did not change their elution volumes compared to that of each isolated protein. For clarity, the curve of the mixture in (B) was up-shifted by 10 mAU.
Figure 3—figure supplement 2
ITC-based analyses of the AnkG_repeats/Nfasc_ABD interaction.
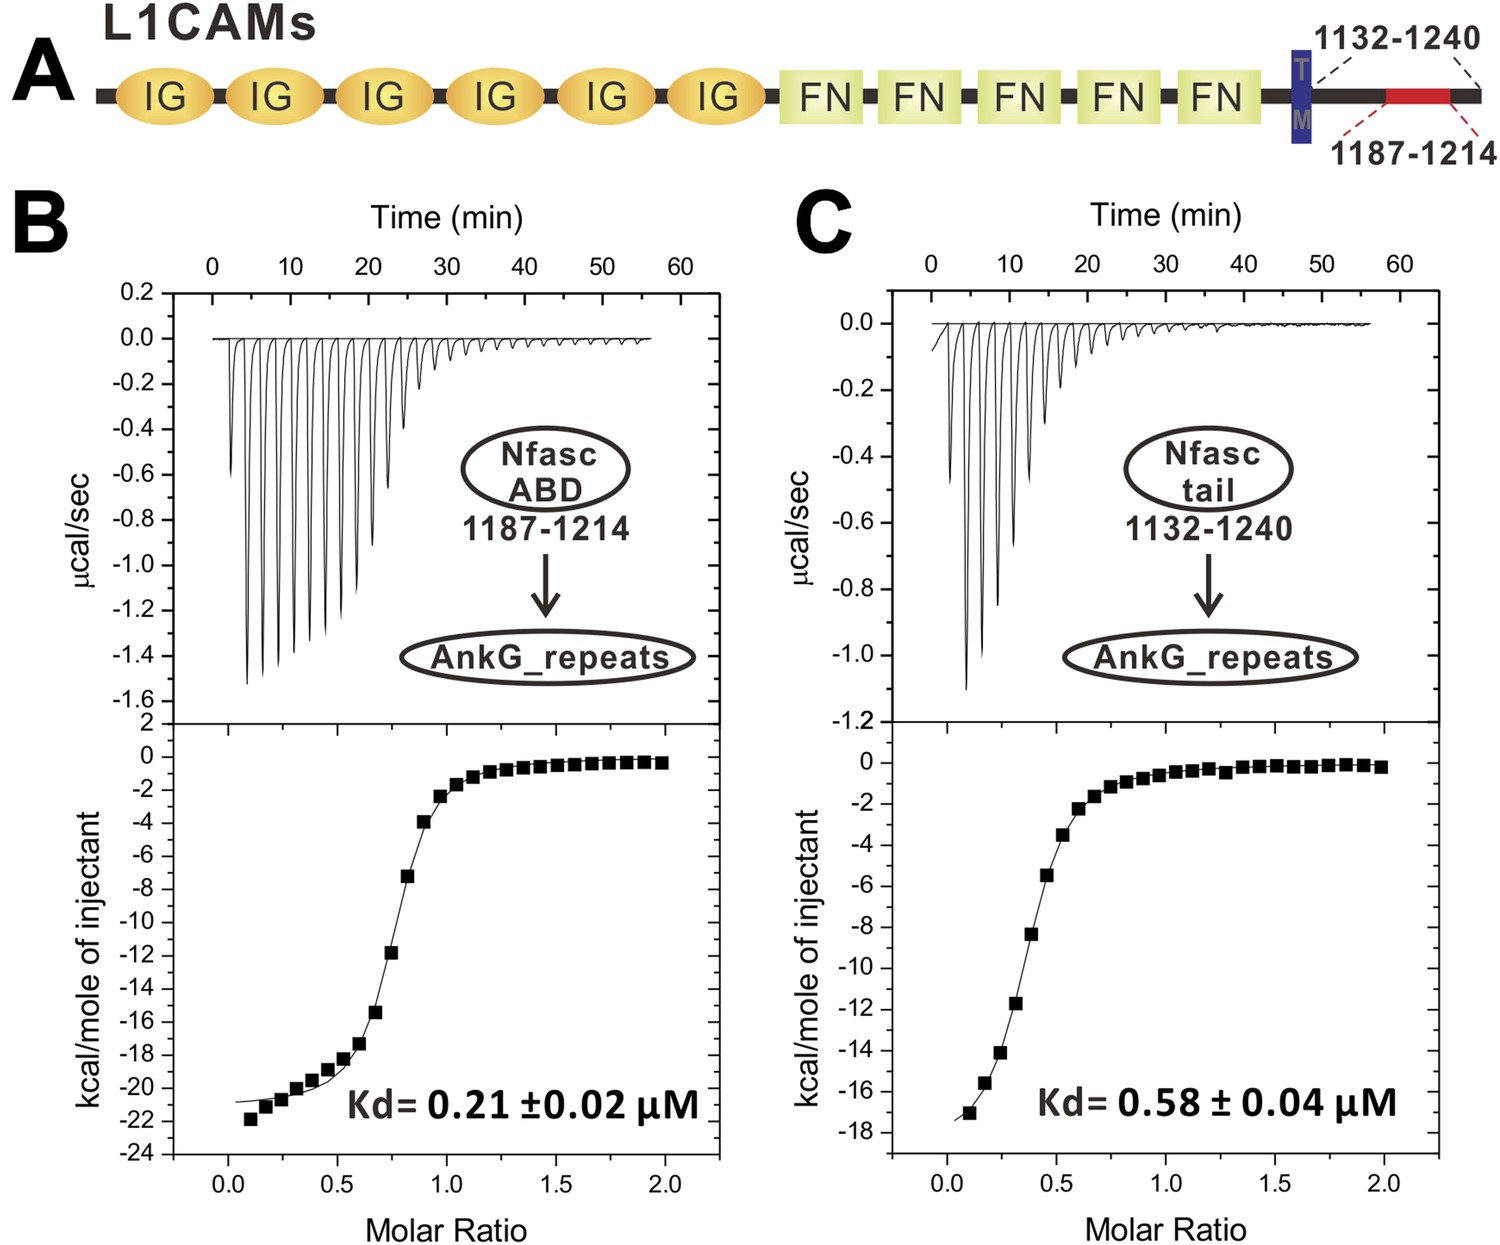
(A) Schematic diagram showing the domain organization of the L1-family cell adhesion molecules (L1CAMs). The labeled amino acid numbers correspond with mouse Nfasc used in this study. (B) ITC titration of ABD (1187–1214) to AnkG_repeats. (C) ITC titration of the entire cytoplasmic tail (1132–1240) to AnkG_repeats, showing that the segment corresponding to 1187–1214 encompasses the complete binding domain for AnkG_repeats.
Figure 3—figure supplement 3
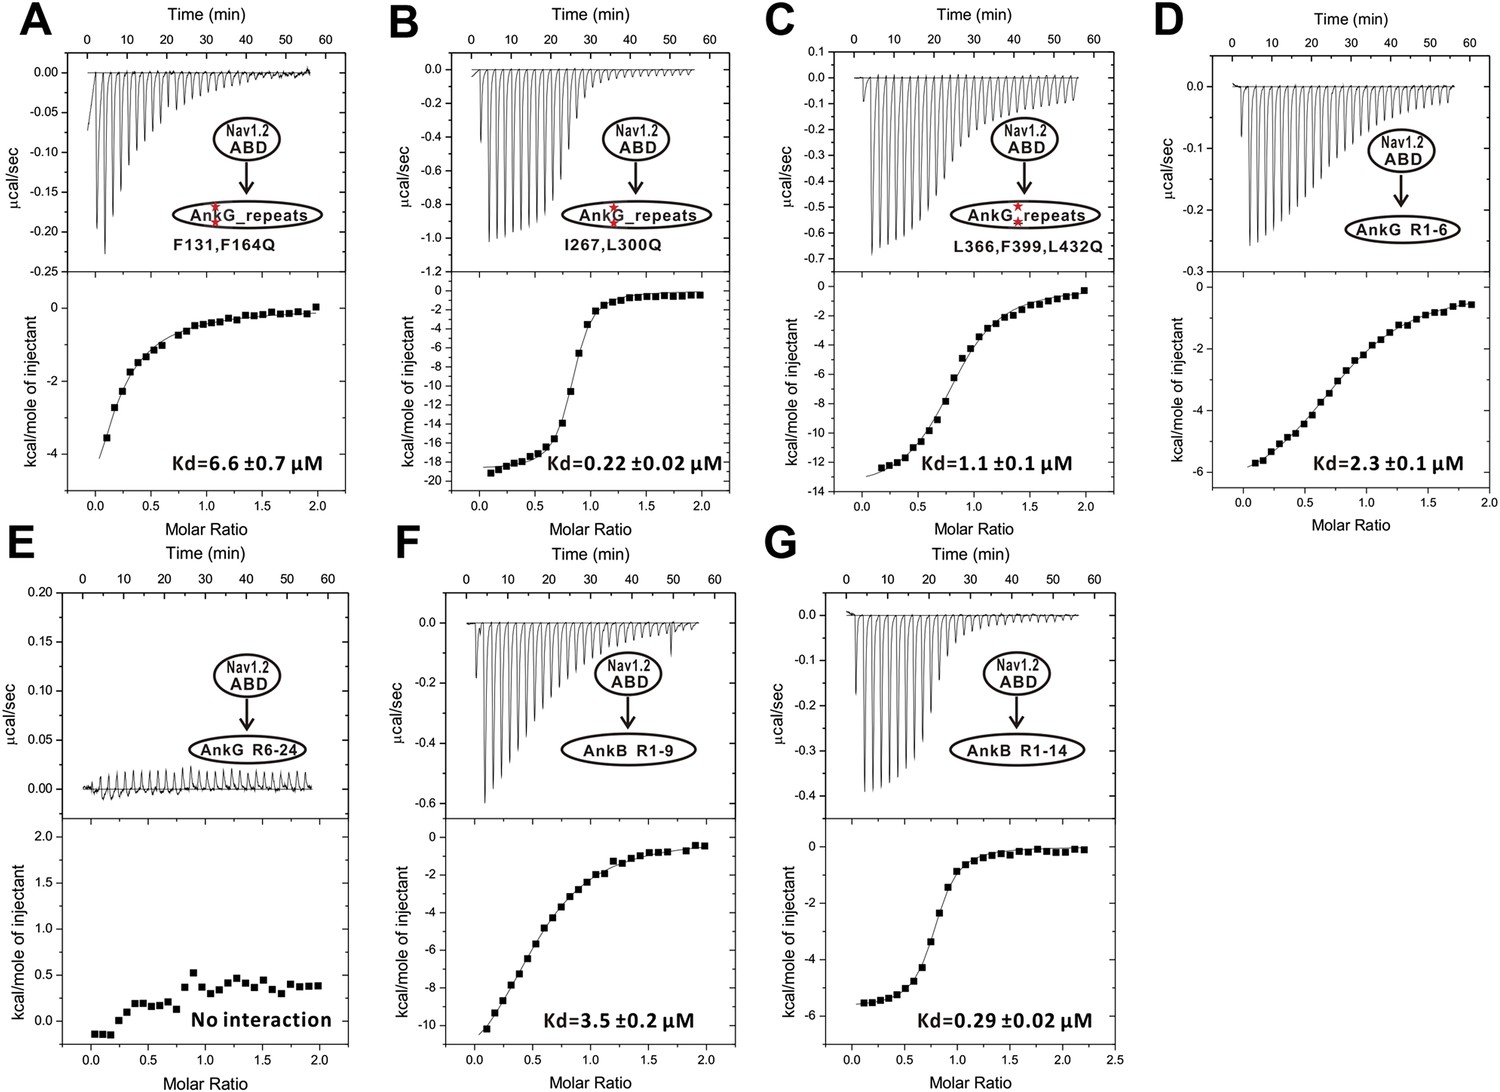
The ITC curves of the bindings of various ANK repeats to Nav1.2_ABD.
The red asterisks in panels A, B, and C denotes AnkG_repeats with point mutations as indicated“ after ”The ITC curves of the bindings of various ANK repeats to Nav1.2_ABD. The ANK repeat protein assayed in each experiment is indicated in each panel. The curves were used to derive the dissociation constants shown in Figure 3F.
Figure 3—figure supplement 4
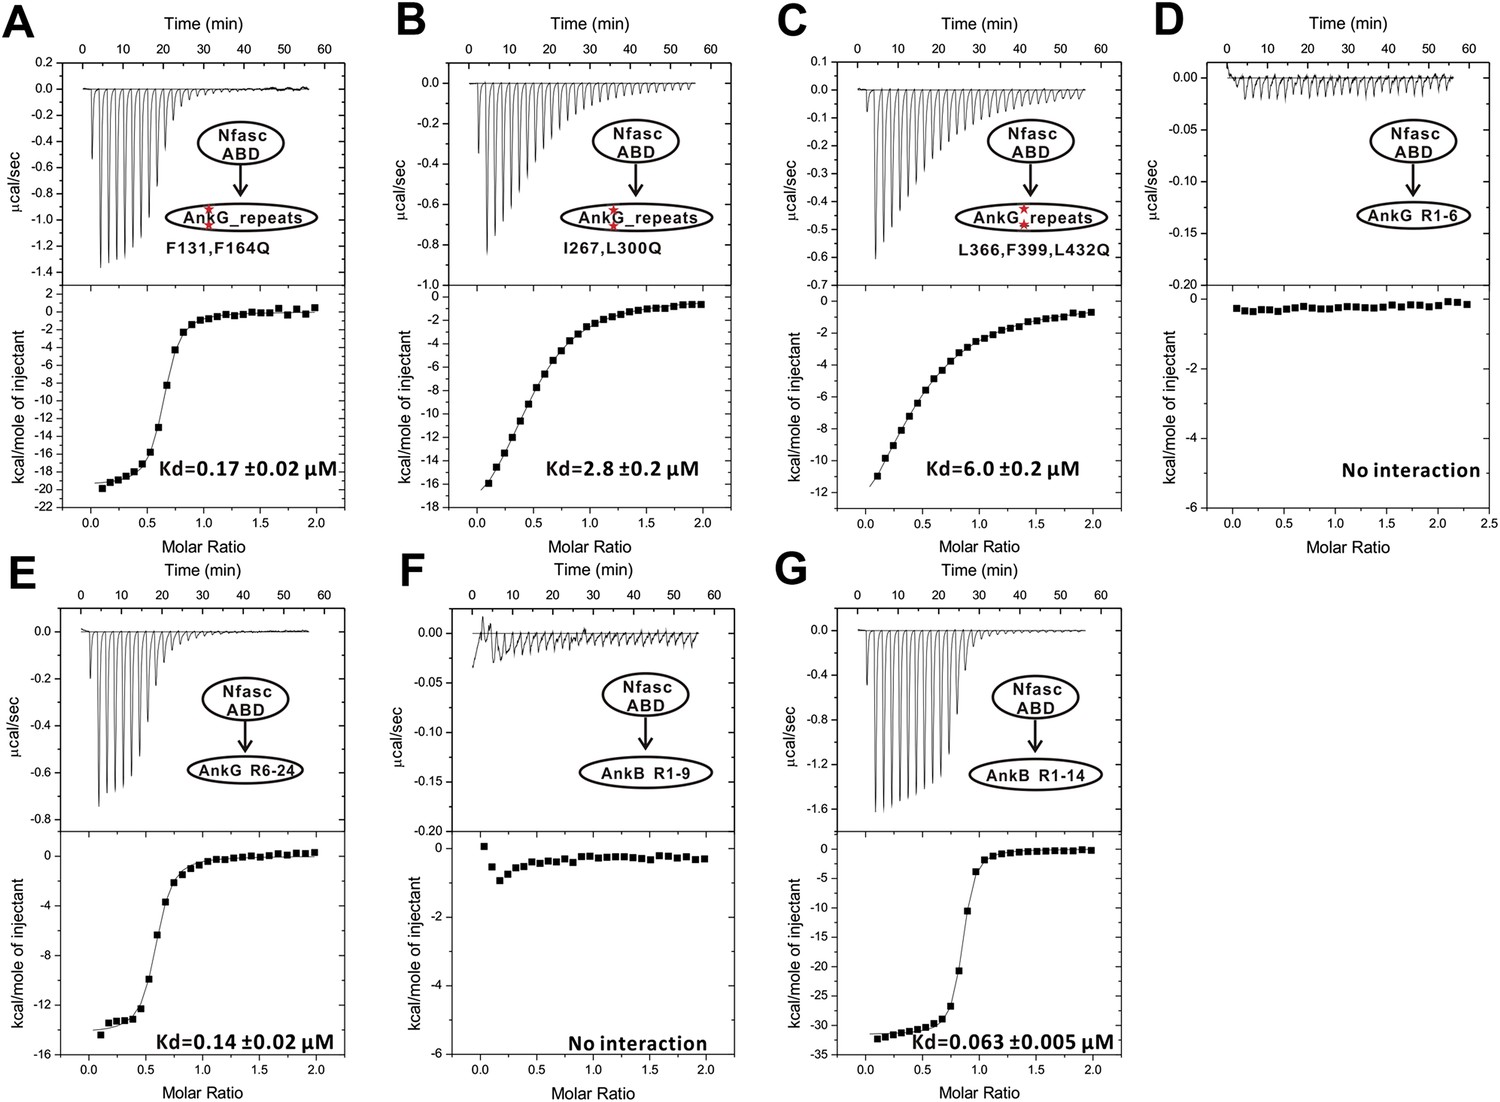
The ITC curves of the bindings of various ANK repeats to Nfasc_ABD.
The red asterisks in panels A, B, and C denotes AnkG_repeats with point mutations as indicated. The ANK repeat protein assayed in each experiment is indicated in each panel. The curves were used to derive the dissociation constants shown in Figure 3F.
Figure 4
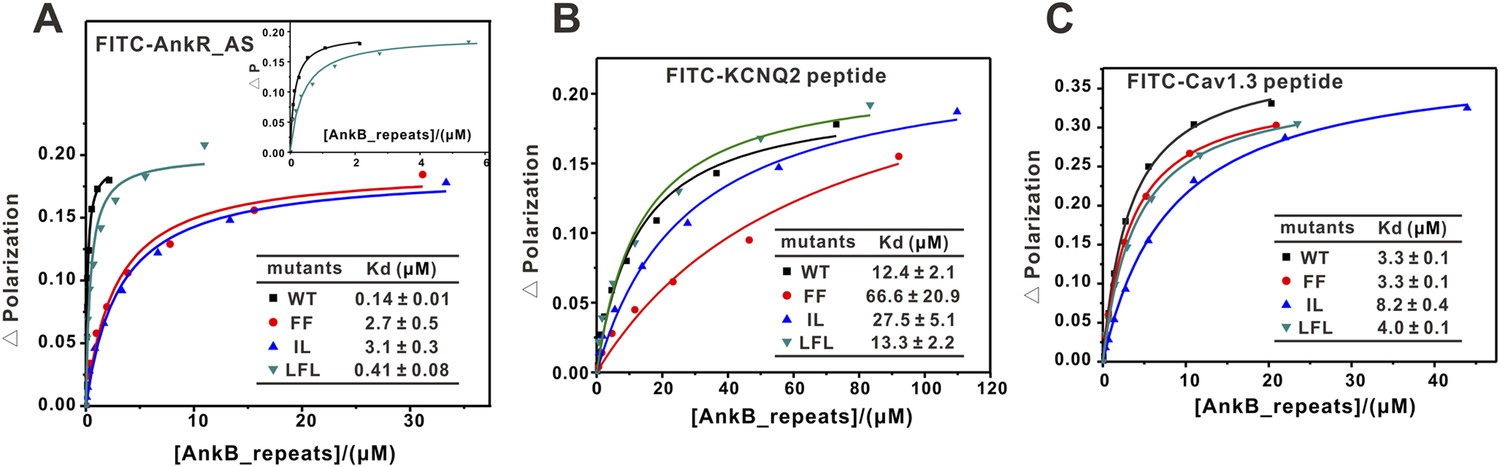
Fluorescence polarization-based measurement of the binding affinities of different targets to AnkB_repeats WT and its mutants.
(A) Fluorescence polarization-based measurement of the binding affinities of AnkR_AS peptide to AnkB_repeats WT and its mutants. The insert shows the expanded view of the binding curves of the AnkR_AS peptides to WT and LFL of AnkB_repeats. The binding affinity between AnkR_AS and AnkB_repeats WT measured through this experiment is slightly different from the ITC assay (0.14 μΜ vs 0.40 μΜ). This may be because of the different measuring system, but the overall affinity range is quite similar. (B) Fluorescence polarization-based measurement of the binding affinities of the KCNQ2 peptide to AnkB_repeats WT and its various mutants. (C) Fluorescence polarization-based measurement of the binding affinities of the Cav1.3 peptide to AnkB_repeats and its various mutants. The fitted binding affinities are shown within the corresponding figures.
Figure 5

Characterization of the interaction between Nav1.2 and AnkG_repeats.
(A) Schematic diagram showing the domain organization of the Nav1 family ion channels. The ABD is located within loop 2 linking the transmembrane helices II and III and separated into N and C parts according to the data below. (B) Table summarizing the ITC-derived affinities of the bindings of various loop 2 fragments to AnkG_repeats. (C) ITC curves of the bindings of Nav1.2_ABD* (upper left), ABD-N (upper right), and ABD-C (lower left) to ANK repeats, and Nav1.2_ABD-C binding to ANK repeats R1–6 (lower right), showing that ABD-C binds to site 1 of AnkG_repeats. (D) Amino acid sequence alignment of the ankyrin binding domains (ABD) of members of the voltage-gated sodium channel α-subunits (Nav1) family. The mouse Nav1.2 used in this study was aligned with the human family members. Residues that are absolutely conserved and highly conserved are highlighted in red and yellow, respectively. The critical Glu1112 for the binding of Nav1.2 to the ANK repeats is indicated with a star. Other residues participating in the binding with the ANK repeats are indicated by triangles. The residues responsible for binding to site 1 of AnkG_repeats are completely conserved in all members of the Nav1 family, indicating that all sodium channels can bind to ankyrins following the mode revealed in this study.
Figure 6 with 1 supplement
Site 1 of ANK repeats is a common binding site for Nav1.2 and other targets.
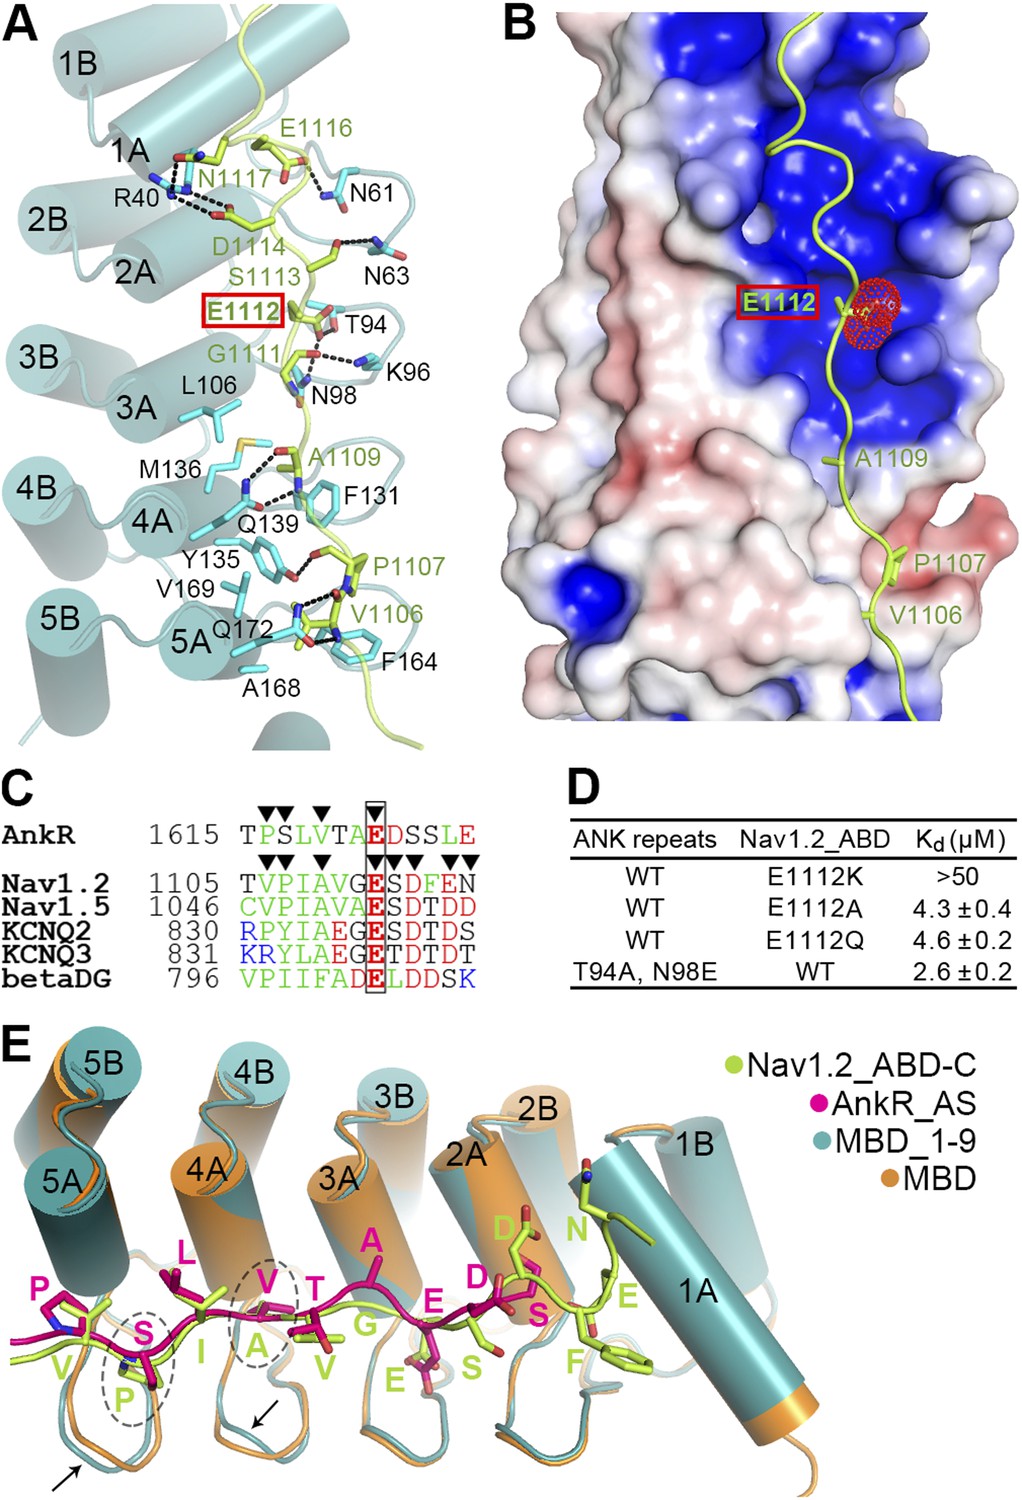
(A) Ribbon representation of the binding of Nav1.2_ABD-C (light green) to site 1 of ANK repeats (cyan). The interface residues are shown in the stick mode. Hydrogen bonds and salt bridges are indicated by dashed lines. The negatively charged Glu1112, critical for interacting with a positively charged surface formed by ANK repeats R2 and R3, is highlighted with a red box. (B) Charge potential surface of site 1 on the ANK repeats reveals a positively charged pocket important for anchoring of Glu1112 through charge complementation. The hydrophobic groove and the interacting residues from Nav1.2 are also shown. The surface diagram is drawn with the same orientation as in panel A. The electrostatic surface potentials were calculated by the APBS module embedded in PyMOL with the non-linear Poisson–Boltzmann equation and contoured at ±5 kT/e. (C) Amino acid sequence alignment of the site 1 binding sequences in various partners showing the similar sequence pattern, with the anchoring Glu boxed. The residues participating in site 1 binding are indicated by triangles. (D) Summary of the ITC-derived Kd values showing that Glu1112 is essential for the ANK repeats/Nav1.2 interaction. (E) Structural comparison of the ANK repeats site 1 bindings of AnkR_AS and Nav1.2_ABD-C showing that the two targets bind to ANK repeats with essentially the same mode. Subtle conformational differences in the finger loops R4 and R5 are indicated by arrows.
Figure 6—figure supplement 1
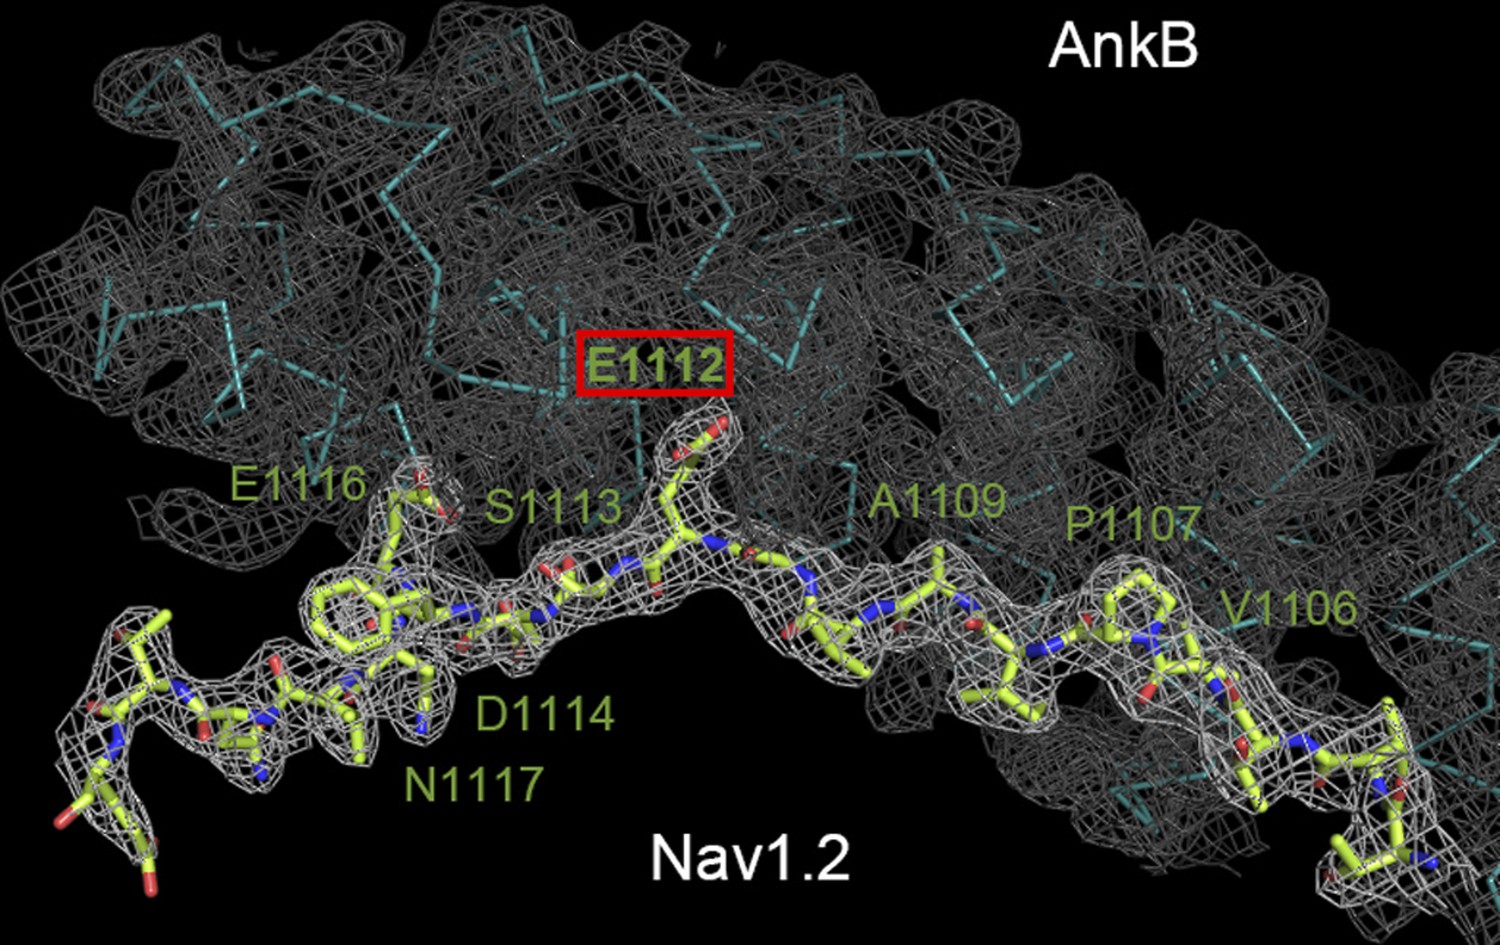
Crystallographic characterization of the ANK repeats/Nav1.2 structure.
Electron density map of the AnkB/Nav1.2 complex contoured at 1 σ with the final structural model superimposed is shown. The Nav1.2 peptide is shown as the stick model and the AnkB_repeats is shown as the Cα model.
Figure 7 with 1 supplement
Mutations of residues at the target binding groove affect 270 kDa AnkG's function at the AIS in neurons.
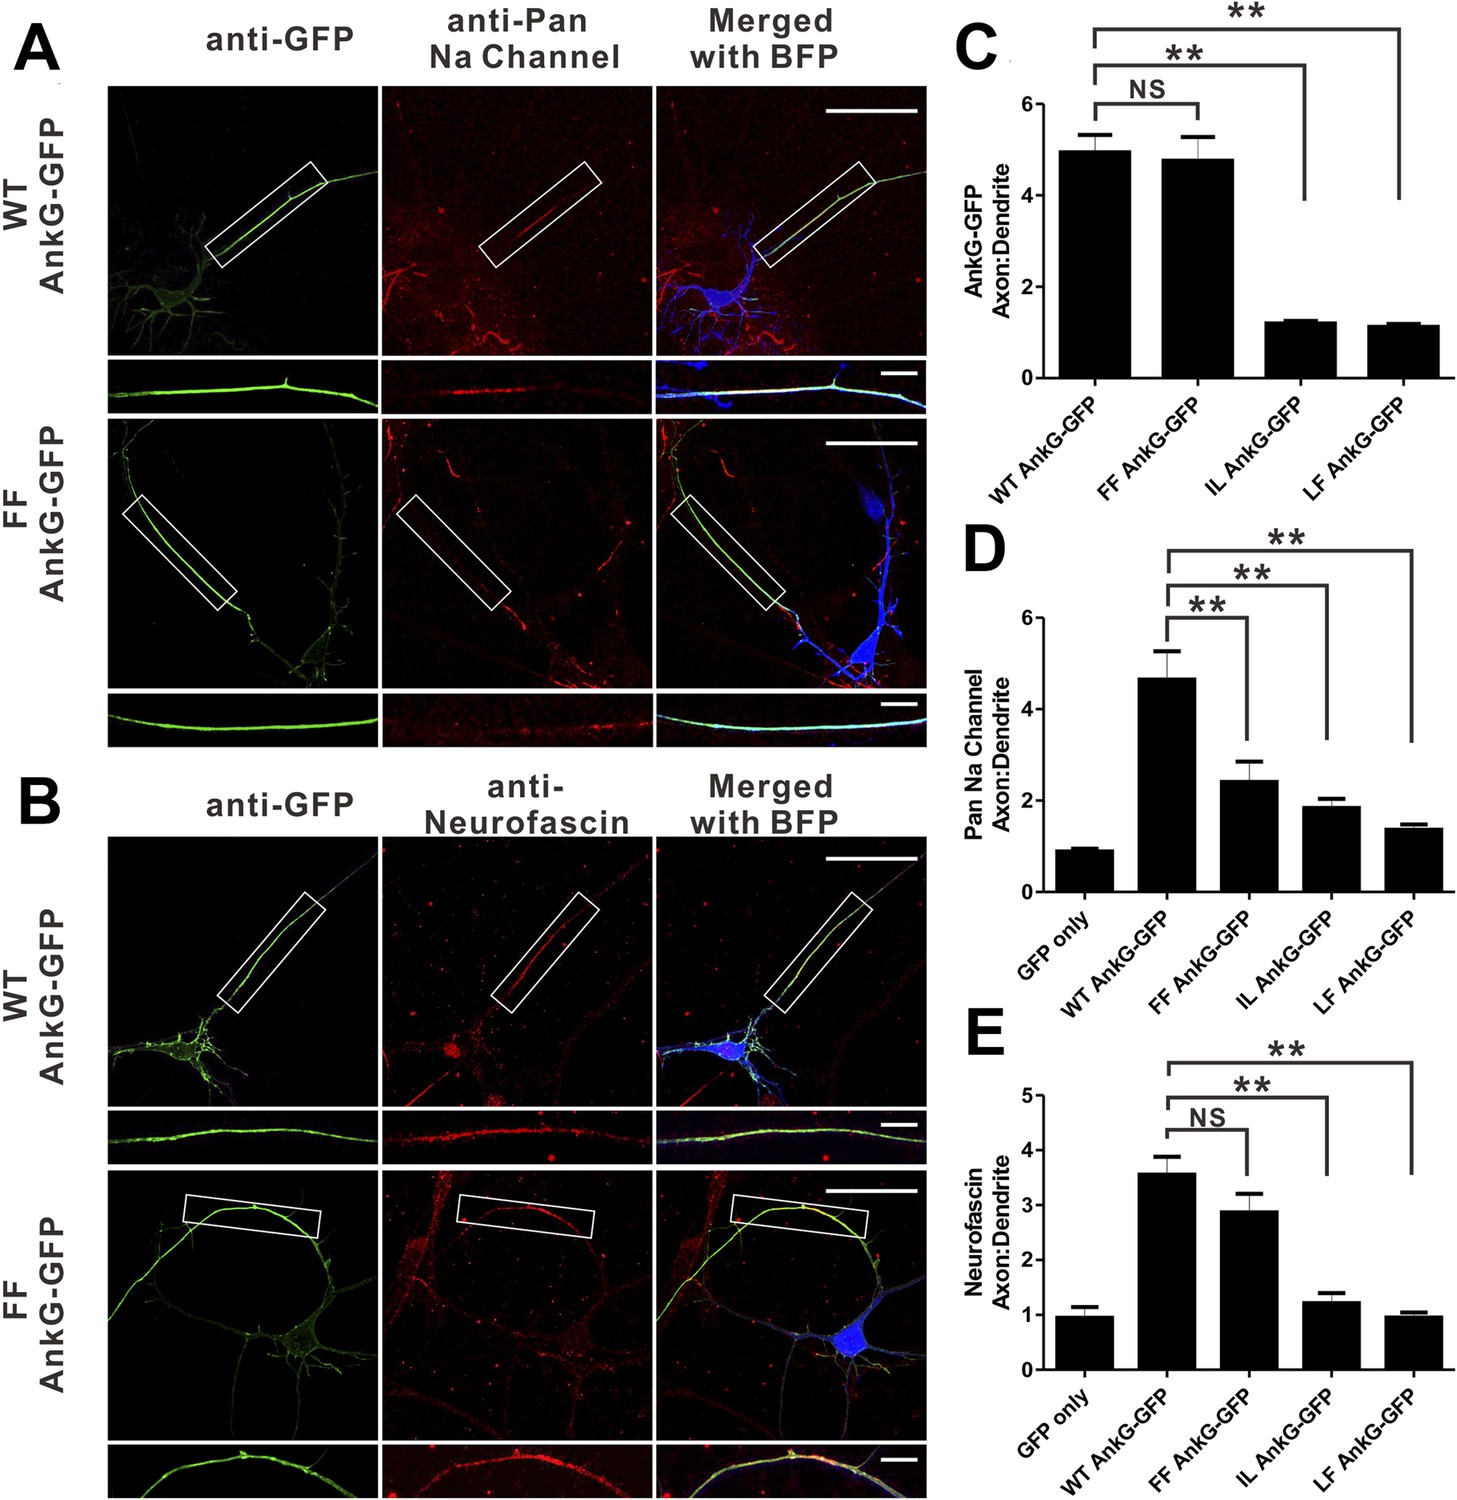
(A) WT 270 kDa AnkG-GFP effectively rescues AnkG self-clustering and clustering of sodium channels at the AIS. The FF mutant of AnkG is clustered at the AIS, but fails to rescue sodium channel clustering at the AIS. BFP marks the shRNA transfected neurons (scale bars, 50 µm). White boxes mark the axon initial segment, which is shown at a higher magnification below each image (scale bars, 10 µm). (B) Same as in panel A except that the red signals represent anti-neurofascin staining. (C) Quantification of anti-GFP fluorescence intensity ratio of axons to dendrites in cells depleted of endogenous 270/480 kDa AnkG and rescued with WT (n = 34), FF (n = 30), IL (n = 24), or LF (n = 24) AnkG-GFP. **p<0.05. Error bars, S.E. (D) Quantification of the anti-endogenous pan-sodium channels fluorescence intensity ratio of axons to dendrites in cells depleted of endogenous 270/480 kDa AnkG and rescued with GFP alone (n = 11), WT (n = 17), FF (n = 16), IL (n = 14), and LF (n = 10) AnkG-GFP. **p<0.05. Error bars, S.E. (E) Quantification of the anti-endogenous neurofascin fluorescence intensity ratio of axons to dendrites in cells depleted of endogenous 270/480 kDa AnkG and rescued with GFP alone (n = 6), WT (n = 17), FF (n = 14), IL (n = 10), and LF (n = 10) AnkG-GFP. **p<0.05. Error bars, S.E.
Figure 7—figure supplement 1
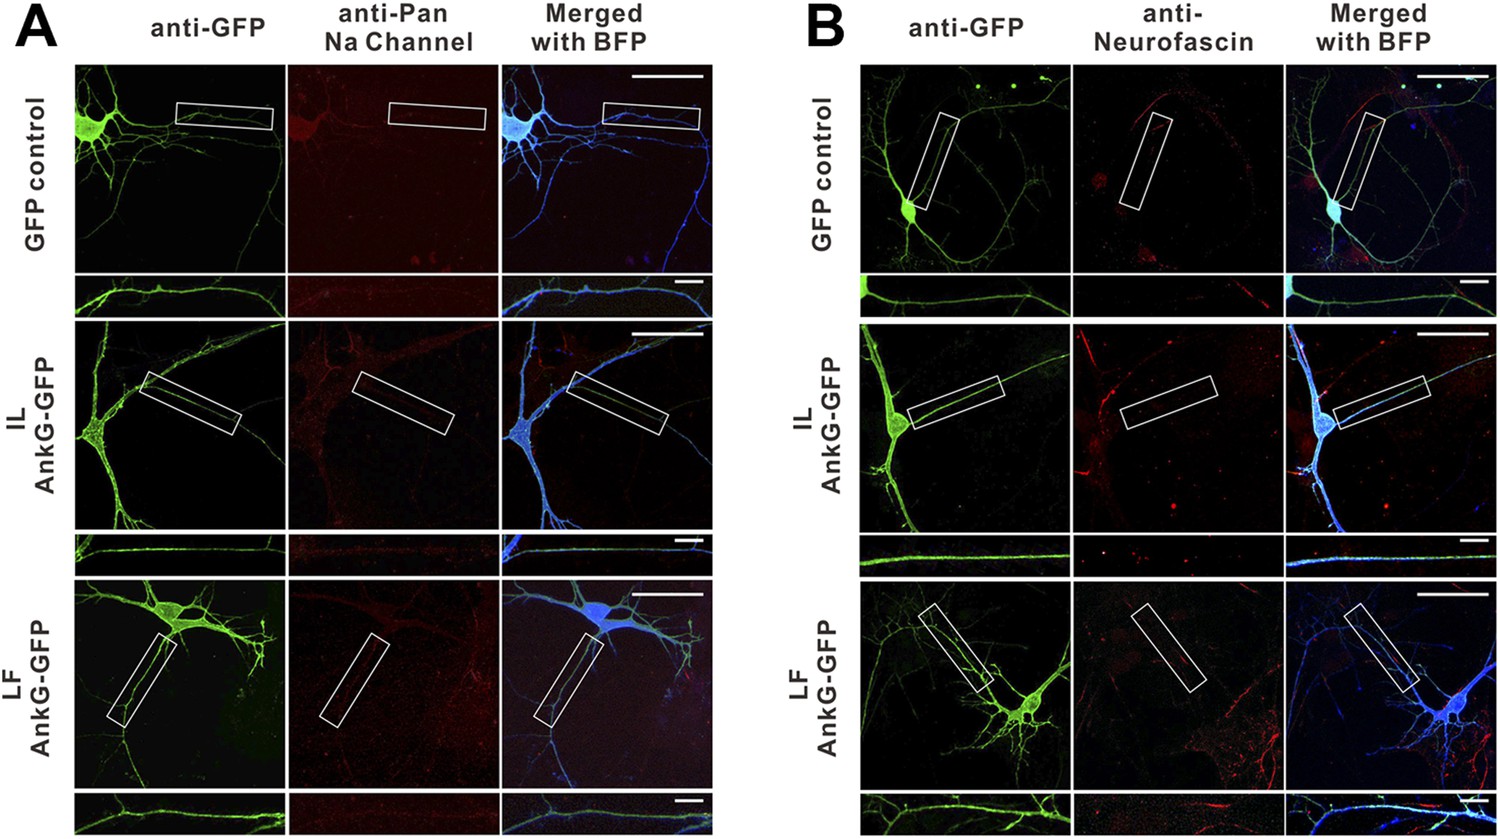
The IL and LF AnkG-GFP mutants do not cluster at the AIS and fail to rescue AnkG's functions in the AIS.
GFP control, IL mutant of AnkG-GFP, and LF mutant of AnkG-GFP constructs were co-transfected with shRNA against mouse AnkG, respectively, to assay their ability to rescue AnkG's self-clustering and clustering of sodium channels (A) and neurofascin (B) at the AIS. The two AnkG-GFP mutants can neither cluster at the AIS nor rescue the clustering of sodium channels or Nfasc. The quantification data are shown in Figure 7C–E.
Author response image 1
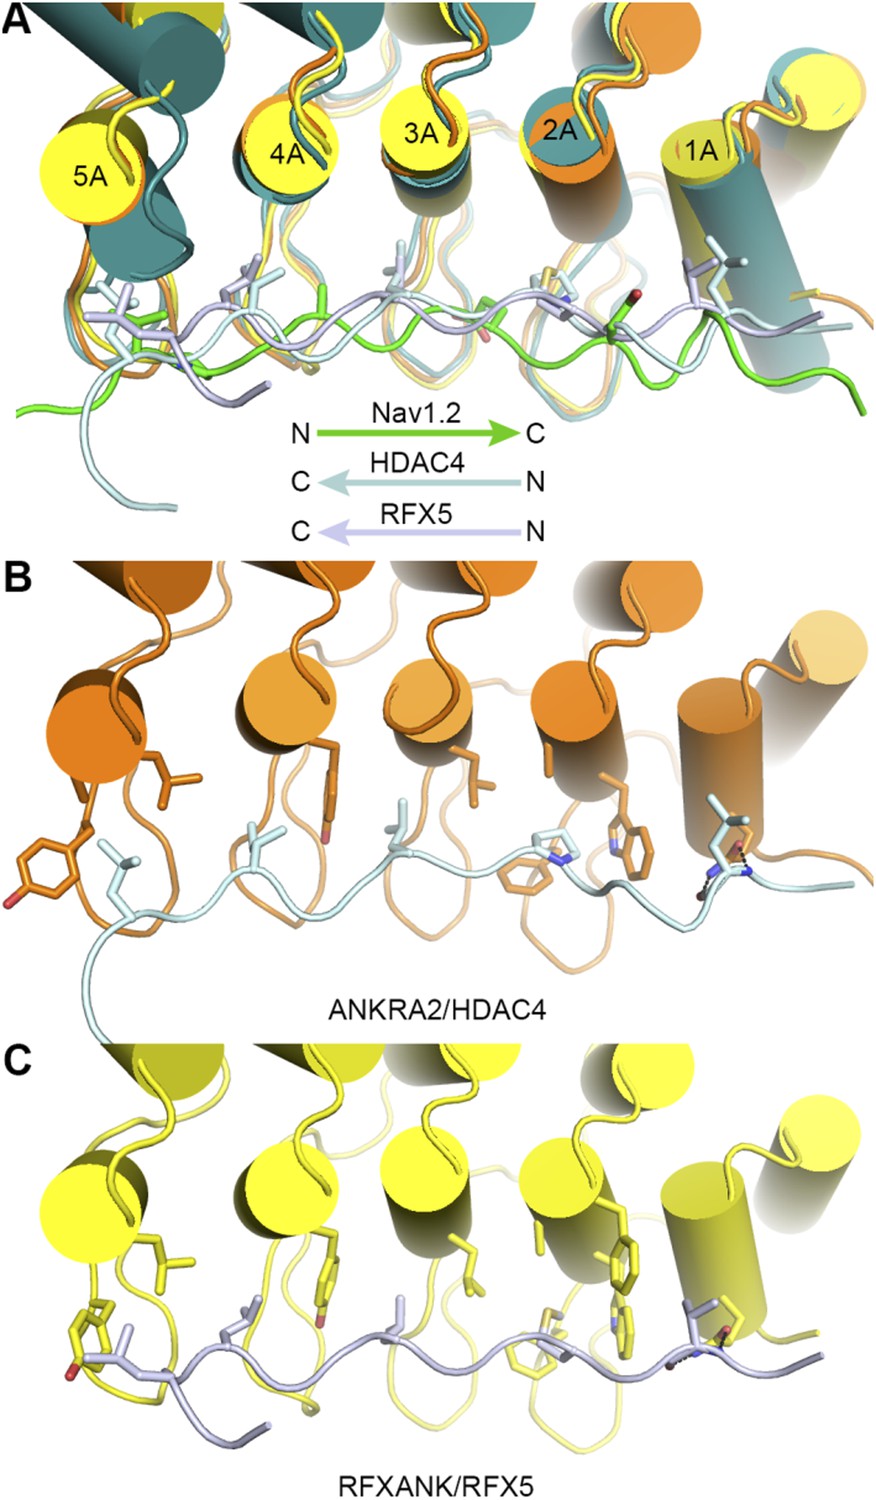
Comparison of the bindings of AnkR_repeats R1-6 to Nav1.2 with those of ANKRA2 and RFXANK to HDAC4 and RFX5.
Videos
Video 1
Surface conservation of 24 ANK repeats.
This video shows the concave groove is highly conserved across various species from human to worm.
Tables
Table 1
Statistics of data collection and model refinement
| Native ANK repeats/AS | SeMet-ANK repeats/AS | R1-9/Nav1.2_ABD-C | |
|---|---|---|---|
| Data collection | |||
| Space group | R32 | R32 | P4222 |
| Cell dimensions | |||
| a, b, c (Å) | 179.9, 179.9, 304.5 | 179.7, 179.7, 304.9 | 102.3, 102.3, 106.0 |
| α, β, γ (°) | 90, 90, 120 | 90, 90, 120 | 90, 90, 90 |
| Resolution range (Å) | 50–4.0 (4.07–4.0) | 50–3.5 (3.56–3.5) | 50–2.5 (2.54–2.5) |
| Rmerge (%)* | 8.7 (45.8) | 12.1 (78.3) | 7.7 (74.8) |
| I/σI | 17.1 (3.4) | 22.5 (2.2) | 29.8 (3.5) |
| Completeness (%) | 98.9 (99.3) | 96.0 (97.2) | 99.4 (100) |
| Redundancy | 4.3 (4.4) | 10.2 (9.0) | 9.5 (9.7) |
| Structure refinement | |||
| Resolution (Å) | 50–3.5 (3.62–3.5) | 50–2.5 (2.64–2.5) | |
| Rcryst/Rfree (%)† | 22.0 (35.0)/25.3 (36.6) | 18.8 (22.7)/23.8 (24.5) | |
| r.m.s.d. bonds (Å)/angles (°) | 0.013/1.5 | 0.015/1.5 | |
| Average B factor | 113.5 | 63.5 | |
| No. of atoms | |||
| Protein atoms | 6260 | 2243 | |
| Water molecules | 0 | 74 | |
| Other molecules | 45 | 57 | |
| Ramachandran plot‡ | |||
| Favored regions (%) | 94.7 | 97.7 | |
| Allowed regions (%) | 5.2 | 2.3 | |
| Outliers (%) | 0.1 | 0.0 | |
-
*
Rmerge = Σ|Ii − Im|/ΣIi, where Ii is the intensity of the measured reflection and Im is the mean intensity of all symmetry related reflections.
-
†
Rcryst = Σ||Fobs| − |Fcalc||/Σ|Fobs|, where Fobs and Fcalc are observed and calculated structure factors, respectively. Rfree = ΣT||Fobs| − |Fcalc||/ΣT|Fobs|, where T is a test data set of about 5% of the total reflections randomly chosen and set aside prior to refinement.
-
‡
Defined by MolProbity.
-
Numbers in parentheses represent the value for the highest resolution shell.
Download links
A two-part list of links to download the article, or parts of the article, in various formats.
Downloads (link to download the article as PDF)
Open citations (links to open the citations from this article in various online reference manager services)
Cite this article (links to download the citations from this article in formats compatible with various reference manager tools)
Structural basis of diverse membrane target recognitions by ankyrins
eLife 3:e04353.
https://doi.org/10.7554/eLife.04353


