Hox genes control vertebrate body elongation by collinear Wnt repression
- University of Strasbourg, France
- Stowers Institute for Medical Research, United States
- Ehime University, Japan
- Howard Hughes Medical Institute, United States
- University of Kansas Medical Center, United States
- Brigham and Woman's Hospital, United States
- Harvard Medical School, United States
Figures
Figure 1
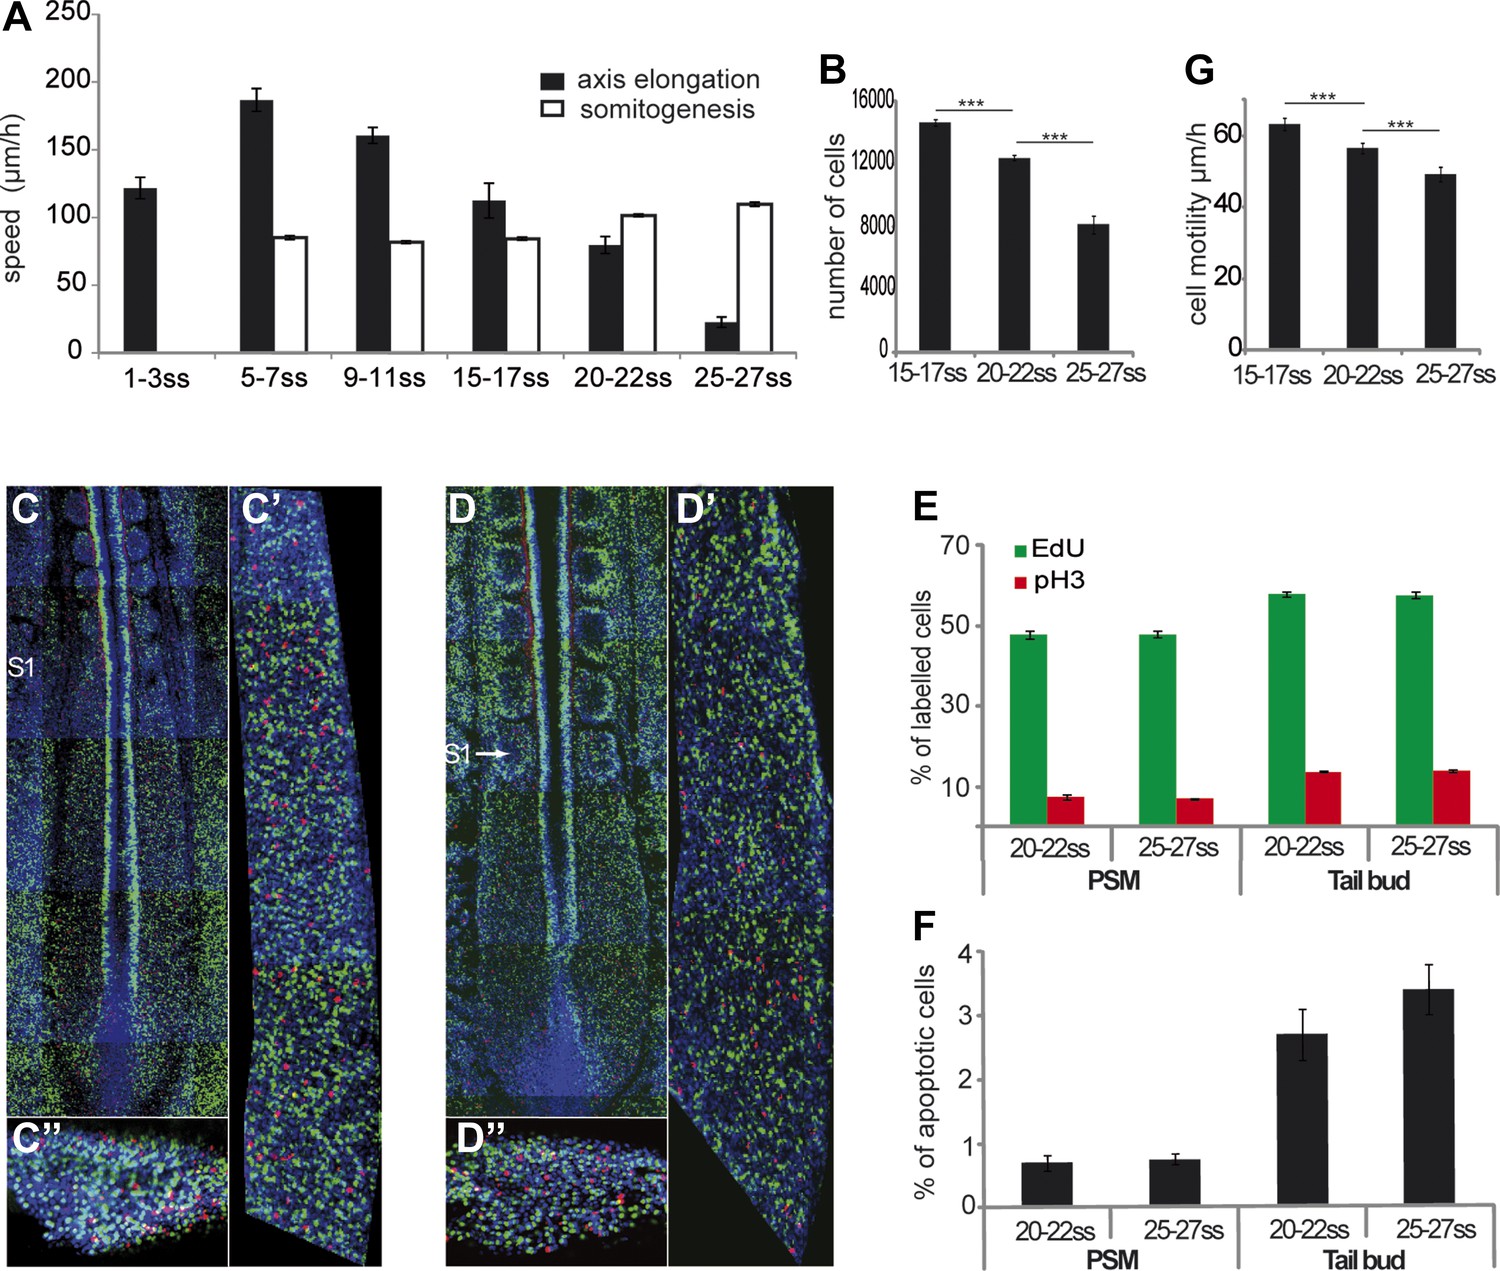
Slowing down of axis elongation correlates with decreasing cell ingression in the PSM.
(A) Velocity of axis elongation and of somite formation. (B) PSM cell number. (C–D) Tiling of confocal sections of 20-somite (C) and 25-somite (D) stage embryos. EdU positive cells are labeled in green, phosphorylated histone H3 (pH3) in red, and nuclei in blue (DAPI). (C′, D′) Higher magnification of PSM regions used to quantify the proliferation. (C″, D″) Confocal sections of parasagittal cryosections of tail-bud used to quantify cell proliferation. (E–F) Quantification of cell proliferation (E) and apoptosis (F) in 20–22 and 25–27 somites chicken embryos. (G) Cell motility in the posterior PSM.
Figure 2
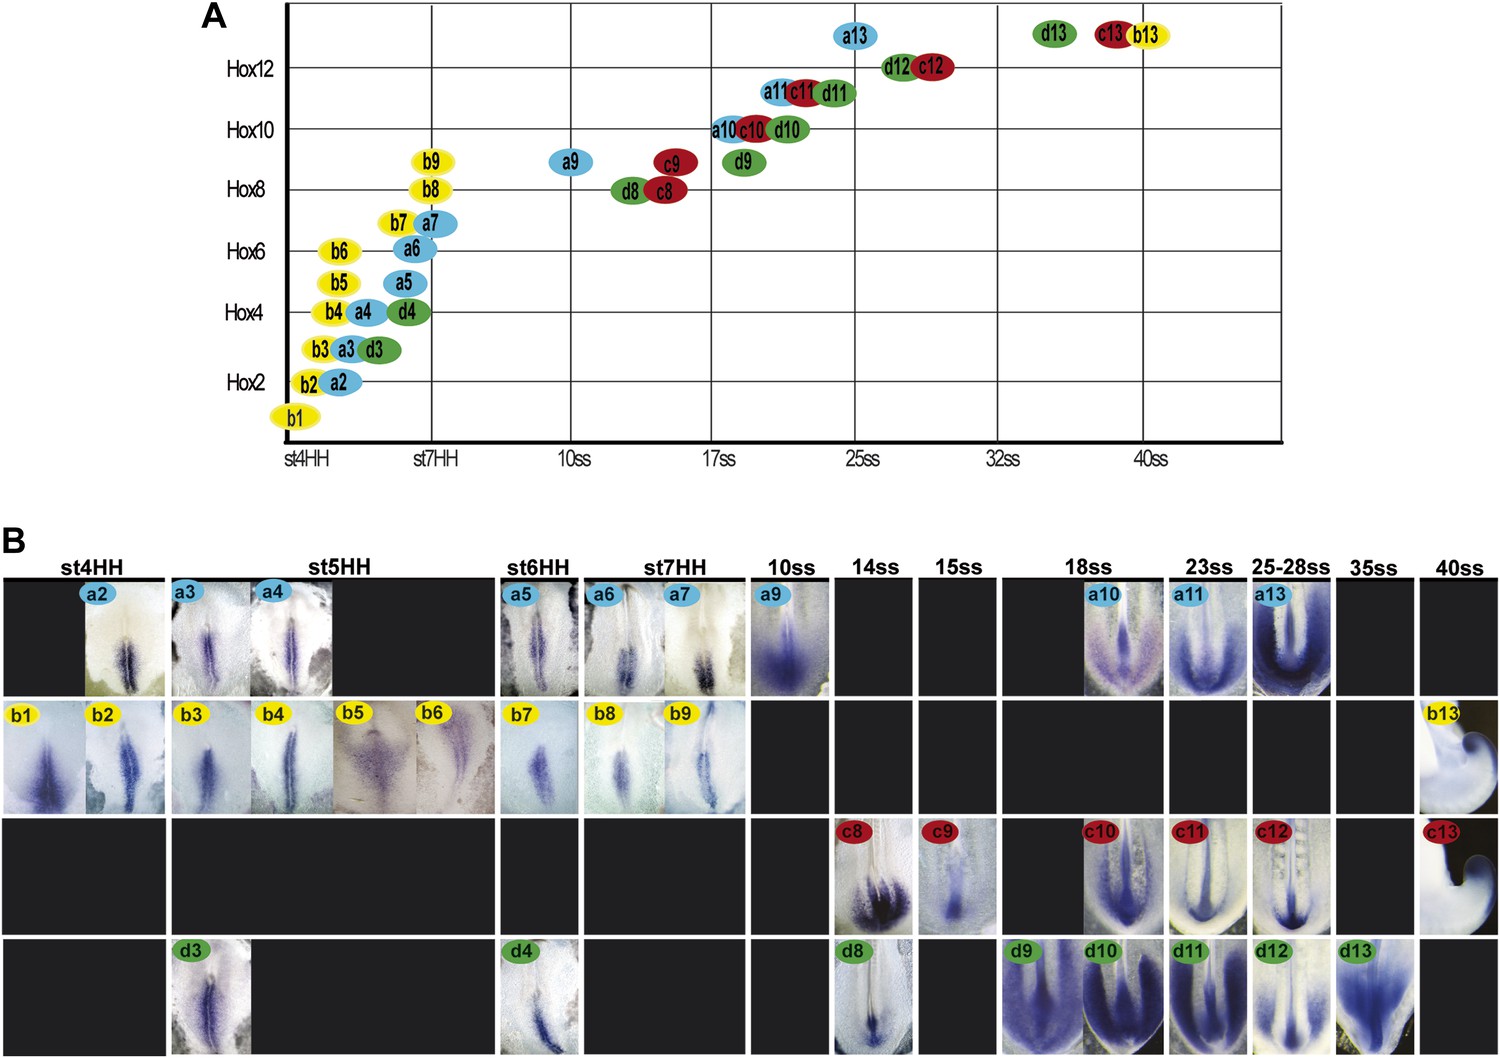
Collinear activation of Hox genes in paraxial mesoderm precursors.
(A) Table showing the collinear onset of Hox genes expression in the epiblast/tail-bud generated from (B) Chicken embryos hybridized in whole-mount with Hoxa (blue), Hoxb (yellow), Hoxc (red), and Hoxd (green) probes. Each panel shows the beginning of activation of each Hox gene in paraxial mesoderm precursors in the epiblast of the anterior primitive streak or in the tail-bud. Hox probe used is indicated on the top of each panel. Anterior is up. Dorsal view.
Figure 3 with 1 supplement
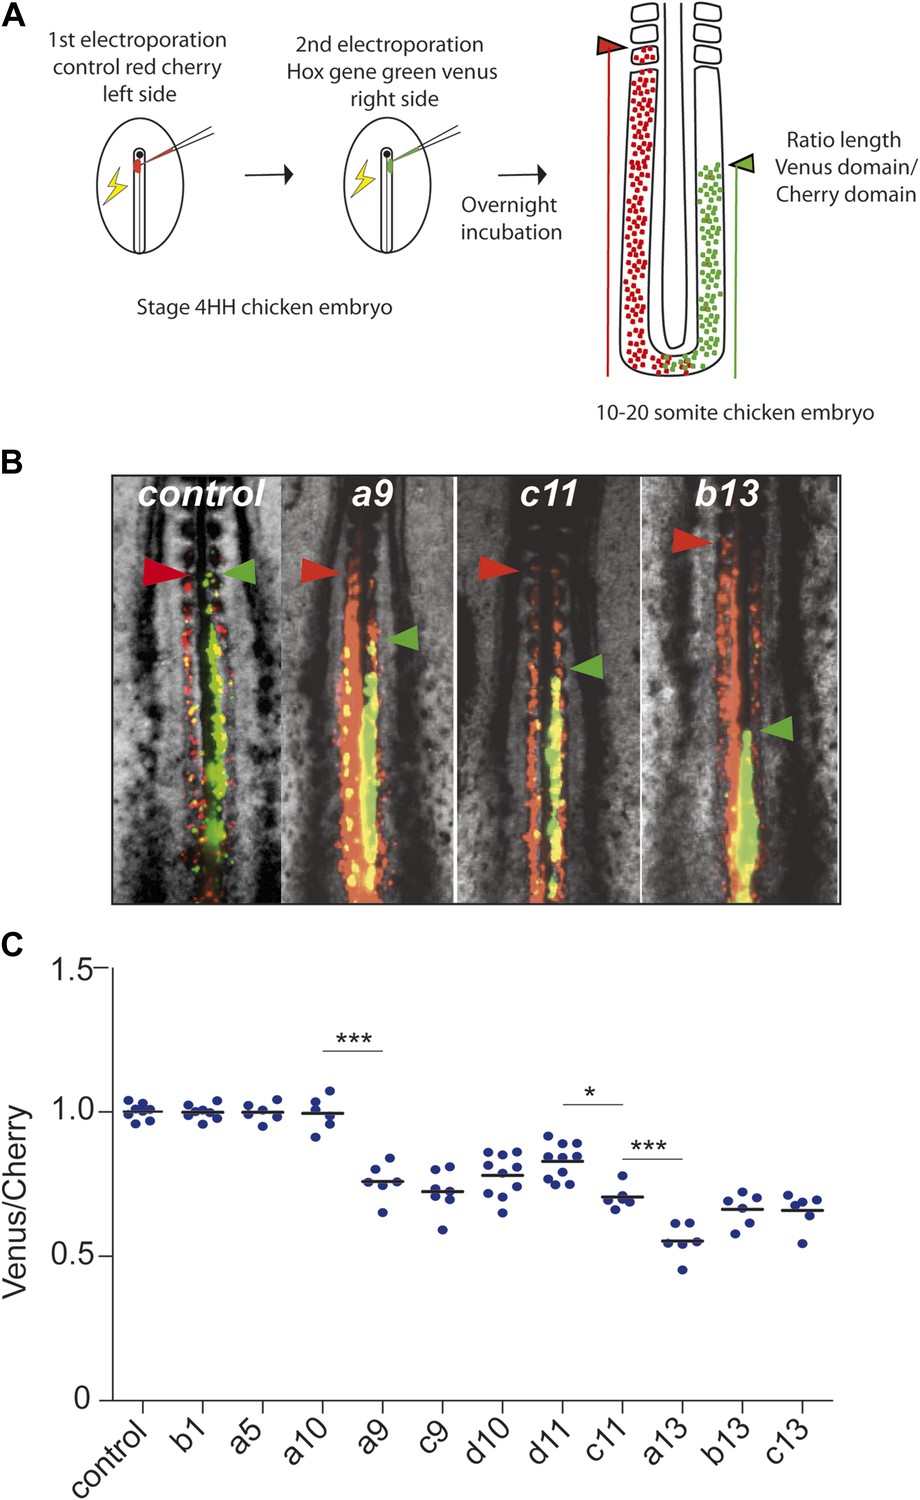
Posterior Hox genes can regulate cell ingression in a collinear fashion.
(A) Consecutive electroporation protocol. The ratio of the green domain (green bar, Hox expressing) over the red domain (red bar, control vector) measures the ingression delay. (B) Embryos consecutively electroporated first with Cherry and then with Venus together with control, Hoxa9, Hoxc11, or Hoxb13 vectors. Arrowheads: anterior boundary of Cherry (red) and Venus (green) domains. (C) Ratio of Venus over Cherry domains for posterior Hox genes. Dots: electroporated embryos. Bar indicates the mean. Stars: p-value of two-tailed Student's t-test applied between the different conditions. *p < 0.05; **p < 0.01; ***p < 0.005. Error bars: standard error to the mean (SEM).
Figure 3—figure supplement 1
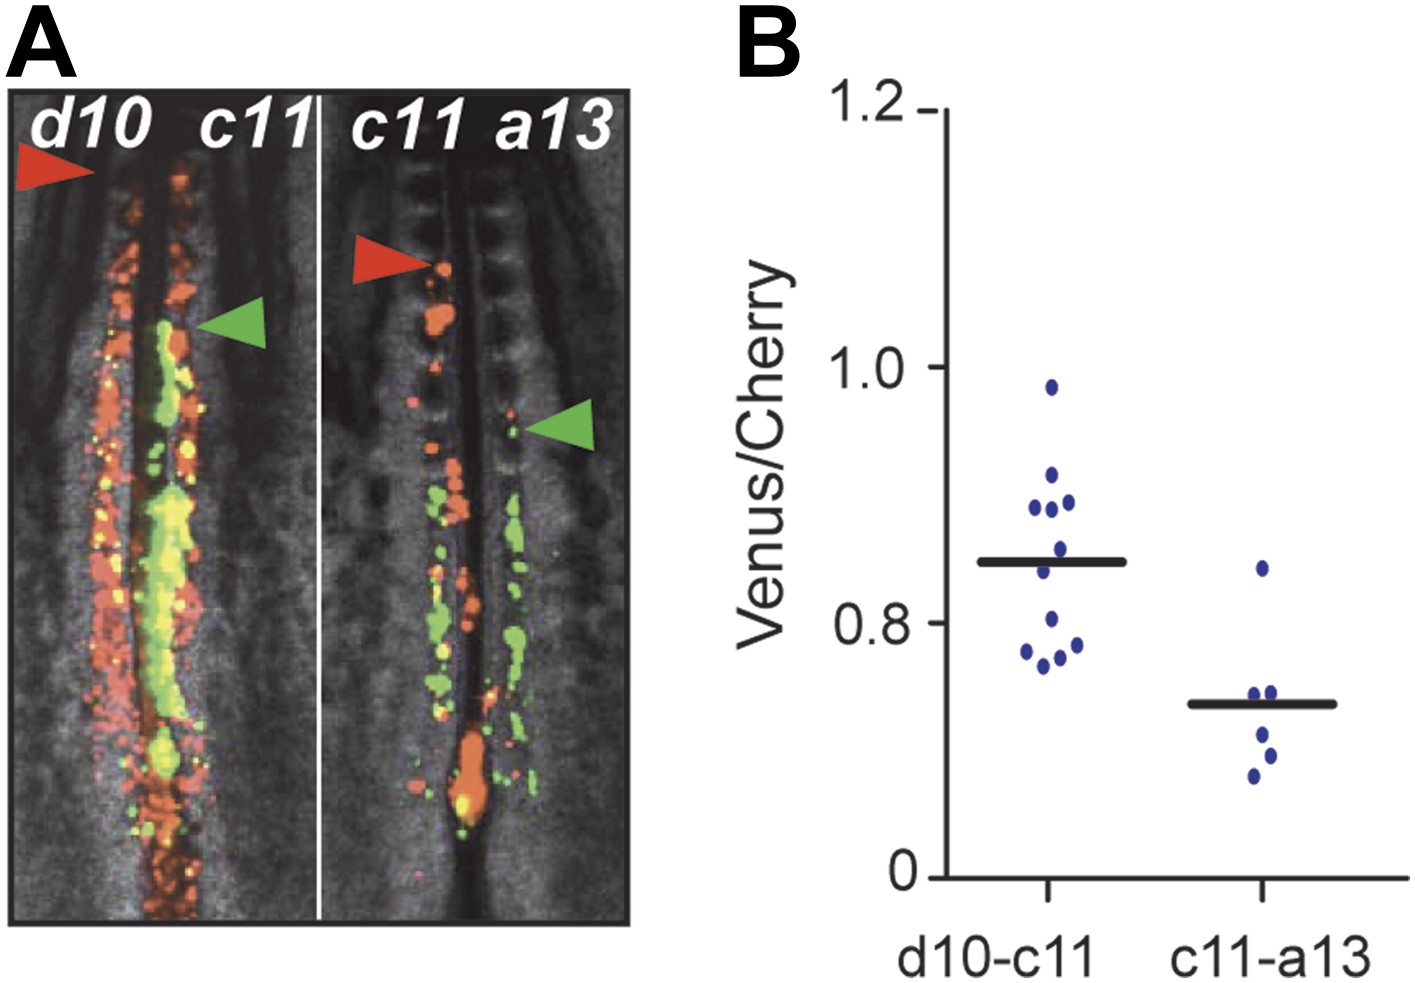
The posterior Hox genes regulate cell ingression with increasing strength.
(A) Embryos consecutively electroporated with Hoxd10-Cherry and Hoxc11-Venus (left) and with Hoxc11-Cherry and Hoxa13-Venus (right). Arrowheads: anterior boundary of Cherry (red) and Venus (green) domains. (B) Ratio of Venus over Cherry domains corresponding to A. This shows that Hoxa13 retains the cell longer in the epiblast than Hoxc11 which retains the cell longer than Hoxd10.
Figure 4
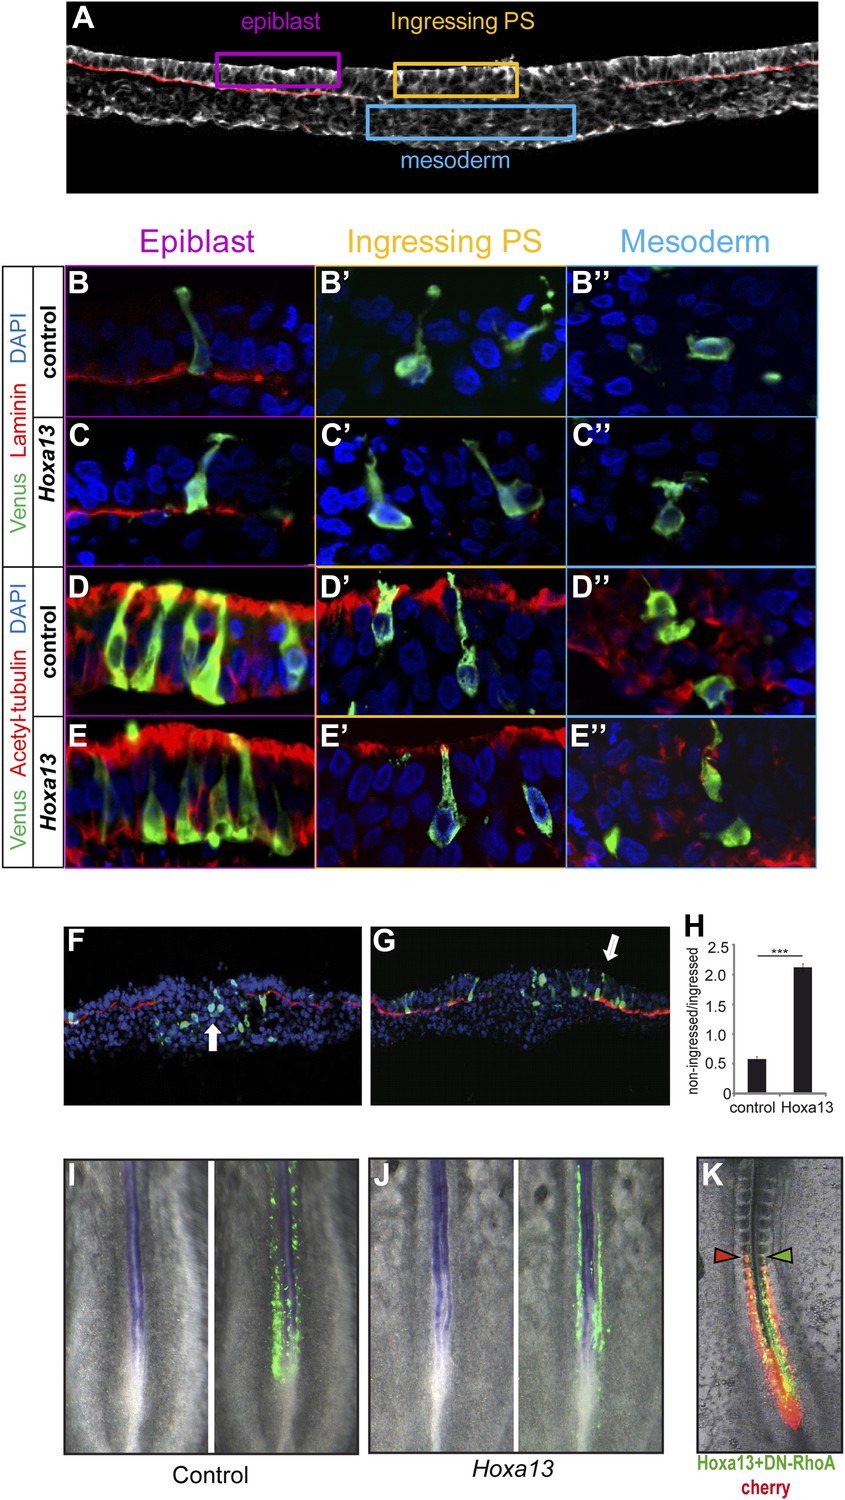
Epiblast cells overexpressing Hox genes do not convert to a neural fate.
(A) Transverse section of a stage 7 HH chicken embryo labeled with phalloidin (white) to highlight the actin network and with laminin (red) to identify the epiblast basal membrane. Colored boxes indicate the different phases of differentiation of the mesoderm: epiblast (purple), ingressing cells (yellow), and mesoderm (blue). (B–E″) Transverse sections at the PSM progenitors level 5 hr after electroporation of a control Venus or of Hoxa13. (B-C”) Laminin immunolabeling (red) after Venus (B–B″) or Hoxa13 over-expression (C–C″). (D–E″) Acetylated α-tubulin immunolabeling (red) after Venus (D–D″) or Hoxa13 (E–E″) over-expression. (F–G) Transverse cryosections of the anterior primitive streak of an embryo electroporated with Venus (F) or with Venus and Hoxa13 (G). White arrow: cells ingressed in the primitive streak (F) and non-ingressed epiblast cells (G). Green: Venus; red: laminin; blue: nuclei. (H) Quantification of ingression in embryos electroporated with control or Hoxa13-expressing constructs. (I–J) In situ hybridization of 2-day old chicken embryos electroporated with Venus (I) or Hoxa13-Venus (J) expressing vectors. Left panel shows Sox2 expression in the neural tube and tail-bud, and right panels show GFP immunohistochemistry. (K) Chicken embryo consecutively electroporated with a control (Cherry, red) and a mix of Hoxa13+DN-RhoA (Venus, green). Arrowheads: anterior boundary of Cherry (red) and Venus (green) domains. Stars: p-value of two-tailed Student's t-test applied between the different conditions. ***p < 0.005. Error bars: standard error to the mean (SEM).
Figure 5
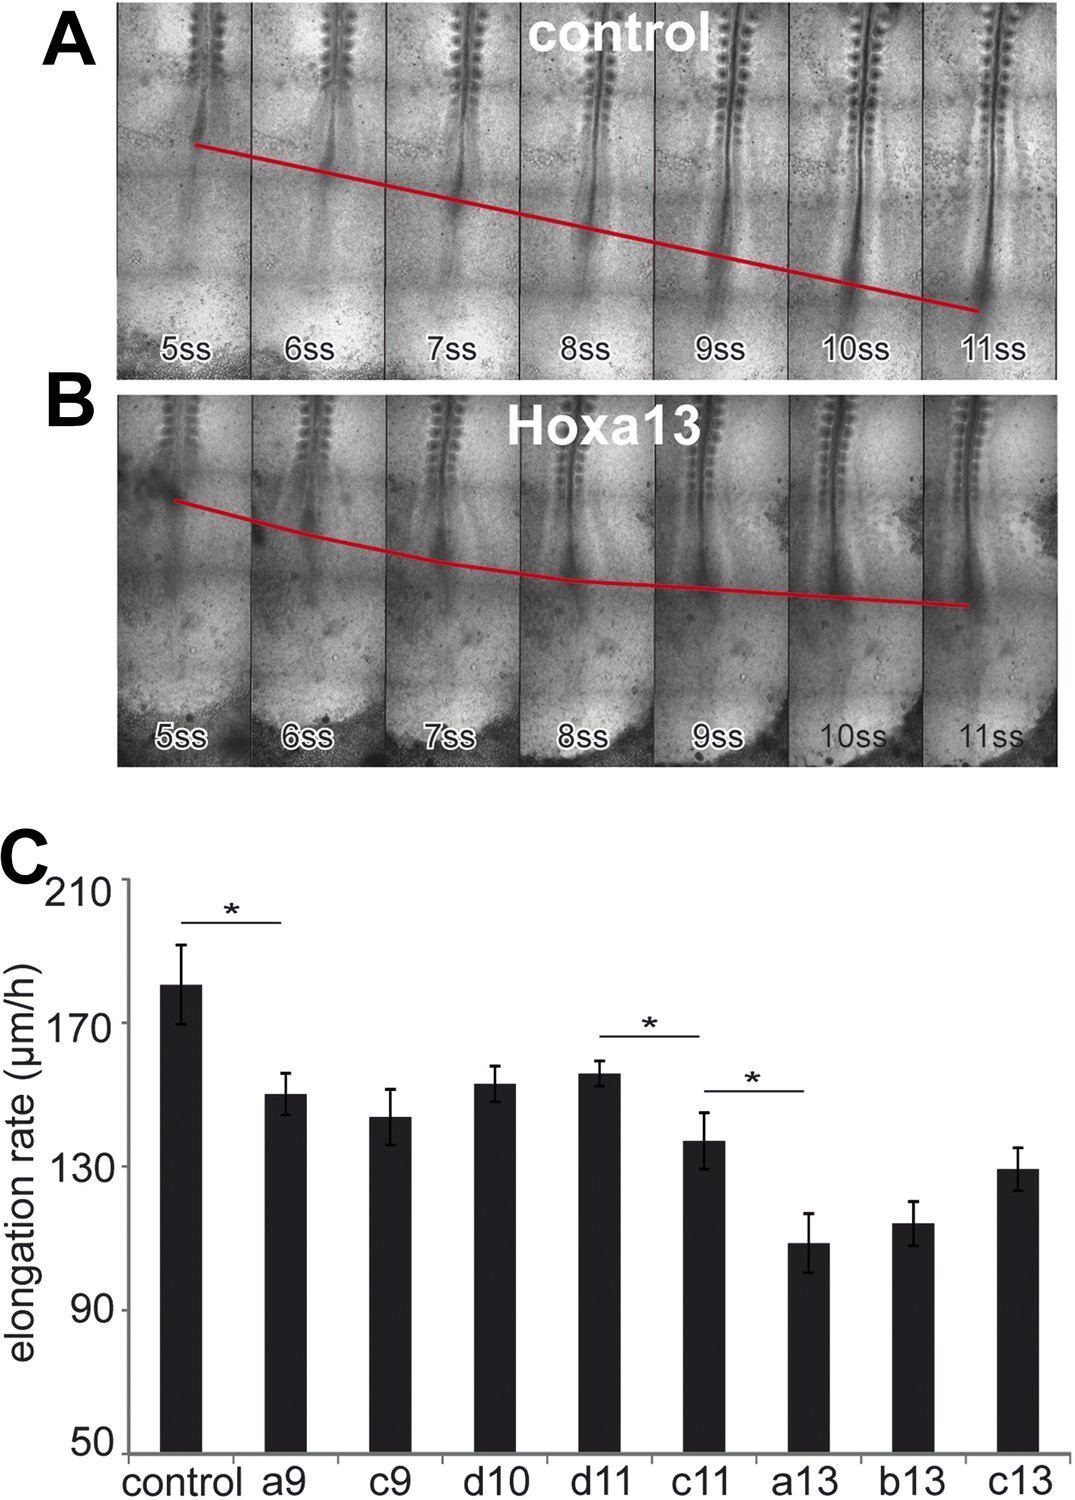
Posterior Hox genes control the axis elongation velocity in a collinear fashion.
(A–B) Time-lapse series of chicken embryos electroporated either with control (A) or Hoxa13 (B). Red line: position of Hensen's node. ss = somite-stage. (C) Velocity of axis elongation of embryos electroporated with either a control, Hoxa9, Hoxc9, Hoxd10, Hoxd11, Hoxc11, Hoxa13, Hoxb13, or Hoxc13 expressing constructs. Stars: p-value of two-tailed Student's t-test applied between the different conditions. *p < 0.05. Error bars: standard error to the mean (SEM).
Figure 6
Posterior prevalence of posterior Hox genes.
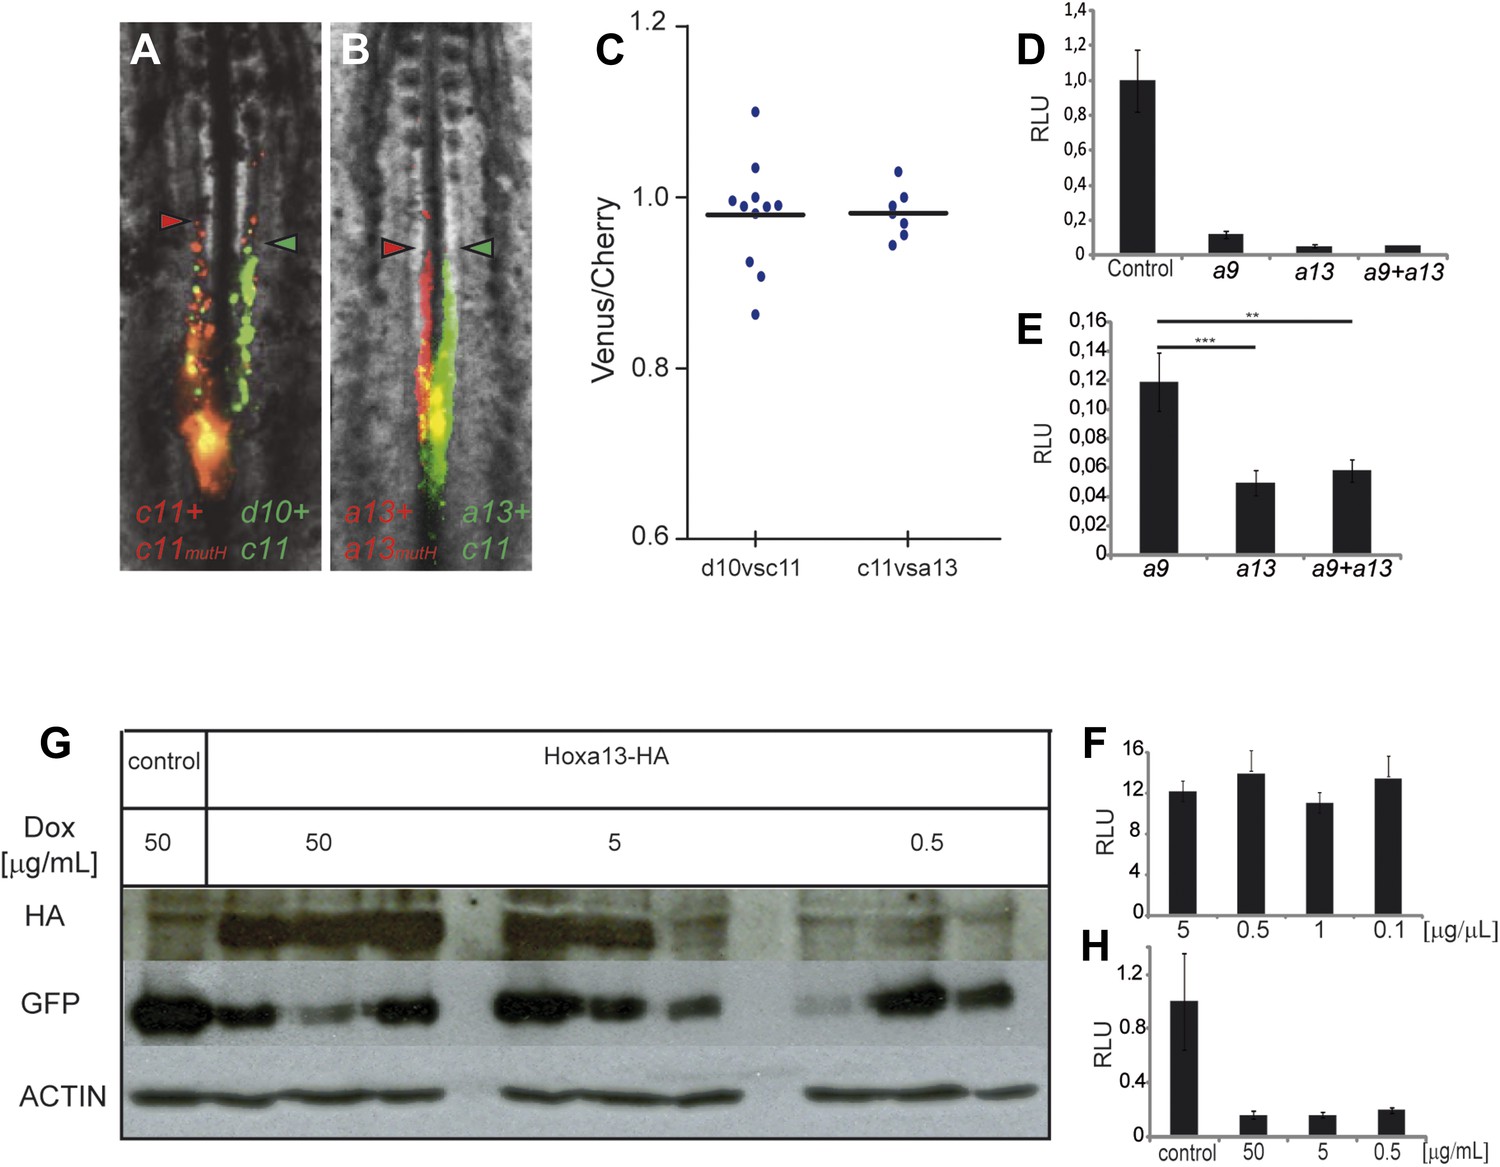
(A) Embryos consecutively electroporated first with Hoxc11-Cherry + Hoxc11mutH-Cherry and with Hoxd10-Venus + Hoxc11-Venus shown 24 hr after reincubation. (B) Embryos consecutively electroporated first with Hoxa13-Cherry + Hoxa13mutH-Cherry and then with Hoxa13-Venus + Hoxc11-Venus shown 24 hr after reincubation. Red arrowheads: anterior boundary of Cherry-expressing cells. Green arrowheads: anterior boundary of Venus-expressing cells. (C) Quantification of the ratio of Venus over Cherry expressing domains for the experiments shown in A and B. Each dot corresponds to one electroporated embryo and bar indicates the mean. (D–E) Luciferase assay measuring Wnt/βcatenin pathway activity after over-expression of the BATLuc construct together with a Renilla-expressing vector and either (D) control, Hoxa9, Hoxa13 or the combination of Hoxa9 and Hoxa13 expressing vectors. (E) Blow-up of the samples shown in (D). (F) BATLuc assay with serial dilutions of the Hoxa13 plasmid (in μg/μl on the x axis). (G) Western blot labeled with an anti-HA antibody showing embryos electroporated with Hoxa13 under the control of a doxycycline-responsive promoter activated with different doses of doxycycline (in μg/ml). (H) BATLuc assay after Hoxa13 over-expression under the control of a doxycycline-responsive promoter activated with different doses of doxycycline (in μg/ml on the x axis). Stars represent the p value of the two-tailed Student's t-test applied between the different conditions. **p < 0.01; ***p < 0.005. Error bars represent the standard error to the mean (SEM).
Figure 7
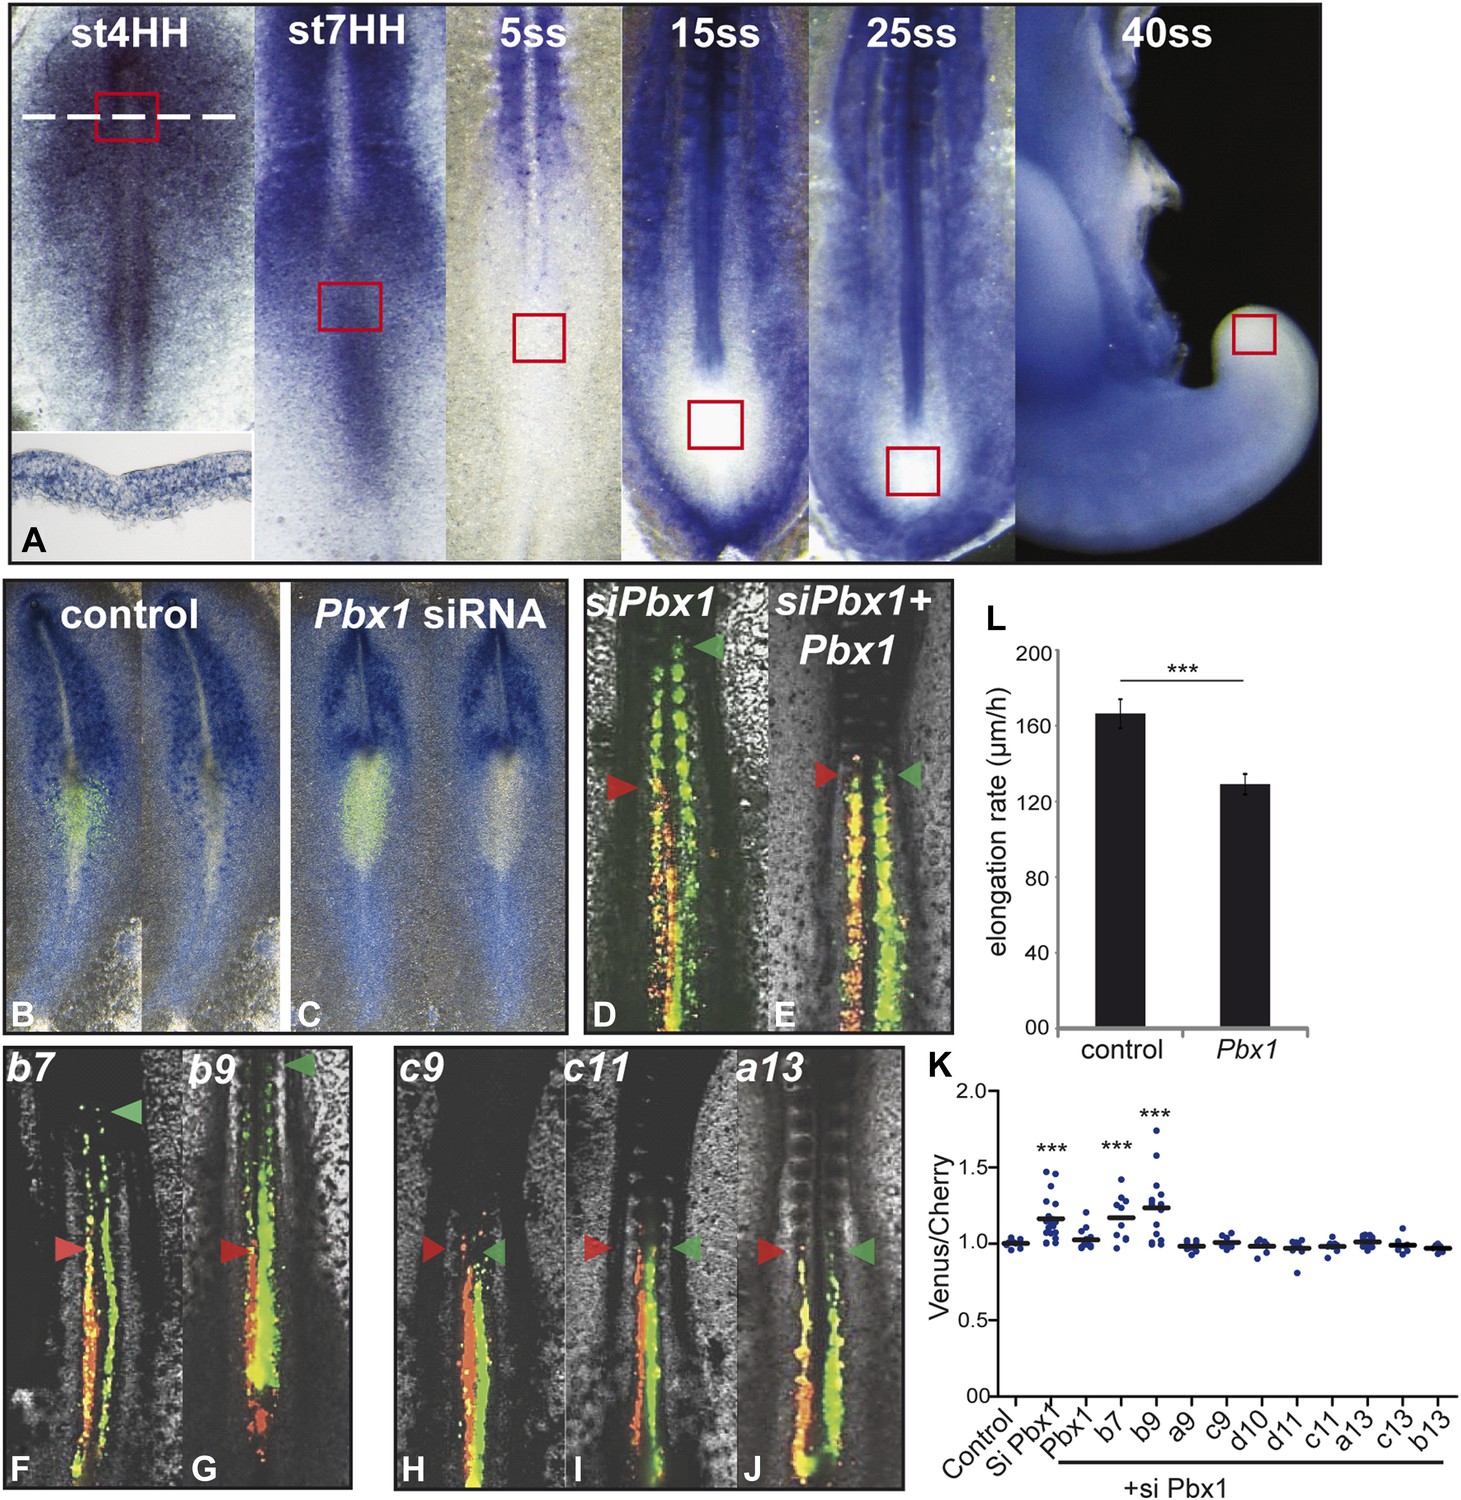
Control of ingression of PM precursors by anterior Hox genes is dependent on Pbx1.
(A) Pbx1 expression during somitogenesis. Red squares: region of PM progenitors. White dashed line: level of transverse section shown in bottom left. (B–C) Pbx1 expression in stage 6–7 HH chicken embryos electroporated with Venus and control siRNA (B) or Pbx1 siRNA (C). Left panels: Venus expression. (D–J) 2-day-old chicken embryos consecutively electroporated first with Cherry and a control siRNA and then with a Pbx1 siRNA and a Venus construct either alone (D) or together with Pbx1 (E), Hoxb7 (F), Hoxb9 (G), Hoxc9 (H), Hoxc11 (I), Hoxa13 (J). Arrowheads: anterior boundary of Cherry (red) and of Venus (green) domains. (K) Ratio of Venus over Cherry expressing domains. Dots: electroporated embryos. Bar indicates mean. (L) Effect of Pbx1 over-expression on axis elongation rate. Stars represent the p value of the two-tailed Student's t-test applied between the different conditions. ***p < 0.005. Error bars: standard error to the mean (SEM).
Figure 8 with 2 supplements
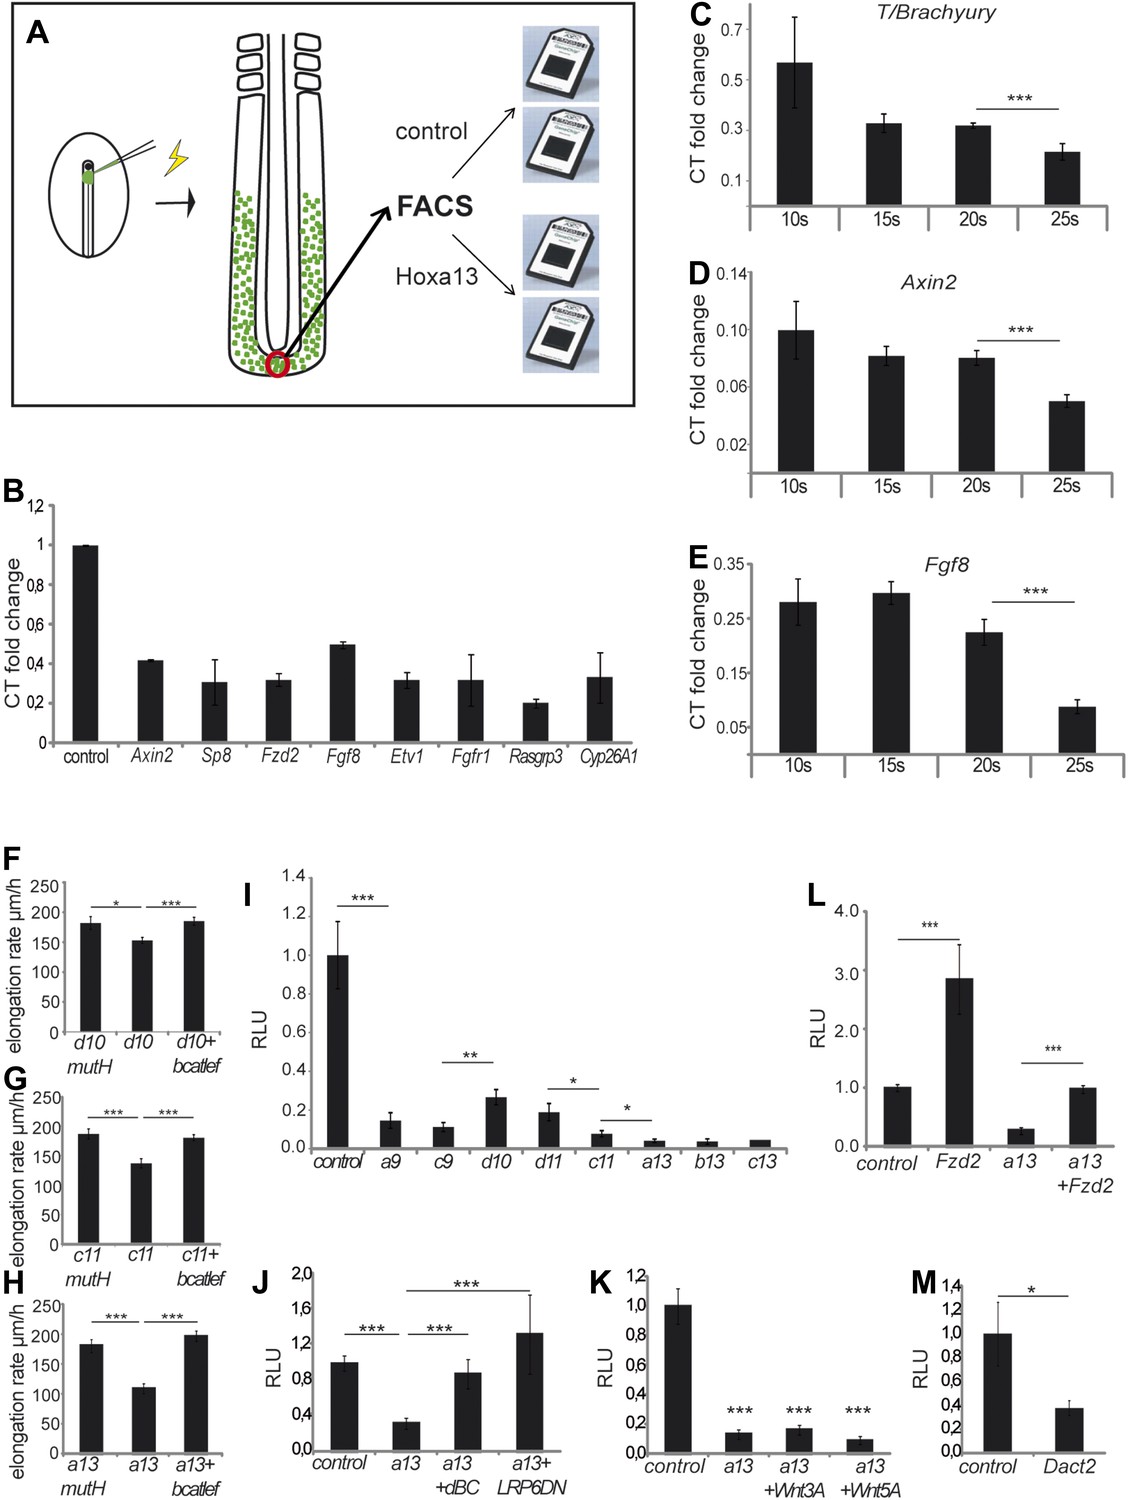
Collinear repression of Wnt/βcatenin signaling by posterior Hox genes.
(A) Design of the microarray experiment. (B) Validation by Q-RT PCR of selected Hoxa13 targets identified in the microarray experiment. (C-E) Q-RT PCR for (C) T/Brachyruy, (D) Axin2, and (E) Fgf8 at 10, 15, 20, and 25-somite stage from microdissected tail-buds. (F–H) elongation velocity of embryos over-expressing (F) Hoxd10mutH, Hoxd10 or Hoxd10+βcatLEF, (G) Hoxc11mutH, Hoxc11 or Hoxc11+βcatLEF, (H) Hoxa13mutH, Hoxa13 or Hoxa13+βcatLEF. (I) Luciferase assay measuring Wnt/βcatenin activity after over-expression of BATLuc together with CMV-Renilla and either control, Hoxa9, Hoxc9, Hoxd10, Hoxd11, Hoxc11, Hoxa13, Hoxb13, or Hoxc13. (J–M) Luciferase assay measuring Wnt/βcatenin activity after over-expression of BATLuc and CMV-Renilla and control, Hoxa13, Hoxa13+dBC, or Hoxa13+Lrp6ΔN (J), or control, Hoxa13, Hoxa13+Wnt3a or Hoxa13+Wnt5a (K), or control, Fzd2, Hoxa13, or Hoxa13+Fzd2 (L) or control and Dact2 (M). Firefly luciferase intensity values have been normalized to their respective Renilla values (RLU). Controls have been set to 1. Stars: p value of the two-tailed Student's t-test applied between the different conditions. *p < 0.05; **p < 0.01; ***p < 0.005. Error bars represent standard error to the mean (SEM).
Figure 8—figure supplement 1

The Wnt signaling is repressed when posterior Hox genes are activated.
(A–F) In situ hybridization of 15-somite (left panels) and 25-somite stage (right panels) embryos hybridized with Hoxa13 (A), Axin2(B), Fgf8 intronic (C), T intronic (D), Fzd2 (E), and Dact2 (F) (red arrowhead: tail-bud) showing a repression of the Wnt targets and components as well as an upregulation of the Wnt inhibitor Dact2 when Hoxa13 start to be expressed in the tail-bud.
Figure 8—figure supplement 2
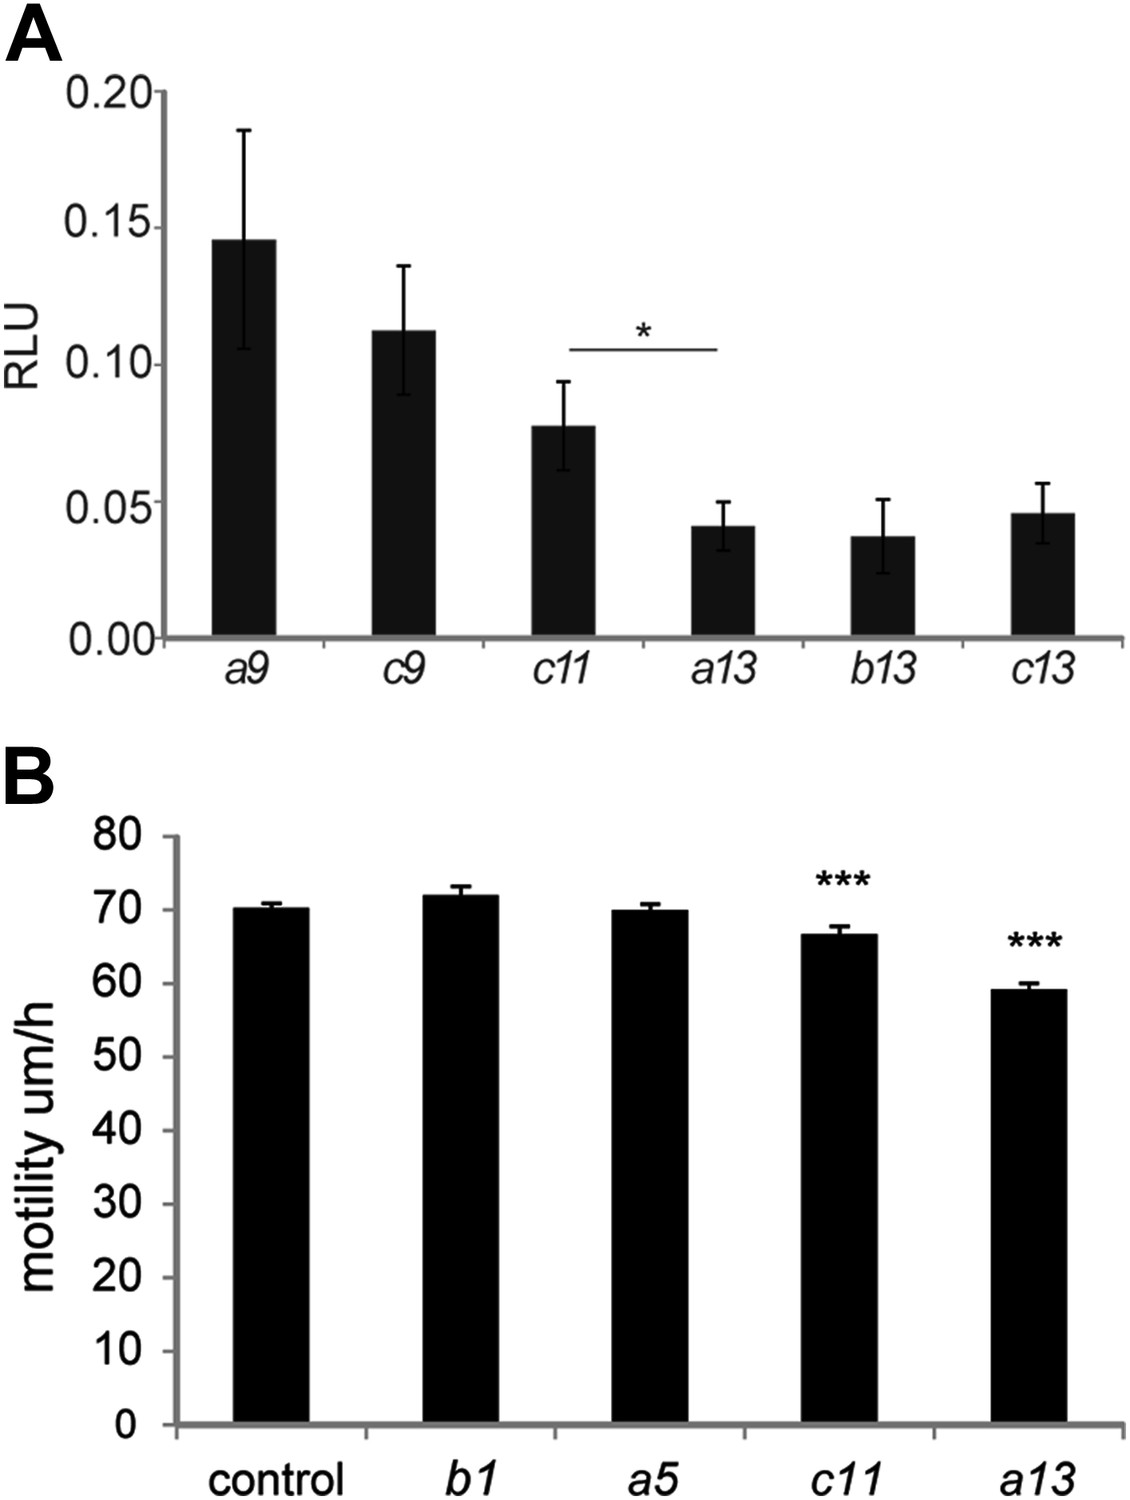
Collinear repression of Wnt signaling and cell motility by posterior Hox genes.
(A) Graph showing Figure 8I samples after removal of control and Hoxd10 and Hoxd11 (which have a weaker effect) to highlight the collinear trend of this set of Hox genes on Wnt repression. (B) Cell motility measured in the posterior PSM of embryos electroporated with H2B-Venus and either a control, Hoxb1, Hoxa5, Hoxc11 or Hoxa13. Stars represent the p-value of the two-tailed Student's t-test applied between the different conditions. *p < 0.05; ***p < 0.005. Error bars represent the standard error to the mean (SEM).
Figure 9 with 1 supplement
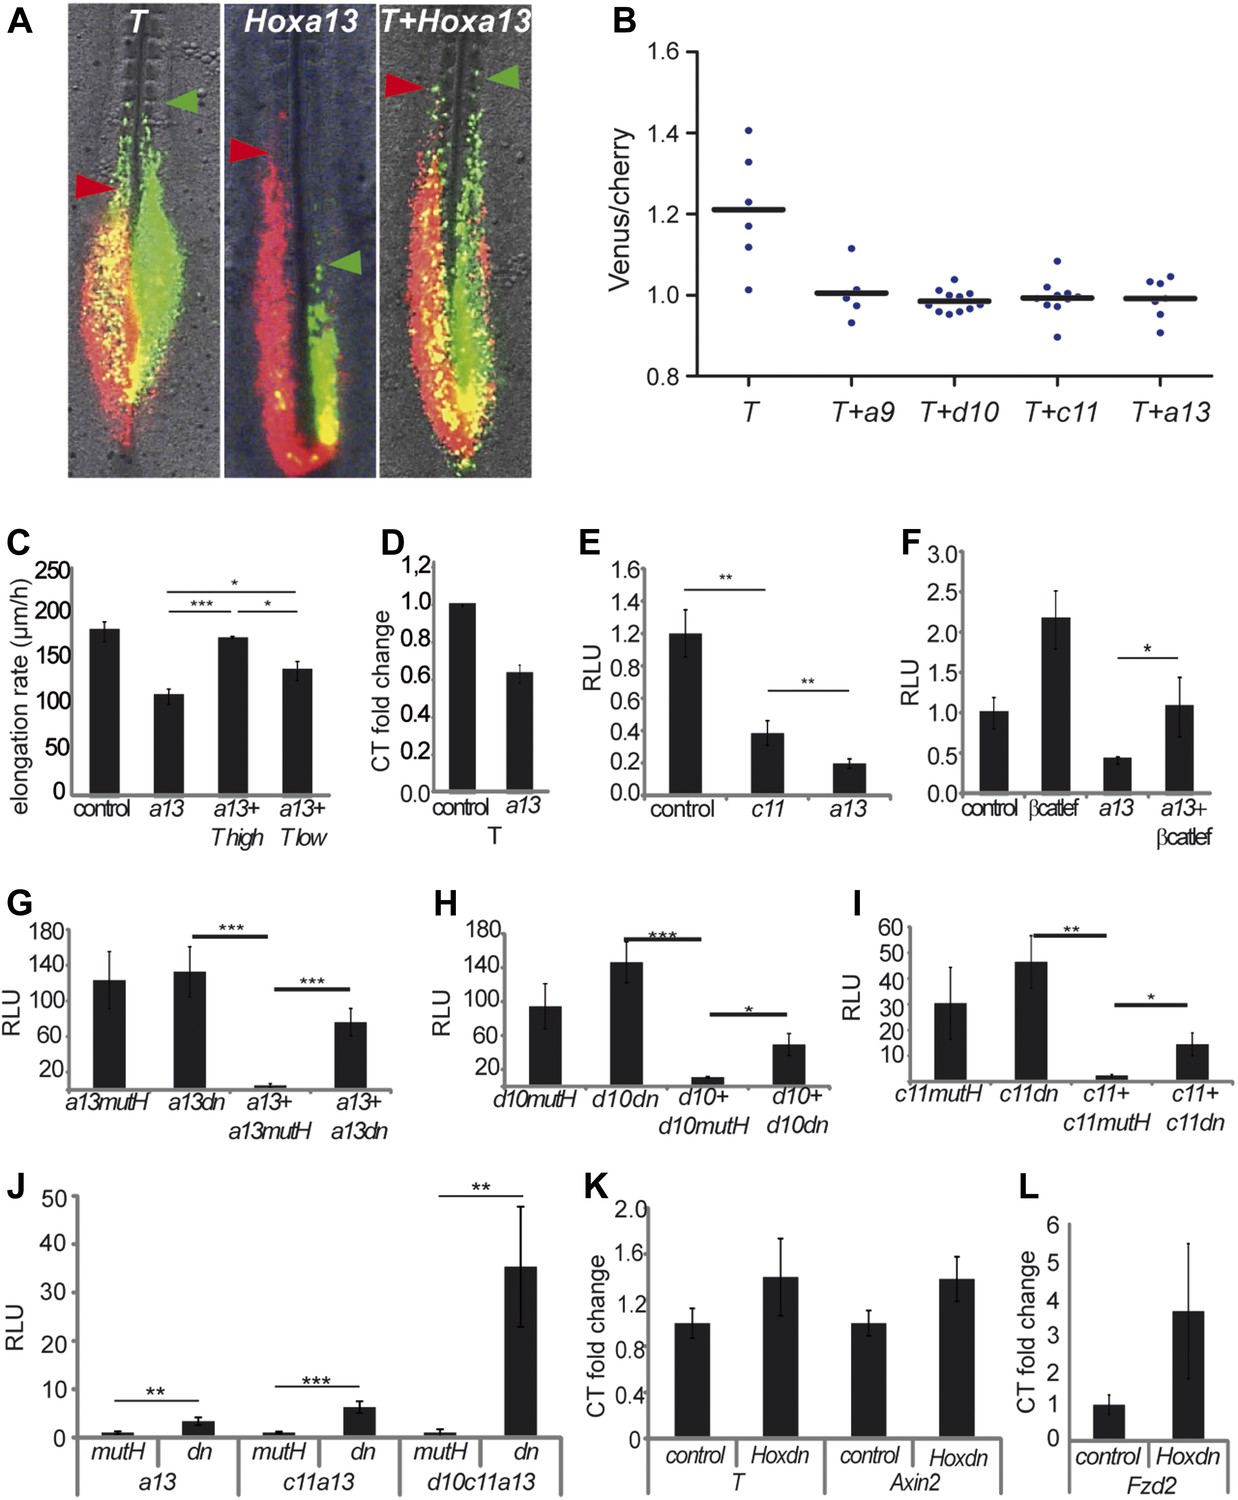
Hox genes effect on axis elongation involves Brachyury regulation downstream of the Wnt/βcatenin pathway.
(A) Consecutive electroporation of PM precursors with Cherry and then with Venus together with T (left panel), Hoxa13 (middle), or a combination of the two vectors (right). Arrowheads: anterior boundary of Cherry (red) and Venus (green) domains. (B) Ratio of Venus over Cherry domains. Dots: electroporated embryos. Bar indicates the mean. (C) Axis elongation velocity of embryos electroporated with control, Hoxa13, or co-electroporated with Hoxa13 and either high or low dose of T. (D) Q-RT PCR quantification of T expression in control or Hoxa13-expressing PM progenitor cells. (E–F) Luciferase activity (RLU) after over-expression of cTprLuc and CMV-Renilla together with either (E) control, Hoxc11 or Hoxa13 or (F) control, βcatLEF, Hoxa13 or Hoxa13+βcatLEF. (G–I) Luciferase assay measuring Wnt/βcatenin activity after over-expression of BATLuc and CMV-Renilla and (G) Hoxa13mutH, Hoxa13dn, Hoxa13+Hoxa13mutH or Hoxa13+Hoxa13dn. (H) Hoxd10mutH, Hoxd10dn, Hoxd10+Hoxd10mutH or Hoxd10+Hoxd10dn, (I) Hoxc11mutH, Hoxc11dn, Hoxc11+Hoxc11mutH or Hoxc11+Hoxc11dn. (J) Luciferase assay measuring Wnt/βcatenin activity from 28-somite stage dissected tail-buds after over-expression of BATLuc and CMV-Renilla constructs and either Hoxa13mutH or Hoxa13dn, or Hoxa13mutH with Hoxc11mutH or Hoxa13dn with Hoxc11dn, or Hoxa13mutH with Hoxc11mutH and Hoxd10mutH or Hox13dn with Hoxc11dn and Hoxd10dn. (K, L) Q-RT PCR quantification of T, Axin2 (K), and Fzd2 (L) expression in PM progenitors co-expressing either Hoxa13mutH with Hoxc11mutH and Hoxd10mutH or Hoxa13dn with Hoxc11dn and Hoxd10dn. Stars: p-value of the two-tailed Student's t-test applied between the different conditions. *p < 0.05; **p < 0.01; ***p < 0.005. Error bars: standard error to the mean (SEM).
Figure 9—figure supplement 1
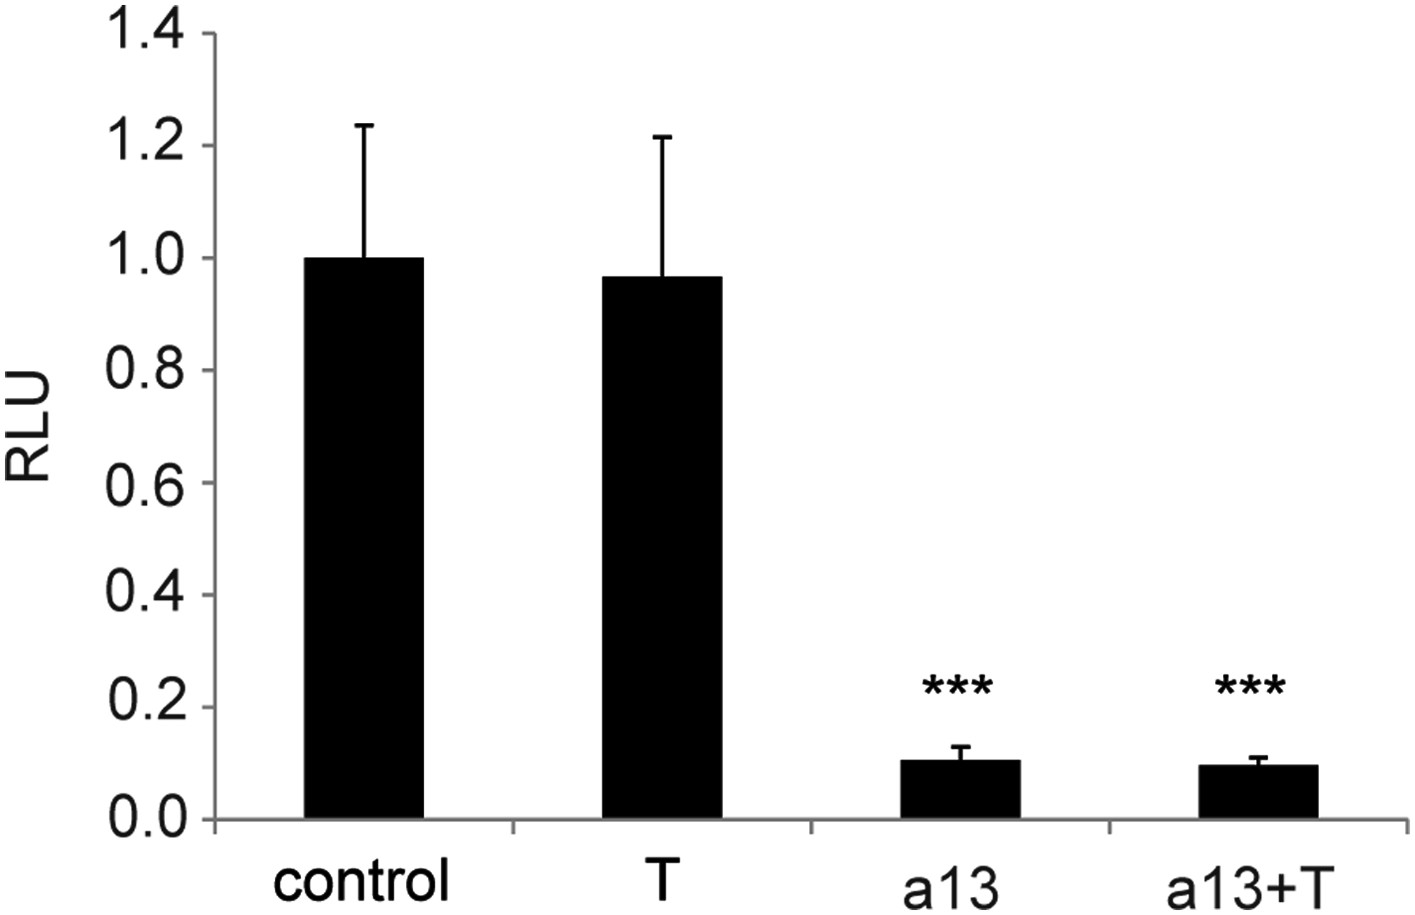
Overexpression of T has no effect on Wnt activity.
Luciferase assay measuring Wnt/βcatenin pathway activity 20 hr after over-expression of BATLuc and Renilla constructs together with control, T, Hoxa13, or Hoxa13+T. Stars represent the p-value of the two-tailed Student's t-test applied between the different conditions. *p < 0.05; ***p < 0.005. Error bars represent the standard error to the mean (SEM).
Figure 10 with 1 supplement
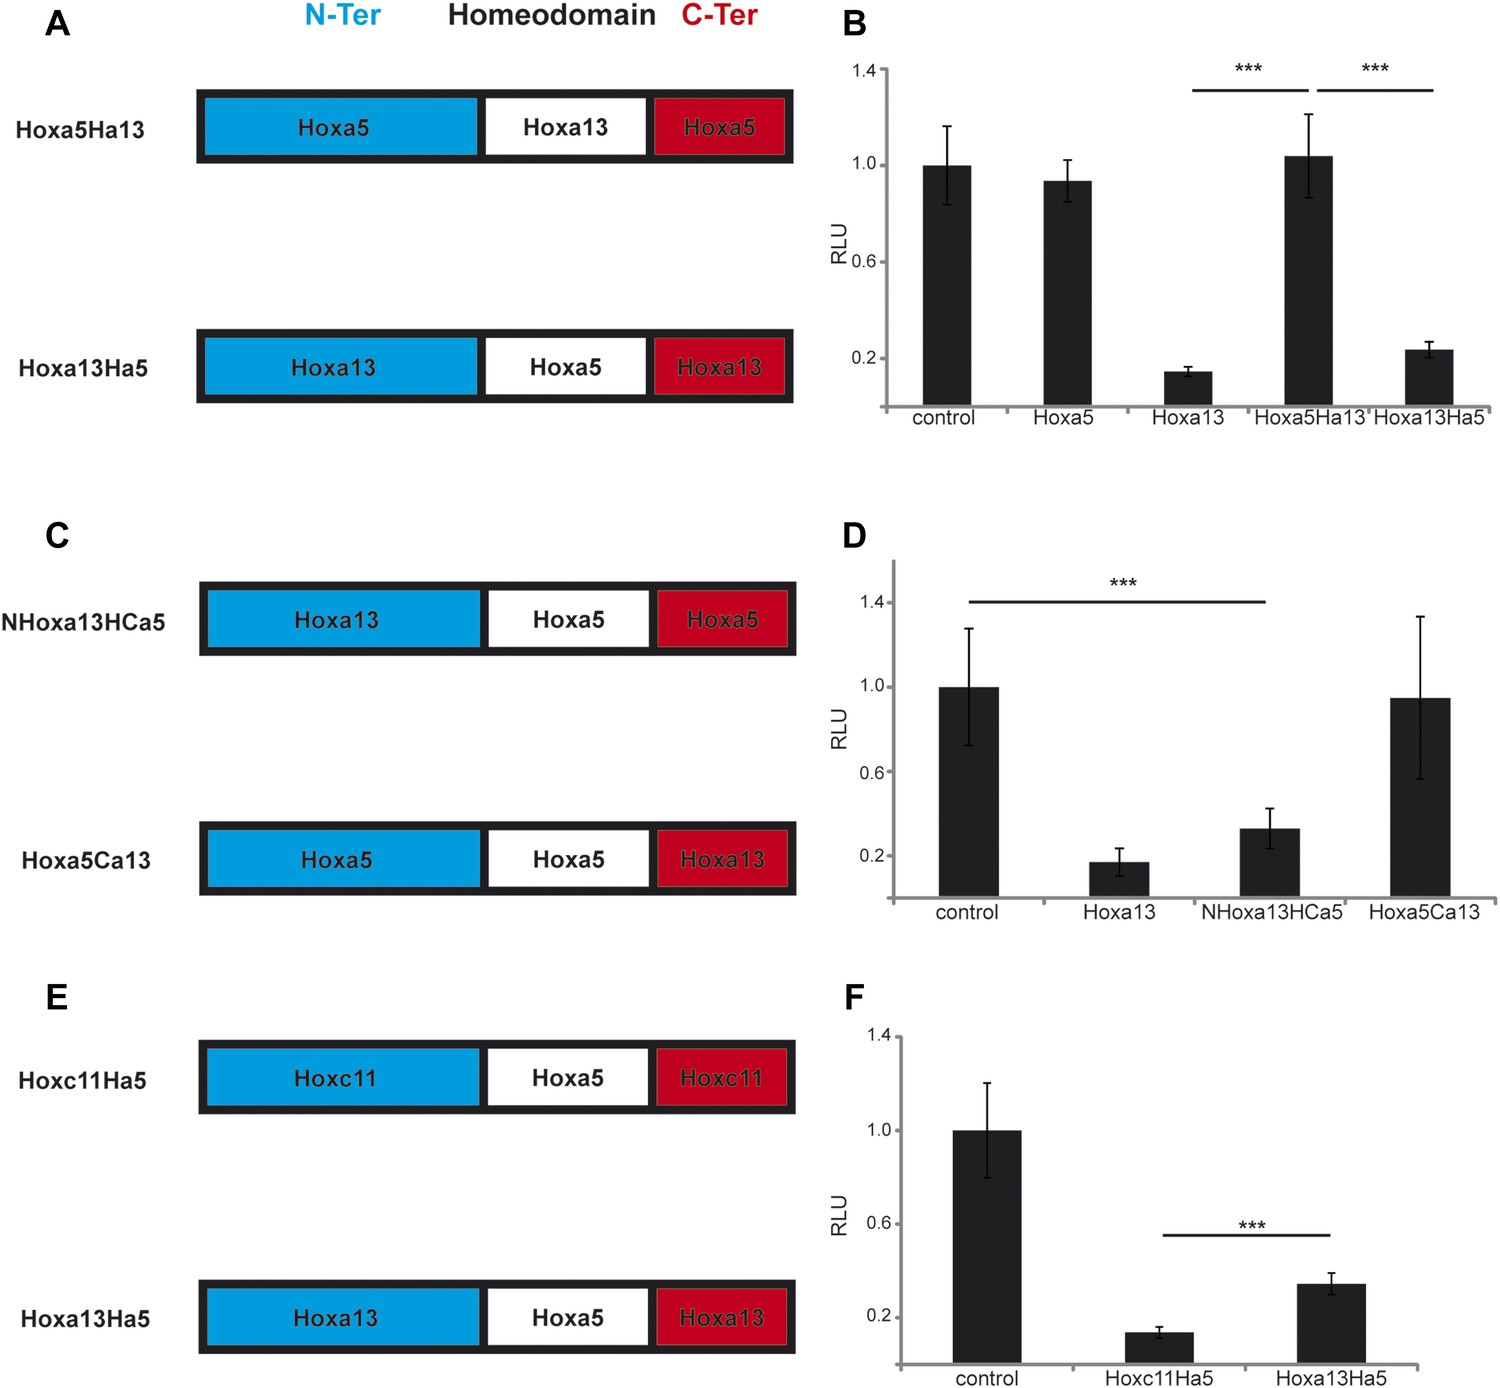
The N-terminal region of posterior Hox genes contains the repressive domain.
(A, C, E) Design of the Hox chimeras. N-ter is in blue, the homeodomain in white, and the C-ter in red. (B, D, F) Luciferase assay measuring T/brachyury expression 20 hr after over-expression of cTprLuc and Renilla constructs together with (B) control, Hoxa5, Hoxa13, Hoxa5Ha13, or Hoxa13Ha5, (D) control, Hoxa13, NHox13HCa5, or Hoxa5Ca13, (E) control, Hoxc11Ha5, or Hoxa13Ha5. Stars represent the p-value of the two-tailed Student's t-test applied between the different conditions. ***p < 0.005. Error bars represent the standard error to the mean (SEM).
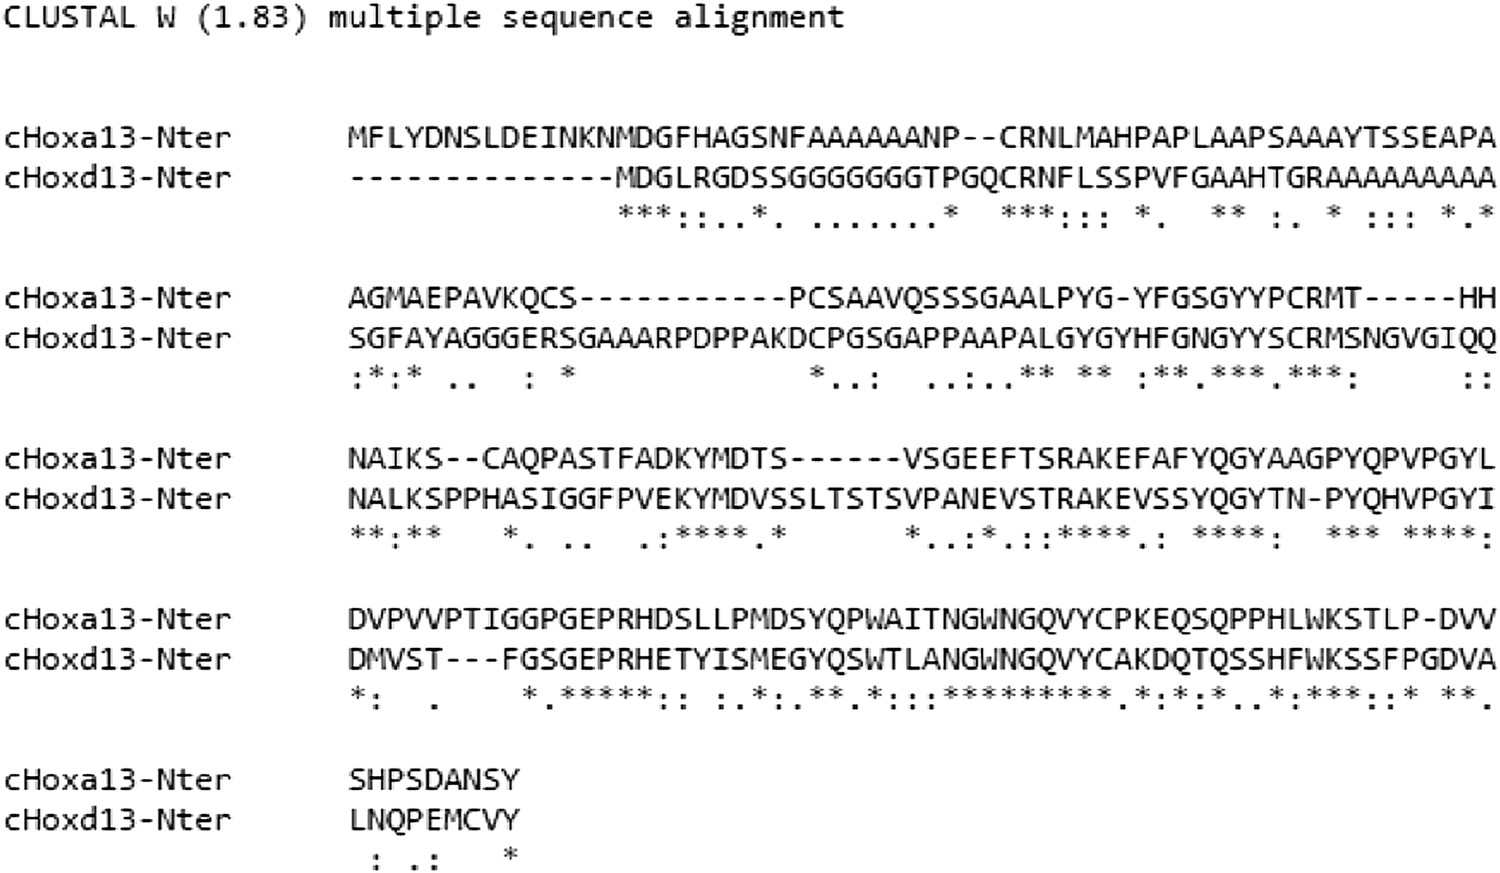
Figure 10—figure supplement 1
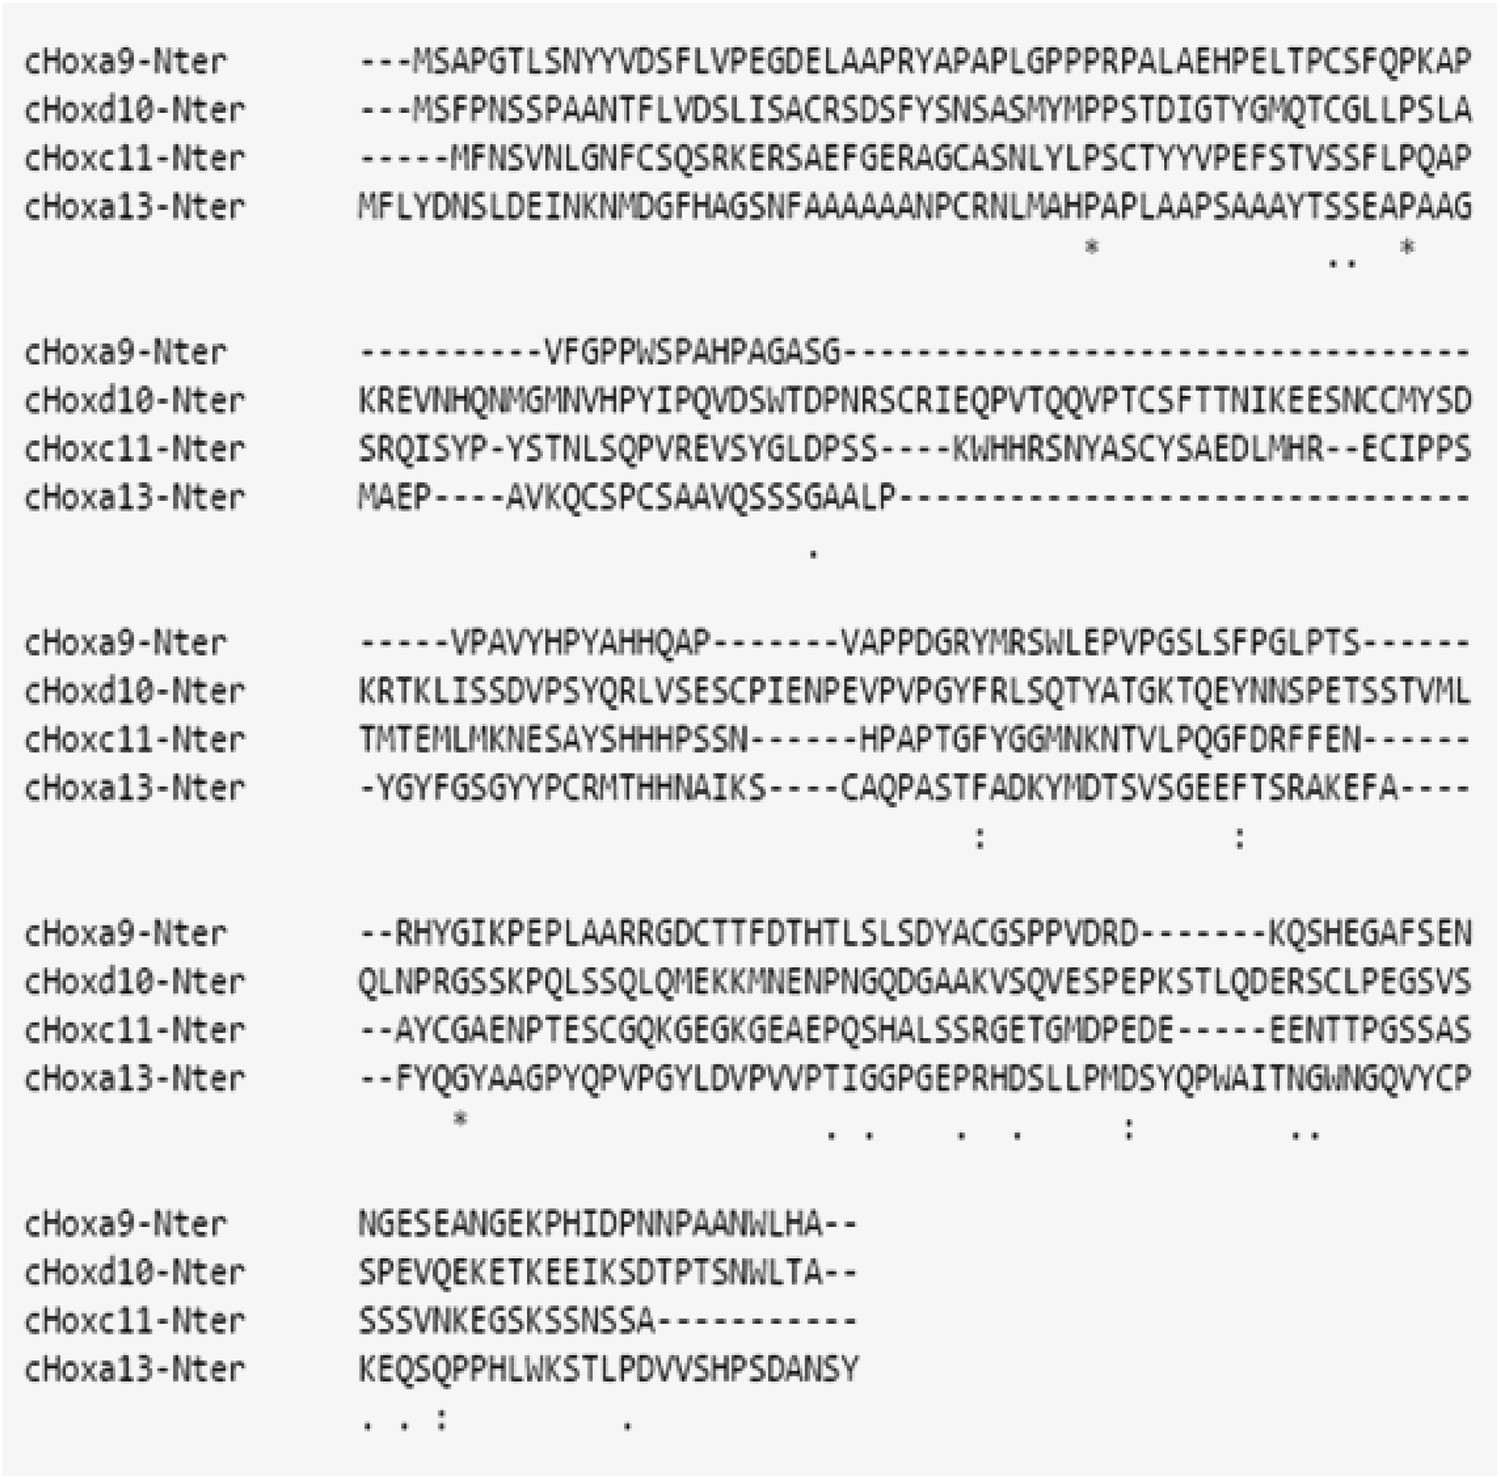
The N-ter region of posterior Hox genes is poorly conserved at the amino-acid level.
ClustalW alignment of the N-ter region of Hoxa9, Hoxd10, Hoxc11, and Hoxa13 shows poor conservation at the amino acid level.
Figure 11
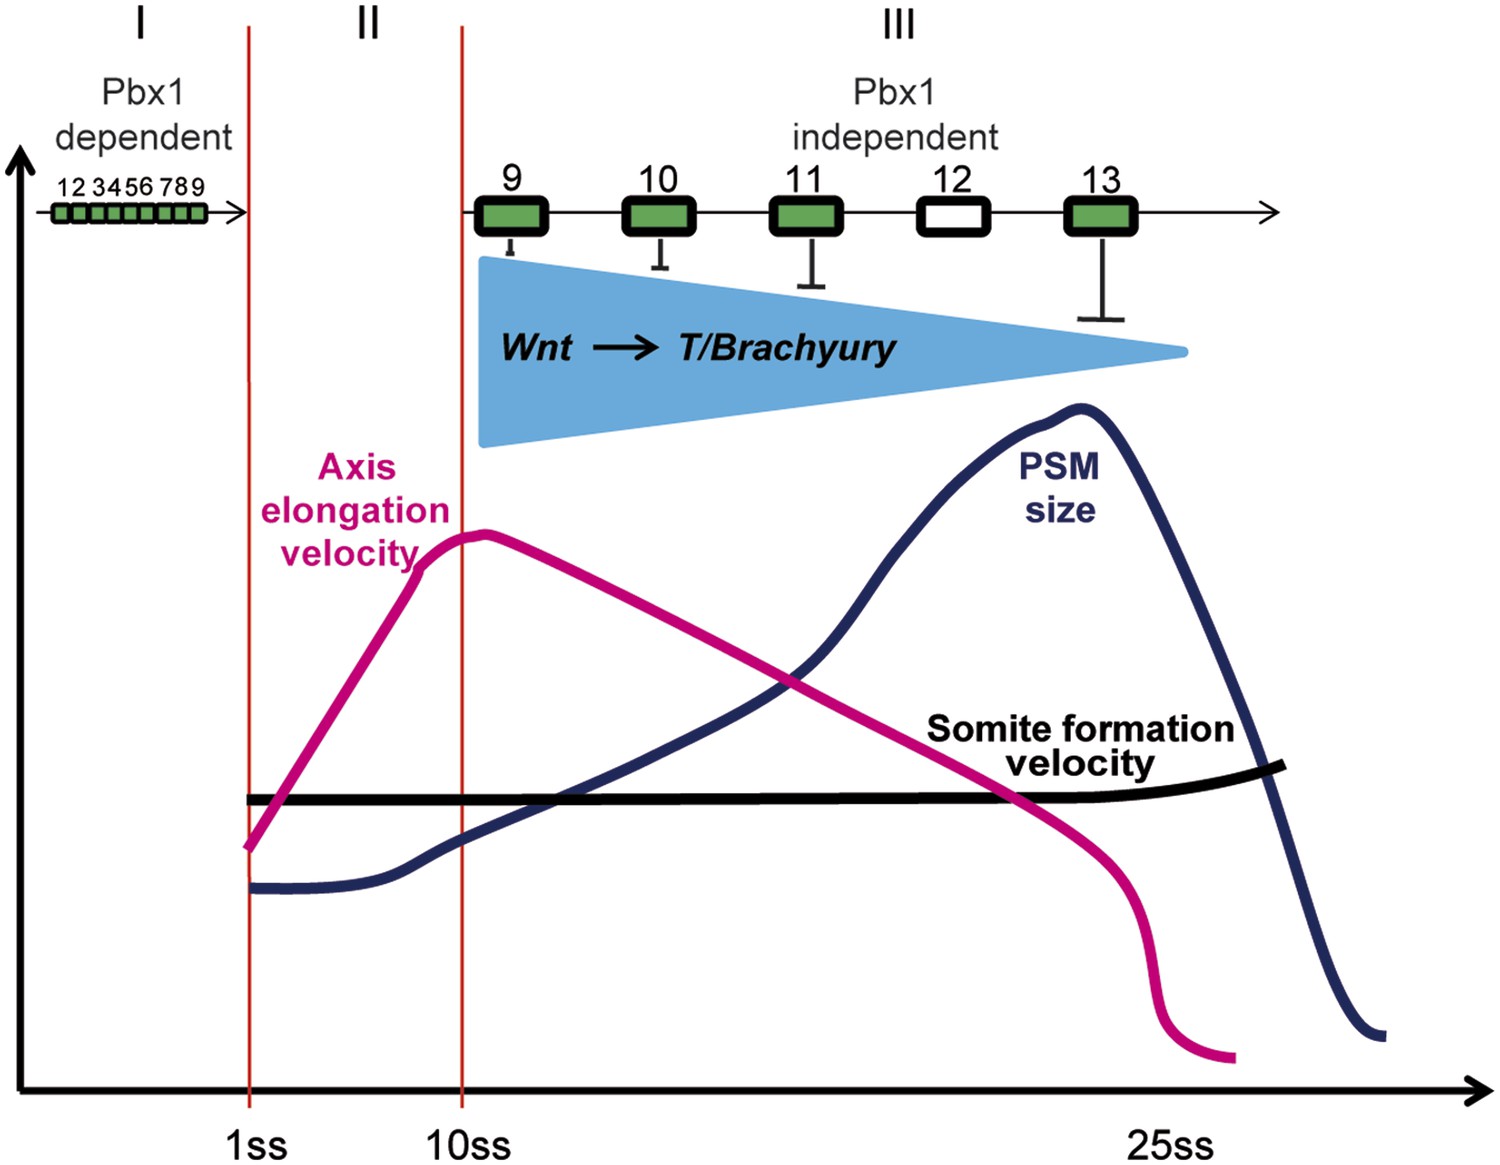
Model representing the 3 phases (I, II, and III) of Hox action in PM precursors in the epiblast/tail-bud during axis elongation.
Model representing the 3 phases (I, II, and III) of Hox action in PSM precursors in the epiblast/tail-bud during body axis elongation. Anterior Hox genes (paralogs 1–9) are expressed during phase I. They control cell ingression in a Pbx1-dependent manner leading to the collinear positioning of Hox genes expression domains in the anterior region of the embryo. No Hox genes are activated during phase II, allowing fast elongation of the embryonic axis. During phase III, posterior Hox genes (paralogs 9–13) are collinearly activated in PSM precursors. Our data suggest that collinear activation of posterior Hox genes leads to repression of Wnt signaling and its target T/Brachyury, which progressively increases in strength. This results in a progressive arrest of cell ingression in the PSM, leading to a decrease in axis elongation rate. Since the velocity of somite formation is roughly constant, PSM size starts to decrease when elongation velocity becomes slower than that of somite formation. During this latter phase the control of cell ingression by posterior Hox genes appears to be independent of Pbx1.
Author response image 1
Videos
Video 1
Time-lapse video of an embryo from Stage 5 HH to 29 somites showing the different phases of axis elongation (Bright-field, ventral view, anterior is up).
https://doi.org/10.7554/eLife.04379.003
Video 2
Time-lapse videos showing axis elongation slow-down around the 25-somite stage.
Bright-field imaging of chicken embryos at 15–17 somites (left panel), 20–22 somites (middle panel), and 25–27 somites (right panel) (ventral view, anterior is up).
Video 3
Time-lapse video showing the precise targeting of PSM progenitors and the ingression of the epiblast cells to form the PSM.
Bright-field (purple) merged with fluorescent images of PSM cell progenitors electroporated with a control H2B-Venus (ventral view, anterior is up) from stage 6 HH onwards.
Video 4
Effect of Hoxa9, Hoxc11, and Hoxa13 electroporation on axis elongation and ingression.
Bright-field (purple) merged with fluorescent images of PSM cell progenitors electroporated with either a control H2B-Venus (first panel from the left), Hoxa9-ires2-H2B-Venus (second panel from the left), Hoxc11-ires2-H2B-Venus (third panel) or a Hoxa13-ires2-H2B-Venus (right panel) constructs (green) (ventral view, anterior is up) from Stage 6 HH onwards. Over-expression of Hoxa9, c11, and a13 affects ingression and axis elongation in a collinear fashion.
Video 5
Effect of Pbx1 over-expression between the 5- and 9-somite stage.
Bright-field (purple) merged with fluorescent images of PSM cell progenitors electroporated with either a control pBIC (left panel) or a Pbx1pBIC (right panel) construct (green) (ventral view, anterior is up). Over-expression of Pbx1 slows down axis elongation.
Video 6
Activation of Wnt/βcatenin signaling and T over-expression rescue Hoxa13 axis elongation phenotype.
Bright-field (purple) merged with fluorescent images of PSM cell progenitors electroporated with Hoxa13mutH-ires2-H2B-Venus (left panel), Hoxa13-ires2-H2B-Venus (second panel), T and Hoxa13-ires2-H2B-Venus construct (third panel) or βcatLEF and Hoxa13-ires2-H2B-Venus construct (right panel) (green) (ventral view, anterior is up) from Stage 6 HH onwards.
Video 7
Activation of the Wnt/βcatenin pathway rescues the axis elongation phenotype due to Hoxd10 over-expression.
Bright-field (purple) merged with fluorescent images of PSM cell progenitors electroporated with Hoxd10mutH-ires2-H2B-Venus (left panel), Hoxd10-ires2-H2B-Venus (middle panel) or βcatLEF and Hoxd10-ires2-H2B-Venus construct (right panel) (green) (ventral view, anterior is up) from Stage 6 HH onwards.
Video 8
Activation of the Wnt/βcatenin pathway rescues the axis elongation phenotype due to Hoxc11 over-expression.
Brightfield (purple) merged with fluorescent images of PSM cell progenitors electroporated with Hoxc11mutH-ires2-H2B-Venus (left panel), Hoxc11-ires2-H2B-Venus (middle panel), or βcatLEF and Hoxc11-ires2-H2B-Venus construct (right panel) (green) (ventral view, anterior is up) from Stage 6 HH onwards.
Tables
Table 1
List of selected genes of the Wnt and FGF pathways down-regulated or up-regulated following over-expression of Hoxa13 in tail-bud cells
| Gene | Average (control) | Standard Dev (control) | Average (Hoxa13) | Standard dev (Hoxa13) | Fold change |
|---|---|---|---|---|---|
| Sp8 | 949.9 | 279.2 | 483.8 | 21.4 | 0.51 |
| Fzd2 | 139.7 | 10.7 | 78.5 | 8.6 | 0.56 |
| Axin2 | 857.8 | 42.5 | 677.0 | 99.1 | 0.79 |
| Dact2 | 415.8 | 134.4 | 989.8 | 270.1 | 2.38 |
| Cyp26a1 | 625.1 | 258 | 102.9 | 13 | 0.16 |
| Fgf8 | 1523.9 | 159.3 | 591.2 | 65 | 0.39 |
| Etv1 | 296.6 | 113.2 | 155.1 | 23.8 | 0.52 |
| Fgfr1 | 145.9 | 5.8 | 80 | 0.6 | 0.55 |
| Rasgrp3 | 1441.3 | 671.8 | 362.8 | 218.8 | 0.25 |
Table 2
List of primers used for Q-RT PCR
| Gene name | Gene reference | Primers sequence 5′→3′ | Size of the amplicon |
|---|---|---|---|
| Gapdh | NM_204305.1 | F: GCTGAGAACGGGAAACTTGTG | 62 bp |
| R: GGGTCACGCTCCTGGAAGA | |||
| T | NM_204940.1 | F: CGAGGAGATCACAGCTTTAAAAATT | 75 bp |
| R: TCATTTCTTTCCTTTGCGTCAA | |||
| Axin2 | NM_204491.1 | F: GCGCAAACGATAGTGAGATATCC | 76 bp |
| R: CCATCTACACTGCTGTCTGTCATTG | |||
| Sp8 | NM_001198666.1 | F: CATGGCGCACCCCTACGAGTC | 131 bp |
| R: CGTTGGGGGCACGTCGATCCA | |||
| Fzd2 | NM_204222.1 | F: CCCTGCCCGCTGCACTTCAC | 190 bp |
| R: CCGCTCACACCGTGGTCTCG | |||
| Cyp26a1 | NM_001001129.1ik | F: AGGAGCCCGAGGGTGGCTACA | 138 bp |
| R: TGGCAGTGGTTTCATGACCTCCAA | |||
| Fgf8 | NM_001012767.1 | F: CGCTCTTCAGCTACGTGTTCATGC | 108 bp |
| R: TGGTAGGTGCGCACGAGCC | |||
| Etv1 | NM_204917.1 | F: ATGGACCACAGATTTCGCCGCC | 145 bp |
| R: TTGGACGTCCTTCCCTCGGCA | |||
| Fgfr1 | NM_205510.1 | F: CACGCTGCCCGACCAAGCTC | 168 bp |
| R: GTGATGCGCGTGCGGTTGTT | |||
| Rasgrp3 | NM_001006401.1 | F: AACGGCATCTCCAAGTGGGTCCA | 111 bp |
| R: GAGATGAAGGAGCTTCTGTGCAACA |
Additional files
-
Supplementary file 1
List of genes regulated by Hoxa13 in our microarray screen. (A) List of genes upregulated in the PSM precursors after Hoxa13 overexpression. (B) List of genes downregulated in the PSM precursors after Hoxa13 overexpression.
- https://doi.org/10.7554/eLife.04379.029
Download links
A two-part list of links to download the article, or parts of the article, in various formats.
Downloads (link to download the article as PDF)
Open citations (links to open the citations from this article in various online reference manager services)
Cite this article (links to download the citations from this article in formats compatible with various reference manager tools)
Hox genes control vertebrate body elongation by collinear Wnt repression
eLife 4:e04379.
https://doi.org/10.7554/eLife.04379


