Genetic transformation of structural and functional circuitry rewires the Drosophila brain
- National Centre for Biological Sciences, Tata Institute for Fundamental Research, India
- Manipal University, India
- University of California, San Diego, United States
- Institute for Molecular Oncology, Italy
- University of Basel, Switzerland
Figures
Figure 1

Development, morphogenesis, and differential Otd expression in two identified central brain neuroblast lineages, LALv1 and ALad1.
(A and B) show anterior and lateral views of 3D reconstructions of the LALv1 (green) and the ALad1 (magenta) lineages in the larval brain. (A) shows that the cell bodies are closely apposed to each other and lie above the larval antennal lobe (AL, yellow), (B) shows their tracts diverge—the ALad1 tract (magenta) projects dorsally and the LALv1 tract (green) projects posteriorly behind the AL and splits. (C and D) show WT MARCM clones of the larval ALad1 and LALv1 lineages, respectively. Their cell bodies are outlined by white dotted lines and the white arrows trace their tracts. Insets in C and D show that while LALv1 cells (cyan arrow in D) express Otd, ALad1 cells (cyan arrow in C) do not. (E–L) is a third larval instar brain (CS) immunolabelled with neurotactin (green, to identify lineages), Otd (red) and TOPRO-3 (to label nuclei). The LALv1 lineage is documented in E–H, and the ALad1 lineage is documented in I–L. The neuroblasts are marked with yellow dotted lines and the lineages are marked with white dotted lines. The LALv1 neuroblast expresses Otd (yellow arrow in F) and the ALad1 neuroblast does not (yellow arrow in J). (M and N) show anterior and lateral views of 3D reconstructions of the LALv1 (green) and the ALad1 (magenta) lineages in the adult brain. Note that the adult antennal lobe (AL, yellow in M and N) is situated between the ALad1 lineage (antero-dorsal to AL) and the LALv1 lineage (ventral to AL) and the cell bodies of these lineages are not closely apposed anymore. The arrows in M and N indicate the ALad1 tract (magenta), which projects dorsally towards the protocerebrum and the LALv1 tract (green), which projects posterior to the AL. (O and P) show WT clones of the adult LALv1 and ALad1 lineages, respectively. Their cell bodies are outlined by white dotted lines and the AL is outlined by yellow dotted lines. White arrows trace the tracts of these lineages. The LALv1 lineage innervates the lateral accessory lobe (LAL) and the central complex (CC). The ALad1 lineage innervates the calyx of the mushroom body (MB) and lateral horn (LH). The midline is represented by a yellow line in all images. Scale bars in C (applicable to D) and in L (applicable to E–L) are 20 µm. Scale bar in P (applicable to O) is 50 µm. Genotypes in C and D: FRT19A/FRT19A,Tub-Gal80,hsFLP; Tub-Gal4,UAS-mCD8::GFP/+. Genotype in O: FRT19A/FRT19A,Tub-Gal80,hsFLP; Per-Gal4,UAS-mCD8::GFP/+. Genotype in P: FRT19A/FRT19A,Tub-Gal80,hsFLP; GH146-Gal4,UAS-mCD8::GFP/+.
Figure 2
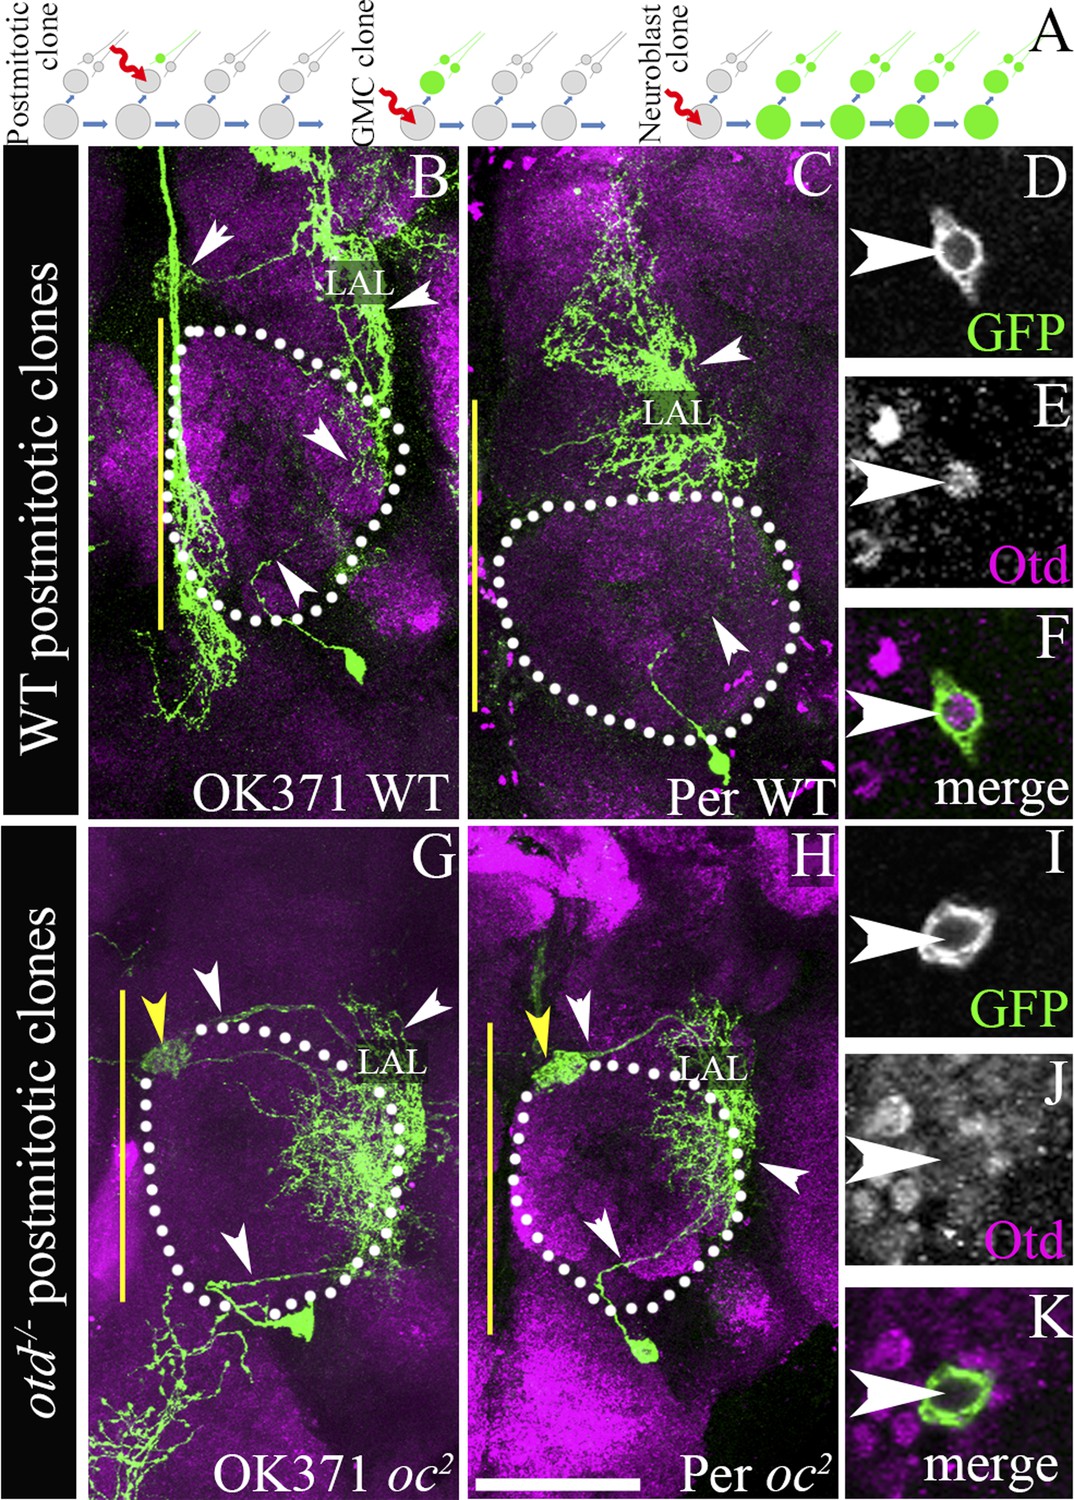
otd−/− postmitotic clones of the LALv1 lineage.
(A) shows a schematic of clone generation by the MARCM method. (B and C) document two wild-type single cell MARCM clones of the LALv1 lineage. These neurons skirt around the antennal lobe (white dotted lines) and innervate the LAL. (D–F) show that these wild-type single cell clones express Otd. (G and H) document two single cell otd−/− MARCM clones of the LALv1 lineage. (I–K) shows one such cell (I), which does not express Otd (J). Note that the otd−/− single cell clones of the LALv1 lineage shown in G and H skirt around the antennal lobe and innervate the LAL and one of the central complex nodule (yellow arrowhead in G and H), like the wild-type single cell clones shown in B and C. Genotypes in B–F: FRT19A/FRT19A,Tub-Gal80,hsFLP; Per-Gal4 or OK371-Gal4,UAS-mCD8::GFP/+. Genotypes in G–K: FRT19A,oc2/FRT19A,Tub-Gal80,hsFLP; Per-Gal4 or OK371-Gal4,UAS-mCD8::GFP/+. Scale bar is 50 µm. Yellow line represents the midline.
Figure 3
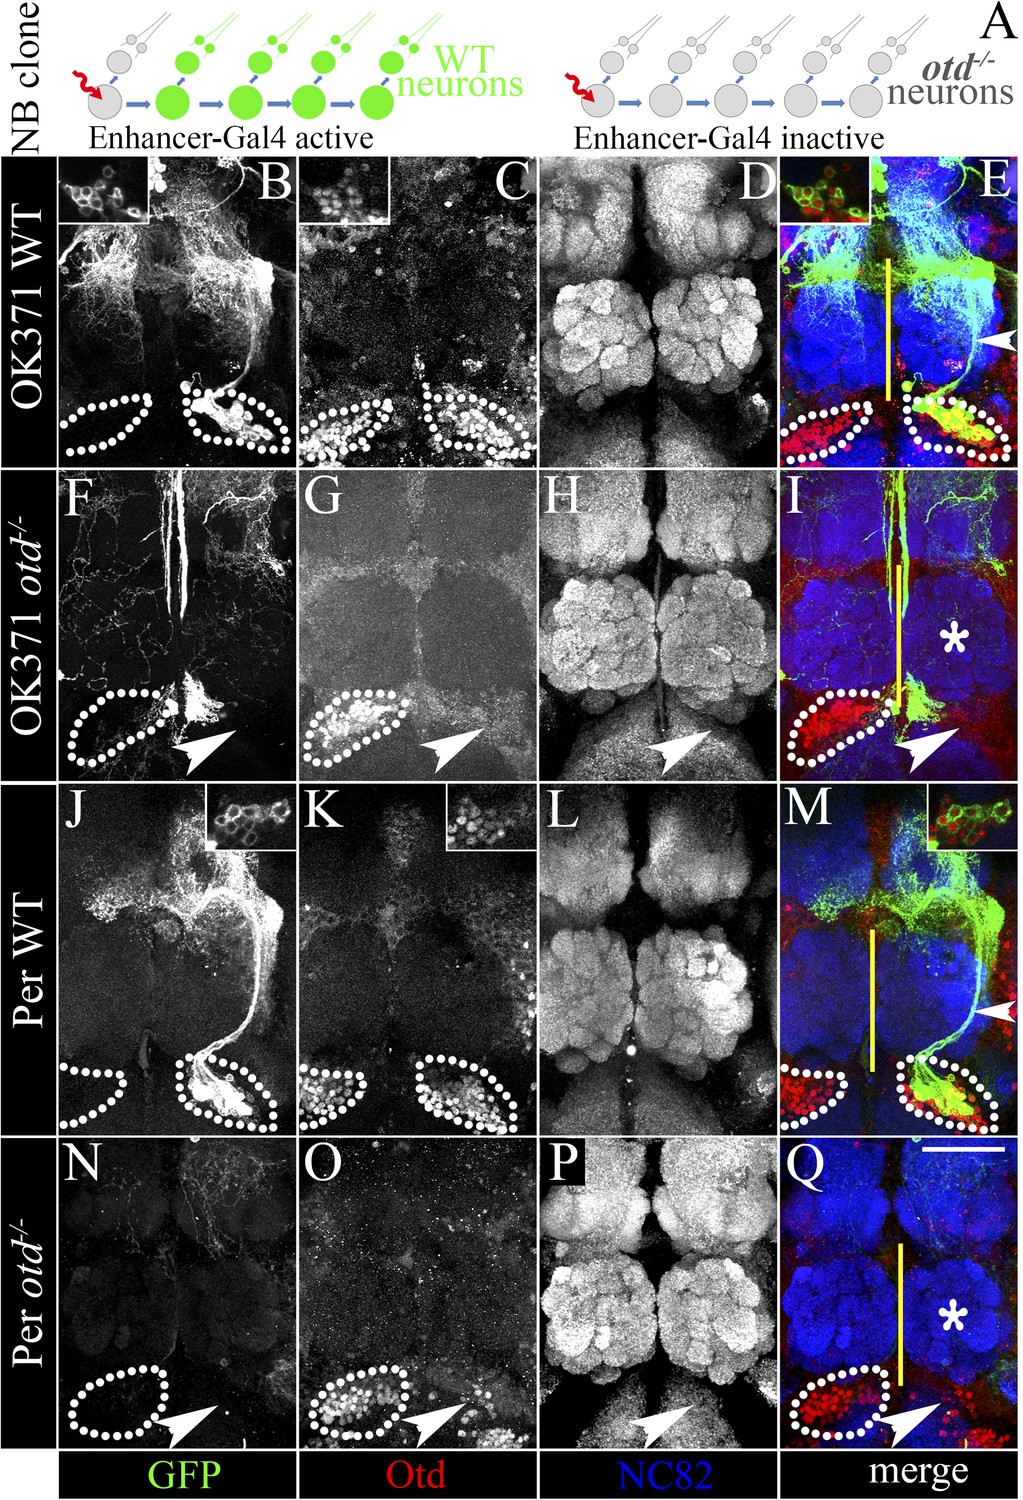
Loss of otd from the LALv1 lineage results in the suppression of the OK371 and Per enhancers.
(A) schematises the experimental logic. In neuroblast clones of the LALv1 lineage-specific enhancer Gal4s label the wild-type LALv1 neurons because they are active in the lineage (for example, OK371 and Per). Inability to label the LALv1 neurons in otd−/− neuroblast clones of the LALv1 lineage (detectable by absence of Otd immunolabelling) will suggest that the enhancers become suppressed in the mutant neurons. The brains in B–E and J–M show wild-type MARCM clones of the LALv1 lineage labelled by OK371-Gal4 and Per-Gal4, respectively. The insets in B–E and J–M show that these cells express Otd. The brains in F–I and N–Q show otd−/− clones of the LALv1 lineage. Otd expression is lost in one hemisphere in these brains (white arrowhead in G and O; compare with the Otd expression within white dotted lines in the other brain hemisphere). Neither the OK371-Gal4 (F) nor the Per-Gal4 (N) enhancers drive the expression of UAS-mCD8::GFP in these cells and the transformed lineage is not labelled in these experiments. Genotype in B–E: FRT19A/FRT19A,Tub-Gal80,hsFLP; OK371-Gal4,UAS-mCD8::GFP/+. Genotype in F–I: FRT19A, otdYH13/FRT19A,Tub-Gal80,hsFLP; OK371-Gal4,UAS-mCD8::GFP/+. Genotype in J–M: FRT19A/FRT19A,Tub-Gal80,hsFLP; Per-Gal4,UAS-mCD8::GFP/+. Genotype in N–Q: FRT19A, otdYH13/FRT19A,Tub-Gal80,hsFLP; Per-Gal4,UAS-mCD8::GFP/+. Midline is represented by a yellow line. Scale bar is 50 µm.
Figure 4 with 2 supplements
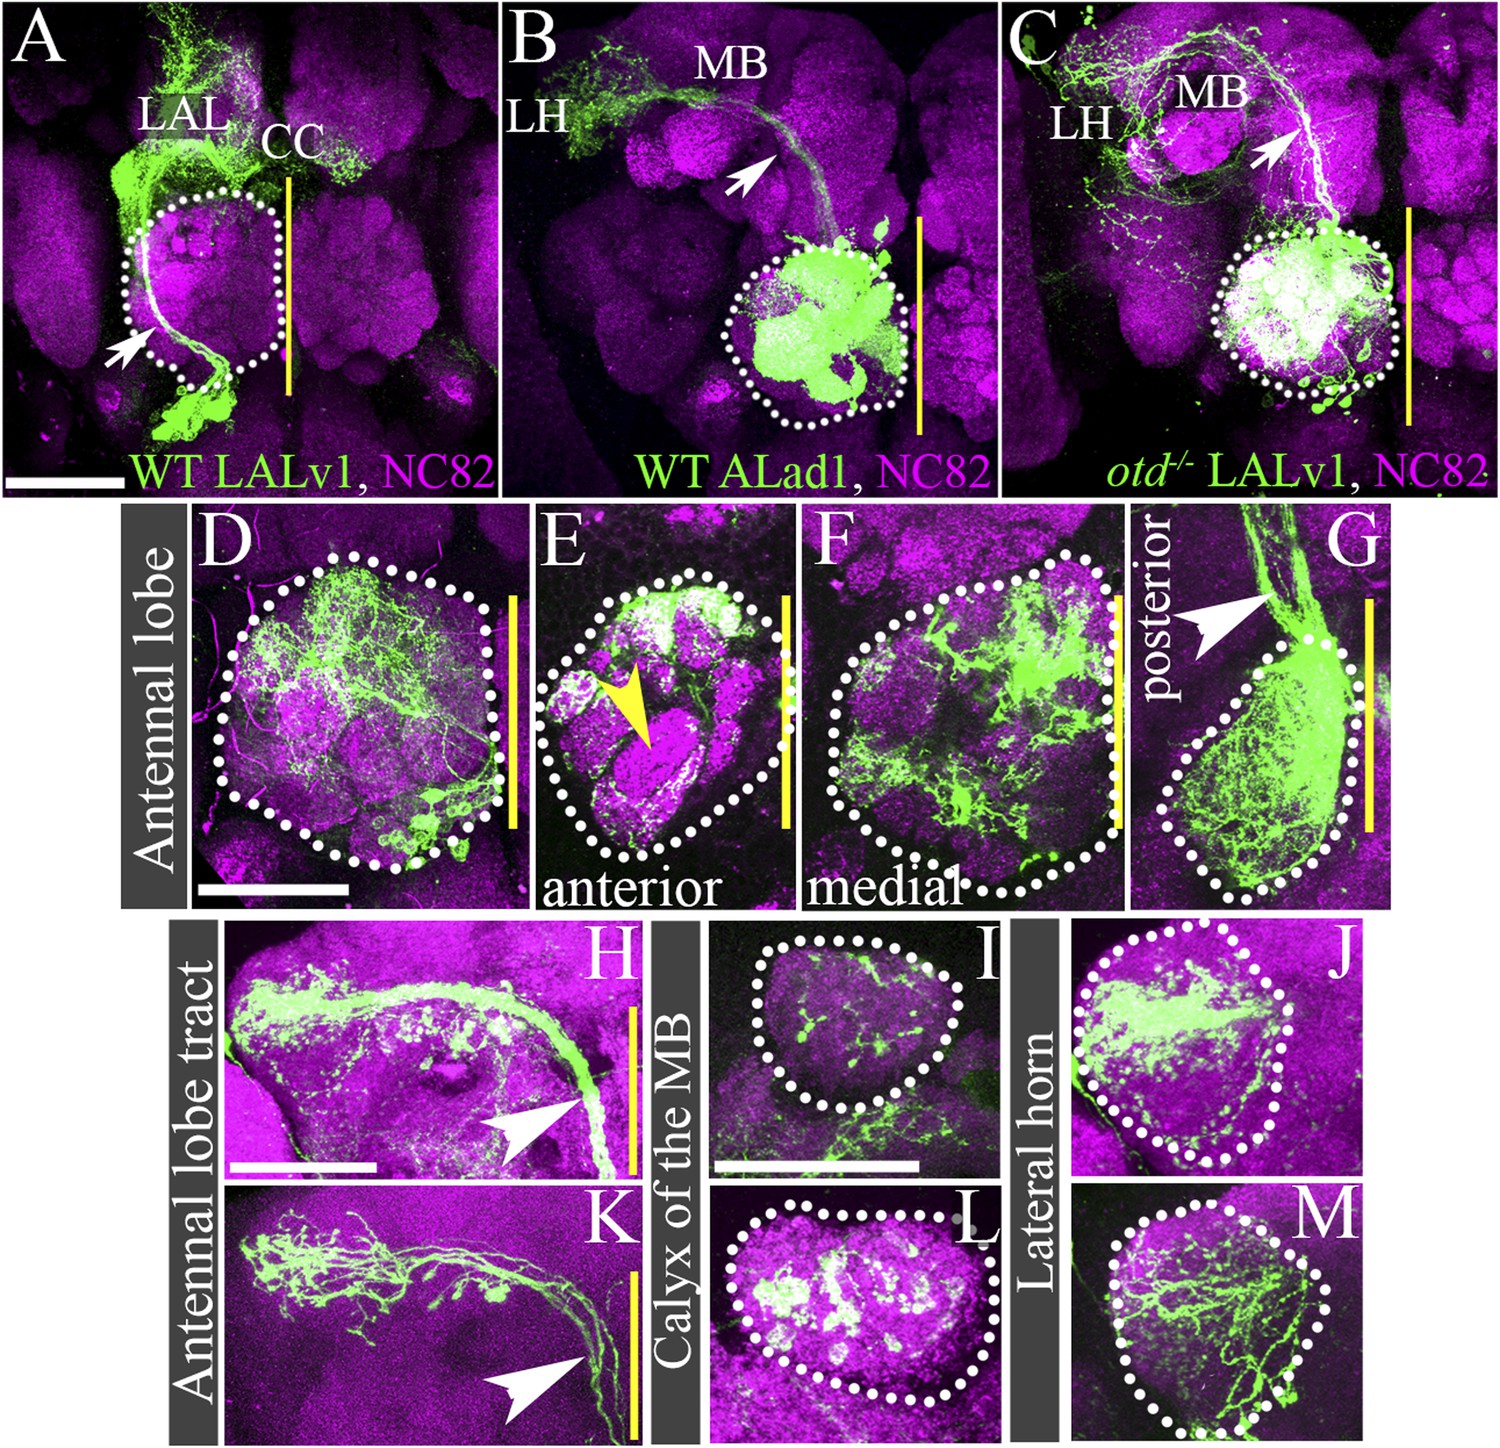
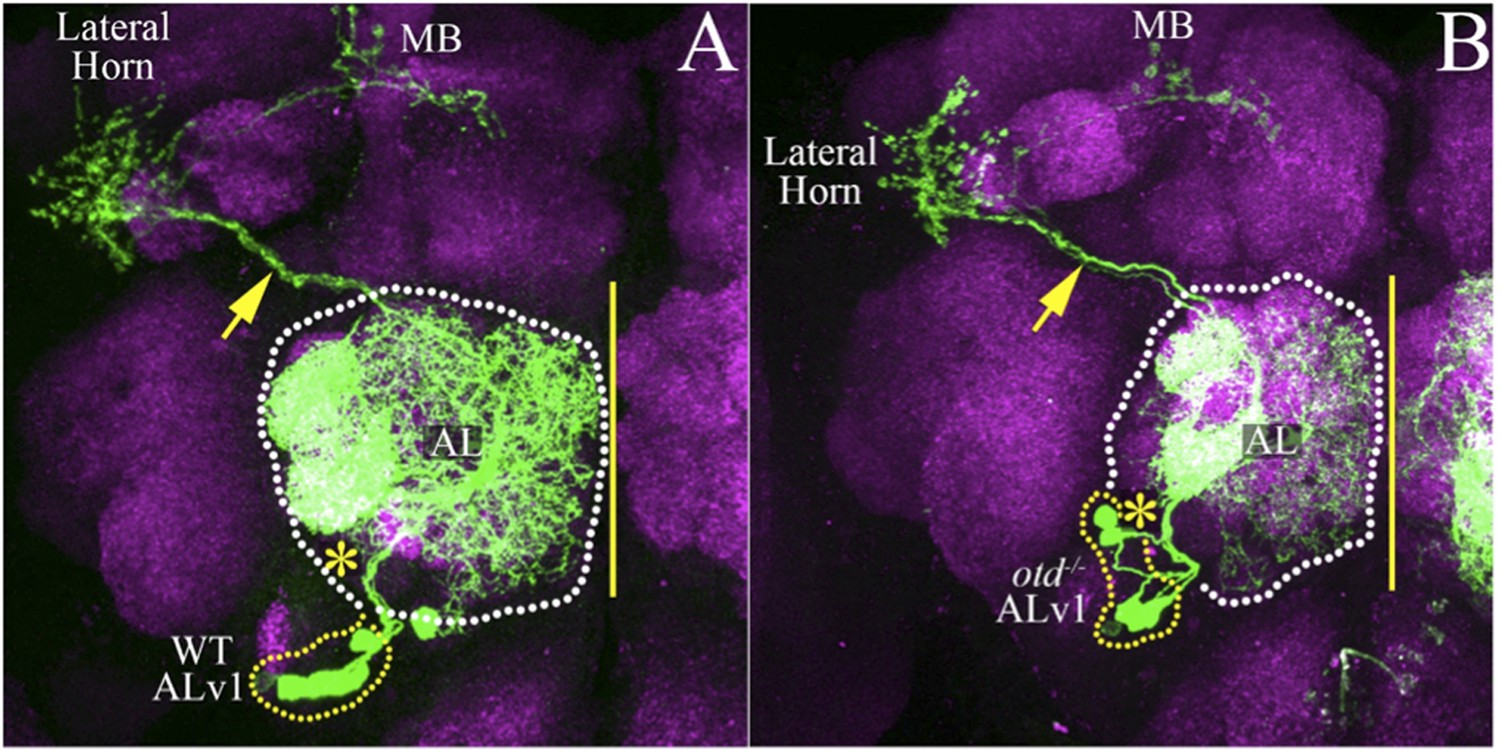
Loss of otd from LALv1 lineage results in activation of the antennal lobe-specific enhancer, GH146-Gal4, thus allowing detailed study of the neuroanatomy of the transformed otd-−/− LALv1 lineage.
(A and B) show WT LALv1 and ALad1 lineages, respectively, and (C) shows an otd−/− LALv1 lineage. Note that the neuroanatomy of the otd−/− LALv1 lineage (C) is completely unlike the WT LALv1 lineage (A) and is strikingly similar to the WT ALad1 lineage (B). (D–M) document different brains that contain the otd−/− LALv1 lineage. They have multiglomerular dendritic innervations in the AL (D–G), but not all glomeruli are always innervated (yellow arrowhead in E). There are more innervations in the more posterior parts of the antennal lobe (F and G). Their axon tracts project via the medial antennal lobe tract (arrowhead in C, G, H, K) to innervate the calyx of the mushroom body (MB; I and L) and the lateral horn (LH; J and M). Genotype in A: FRT19A/FRT19A,Tub-Gal80,hsFLP; Per-Gal4,UAS-mCD8::GFP/+. Genotype in B: FRT19A/FRT19A,Tub-Gal80,hsFLP; GH146-Gal4,UAS-mCD8::GFP/+. Genotype in C–M: FRT19A,oc2 or FRT19A,otdYH13/FRT19A,Tub-Gal80,hsFLP; GH146-Gal4,UAS-mCD8::GFP/+. Scale bars are 50 µm (scale bar in A is applicable to B and C; the one in D is applicable through to G; the one in H is applicable to K; the one in I is applicable to L, J, M). Yellow line represents the midline.
Figure 4—figure supplement 1

Loss of otd from the LALv1 neuroblast lineage, transforms it into an antennal lobe PN lineage.
(A and B) are Tubulin-Gal4 labelled adult, wild-type clones of the LALv1 lineage. (A) shows the anterior sections and (B) shows more posterior sections of the same clone. (A) The cell bodies of LALv1 lie ventral to the antennal lobe (AL) and express the transcription factor otd (inset in A). The axon tract of this lineage skirts around the AL (magenta arrows in A and B) and innervates the lateral accessory lobe (LAL, magenta dotted lines in A) and the central complex (CC, magenta dotted lines in B). Note that there are no innervation from this lineage in the AL. (C and D) are tubulin labelled adult, otd null clones of the LALv1 NB lineage. (C) shows the anterior sections, and (D) shows more posterior sections of the same clone. The otd−/− LALv1 lineage innervates the AL (magenta dotted lines in C and D) and sends its axon tracts towards the protocerebrum (magenta arrows in D).
Figure 4—figure supplement 2

Expressing full-length otd in the otd−/− LALv1 lineage rescues the transformation phenotype.
(A–D) is a MARCM labelled otd−/− LALv1 lineage that also expresses UAS-otd. The cell bodies of the otd−/− LALv1 lineage shown in A (magenta dotted lines) express the transgenic UAS-otd, shown in B (magenta dotted lines). The neuroanatomy of this rescued lineage resembles that of the WT LALv1 lineage, which skirts around the antennal lobe (yellow dotted lines) and innervates the lateral accessory lobe (white arrowheads). Genotype: FRT19A,otdYH13 or oc2/FRT19A,Tub-Gal80,hsFLP; Tub-Gal4,UAS-mCD8::GFP/UAS-otd).
Figure 5
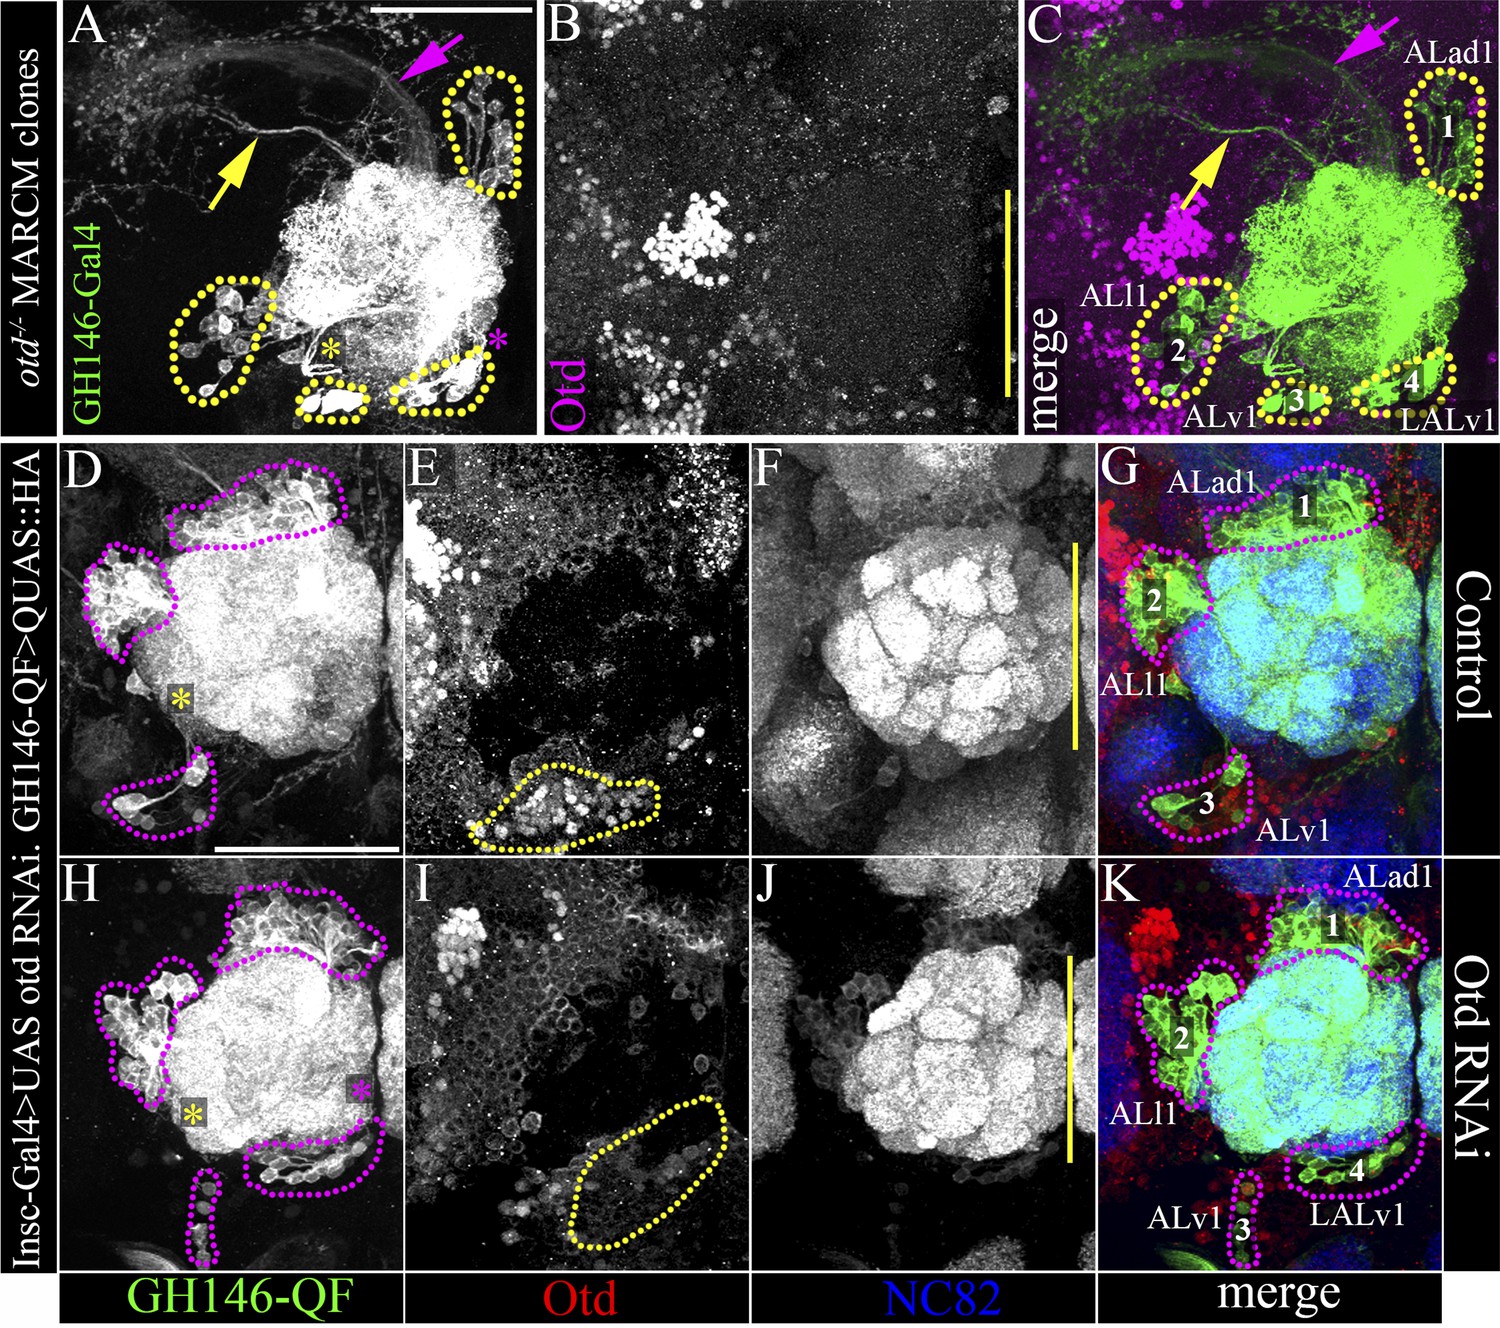
Loss of otd from the LALv1 lineage results in an extra, fourth antennal lobe lineage labelled by the GH146 enhancer.
(A–C) document a MARCM clonal brain, in which the clones null for otd function and are labelled by the GH146-Gal4. In this brain, the three known antennal lobe lineages normally labelled by GH146-Gal4 (ALad1, ALl1, and Alv1) have been recovered, along with an additional fourth neuroblast lineage, LALv1. (D–G) document a control brain where Otd is not down regulated in the LALv1 lineage (yellow dotted lines in E). In this brain, there are three clusters of antennal lobe projection neurons labelled by GH146-QF corresponding to the ALad1, ALl1 and ALv1 lineages, magenta dotted lines in D and G). (H–K) show a brain in which there has been efficient knock down of Otd in the LALv1 lineage (note loss of Otd immunolabelling ventral to the antennal lobe; yellow dotted lines in I). In this brain, apart from the ALad1, ALl1, and ALv1 projection neurons, an additional, fourth cluster of cells is seen innervating the antennal lobe (‘4’, LALv1). The yellow asterisks in A, D, H indicate the point of entry of the ALv1 lineage into the antennal lobe, and the yellow arrow indicates its axon tract. The magenta asterisks in A, D, H indicate the point of entry of the LALv1 lineage into the antennal lobe, and the magenta arrow indicates its axon tract. Note that these are distinct from each other. Genotype in A–C: FRT19A,otdYH13/FRT19A,Tub-Gal80,hsFLP; GH146-Gal4,UAS-mCD8::GFP/+. Genotype in D–K: UASdicer/+;Insc-Gal4/UAS-miRNA-otd-1;GH146-QF,QUAS-mtdTomato-HA/+). Scale bars are 50 µm. The one in A is applicable to B and C and the one in in D is applicable to D–K. Yellow line represents the midline.
Figure 6
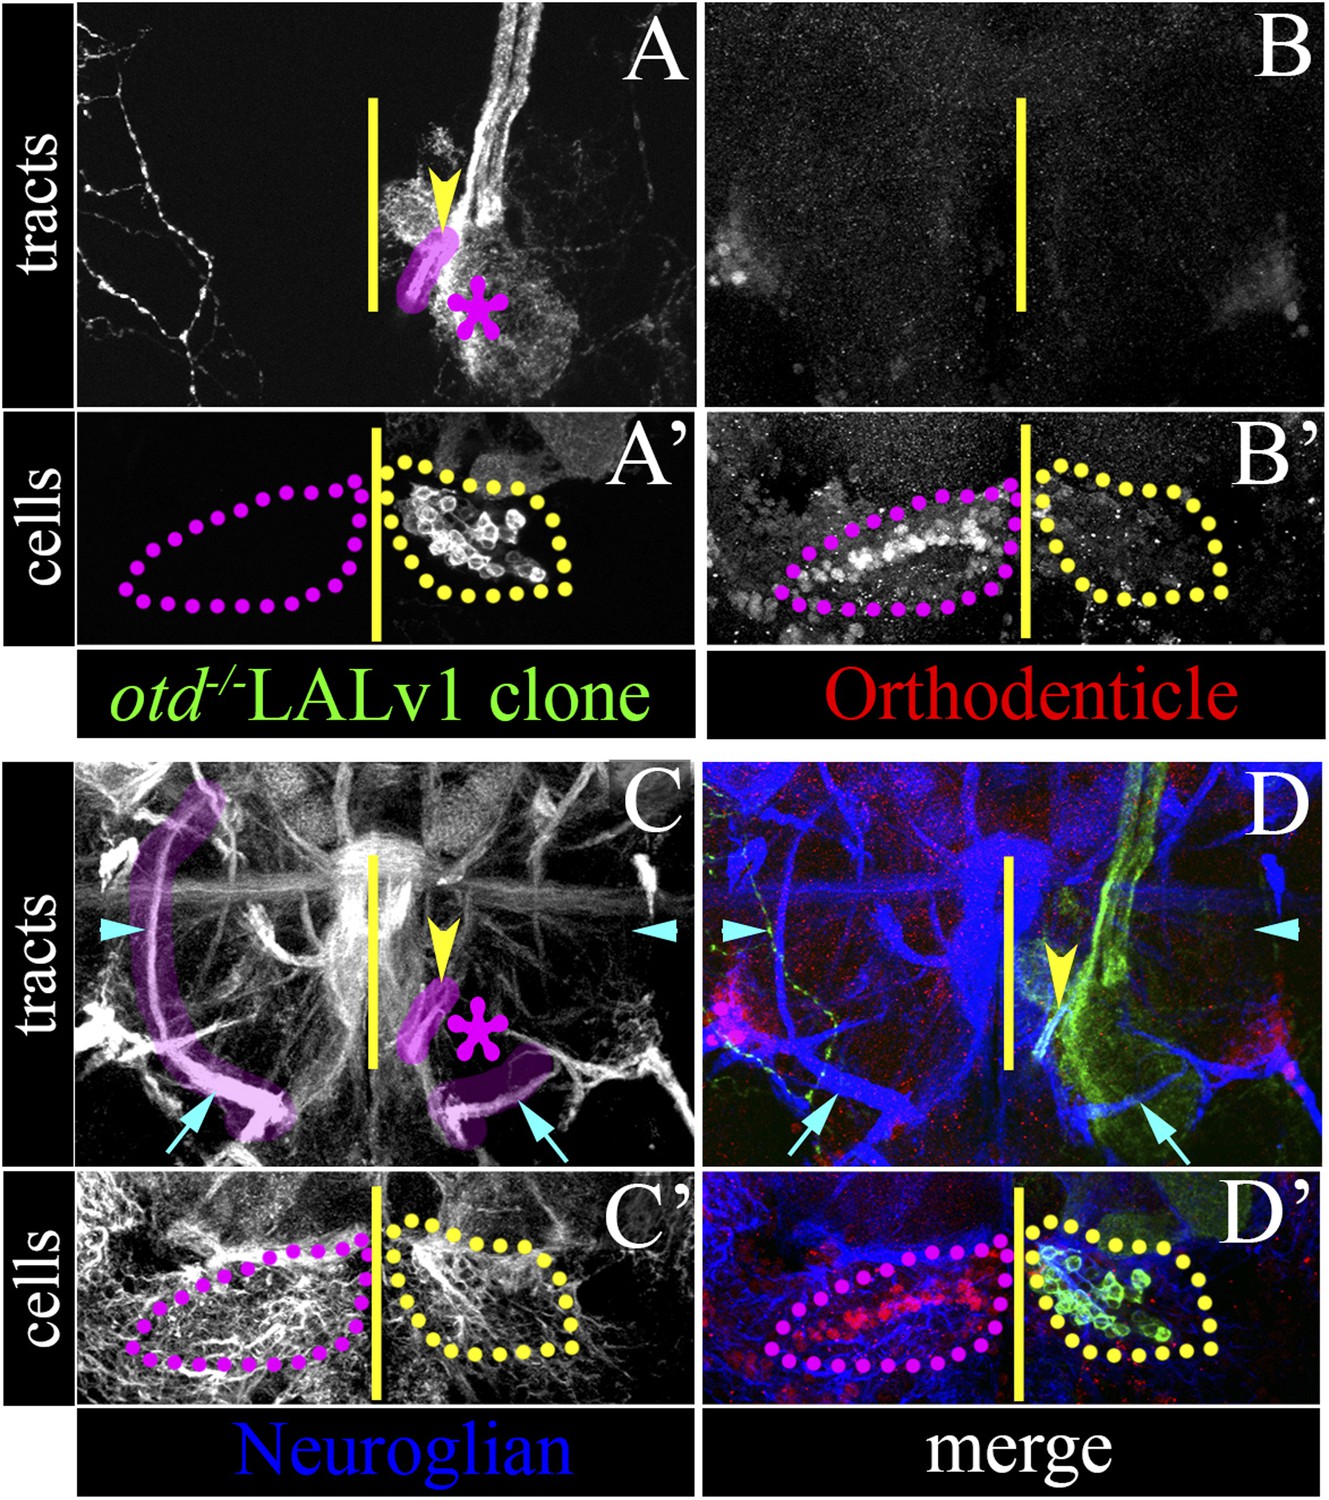
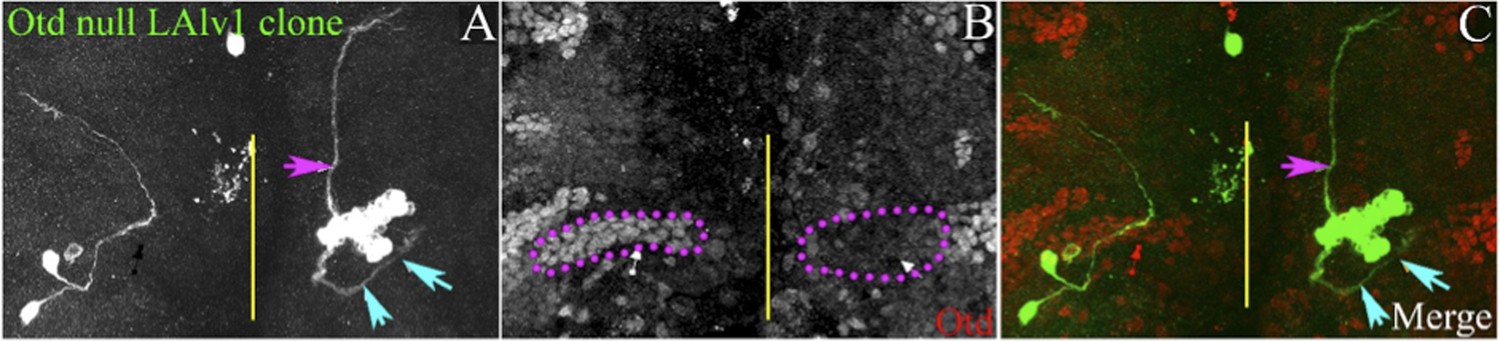
Loss of otd from the LALv1 lineage results in the absence of the LEp tract.
(A–D) and (A′–D′) document a brain with a single MARCM labelled otd−/− LALv1 lineage. (A–D) show more posterior sections that contain the tracts of the LALv1 lineage; (A′–D′) show more anterior sections of the same brain that documents its cell bodies. The right brain hemisphere contains an otd−/− LALv1 lineage as seen by the loss of Otd immunolabelling ventral to the antennal lobe (yellow dotted lines in B′), while the left hemisphere contains a wild-type LALv1 lineage (hence not labelled by MARCM) as seen by the presence of Otd immunolabelling (magenta dotted lines in B′). In the left brain hemisphere, which contains the wild-type LALv1 lineage, the loVM (cyan arrow on the left in C) and the LALv1 specific LEp tracts (cyan arrowhead on the left in C) that are identifiable by Neuroglian immunolabelling (highlighted in magenta). In the right brain hemisphere, which contains the otd−/− LALv1 lineage, the loVM tract (taken by other lineages) is still present (cyan arrow on the right in C). The LALv1 specific LEp tract (cyan arrowhead on the right in C) that is exclusively made by the LALv1 lineage, is entirely missing in the right brain hemisphere, which contains the otd−/− LALv1 lineage (cyan arrow on the right in C). The yellow arrowheads in A, C, D point to the new tract of the otd−/− LALv1 lineage innervating the antennal lobe (magenta asterisk). Genotype: FRT19A, otdYH13/FRT19A,Tub-Gal80,hsFLP; GH146-Gal4,UAS-mCD8::GFP/+. The midline is represented by a yellow line in all images.
Figure 7
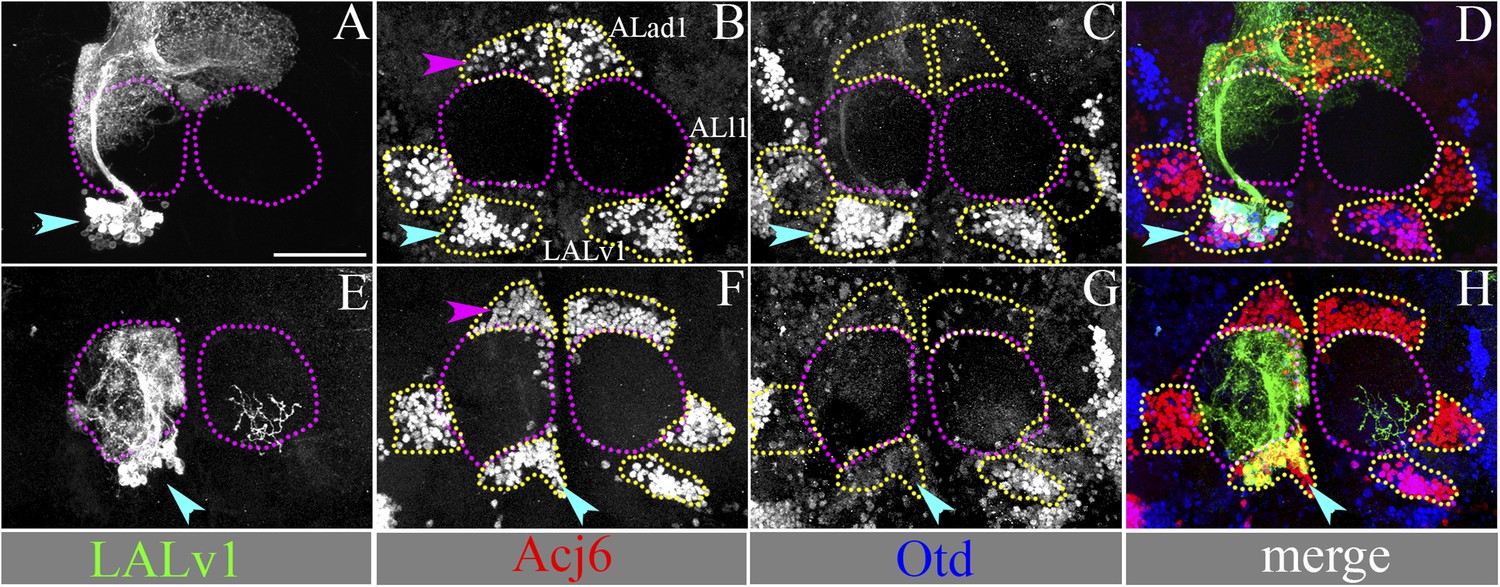
The Acj6-positive cell cluster ventral to the AL is the LALv1 lineage and when null for otd, innervates the AL.
(A–D) document a WT MARCM clone of the LALv1 lineage labelled with Per-Gal4. This brain has been immunolabelled with Acj6 (B) and Otd (C). In B, only three clusters of Acj6 positive cells (yellow dotted lines) are seen around each of the ALs (yellow dotted lines). The clusters that are ventral to AL (cyan arrowhead) belong to the LALv1 lineage as seen by the WT MARCM clone shown in A. As expected, these cells are also Otd positive (cyan arrowhead in C). (E–H) show an otd−/− LALv1 MARCM clone. This brain is also immunolabelled with Acj6 (F) and Otd (G). Note that the otd−/− LALv1 cells, which have a transformed neuroanatomy (cyan arrowhead in E), are null for otd (cyan arrowhead in G) but are identifiable as the ventral cluster of Acj6 positive cells (cyan arrowhead in F). Genotype in A–D: FRT19A/FRT19A,Tub-Gal80,hsFLP; Per-Gal4,UAS-mCD8::GFP/+. Genotype in E–H: FRT19A, otdYH13/FRT19A,Tub-Gal80,hsFLP; GH146-Gal4,UAS-mCD8::GFP/+. Scale bar is 50 µm.
Figure 8
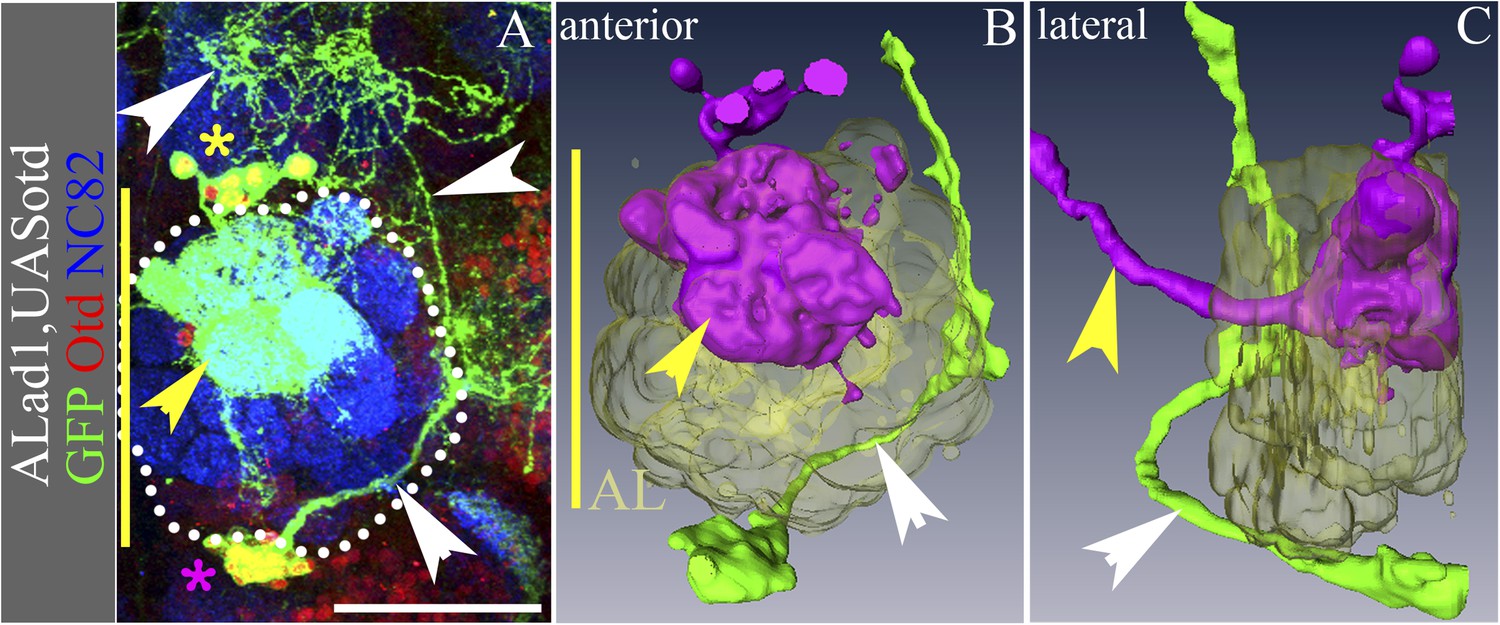
Overexpression of Otd in the ALad1 lineage results in a partial reciprocal transformation.
(A–C) ALad1 neuroblast clone misexpressing Otd. (B and C) are the anterior and lateral views of the 3D reconstructions of the clone in A. Few of the Otd misexpressing cells (yellow asterisk in A) retain the wild type neuroanatomy of the ALad1 lineage (magenta cells in the reconstructions)—they have innervations in the AL glomeruli (yellow arrowheads in A–C) and project via the antennal-cerebral tract (yellow arrowhead in C). Most of the Otd misexpressing ALad1 neurons are seen ventral to the AL (magenta asterisk in A; green cells in the reconstructions in B and C). They do not innervate the AL and instead project towards the LAL (white arrowheads in A–C). Genotype in A–C: FRT19A/FRT19A,Tub-Gal80,hsFLP; Tub-Gal4,UAS-mCD8::GFP/UAS-otd. Midline is represented by a yellow line. Scale bar is 50 µm.
Figure 9
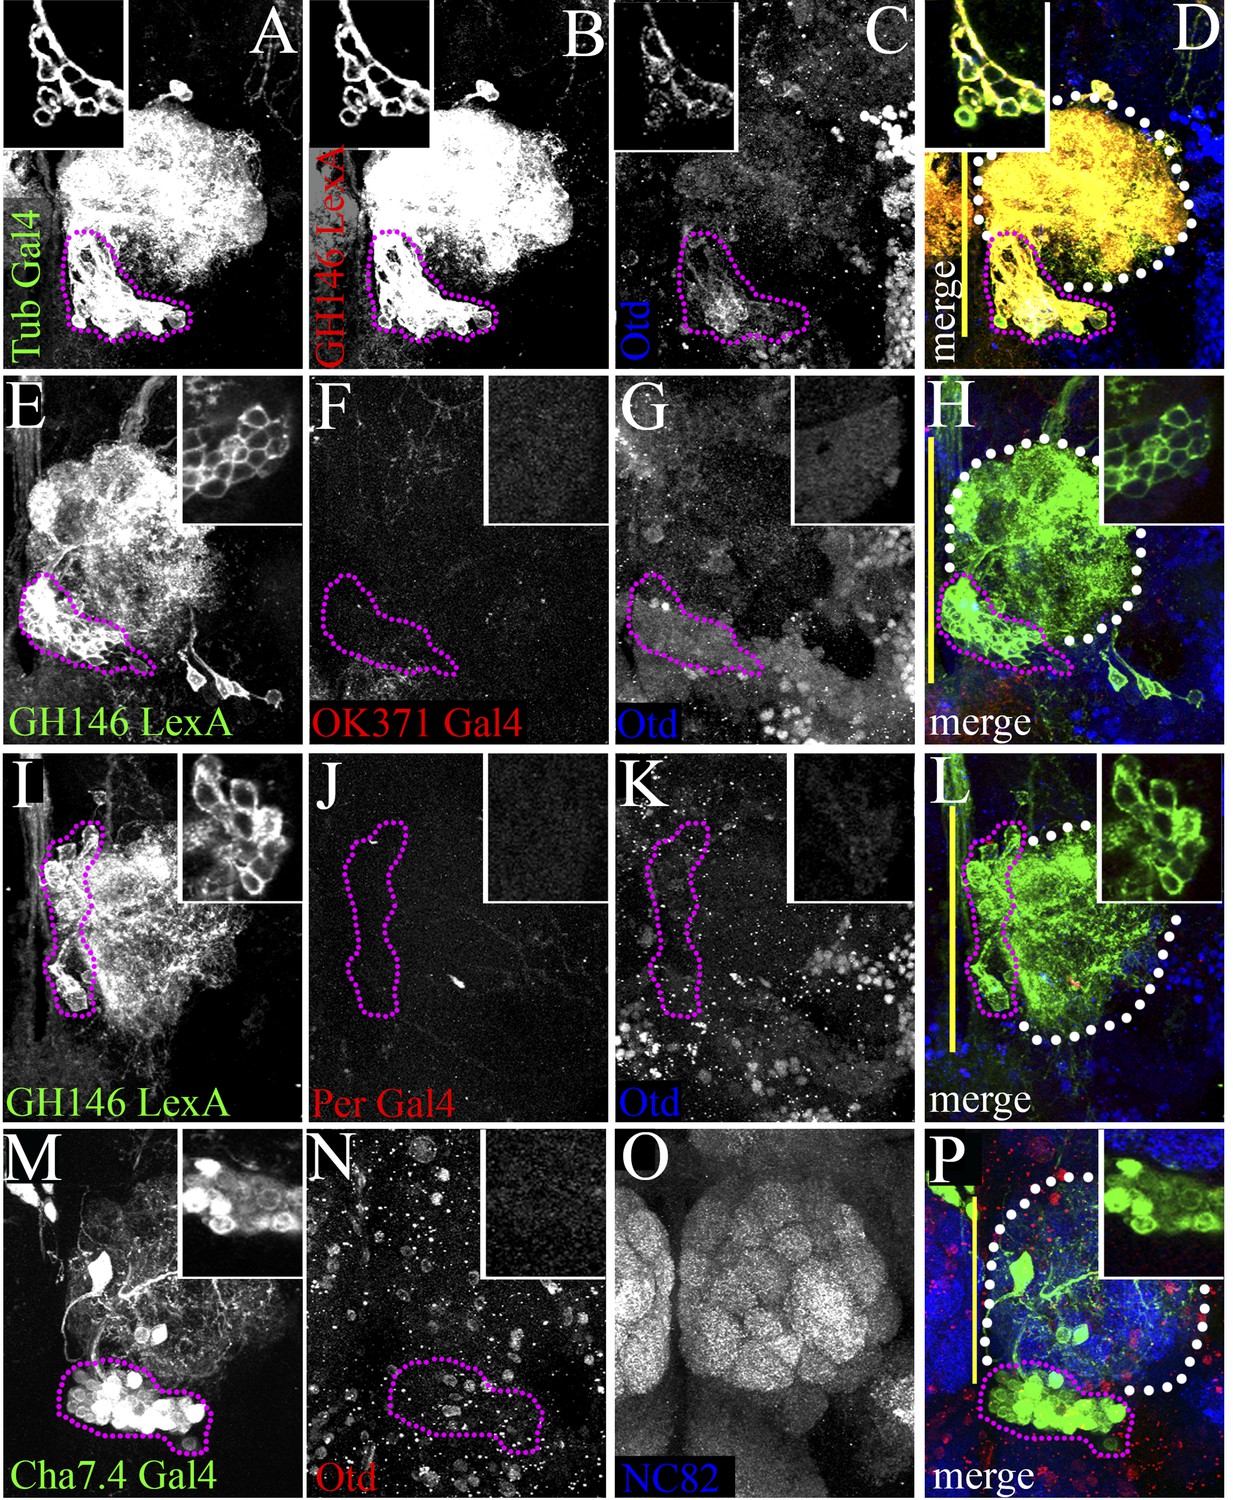
Specific molecular changes occur in the transformed otd−/− LALv1 lineage.
(A–D) documents an otd−/− LALv1 neuroblast clone that has been dual labelled with Tubulin-Gal4 (A) and GH146-LexA (B) using the dual MARCM technique. (E–H and I–L) document otd−/− LALv1 neuroblast clones that have been dual labelled with GH146-LexA (E and I) to positively label the mutant neurons and either OK371-Gal4 (E–H) or Per-Gal4 (I–L) using the dual MARCM technique. In these clones, while the GH146-LexA driver labels the transformed otd−/− LALv1 neurons (E and I), neither the OK371-Gal4 (F) nor the Per-Gal4 (J) do. (M–P) documents a transformed otd−/− LALv1 lineage (inset and magenta dotted lines in N) labelled with Cha7.4-Gal4. While Cha7.4-Gal4 is not active in the wild-type LALv1 lineage (not shown), it becomes activated in the otd−/− LALv1 lineage (inset and magenta dotted lines in M–P). Genotypes in A–D: FRT19A, otdYH13/FRT19A,Tub-Gal80,hsFLP; Tubulin-Gal4,UAS-mCD8::GFP/FRTG13,GH146-LexA::GAD,LexAop::rCD2::GFP. Genotype in E–H: FRT19A,otdYH13/FRT19A,Tub-Gal80,hsFLP; OK371-Gal4,UAS-mCD8::GFP/FRTG13,GH146-LexA::GAD,LexAop::rCD2::GFP. Genotype in I–L: FRT19A,otdYH13/FRT19A,Tub-Gal80,hsFLP;Per-Gal4,UAS-mCD8::GFP/FRTG13,GH146-LexA::GAD,LexAop::rCD2::GFP. Genotype in H: FRT19A,otdYH13/FRT19A,Tub-Gal80,hsFLP; Cha7.4-Gal4,UAS-mCD8::GFP/+. Midline is represented by a yellow line.
Figure 10
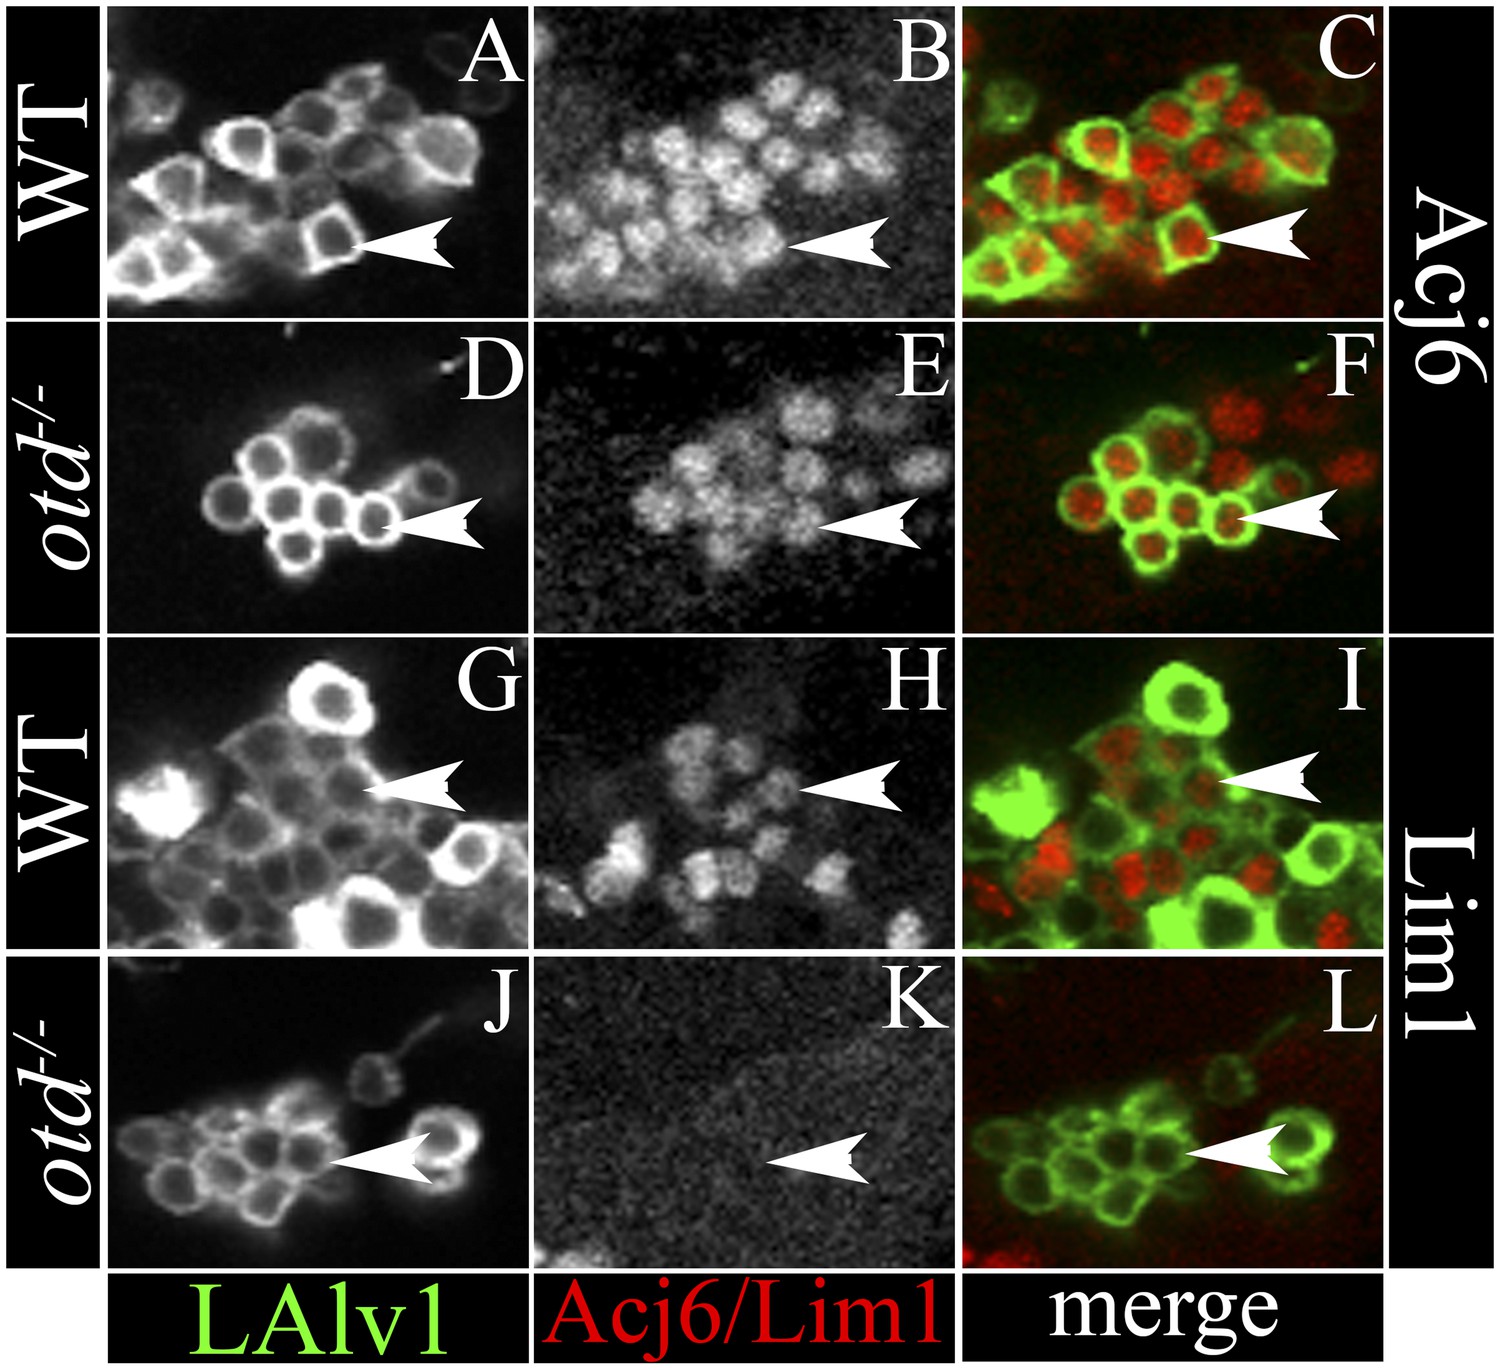
Specific molecular changes occur in the transformed otd−/− LALv1 lineage.
(A–C and G–I) document neuronal cell bodies of the wild-type LALv1 lineage immunolabelled with Acj6 (A–C) and Lim1 (G–I). The WT LALv1 neurons express both these molecular markers. (D–F and J–L) document neuronal cell bodies of the otd−/− LALv1 lineage immunolabelled with Acj6 (D–F) and Lim1 (J–L). While otd−/− LALv1 neurons continue to express Acj6 (E), they downregulate Lim1 expression (K).
Figure 11

The otd−/− transformed LALv1 lineage has functional synapses in the AL and can respond to odour stimulation.
(A) Two-photon calcium imaging from the otd−/− LALv1 neurons in response to electrical stimulation of the antennal nerve. Gray-scale image shows average pre-stimulation fluorescence of one transformed lineage. Colour images show fluorescence changes in response to different numbers of electrical stimulation (duration, 1 ms; amplitude, 10 V; frequency, 100 Hz). Graph in B shows peak amplitude of ΔF/F against the number of stimulations. Error bars represent S.E.M. n = 5. (C) Average traces that plot ΔF/F over time at different stimulus intensities. Shaded region in each trace represents S.E.M. (D) Two-photon calcium imaging from the otd−/− LALv1 neurons in response to odour stimulation of the antenna. Gray-scale image shows the structure of the transformed lineage and three identifiable glomeruli. The colour images show glomerular activation patterns evoked by isoamyl acetate (IAA), ethyl butyrate (EB), 3-octanol (3-O) and 3-heptanol (3-H). IAA activated VM2, DM2 and DM3. EB activated both VM2 and DM2. 3-O and 3-H activated DM2 and VM2, respectively. (E) Average traces that plot ΔF/F over time in VM2, DM2 and DM3. The shaded region in each trace represents S.E.M. n = 3–5. The false colour scales (ΔF) and scale bars are shown at the right of each panel. Genotype: FRT19A, otdYH13/FRT19A,Tub-Gal80,hsFLP;GH146-Gal4,UAS-GCaMP3/GH146-Gal4,UAS-GCaMP3.
Figure 12
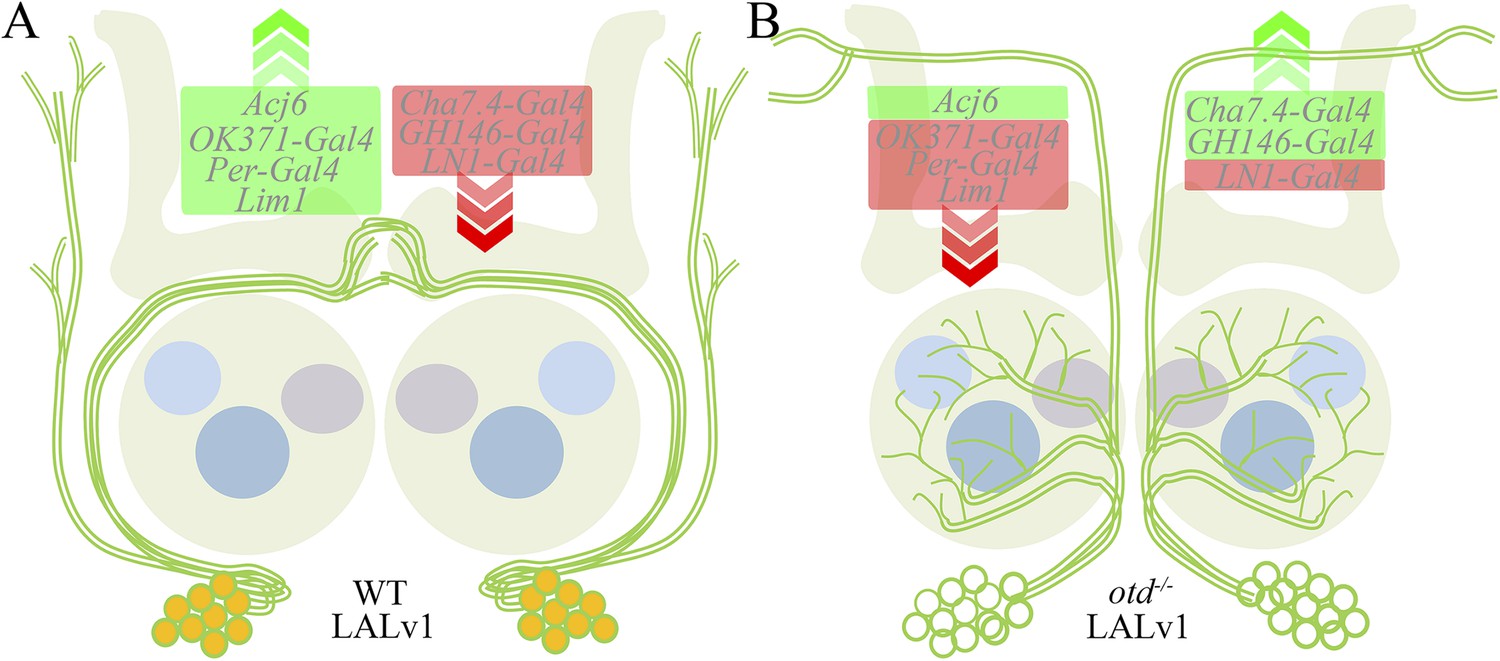
Transformation of the LALv1 lineage.
(A) The WT LALv1 is a wide-field central complex lineage that expresses Otd (orange). (B) The loss of otd function from the LALv1 neuroblast transforms these neurons into antennal lobe projection neurons. This neuroanatomical transformation is accompanied by molecular changes—markers that are active in the WT LALv1 (green box in A) are suppressed in the mutant (B; with the exception of Acj6); those that are suppressed in the WT (red box in A), are activated in the mutant (B; with the exception of LN1-Gal4). The exceptions are in agreement with a transformation to antennal lobe projection neuron fate (see Table 1).
Author response image 1
WT (A) and otd-/- (B) ALv1 lineage. Note the position of the cell body (yellow dotted lines), the lateral point of entry of axon tract into the antennal lobe (indicated by the asterisk), the use of the mediolateral antennal lobe tract (indicated by the arrow) and the predominant innervation of the lateral horn of both the WT (A) and the otd-/- ALv1 lineage (B). Midline is represented by the yellow line. Genotype in A: FRT19A/FRT19A,Tub-Gal80,hsFLP; GH146-Gal4,UAS-mCD8::GFP/+. Genotype in B: FRT19A, oc2/FRT19A,Tub-Gal80,hsFLP; GH146-Gal4,UAS-mCD8::GFP/+.
Author response image 2
Note the larval otd-/- LALv1 lineage on the right hemisphere, which shows a loss of Otd immunolabelling in B. A few neurites of this lineage enter the loVM tract (cyan arrow in A,C), while most take the medial antennal lobe tract towards the protocerebrum (magenta arrow in A,C). Midline is represented by the yellow line. Genotype: FRT19A, otdYH13/FRT19A,Tub-Gal80,hsFLP; GH146-Gal4,UAS-mCD8::GFP/+./+.
Videos
Video 1
Projection pattern of the wild-type ALad1 lineage.
https://doi.org/10.7554/eLife.04407.014
Video 2
Projection pattern of the wild-type LAlv1 lineage.
https://doi.org/10.7554/eLife.04407.013
Video 3
Projection pattern of the otd−/− LAlv1 lineage.
https://doi.org/10.7554/eLife.04407.015Tables
Table 1
Summary of the specific molecular changes in the LALv1 and Alad1 lineages
| WT LALv1 | otd−/− LALv1 | WT ALad1 | |
|---|---|---|---|
| OK371-Gal4 | + | − | − |
| Per-Gal4 | + | − | − |
| Lim | + | − | − |
| Cha7.4-Gal4 | − | + | + |
| GH146-Gal4 | − | + | + |
| LN1-Gal4 | − | − | − |
| Acj6 | + | + | + |
-
Note that the molecular signature of the otd−/− LALv1 lineage is similar to that of the wild-type ALad1 lineage.
Download links
A two-part list of links to download the article, or parts of the article, in various formats.
Downloads (link to download the article as PDF)
Open citations (links to open the citations from this article in various online reference manager services)
Cite this article (links to download the citations from this article in formats compatible with various reference manager tools)
Genetic transformation of structural and functional circuitry rewires the Drosophila brain
eLife 3:e04407.
https://doi.org/10.7554/eLife.04407


