Differential effects of light and feeding on circadian organization of peripheral clocks in a forebrain Bmal1 mutant
- University of Texas Southwestern Medical Center, United States
- Northwestern University, United States
- Howard Hughes Medical Institute, Northwestern University, United States
- University of Wisconsin, United States
- University of Tübingen, Germany
- Howard Hughes Medical Institute, University of Texas Southwestern Medical Center, United States
Figures
Figure 1 with 2 supplements

CamiCre+; Bmal1fx/fx mice are forebrain/SCN-specific Bmal1 knockouts.
(A) Dorsal view of a CamiCre-; tdTom+ control brain. Bright field. Scale bar: 1 mm. (B) Dorsal view of a CamiCre+; tdTom+ brain. Bright field. (C) Ventral view of (B). (D) Fluorescence image of a coronal brain section containing the SCN from a CamiCre+; tdTom+ mouse. (E) Confocal image of the SCN showing tdTomato expression in the CamiCre+; tdTom+ mice. Scale bar: 50 µm. (F, G) Coronal brain sections at the level of the SCN, prepared from mice sacrificed every 4 hr starting at CT2 following 2 days of DD, were hybridized in situ to examine Bmal1 (F) and Per2 (G) mRNA levels in CamiCre+; Bmal1fx/fx (BKO) mice (n = 3, except n = 4 for CT10, 14, 18) and Bmal1fx/fx (Fx/Fx) control littermates (same as BKO, except n = 1 for CT18 Bmal1 and n = 3 for CT18 Per2). Below each coronal brain section is a close-up of the SCN. (H, I) Optical density graphs of the in situ time course data displayed in (F) and (G). Shown are mean ± SEM, with significant effect of genotype in (H) [F1,46 = 40.7, p < 0.0001] and (I) [F1,44 = 1148, p < 0.0001] by GLM ANOVA. Tukey–Kramer multiple comparison post-tests (p ≤ 0.05) showed that in contrast to Fx/Fx littermates, neither Bmal1 nor Per2 mRNA is rhythmic in BKOs. (J) Immunohistochemistry for BMAL1 on SCN-containing coronal sections of Fx/Fx (n = 3), BKO (n = 3), and Bmal1−/− (KO, n = 1) mice sacrificed at ZT16. Captured with an 20× objective. (K, L) Western blot analysis of BMAL1 in BKOs sacrificed at ZT16. (K) Western blot of various tissues in Fx/Fx (n = 2), BKO littermate (n = 2), and KO (n = 1) mice. (L) Western blot of frontal cortex, cerebellum, and liver in Cre (n = 2), Fx/Fx (n = 2), BKO (n = 3), and KO (n = 2) mice. F. CTX: frontal cortex, Cer: cerebellum.
Figure 1—figure supplement 1
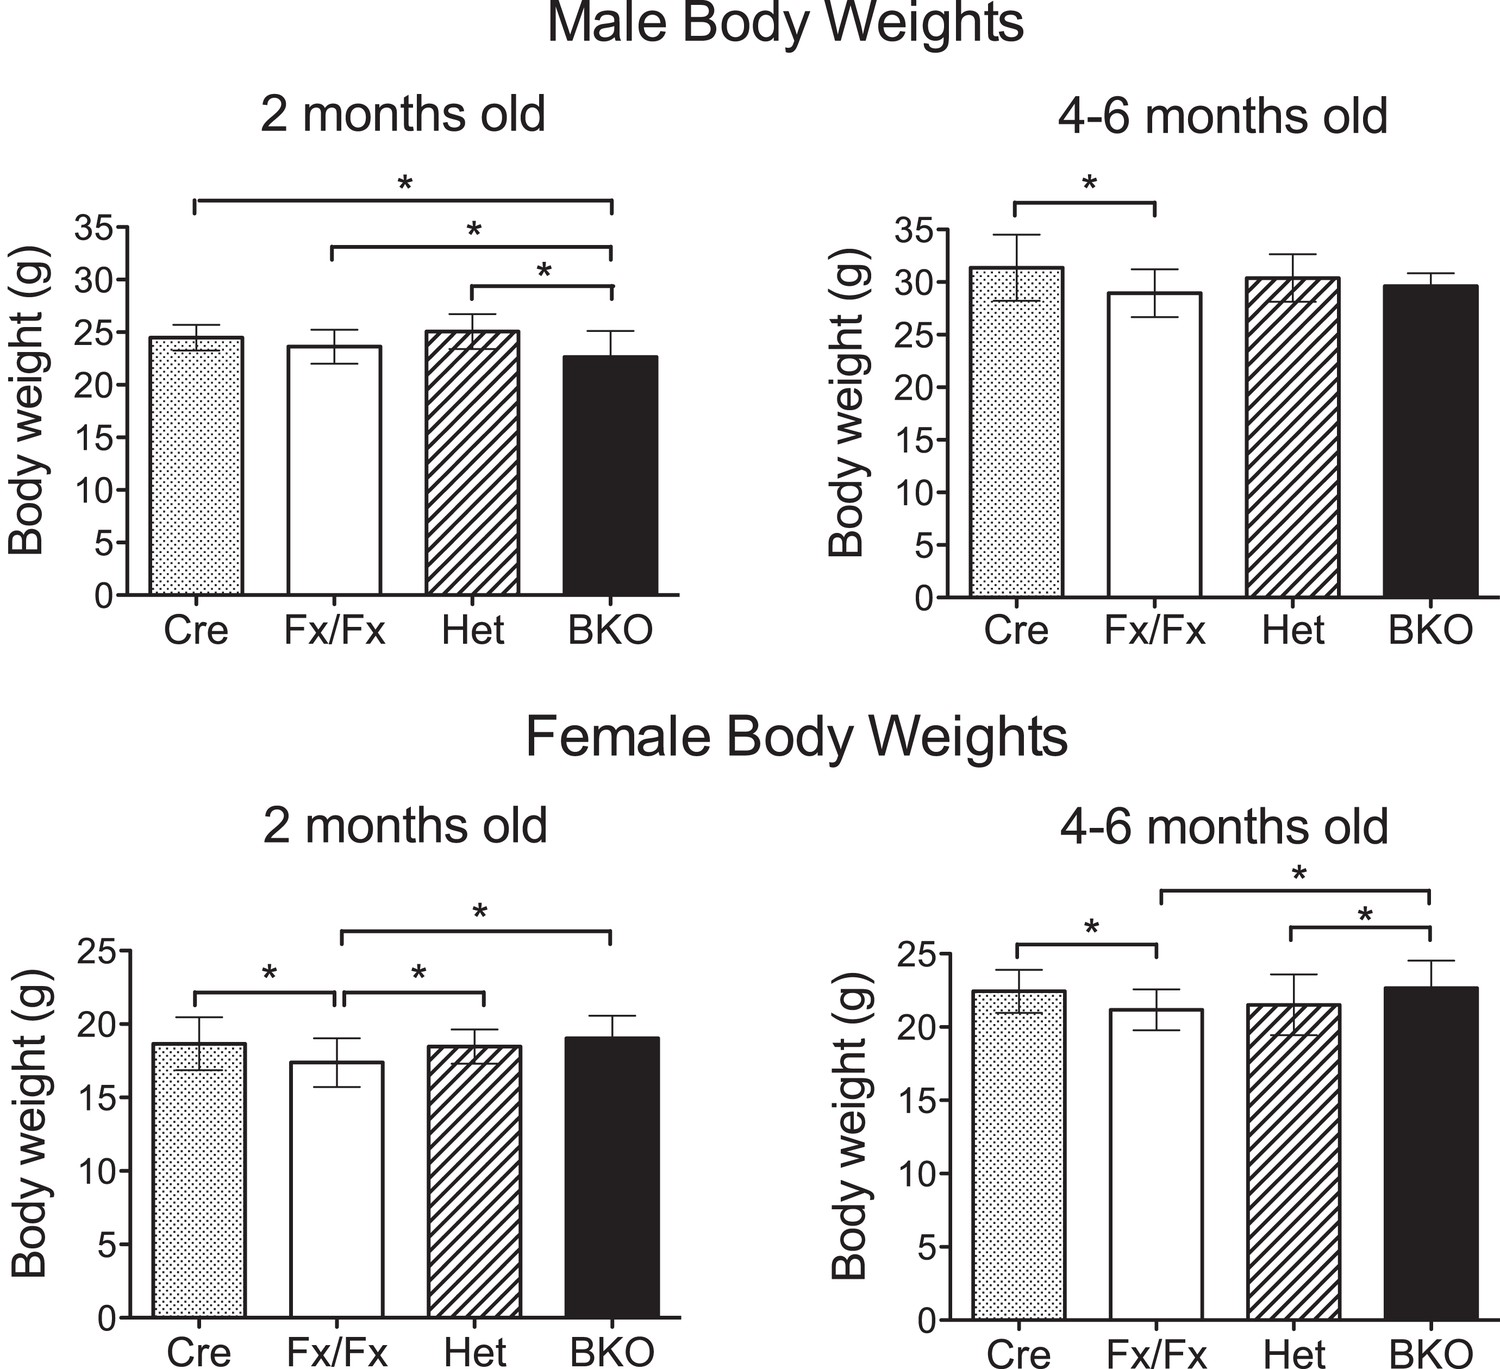
Weights of Bmal1 brain knockout mice are similar to controls at 2 months and 4–6 months of age.
All body weights were measured in live, wheel-naïve animals. Numbers of male mice weighed at 2 months (= 54- to 62-day old) and 4–6 months (= 120- to 195-day old), respectively: Cre (n = 25, 35), Het (n = 13, 15), Fx/Fx (n = 98, 37), and BKO (n = 55, 12). Numbers of female mice weighed at 2 months and 4–6 months, respectively: Cre (n = 28, 39), Het (n = 23, 35), Fx/Fx (n = 84, 54), and BKO (n = 54, 29). Shown are the mean weight ±SD. A significant effect of genotype was found using GLM ANOVA, followed by Tukey–Kramer multiple comparison post-tests. The difference between Cre and Fx/Fx mice (*p ≤ 0.05) is likely due to the difference in the genetic background (CamiCre+ is generated in FVB background and floxed Bmal1 in 129sv). Importantly, there was no significant difference between BKO males and control males at 4–6 months, and BKO females did not weigh less than any control group at either time point.
Figure 1—figure supplement 2
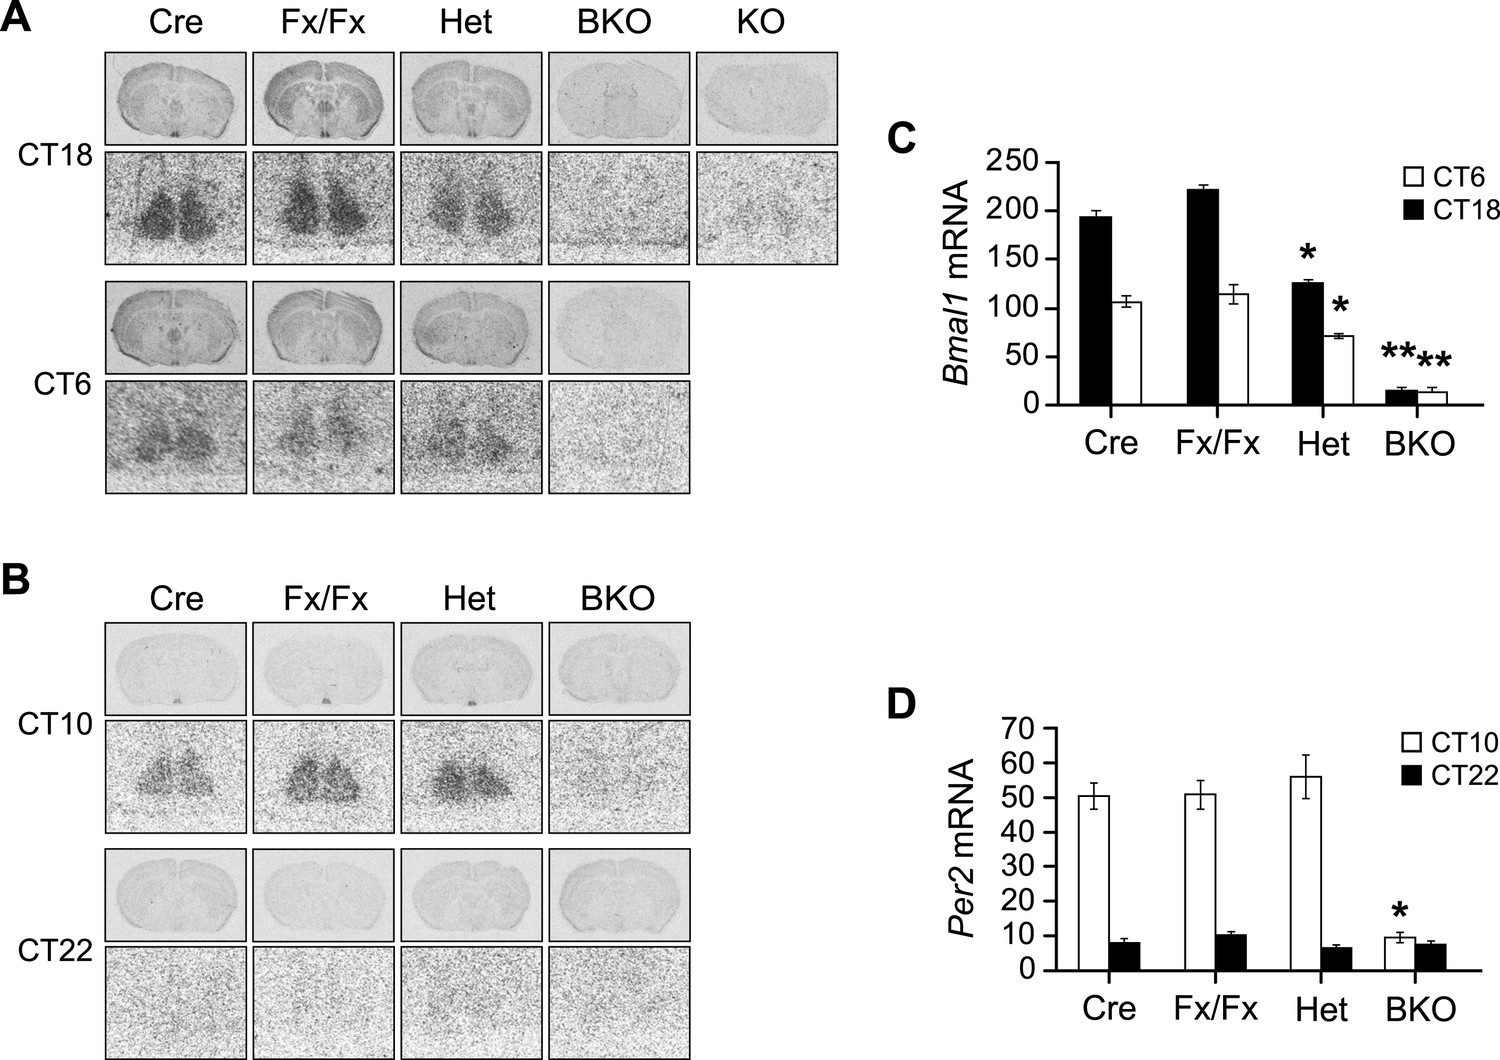
Additional in situ analysis of Bmal1 brain knockout mice.
(A, B) Coronal brain sections at the level of the SCN. Below each coronal brain section is a close-up of the SCN. (A) Mice were sacrificed at CT18 and CT6 following 2 days of DD. Sections were hybridized in situ to examine Bmal1 mRNA levels in Cre (n = 5 at CT6 and 4 at CT18), Fx/Fx (n = 7 at CT6 and 7 at CT18), Het (n = 6 at CT6 and 6 at CT18), BKO (n = 4 at CT6 and 4 at CT18), and Bmal1−/− mice (KO, n = 1). (B) Mice were sacrificed at CT10 and CT22 following 2 days of DD. Sections were hybridized in situ to examine Per2 mRNA levels in Cre (n = 7 at CT10 and 6 at CT22), Fx/Fx (n = 10 at CT10 and 8 at CT22), Het (n = 7 at CT10 and 7 at CT22), and BKO (n = 9 at CT10 and 9 at CT22) mice. (C, D) Optical density of Bmal1 (C) and Per2 (D) mRNA in the SCN. Shown are mean ± SEM, with significant effect of genotype in (C) [F3,42 = 217.91, p < 0.0001] and (D) [F3,62 = 28.00, p < 0.0001] by GLM ANOVA. (C) Tukey–Kramer multiple comparison post-tests (**p ≤ 0.05) showed that BKO mice had significantly lower Bmal1 mRNA levels than all three control groups at both CT6 and CT18. At both time points Het mice had significantly less Bmal1 mRNA than the other two controls but more mRNA than BKOs (*p ≤ 0.05). (D) BKO mice had significantly lower levels of Per2 mRNA than all three control groups at CT10 but not at CT22 (*p ≤ 0.05).
Figure 2
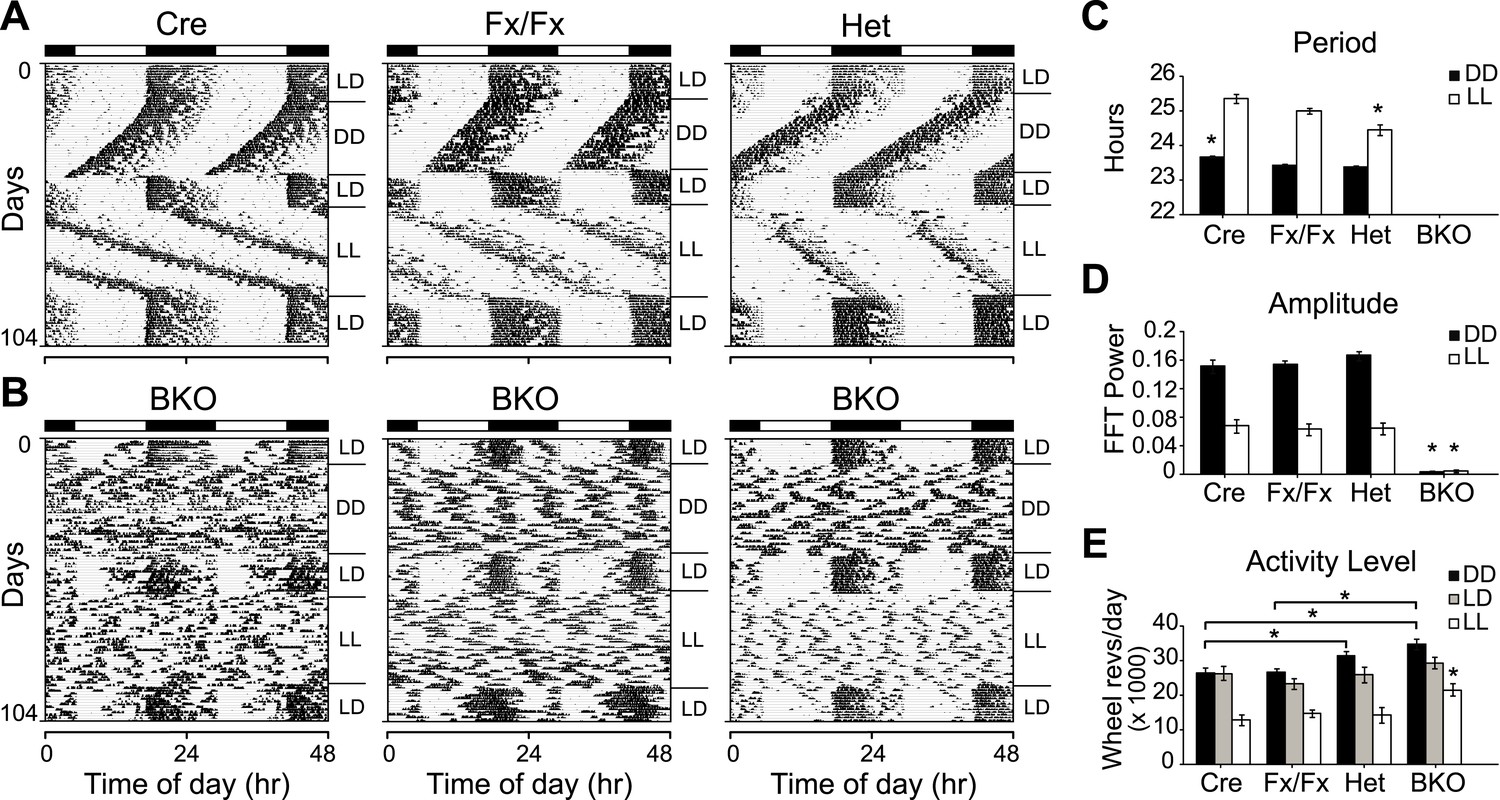
Complete loss of circadian rhythmicity of Bmal1 brain knockout mice in constant darkness and constant light.
(A, B) Representative actograms of daily wheel-running activity of Cre, Fx/Fx, Het, and BKO mice. Activity records were double plotted, with each day being represented beneath and also to the right of the preceding day. Horizontal black and white bars at the top of each actogram represent lights off and on, respectively. Mice were housed in LD, released into DD for 4 weeks, returned to LD for 2 weeks, released into LL for 4 weeks, and then returned to LD. GLM ANOVA and Tukey–Kramer multiple comparison post-tests were used to compare genotypes tested. BKOs showed no significant periodicity in DD or LL. (C–E) Period (C), amplitude of circadian rhythm (D), and activity levels (E) in Cre mice (n = 28 for DD, 12 for LD, 12 for LL), Fx/Fx mice (n = 31 for DD, 18 for LD, 18 for LL), Het mice (n = 31 for DD, 13 for LD, 15 for LL), and BKO mice (n = 31 for DD, 16 for LD, 21 for LL). Bar graphs show mean ± SEM. (C) Free-running period was determined using χ2 periodogram for days 1–28 of DD or LL. A significant effect of genotype on period was found for both DD [F3,120 = 164,319, p < 0.0001] and LL [F3,65 = 20,429, p < 0.0001]. In DD, Cre mice were found to have a slightly longer period than the other two control groups (*p ≤ 0.05). In LL, Het mice were found to have a shorter period than the other two control groups (*p ≤ 0.05). Nevertheless, all three control groups showed a free-running period in both DD and LL similar to that reported for WT mice. (D) DD and LL amplitude of circadian rhythm represented by FFT in the circadian range. A significant effect of genotype on amplitude was found for both DD [F3,120 = 150, p < 0.0001] and LL [F3,65 = 23.72, p < 0.0001], with BKO mice having significantly lower amplitude (*p ≤ 0.05) in both DD and LL. (E) Total daily DD, LD, and LL activity levels, in wheel revolutions per 24 hr. BKO activity levels were found to be significantly higher than those of controls in DD [F3,119 = 9.00, p < 0.0001] (*p ≤ 0.05) and LL [F3,65 = 5.84, p = 0.0014] (*p ≤ 0.05) but not in LD.
Figure 3 with 1 supplement
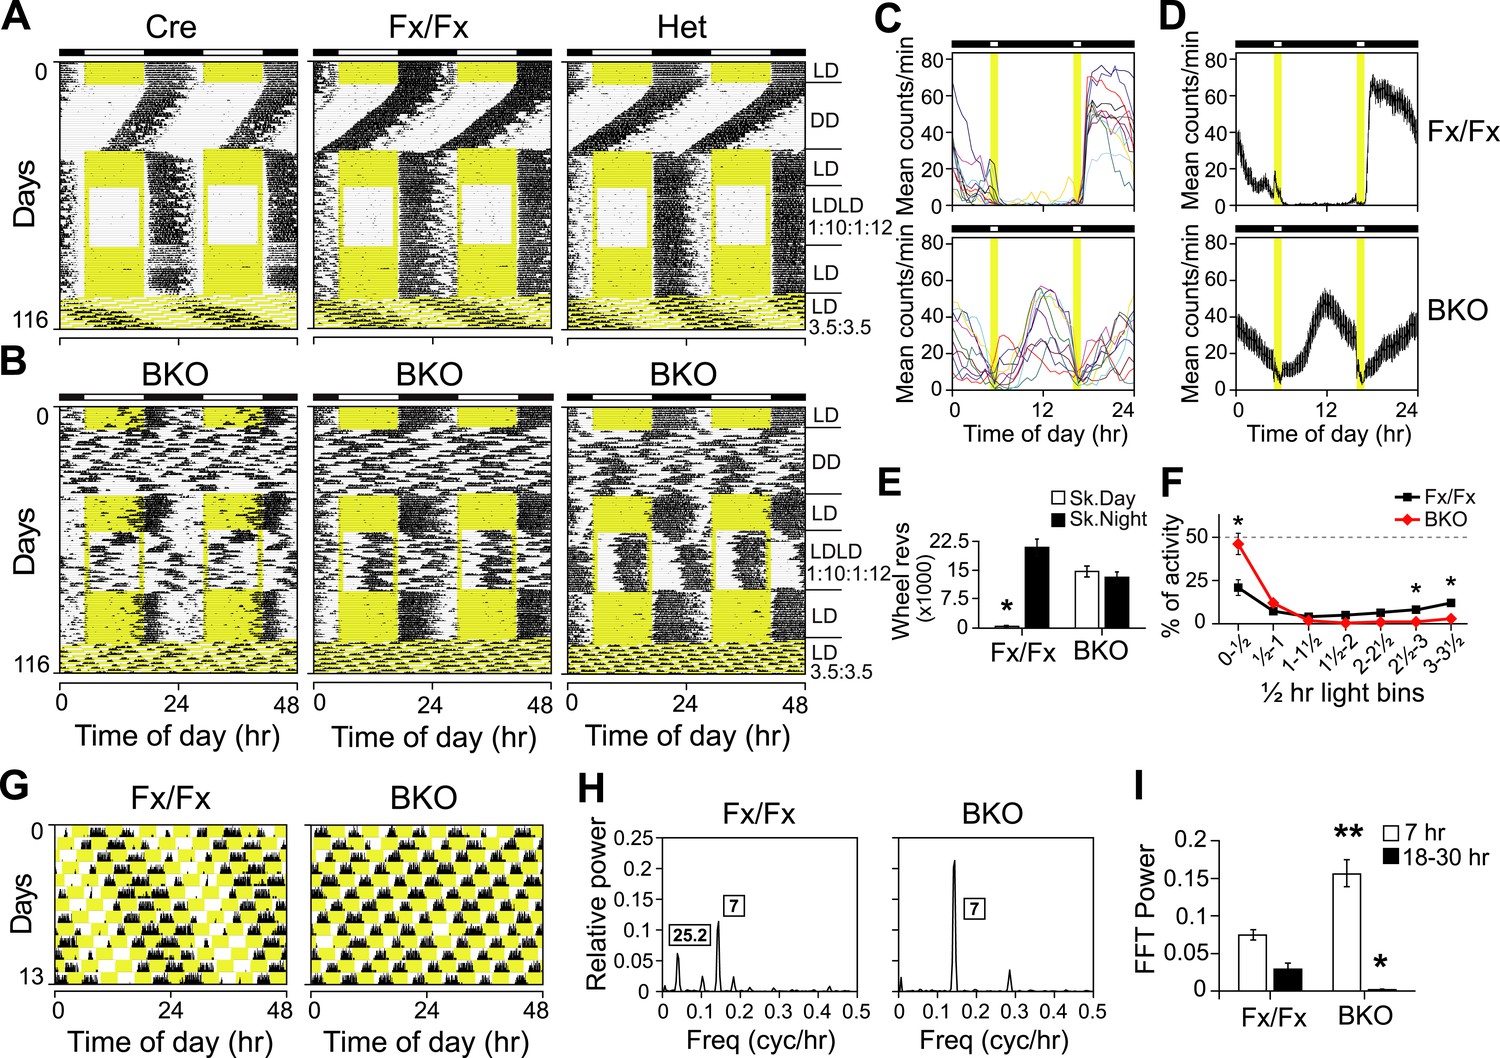
Both entrainment and masking are abnormal in Bmal1 brain knockout mice.
(A, B) Representative double-plotted actograms of daily wheel-running activity of Cre, Fx/Fx, Het, and BKO mice. Mice were housed in LD, released into DD for 4 weeks, returned to LD for 2 weeks, introduced to a skeleton photoperiod (LDLD 1:10:1:12) for 4 weeks, returned to LD for 2 weeks, and then switched to an ultradian cycle (LD 3.5:3.5) for 3 weeks. Shown are days 1–24 of the skeleton photoperiod and days 3–15 of LD 3.5:3.5. (C, D) Average activity profiles of Fx/Fx (n = 12) and BKO littermates (n = 10) during LDLD 1:10:1:12. (C) Average profiles for individual mice; (D) the ensemble average for the entire group. Each data point represents counts per minute averaged across a 6-min bin (±SEM for D). (E) Total activity counts (mean ± SEM) during 10 hr of subjective day (Sk. Day) and 10 hr of subjective night (Sk. Night) of LDLD 1:10:1:12. In contrast to Fx/Fx littermates, BKOs are equally active during skeleton day vs skeleton night. *p < 0.0001 by t-test. (F) Masking of BKO (n = 14) and Fx/Fx littermates (n = 9) during specific 0.5 hr light bins of LD 3.5:3.5. Total activity (mean ± SEM) during each 30 min light bin is divided by the total of that bin plus the corresponding dark bin. Thus the first data point for each genotype represents the distribution of activity between the first 30 min of light and the first 30 min of dark. There was a significant interaction between the genotype and time using Repeated Measures GLM ANOVA [F1,160 = 22.3, p < 0.0001]. Specifically, days 1, 6, and 7 were found to be significantly different by Tukey–Kramer multiple comparison post-tests (*p ≤ 0.05). (G) Representative double-plotted actograms of daily wheel-running activity of Fx/Fx (left) and BKO (right) littermates. These are the same mice as those shown in (A, middle panel) and (B, middle panel), respectively. Light phases are indicated in yellow to show the structure of the LD 3.5:3.5 cycle as well as to help visualize the occurrence of wheel-running activity under this schedule. Note that, after 1 week of this cycle, initial phase relationships are regained. (H) Representative amplitude power spectra of Fx/Fx and BKO mice, from FFT analyses performed on the same activity records shown in (G). The highest peaks for both genotypes were in the 7-hr range, corresponding to the LD 3.5:3.5 schedule. The second-highest peak for the controls was in the circadian (18–30 hr) range (left). None of the BKOs was found to have a period in the circadian range (right). (I) Group averages of amplitudes in the 7-hr range and in the circadian range for the same Fx/Fx and BKO mice as in (F). Compared to controls, BKOs had significantly higher amplitude in the 7-hr range (**p < 0.0001 by t-test) and significantly lower amplitude in the circadian range (*p < 0.0060 by t-test).
Figure 3—figure supplement 1

Masking in Bmal1 brain knockout mice.
(A) Daytime activity levels during LD, as percentage of total daily activity, in Cre (n = 12), Fx/Fx (n = 18), Het (n = 13), and BKO (n = 16) mice. A significant effect of genotype on daytime activity was found by GLM ANOVA [F3,58 = 12.43, p < 0.0001], with BKO mice having significantly higher daytime activity by Tukey–Kramer multiple comparisons post-test (*p ≤ 0.05). Combined, controls allocate an average of 3.81 ± 0.96% of their total activity to running during the daytime. In contrast, 15.58 ± 1.8% of BKO wheel-running activity occurs during the light phase. (B–E) Shown are days 3–15 of a 21-day LD 3.5:3.5 cycle; these are the same days as those shown in Figure 3A,B. (B, C) Representative single-plotted actograms of daily wheel-running activity of (B) Fx/Fx and (C) BKO littermates. These are the same mice as those shown in Figure 3A (middle panel), 3B (middle panel), and 3G. Actograms are plotted modulo tau (25.2 hr for B) to help visualize the circadian ‘beating’, that is the gaps in activity in controls (B) caused by the suppressive effects of the light phases of the LD 3.5:3.5 cycle on running. A circadian component of wheel-running activity is clearly evident in controls (B) but absent in BKOs (C). (D, E) Representative actograms of wheel-running activity of Fx/Fx (D) and BKO littermates (E), plotted on a 7 hr time scale (x axis). Y-axis shows successive 7 hr spans for days 3–15 of this cycle. The gaps in activity in some of the dark periods in Fx/Fx controls represent times when the circadian cycle is specifying rest even though lights are off (see Figure 3G, left panel). To the right of each actogram is an activity profile for that individual mouse, averaged over 13 days. Each data point represents counts per minute averaged for each mouse across a 6-min bin. The boxed area corresponds to the first one-third of all the light phases of the LD 3.5:3.5 schedule. Substantial BKO wheel-running activity is seen during this interval, especially the first 30 min, during which BKOs fail to mask altogether (see Figure 3F). Horizontal black and white bars represent lights off and on, respectively.
Figure 4
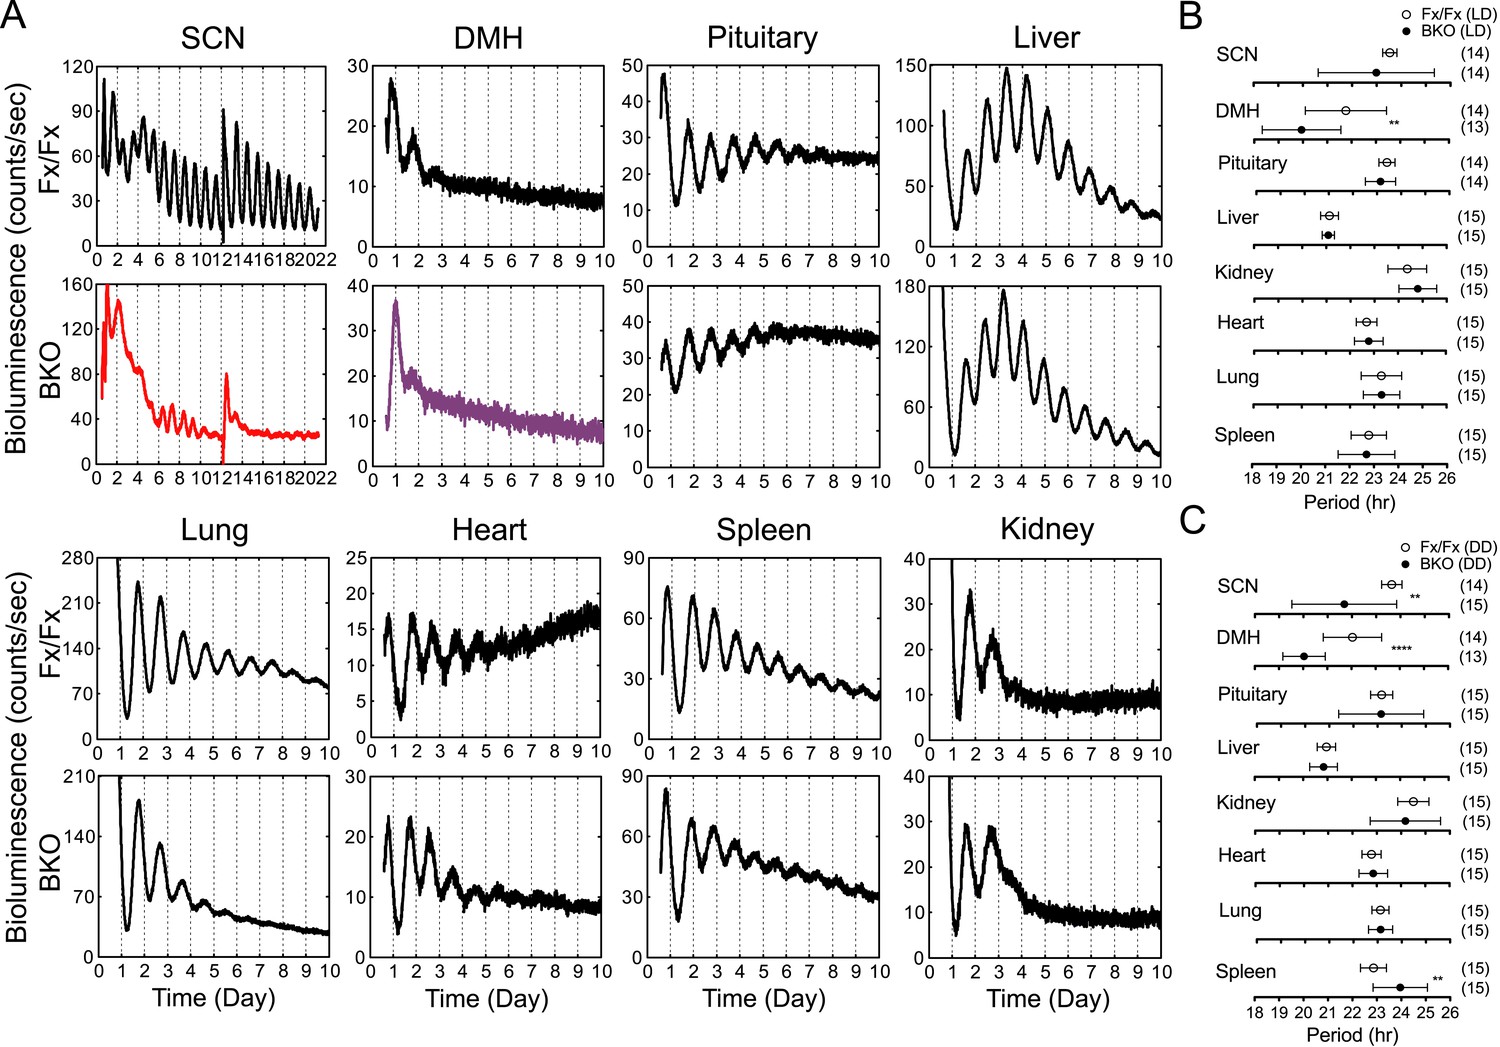
Real-time reporting of circadian expression of PER2::LUC in the forebrain/SCN knockout mice.
(A) Representative records of bioluminescence reporting of circadian expression from various tissues in Fx/Fx and BKO mice. Tissues were prepared from mice in LD. PMT counts are plotted against the LD cycle of day 1. Shown are 10 days of continuous recording after explant preparation, except for the SCN for which medium was changed on day 12. (B, C) Period plots of various tissues harvested from Fx/Fx control (open circle) and BKO (dark circle) mice in LD (B) and DD (C). The sample size is indicated on right. Shown are mean period ± SD. **p < 0.01, ****p < 0.0001 by t-test.
Figure 5
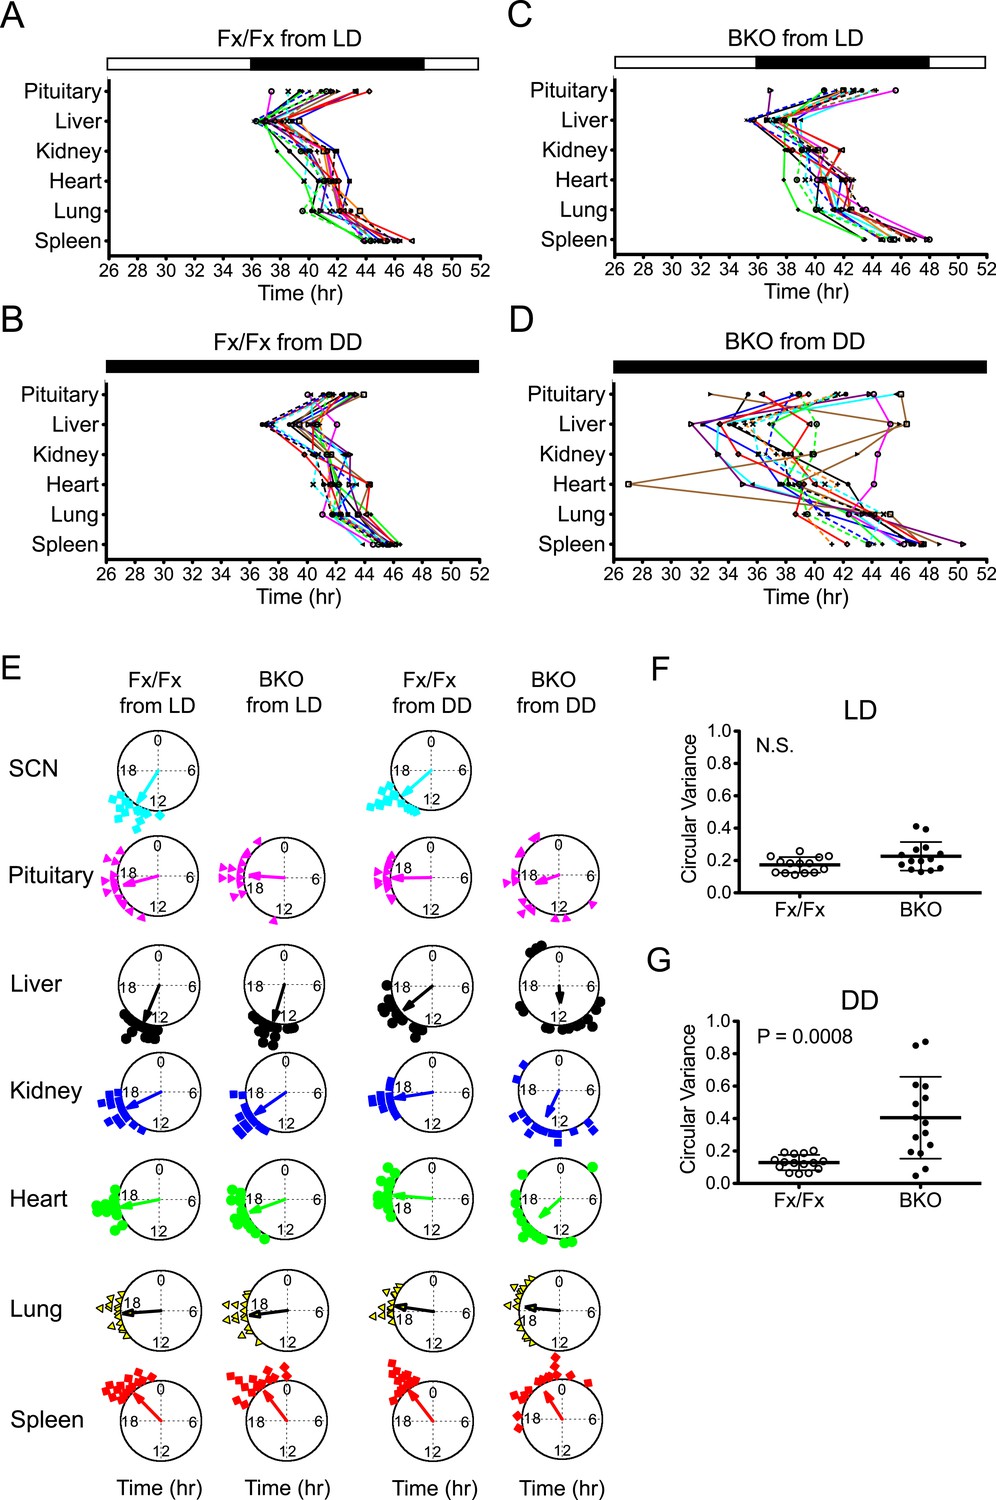
Phase analysis of circadian expression of various peripheral tissues from the forebrain/SCN knockout mice.
(A) Phase map of circadian rhythms of various peripheral tissues from Fx/Fx control mice in LD (n = 15, except for pituitary n = 14). The peak phases (or averaged peak phases where more than two pieces were prepared from the same tissue) in the second cycle were plotted against the LD cycle of the day when explant cultures were prepared. Tissues from the same animal are connected by colored lines with matched symbols. (B) Phase map of Fx/Fx control mice in DD (n = 15). The peak phases (or averaged peak phases) in the second cycle were plotted against the predicted onset of activity (=CT12) of the day when the explant cultures were prepared. (C) Phase map of BKOs in LD (n = 15, except for pituitary n = 14). (D) Phase map of BKOs in DD (n = 15). The phases were mapped against the predicted onset of activity (= CT12) of paired Fx/Fx control mice. (E) Circular plots of peak bioluminescence rhythms in the SCN and peripheral tissues presented in (A–D). A circle represents a 24-hr clock, and peak phases of bioluminescence rhythms of individual tissues were calculated as angles and plotted as colored symbols outside the circle. Each tissue is denoted by the same color and symbol scheme. The direction of the arrow indicates mean phase angle, with the length of the arrow expressing the strength of phase clustering. The sample size, mean phase angle, and circular variance for each dataset are summarized in Figure 5—source data 1A. (F, G) Scattered plot of circular variance in each individual mouse. Degree of variance among the peak phase values of pituitary, liver, kidney, heart, lung, and spleen in each individual mouse was calculated and expressed as circular variance (see Figure 5—source data 1B,C) and compared between Fx/Fx controls and BKOs in LD (F) and DD (G). The bar is ±SD. A significant effect was found between Fx/Fx control and BKO mice in DD (p = 0.0008 by Mann–Whitney test) but not in LD (p = 0.0627 by Mann–Whitney test). N.S. = not significant.
-
Figure 5—source data 1
(A) Summary of statistical analysis of circular plots presented in Figure 5. (B) Statistical analysis of circular variance for peak bioluminescence in individual mice in LD. (C) Statistical analysis of circular variance for peak bioluminescence in individual mice in DD.
- https://doi.org/10.7554/eLife.04617.011
Figure 6 with 1 supplement
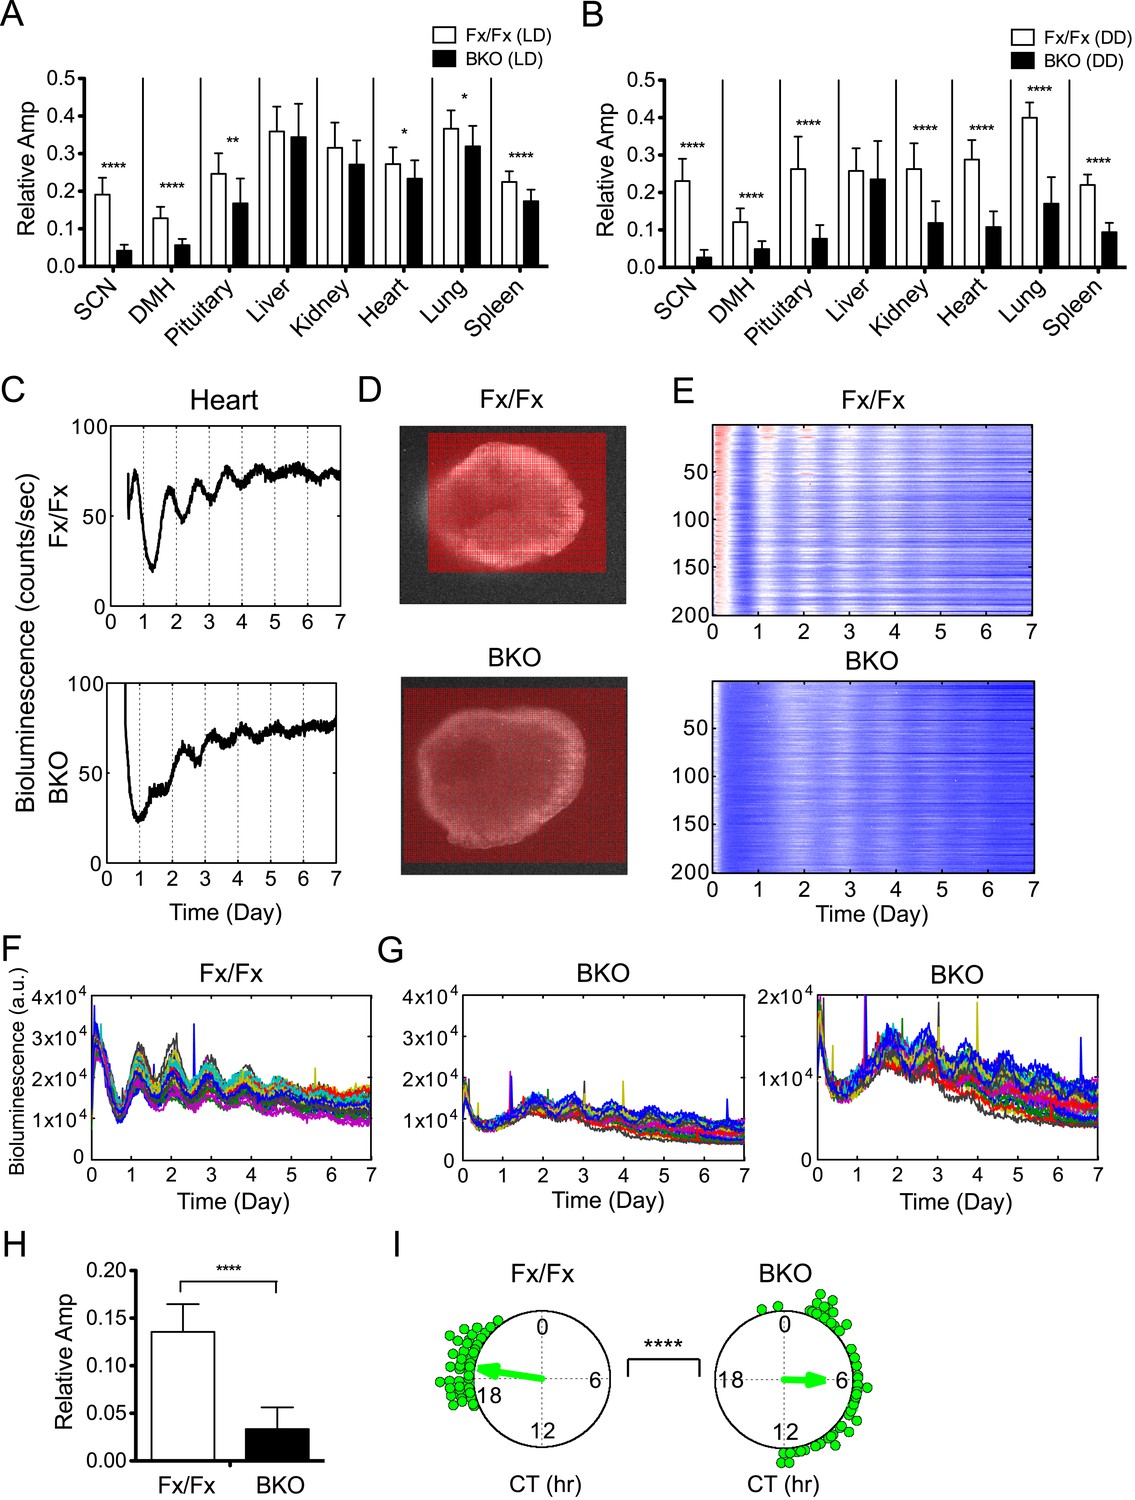
Decreased amplitude in peripheral tissues of BKOs.
(A, B) Normalized amplitude of bioluminescence rhythms from Fx/Fx control (open bar) vs BKO (dark bar) in LD (A) and DD (B). Mean relative amplitude ±SD are shown. The sample size is the same as in Figure 4B,C. *p < 0.05, **p < 0.01, ****p < 0.0001 by t-test. (C) Representative records of real-time monitoring of circadian expression of heart tissues in Fx/Fx control (upper) and BKO (lower) mice maintained in DD. (D) Representative frames of bioluminescence imaging with grids over each heart tissue. (E) Heat maps of the brightest 200 time-series data beginning with the strongest signals in the grids shown in (D). (F, G) Linear traces of the top 50 of time-series data from the Fx/Fx (F) and BKO (G) heart tissue shown in (E). The Y-axis was expanded for the BKO sample in the most right graph. (H) Normalized amplitude quantified from the top 50 of time-series data shown in (F) and (G). ****p < 0.0001 by t-test. (I) Circular plots of peak phase values of the top 50 time-series data shown in (F) for Fx/Fx and (G) for BKO tissues. Degree of variance was compared between the two samples by bootstrapping simulation (****p < 0.0001).
Figure 6—figure supplement 1
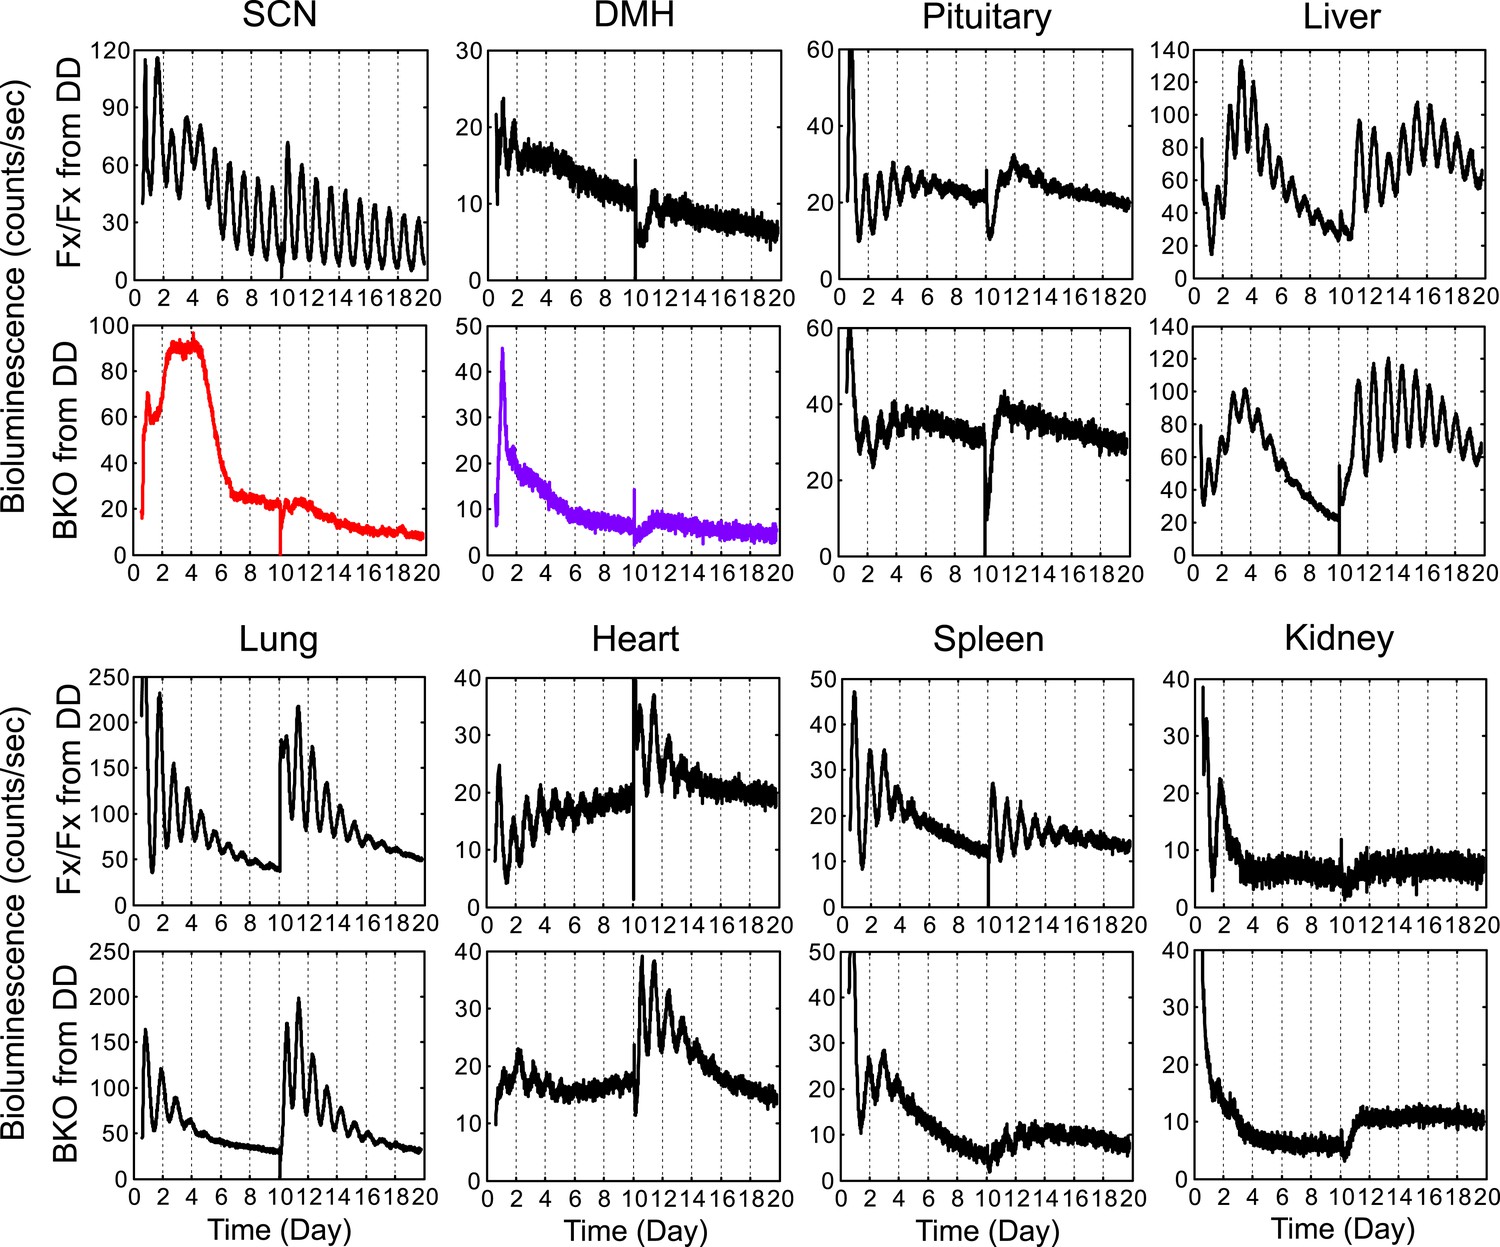
Real-time monitoring of circadian expression in forebrain/SCN knockout mice from DD.
Representative records of bioluminescence reporting of circadian expression from Fx/Fx and BKO mice maintained in DD. Tissues were harvested before the predicted onset of activity (=CT12) of Fx/Fx control mice. Shown are 10 days of continuous recordings followed by medium change. Quantification of period, phase, and relative amplitude of these samples are shown in Figures 4C,5,6B.
Figure 7 with 1 supplement
Intact FAA in Bmal1 brain knockout mice.
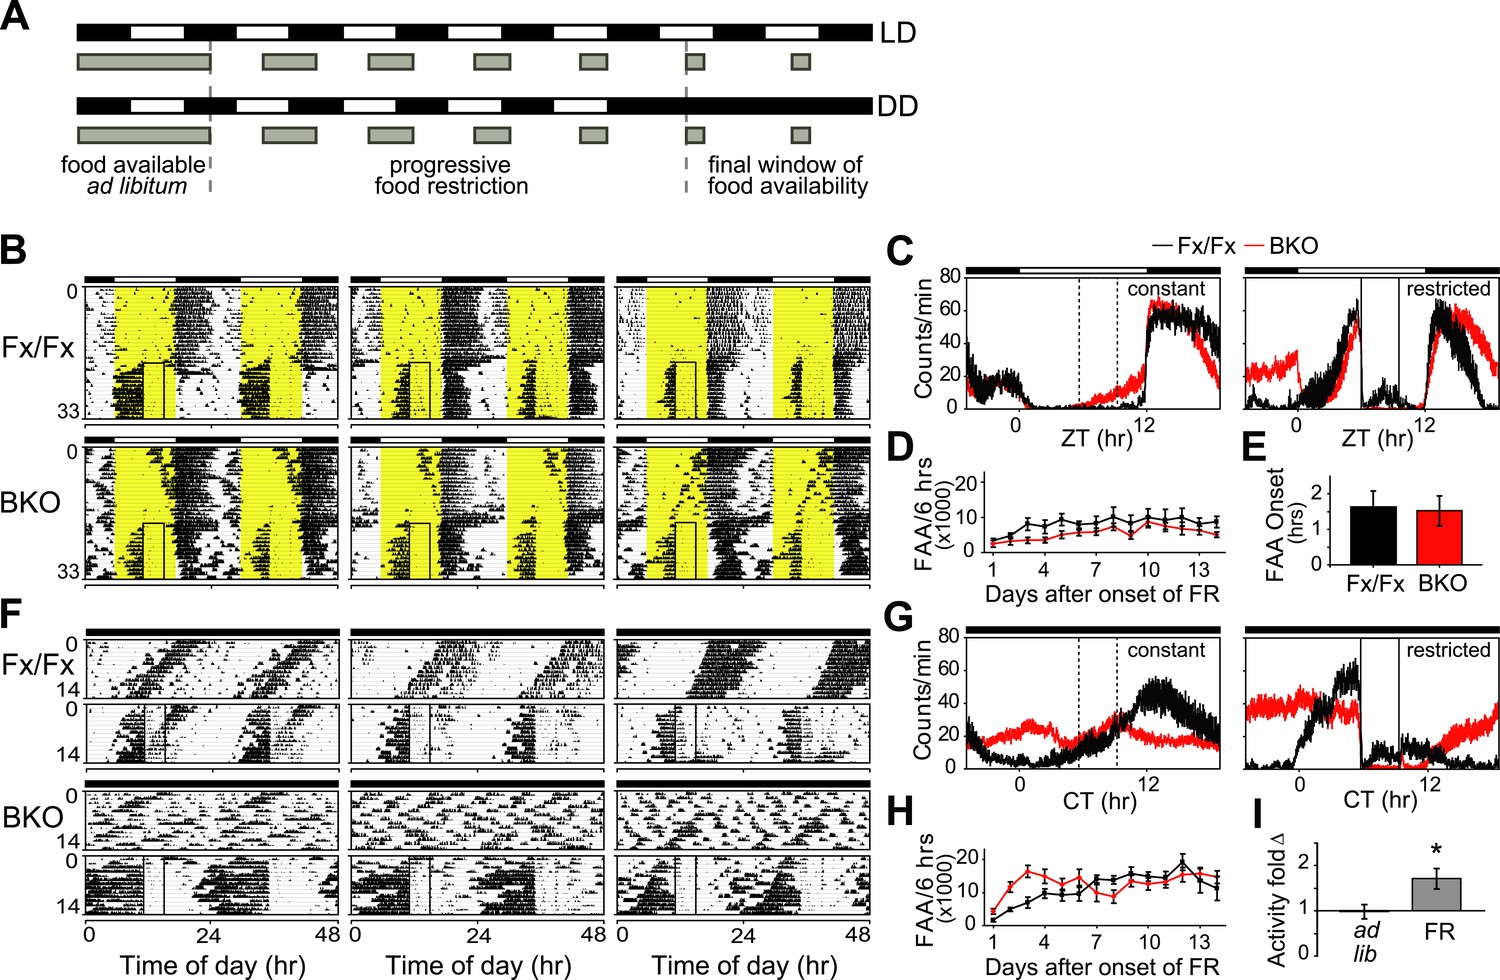
(A) Schedule of a gradual temporal FR protocol in LD (upper) or DD (lower). Horizontal black and white bars represent lights off and on, respectively. Gray bars represent food availability. Since abrupt shifts to FR can have a high morbidity in mice, a gentle temporal FR paradigm was used (FR ramp), decreasing the duration of daily food availability from constant to a final 4 hr window over the course of 5 days. Because free-running in DD can obscure FAA in control mice, we obtained DD baseline activity and then switched mice to 14 days of LD (not shown). We then transferred our mice directly from LD into DD FR following an LD food ramp (lower). It should be noted that once gradual FR began, the time of onset of food availability was the same each day. (B, F) Representative double-plotted actograms of daily wheel-running activity of 3 Fx/Fx control littermates and 3 BKO mice during ad lib feeding and under subsequent FR during LD (B) or DD (F). The boxed area toward the left side of each actogram indicates the daily interval of food availability under FR and yellow areas indicate time of lights-on during LD 12:12. After 5 days of gradually decreasing food availability, the final food availability window was ZT/CT6–10. For clarity, the 5-day FR ramp is not included in the boxed area (B). (C, G) Mean locomotor activity profiles of Fx/Fx littermates (n = 7) and BKO mice (n = 14) under ad lib feeding (left) and during FR days 8–14 (right) under LD (C) or DD (G). Each data point represents counts per minute averaged for each genotype across a 6-min bin (±SEM). The dashed boxed area (left) indicates, for comparison, the daily interval corresponding to subsequent food availability. The solid boxed area (right) indicates the daily interval of food availability under FR. (D, H) Time course of the development of FAA in Fx/Fx controls (n = 7) and BKO mice (n = 14) during LD FR (D) or DD FR (H). FAA is plotted as the total number of activity counts (mean ± SEM) allocated to a 6-hr time interval prior to mealtime, ZT/CT0–6 (D, H). (E) Number of hours by which FAA preceded daily meal times in Fx/Fx (n = 7) and BKO mice (n = 14) during LD FR. Wheel-running activity profiles were averaged for each individual during stable FR (as in C), and the average time of onset of FAA was determined as the time before food availability at which FAA rose to its half-maximum value (mean ± SEM). (I) Quantification of FAA under DD conditions in BKO mice (n = 14). Plotted is fold-change of wheel-running activity (counts per minute, mean ± SEM) in each mouse for CT0–6 (window of FAA) compared with CT10–24 (the rest of the day except for the window of food availability). During FR, increased locomotor activity during CT0–6 compared with CT10–24 was highly significant (*p = 0.0001 by paired t-test).
Figure 7—figure supplement 1
Lack of Bmal1 expression in the DMH of Bmal1 brain knockout mice.
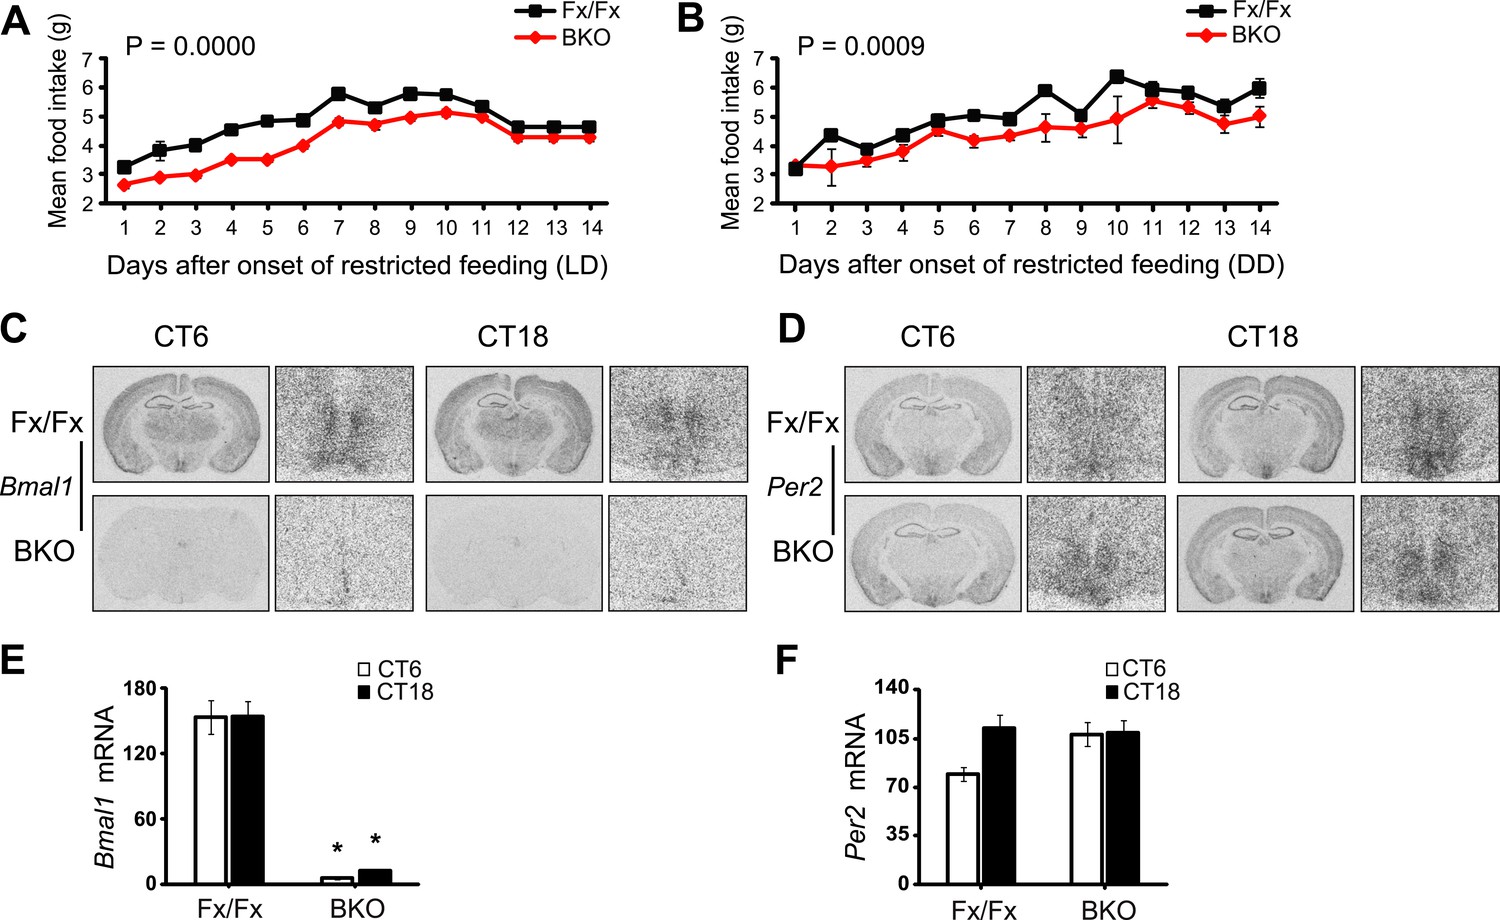
(A, B) Food consumed during FR was significantly lower in BKOs compared to controls using Repeated Measures GLM ANOVA for both LD conditions [F1,291 = 43.40, p < 0.0001] (A) and DD conditions [F1,293 = 15.47, p = 0.0009] (B). Food consumed on days 12–14 of LD FR (A) represents the average food consumed over those 3 days and is plotted in triplicate to enable comparison between LD and DD food consumed. (C, D) Coronal brain sections at the level of the DMH, prepared from mice under ad lib feeding at CT6 and CT18 following 2 days of DD, were hybridized in situ to examine Bmal1 exon 4 (C) and Per2 (D) mRNA levels in Fx/Fx control littermates (n = 6 for CT6, n = 7 for CT18) and BKO mice (n = 6 for CT6, n = 8 for CT18). On the right of each coronal brain section is a close-up of the DMH. (E, F) Optical density of Bmal1 (E) and Per2 (F) mRNA in the DMC. Shown are mean ± SEM, * significant effect of genotype in (E) [F1,26 = 208.31, p < 0.0001] but not in (F) using GLM ANOVA.
Figure 8
Effects of restricted feeding on circadian rhythms of peripheral tissues.
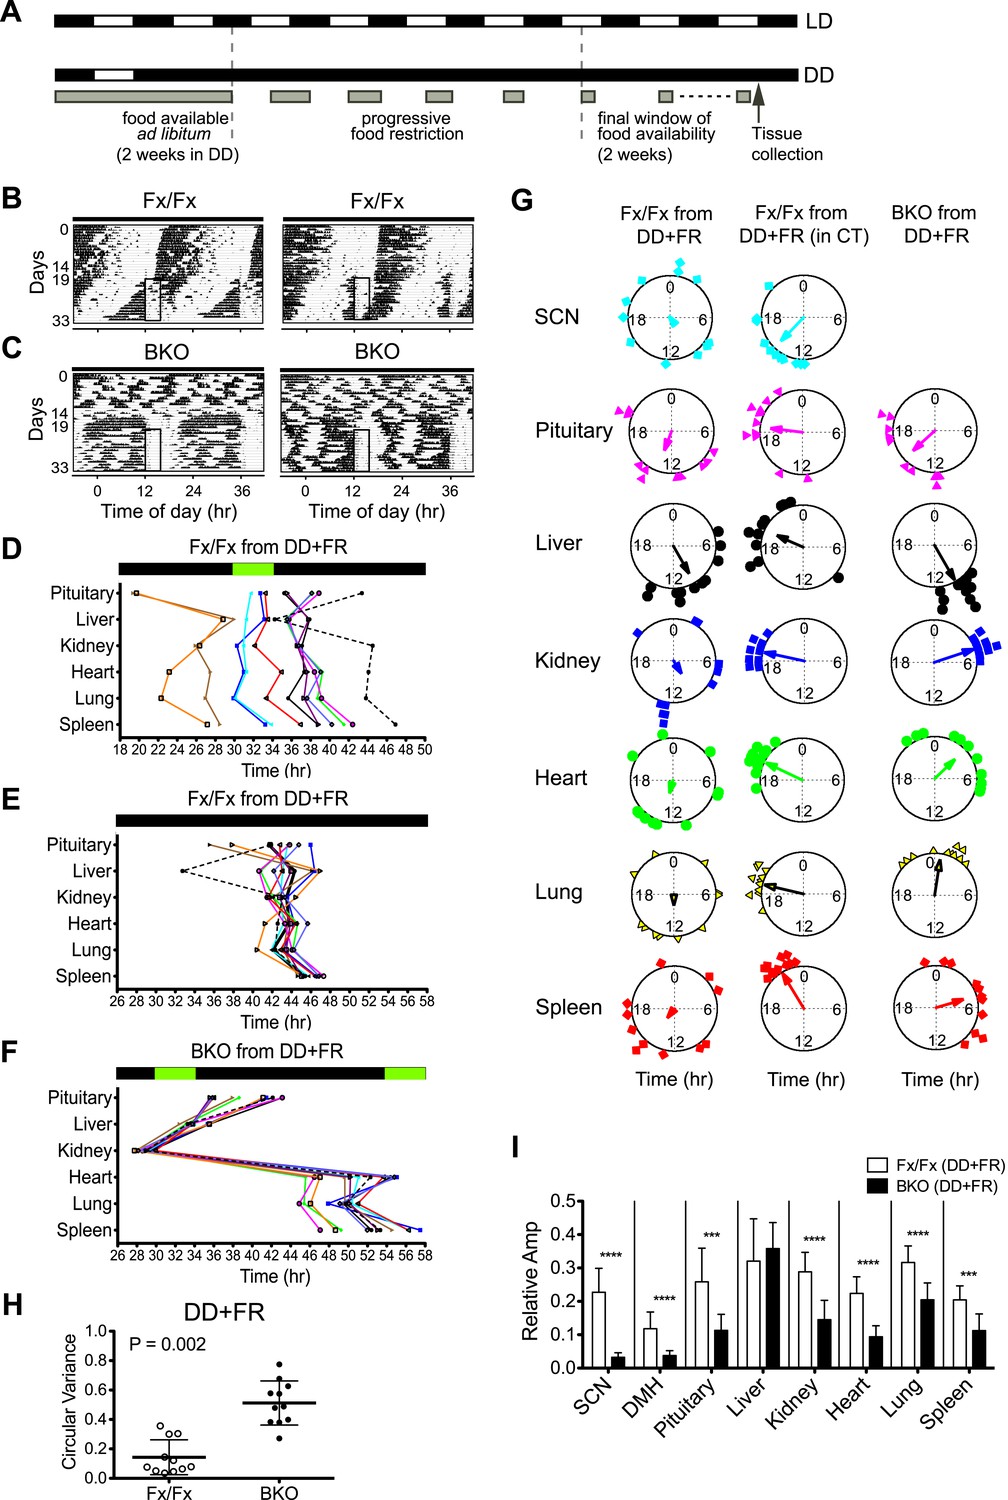
(A) Schedule of a temporal FR protocol in DD for real-time circadian reporting assay. Horizontal black and white bars representing lights off and on for LD 12:12 are shown above as a reference for a daily feeding schedule. Gray bars represent food availability. After entrainment to LD 12:12, mice were released into and maintained in DD for a total of >30 days. In DD, mice were fed ad libitum for the initial 2 weeks and underwent a 5-day FR ramp of gradually decreasing food availability to reach the final food availability window of 4 hr (from ZT/CT6–10) for 2 weeks of FR. Tissues were harvested at 2 hr after removal of the food. (B, C) Representative double-plotted actograms of 2 Fx/Fx control (B) and 2 BKO mice (C) during 2 weeks of ad lib feeding followed by the 5-day FR ramp and subsequent 2 weeks of FR in DD. The boxed area toward the left side of each actogram indicates the daily interval of food availability under FR (ZT/CT6–10). (D) Phase map of circadian rhythms of various peripheral tissues from Fx/Fx controls in DD + FR (n = 11). The peak phases (or averaged peak phases) were plotted against the feeding time (green bar). Tissues from the same animal are connected by colored lines with matched symbols. (E) Phase map of (D) was converted to CT for the harvest time. (F) Phase map of BKOs in DD + FR (n = 11). The peak phases (or averaged peak phases) were plotted against the feeding time (green bars). (G) Circular plots of peak bioluminescence rhythms in the SCN and peripheral tissues presented in (D–F). The mapping strategy is the same as in Figure 5E. The sample size, mean phase angle, and circular variance for each dataset are summarized in Figure 8—source data 1A. (H) Scattered plot of circular variance in each individual mouse. Degree of variance among the peak phase values of pituitary, liver, kidney, heart, lung, and spleen in an individual mouse was calculated and expressed as circular variance (see Figure 8—source data 1B) and compared between Fx/Fx controls and BKOs in DD + FR. The bar is ±SD. Note that the degree of variance is not changed by phase data conversion from ZT to CT. A significant effect was found between Fx/Fx control and BKO mice (p = 0.0002 by Mann–Whitney test). (I) Normalized amplitude of bioluminescence rhythms from Fx/Fx control (open bar) vs BKO (dark bar) in DD + FR. Mean relative amplitude ±SD are shown. The sample size is the same as in (D, F). ***p < 0.001, ****p < 0.0001 by t-test.
-
Figure 8—source data 1
(A) Summary of statistical analysis of circular plots presented in Figure 8. (B) Statistical analysis of circular variance for peak bioluminescence in individual mice under restriction feeding.
- https://doi.org/10.7554/eLife.04617.017
Figure 9
Analysis of circadian rhythms of peripheral tissues under different conditions.
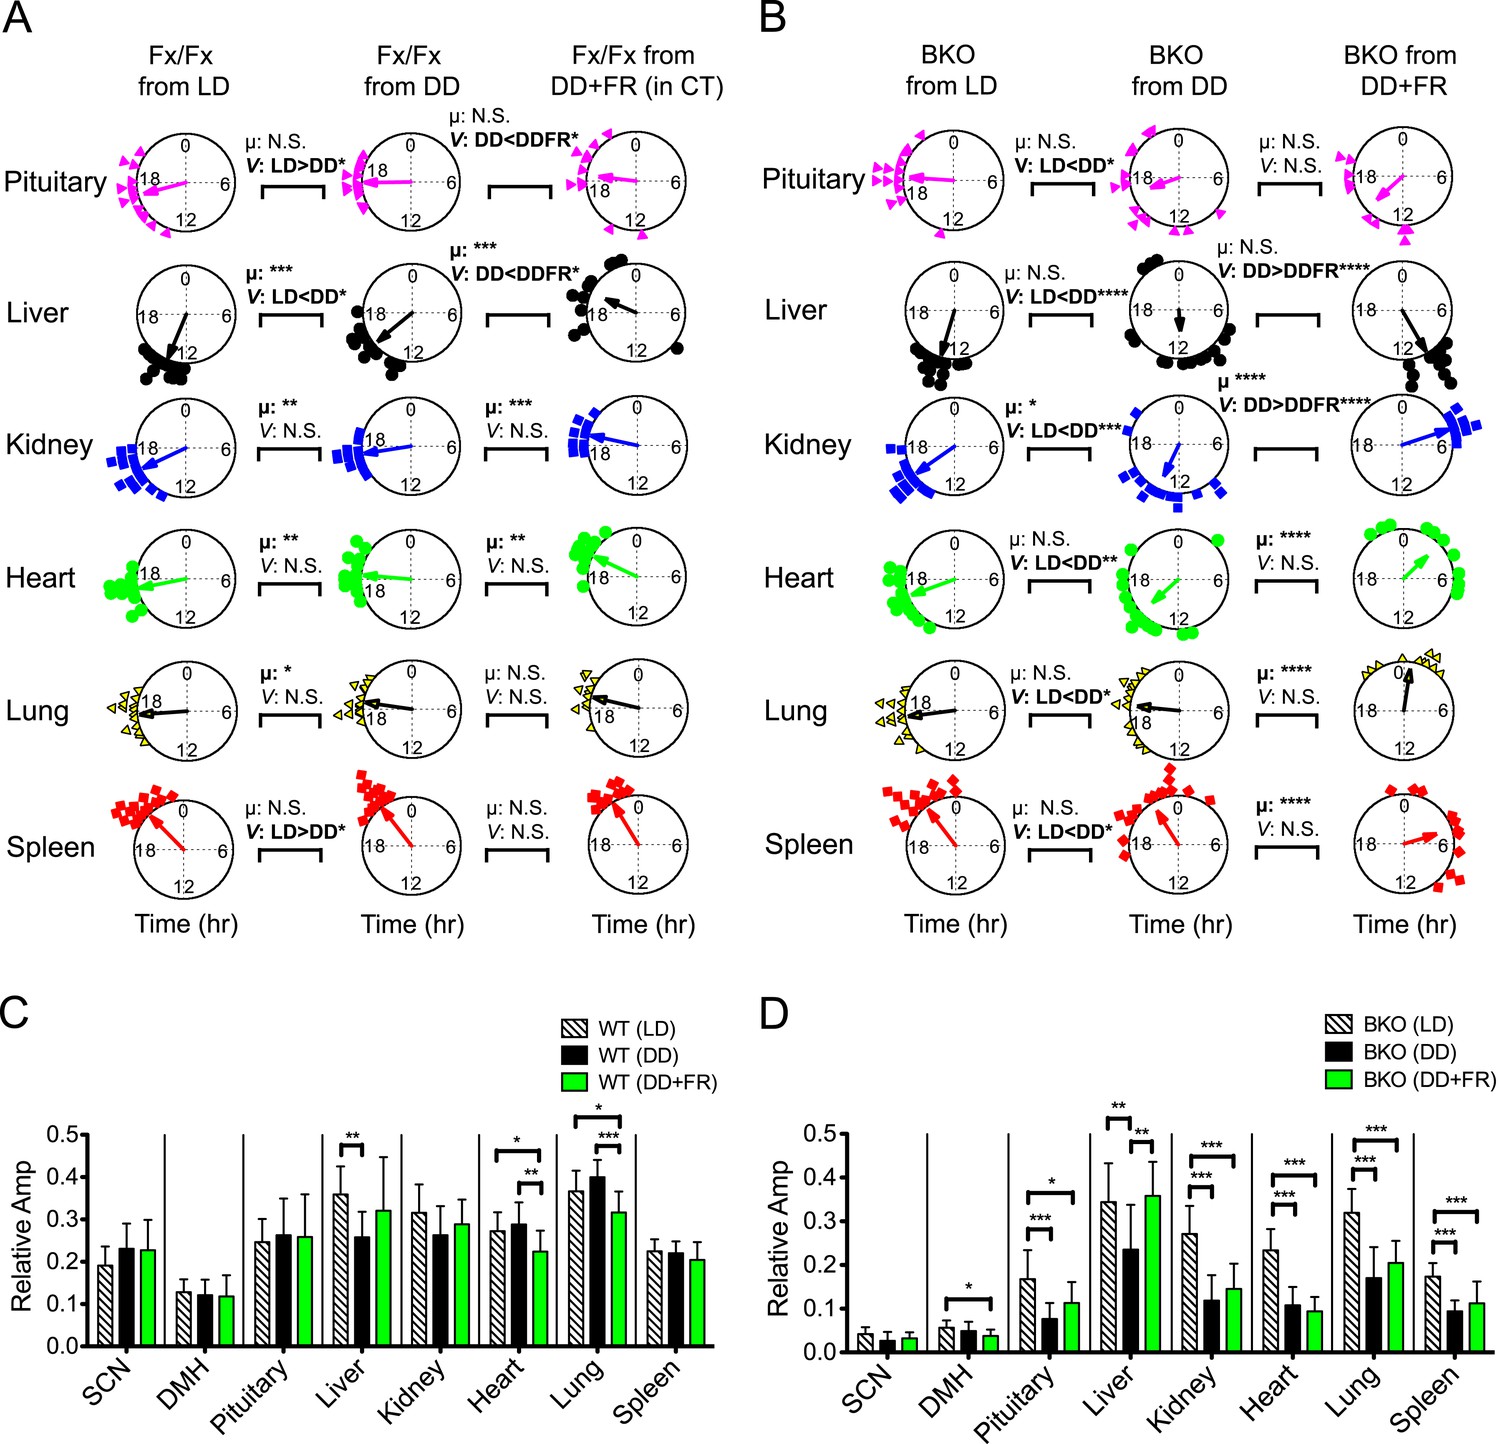
(A, B) Comparison of peak bioluminescence rhythms in the peripheral tissues in Fx/Fx (A) and BKO (B) mice under LD, DD, and FR conditions. Circular plots are as presented in Figure 5E and Figure 8G. Watson-Williams F-test and bootstrap analysis were performed to compare the mean phase angle (μ) and the variance (V, distribution of peak phase values) between two circular data, respectively. Statistical comparison was summarized in Figure 9—source data 1A,B). *p < 0.05, **p < 0.01, ***p < 0.001, ****p < 0.0001. N.S. = not significant. (C, D) Comparison of normalized amplitude of bioluminescence rhythms from Fx/Fx (C) and BKO (D) mice under LD, DD, and FR conditions. Each bar graph is as presented in Figure 6A,B and Figure 8I. Mean relative amplitude ±SD are shown. *p < 0.05, **p < 0.01, ***p < 0.001 by ANOVA.
-
Figure 9—source data 1
(A) Summary of statistical comparison of peak phases from Fx/Fx mice under different conditions. (B) Summary of statistical comparison of peak phases from BKO mice under different conditions.
- https://doi.org/10.7554/eLife.04617.019
Download links
A two-part list of links to download the article, or parts of the article, in various formats.
Downloads (link to download the article as PDF)
Open citations (links to open the citations from this article in various online reference manager services)
Cite this article (links to download the citations from this article in formats compatible with various reference manager tools)
Differential effects of light and feeding on circadian organization of peripheral clocks in a forebrain Bmal1 mutant
eLife 3:e04617.
https://doi.org/10.7554/eLife.04617


