Quantitative system drift compensates for altered maternal inputs to the gap gene network of the scuttle fly Megaselia abdita
- Centre for Genomic Regulation, Spain
- Universitat Pompeu Fabra, Spain
- Universitat de Barcelona, Spain
- University of Chicago, United States
Figures
Figure 1
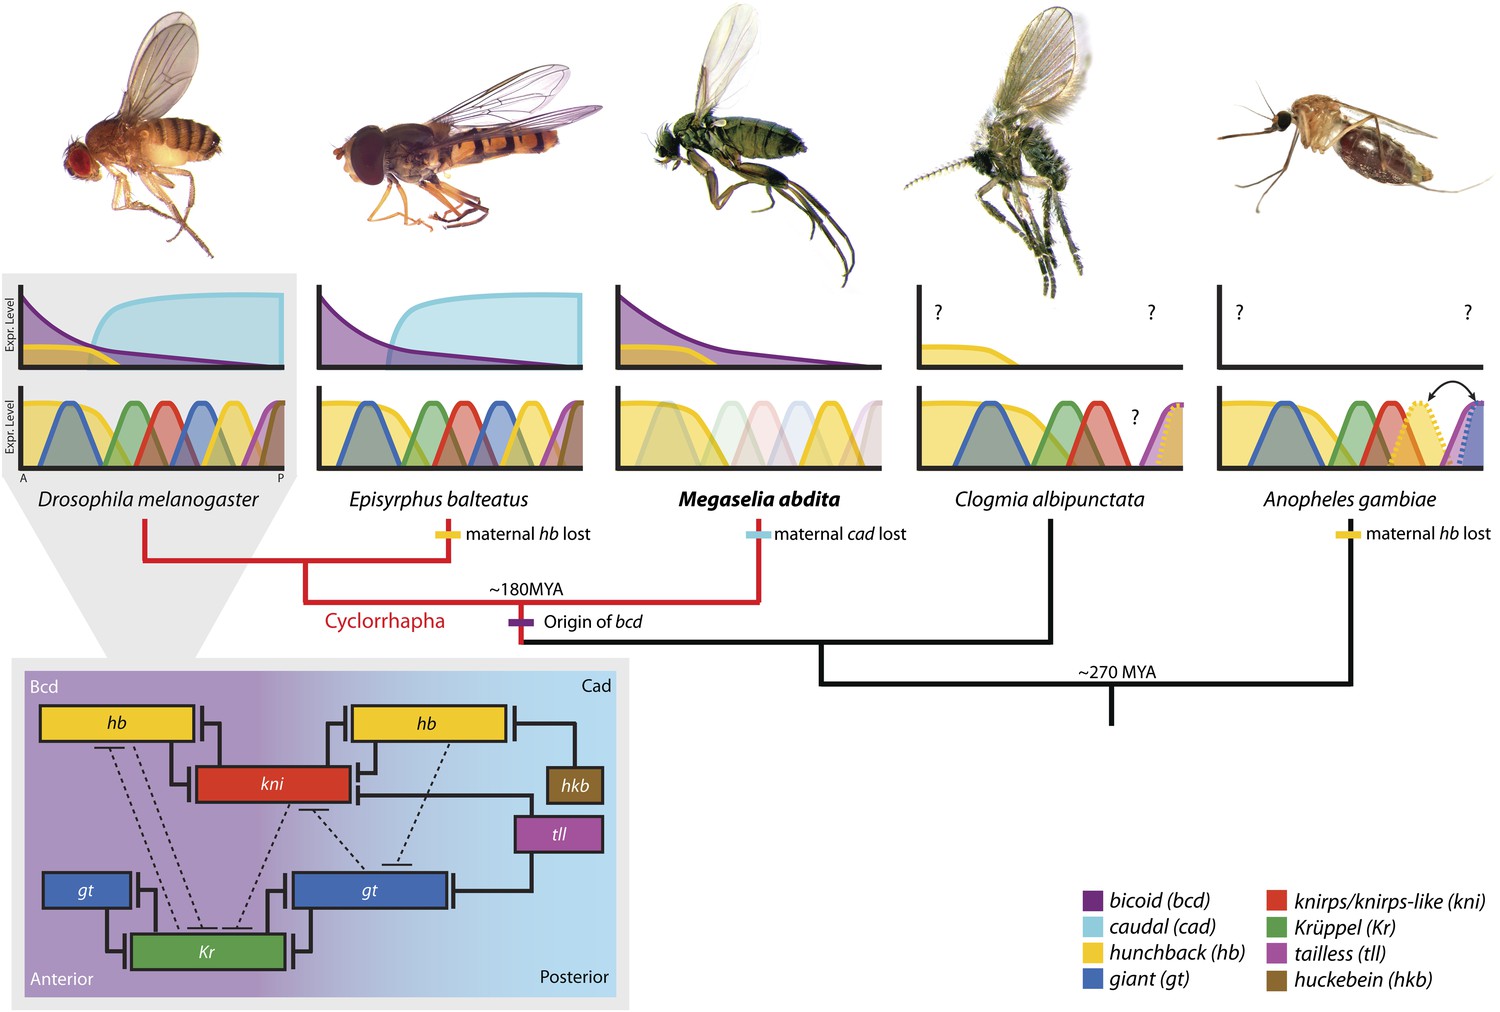
The evolution of the dipteran gap gene network.
A simplified phylogenetic tree of the order Diptera indicates the relative position of M. abdita with regard to other species of flies, midges, and mosquitoes in which gap genes have been studied in some detail. M. abdita belongs to the brachyceran infra-order Cyclorrhapha (marked in red); paraphyletic nematoceran lineages are shown in black. Only cyclorrhaphan flies have a bcd gene. Other maternal gradients have been lost along various branches of the tree (as indicated). For each species, we show an image of the adult (top), as well as a schematic representation of the spatial arrangement of maternal gradients (middle), and gap gene expression domains (bottom). Y-axes show expression levels (in normalised arbitrary units); X-axes show position along the major axis of the embryo (A: anterior, P: posterior). See key for colour coding. Solid colours indicate previously published expression patterns; faded colours represent previously unknown patterns reported in this study. Question marks indicate unknown maternal gradients or potentially missing gap domains. The inset (grey background) shows the gap gene network in D. melanogaster. Within the inset, background colour indicates major maternal regulatory inputs, boxes show the position of gap domains along the A–P axis; T-bars represent strong (solid) or weak (dashed) cross-repressive interactions among gap genes. Species (families): D. melanogaster (Drosophilidae): vinegar fly; E. balteatus (Syrphidae): marmalade hoverfly; M. abdita (Phoridae): scuttle fly; C. albipunctata (Psychodidae): moth midge; A. gambiae (Culicidae): malaria mosquito. All images are our own except A. gambiae image taken by Muhammad Mahdi Karim (source: Wikimedia Commons). See text for details.
Figure 2
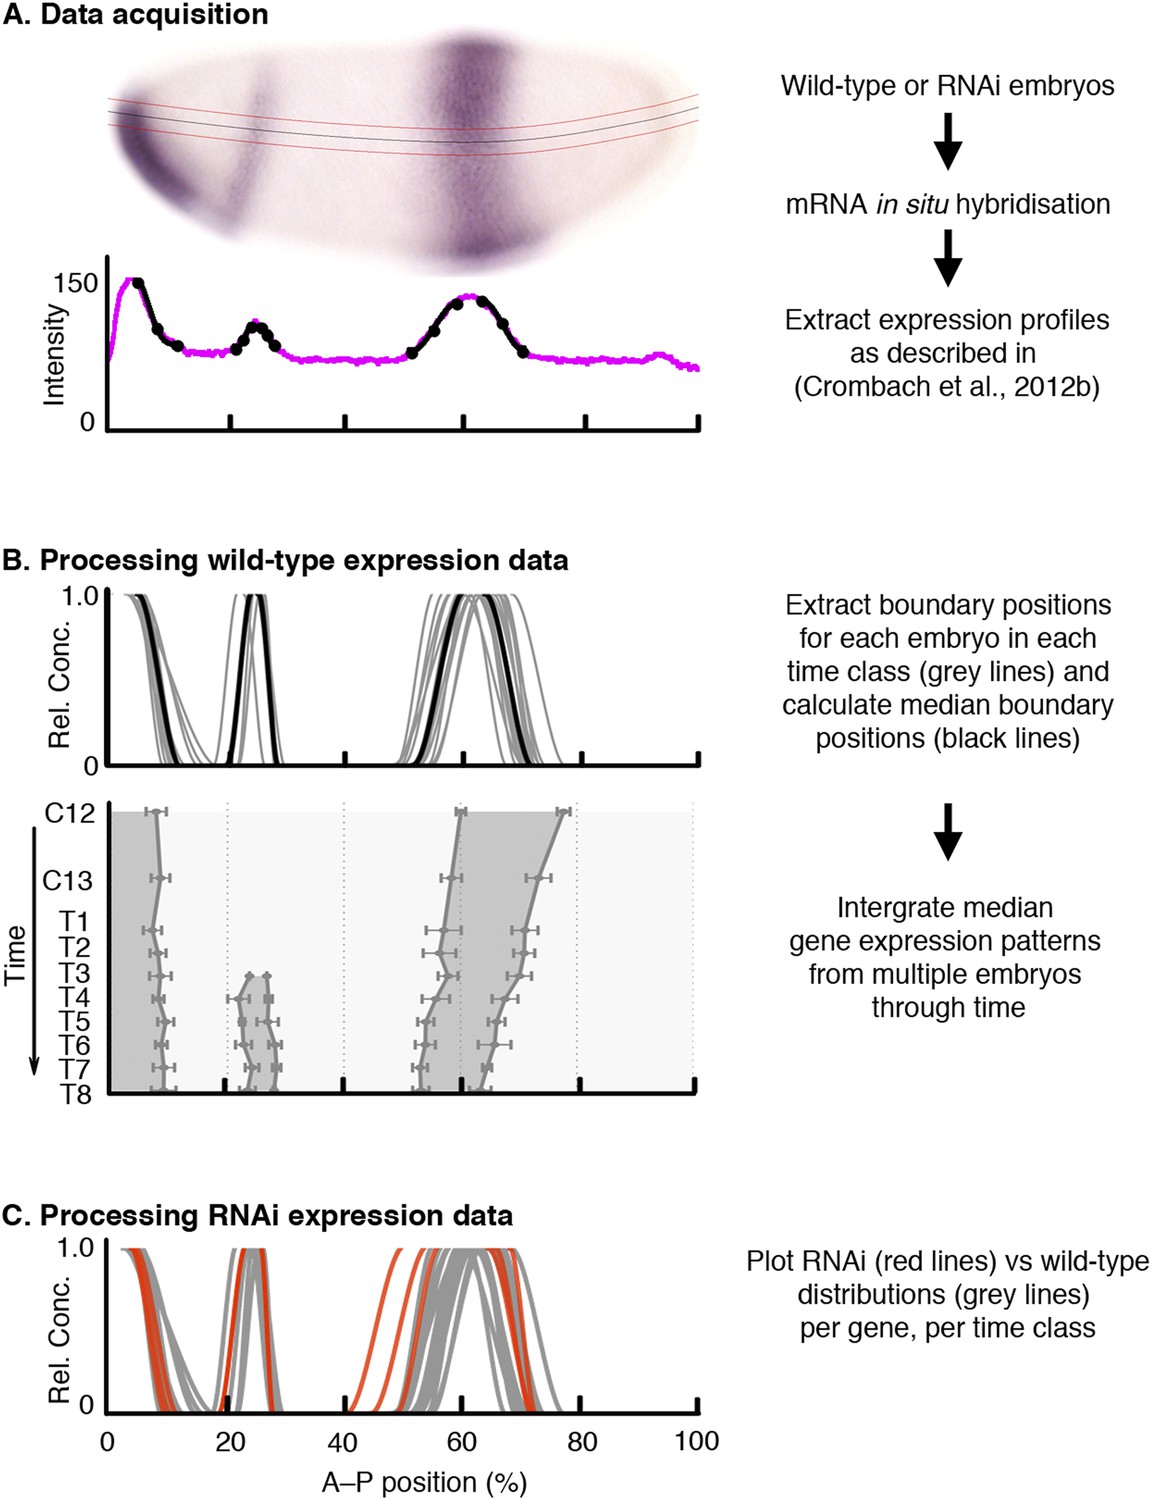
Data acquisition and processing of wild-type and RNAi knock-down embryos.
As an example, we show kni mRNA expression in wild-type and hb RNAi-treated embryos. (A) Data acquisition: wild-type or RNAi-treated embryos were stained by single or double in situ hybridisation using an enzymatic (colorimetric) protocol as described in Crombach et al. (2012a). Embryo image shows a lateral view (anterior to the left, dorsal up) stained for kni mRNA (purple). We extract boundary positions as described in Crombach et al. (2012b): first, we determine a 10% strip (delimited by red lines) along the midline of the dorso-ventral axis (black line). After the extraction of the intensity profile within this strip (magenta line in graph), we manually fit clamped splines to domain boundaries (black lines with mid- and end-points indicated by circles). (B) Extracted boundaries from wild-type embryos are classified by gene and time class (grey lines) and used to calculate median boundary positions (black line in upper panel). This yields an integrated spatio-temporal dataset of gene expression (lower panel). Shaded area represents regions of active expression delimited by positions of half-maximal expression for median boundaries (solid lines). Error bars represent 1.5x median absolute deviation (MAD), which approximates one standard deviation. (C) RNAi expression data (red) are plotted against wild-type boundary positions (grey). X-axes represent % A–P position (where 0% is the anterior pole). Y-axes represent pixel intensity or relative mRNA concentration in arbitrary units, except for the lower panel in (B), where the Y-axis represents time flowing downwards. C12/13: cleavage cycles 12/13; T1–8: time classes within C14A as defined in Wotton et al. (2014).
Figure 3
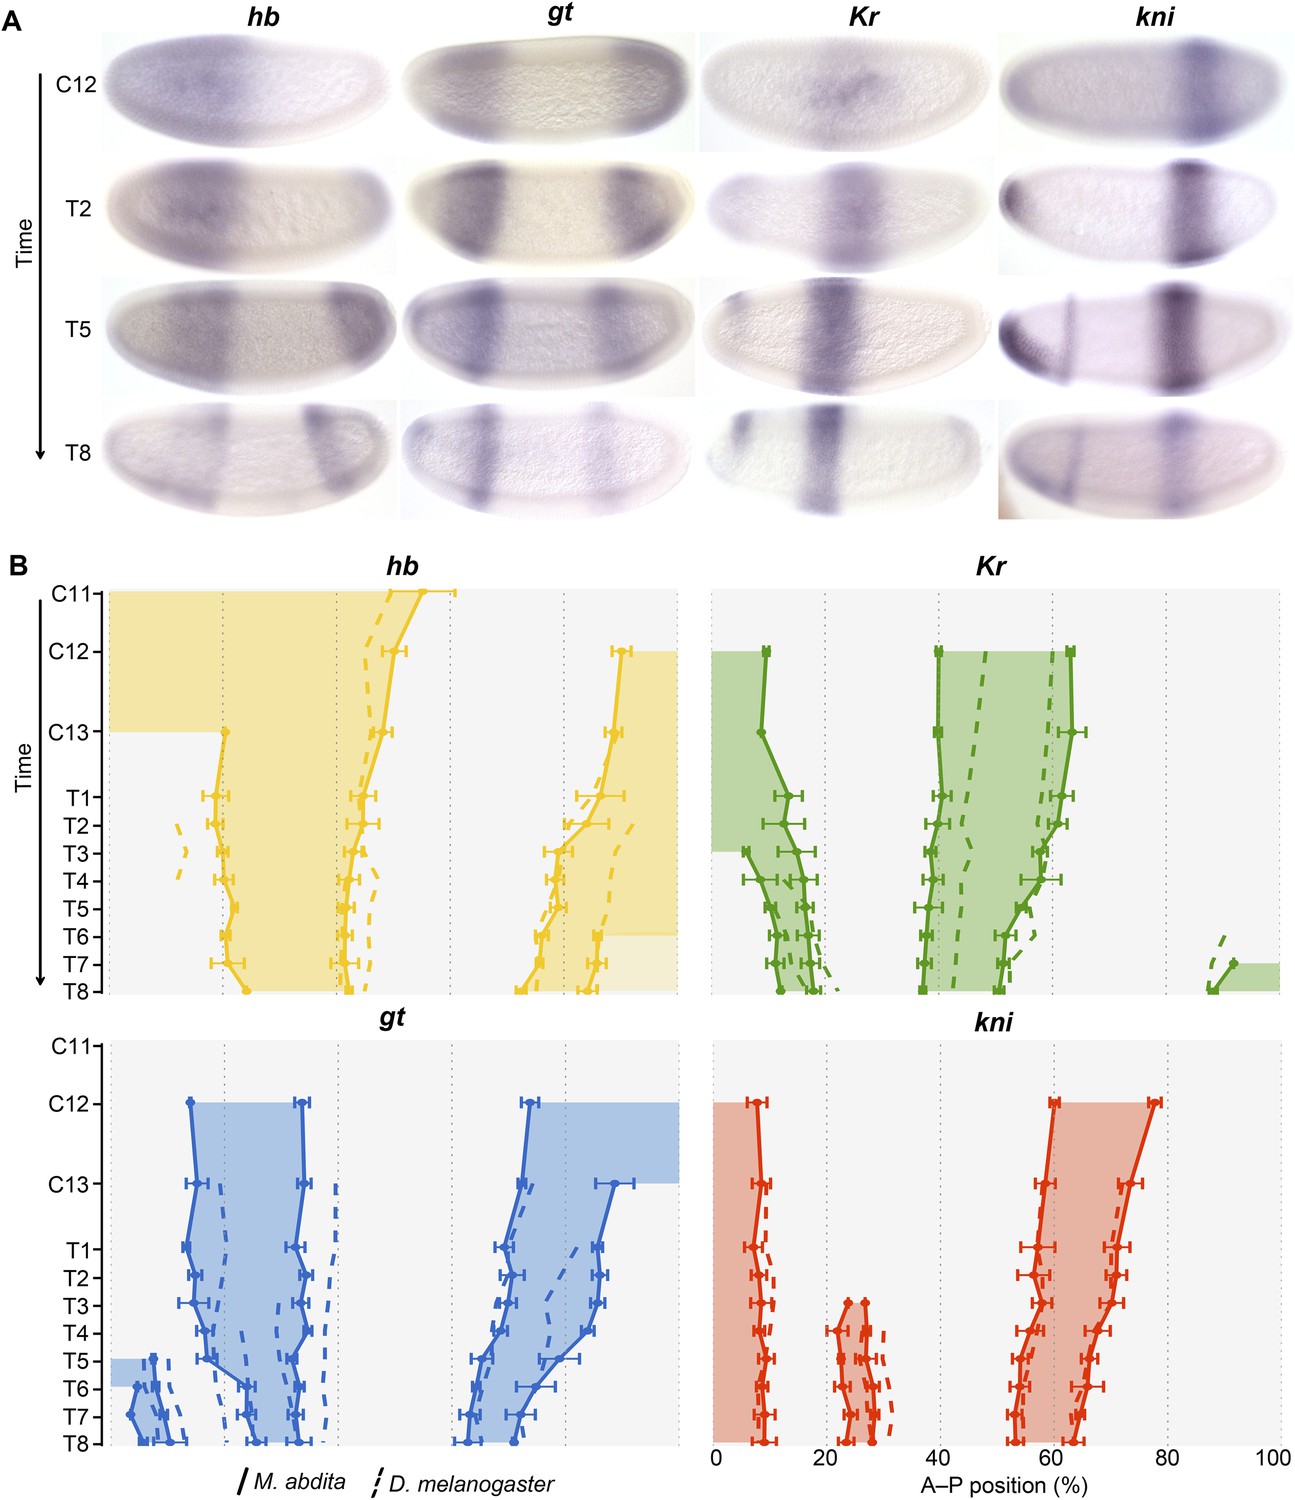
Trunk gap gene expression in M. abdita.
(A) Wild-type mRNA expression patterns for trunk gap genes hunchback (hb), Krüppel (Kr), giant (gt), and knirps (kni) are shown in M. abdita embryos at selected time points (cleavage cycle 12, C12; and C14A, time classes T2/5/8). Embryos are shown in lateral view; anterior is to the left, dorsal up. (B) Space-time plots of gap gene expression in M. abdita (solid lines, filled areas) and D. melanogaster (dashed lines). hb is shown in yellow, Kr in green, gt in blue, kni in red. Lines represent positions of half-maximal expression for median boundaries; error bars for M. abdita data represent 1.5x median absolute deviation (MAD), as in Figure 2B. Lightly coloured hb in T6–T8 represents down-regulation. Time progresses downward in (A) and (B). C12/13: cleavage cycles 12/13; T1–8: time classes within C14A as defined in Wotton et al. (2014) for M. abdita and in Surkova et al. (2008b) for D. melanogaster.
Figure 4
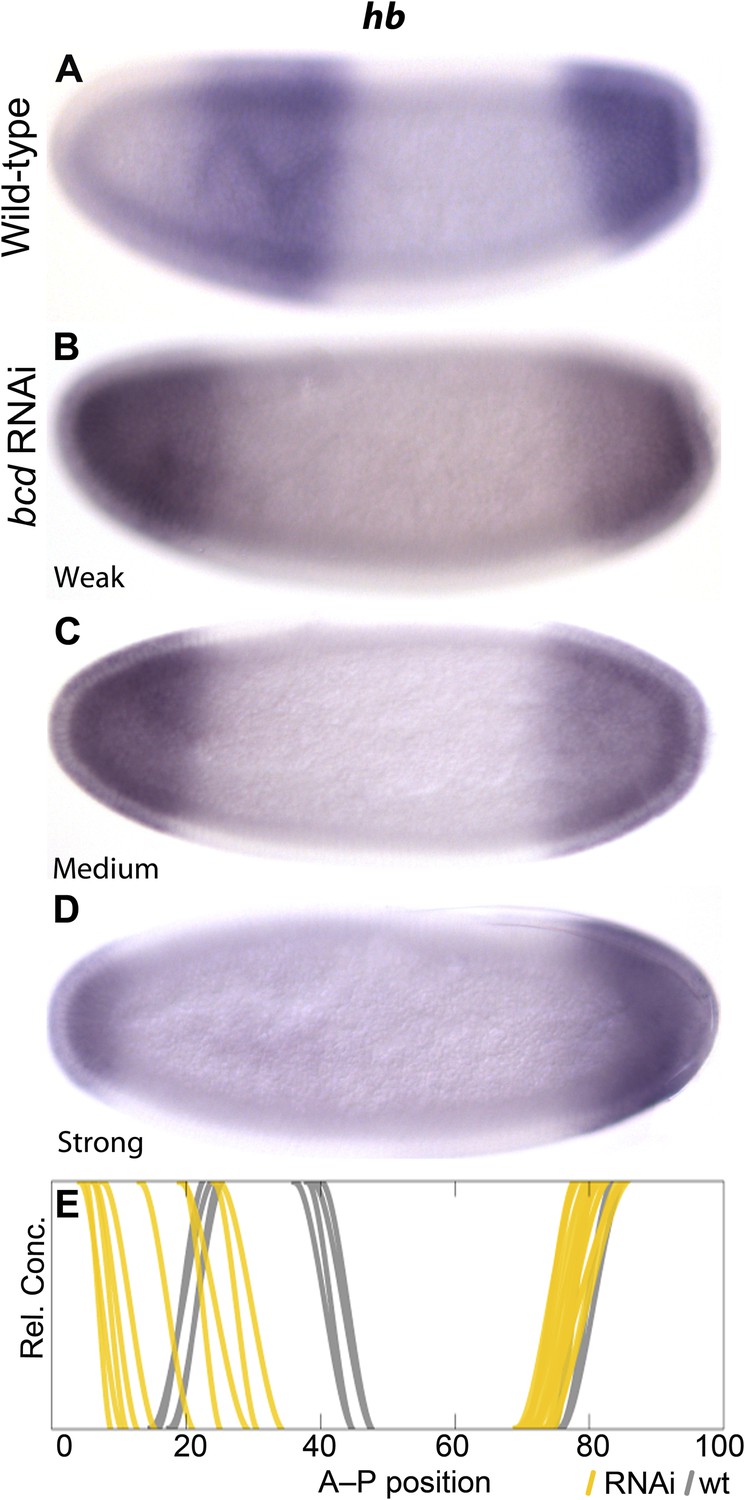
Gap domain boundary positioning is dependent on Bicoid levels in M. abdita.
hb expression (purple) is shown in wild-type (A) and in bcd RNAi-treated embryos (B–D). The position of the posterior boundary of the anterior hb domain moves anteriorly as Bcd levels are reduced by RNAi. (E) Summary graph comparing wild-type boundary positions (grey) to boundary positions affected by RNAi (yellow lines). All embryos are at time class T4. Embryo images show lateral views: anterior is to the left, dorsal is up.
Figure 5

Absence of maternal cad delays posterior patterning in D. melanogaster.
The expression of gt (A–C) and hb (D–F) is shown in wild-type embryos (A, D) and in cad germ-line clones (cad GLC) lacking only maternal cad (B, E; purple stain: gt or kni, red stain: even-skipped). (C, F) Summary graphs comparing wild-type boundary positions (grey) to boundary positions in cad GLC (coloured lines) show posterior domains of gt (C) and abdominal domains of kni (F) that are displaced towards the posterior. Embryos are at time class T3 (gt; A–C) and T4 (kni; D–F). Embryo images show lateral views: anterior is to the left, dorsal is up.
Figure 6
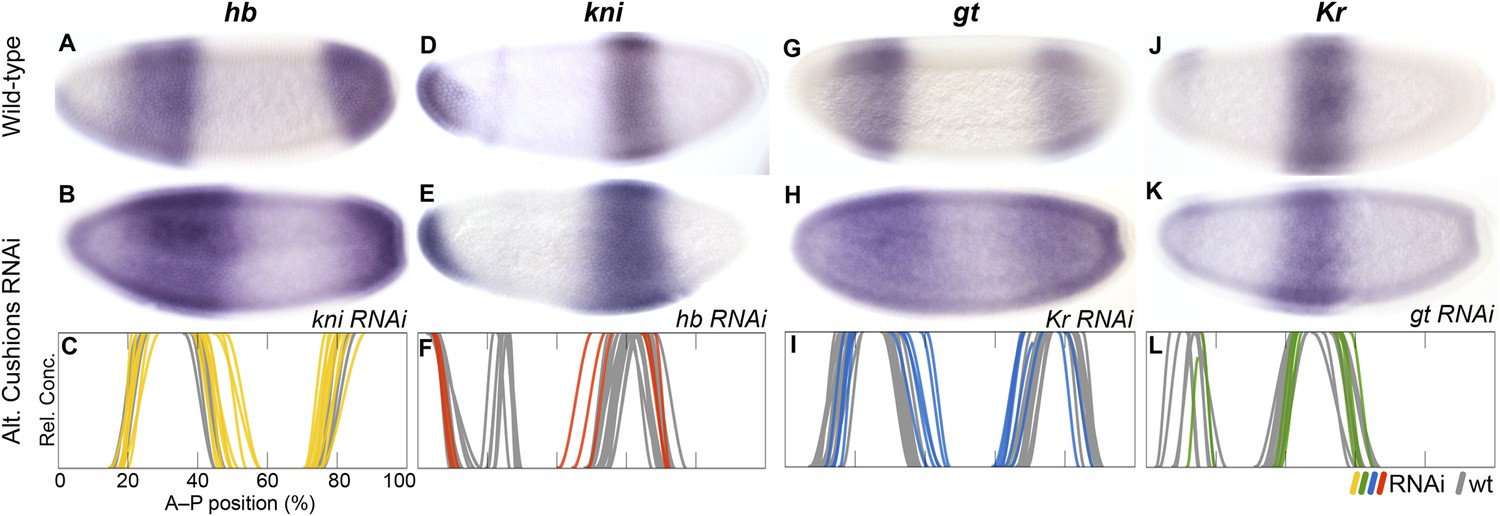
RNAi knock-down of complementary gap genes (alternating cushions).
Columns show the expression of hb (A–C; yellow), kni (D–F; red), gt (G–I; blue), and Kr (J–L; green) in wild-type embryos (top row; A, D, G, J), in RNAi-treated embryos as indicated (middle row; B, E, H, K), and as summary graphs comparing wild-type boundary positions (grey) to boundary positions affected by RNAi (coloured lines) (bottom row; C, F, I, L). All embryos are at time class T4. Embryo images show lateral views: anterior is to the left, dorsal is up.
Figure 7
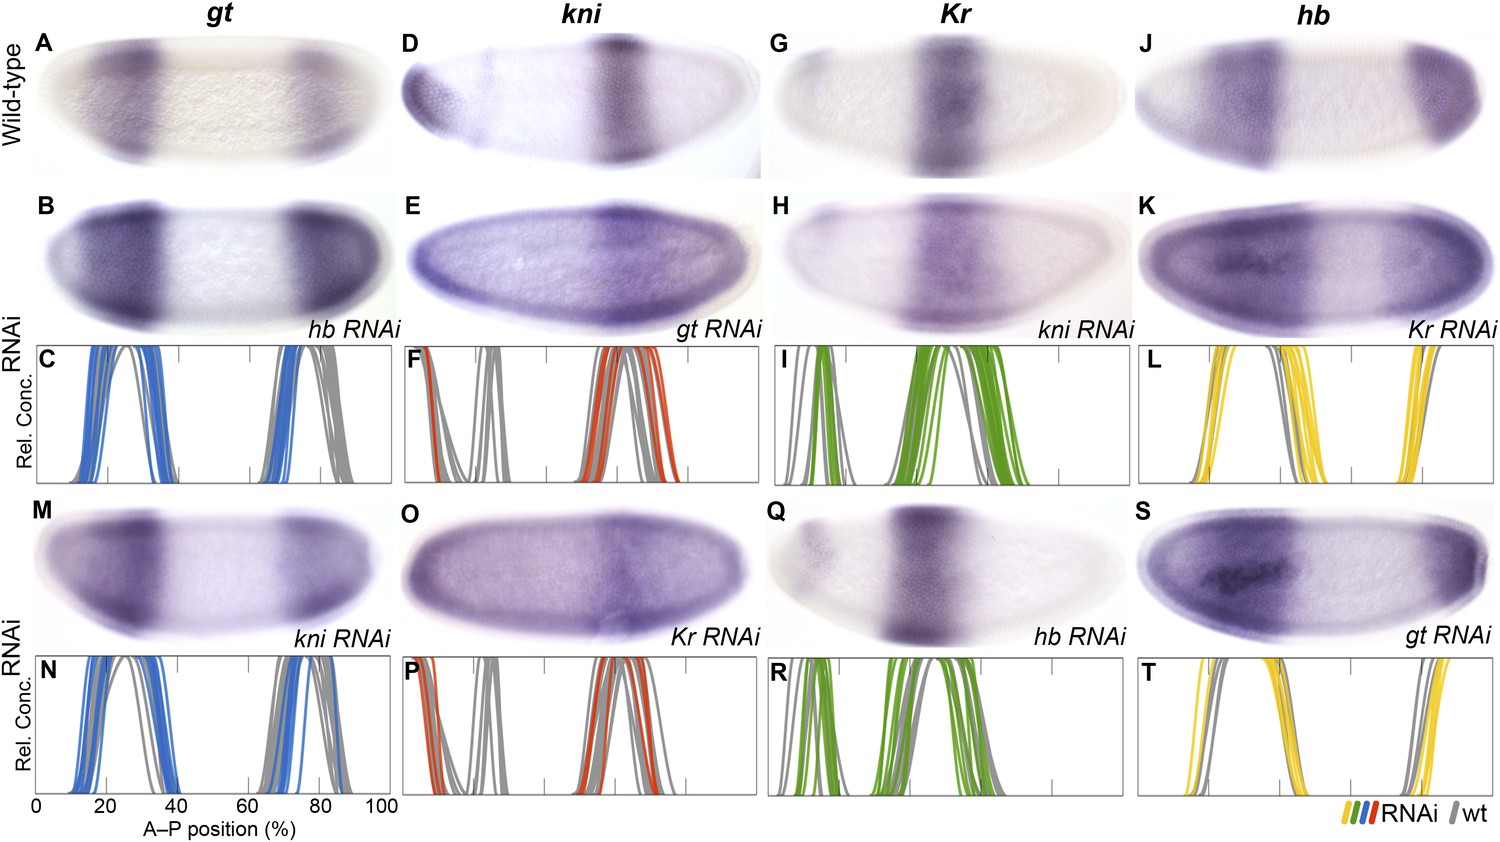
RNAi knock-down of overlapping gap genes (shift mechanisms and others).
Columns show the expression of gt (A–C, M, N; blue), kni (D–F, O, P; red), Kr (G–I, Q, R; green), and hb (J–L, S, T; yellow) in wild-type embryos (top row; A, D, G, J), in RNAi-treated embryos as indicated (rows 2 and 4; B, E, H, K; M, O, Q, S), and as summary graphs comparing wild-type boundary positions (grey) to boundary positions affected by RNAi (coloured lines) (rows 3 and 5; C, F, I, L; N, P, R, T). All embryos are at time class T4. Embryo images show lateral views: anterior is to the left, dorsal is up.
Figure 8
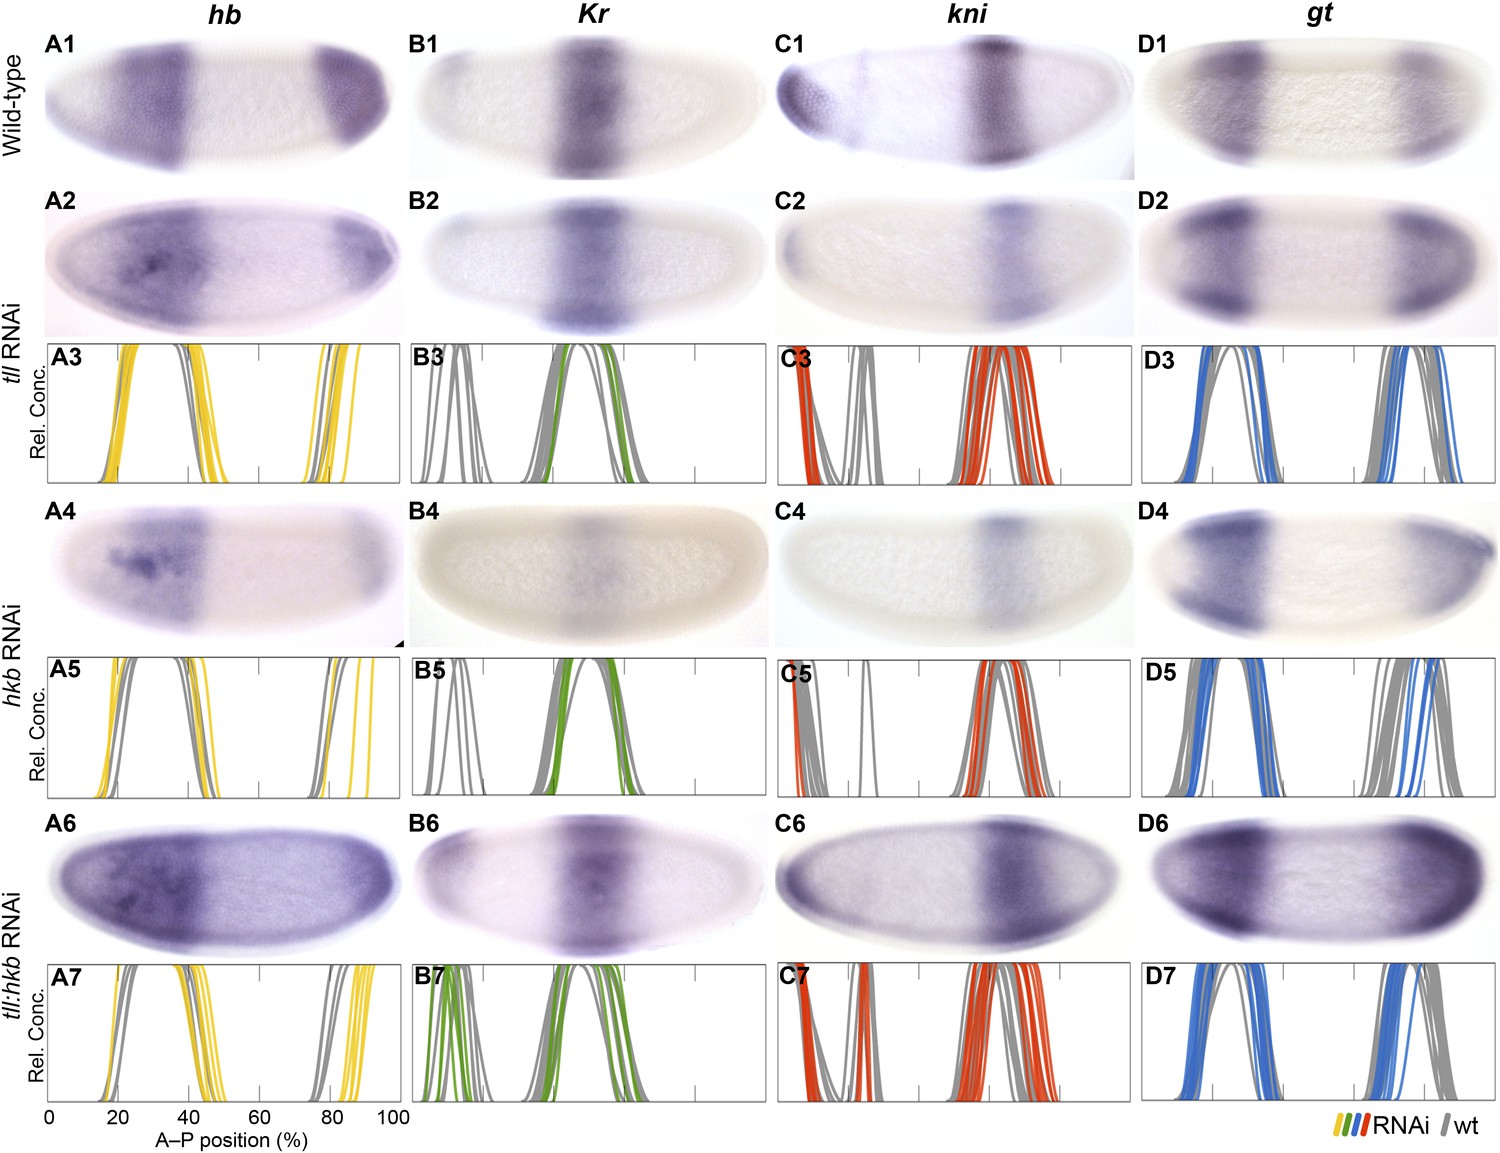
Knock-down of the terminal gap genes.
Columns show the expression of hb (A1–A7; yellow), Kr (B1–B7; green), kni (C1–C7; red), gt (D1–D7; blue) in wild-type embryos (top row; A1, B1, C1, D1), in RNAi-treated embryos as indicated (rows 2, 4, and 6; A–D), and as summary graphs comparing wild-type boundary positions (grey) to boundary positions affected by RNAi (coloured lines) (rows 3, 5, and 7; A–D). All embryos are at time class T4. Embryo images show lateral views: anterior is to the left, dorsal is up.
Figure 9

Comparison of posterior boundary positions and gene network structure between M. abdita and D. melanogaster.
(A) This graph shows the position of the posterior boundaries of anterior gt (blue) and hb (yellow), central Kr (green), abdominal kni (red), and posterior gt (blue) and hb (yellow). Initial boundary positions are either more anterior (dark grey) or more posterior (light grey background) in M. abdita (solid) than in D. melanogaster (dotted lines). Arrows with time classes T1–T8 indicate when boundary positions first converge between the two species. Time flows downward. (B and C) Gap gene network structure for D. melanogaster (B) and M. abdita (C) as reconstructed from our knock-down analysis, displayed using the same layout as the inset of Figure 1. Red T-bar connectors indicate differences in interaction strength (indicated by line width) between M. abdita and D. melanogaster. See text for details.
Figure 10
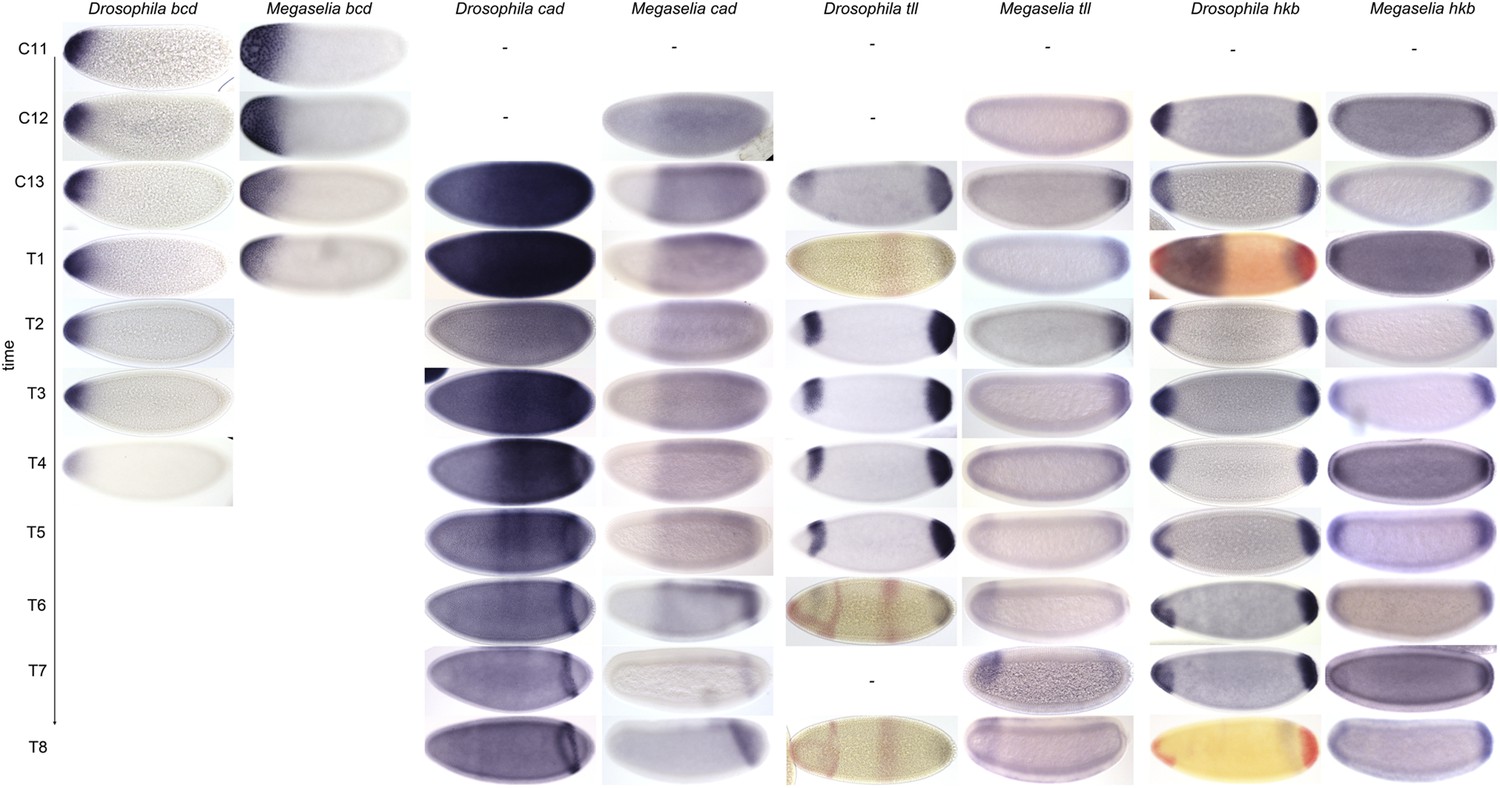
Expression data—maternal co-ordinate and terminal gap genes.
Time series of mRNA expression patterns of the maternal genes bcd and cad, as well as the terminal gap genes hkb and tll are shown for D. melanogaster (left) and M. abdita (right). Expression patterns are visualised by colorimetric (enzymatic) in situ hybridisation using wide-field microscopy as described in Crombach et al. (2012a). Relevant expression patterns are shown in blue, except for hkb at T1 and T8, which is shown in red. Red stain in tll (T1/6/8) shows kni. Single stains are shown for all other genes and time classes. Early stages at the top, time progresses downwards. Embryo images show lateral views: anterior to the left, dorsal up. C11–13: cleavage cycles 11–13; T1–8: time classes subdividing C14A as defined in Surkova et al. (2008b) and Wotton et al. (2014). D. melanogaster patterns were published in Crombach et al. (2012a) and are shown for comparison.
Figure 11
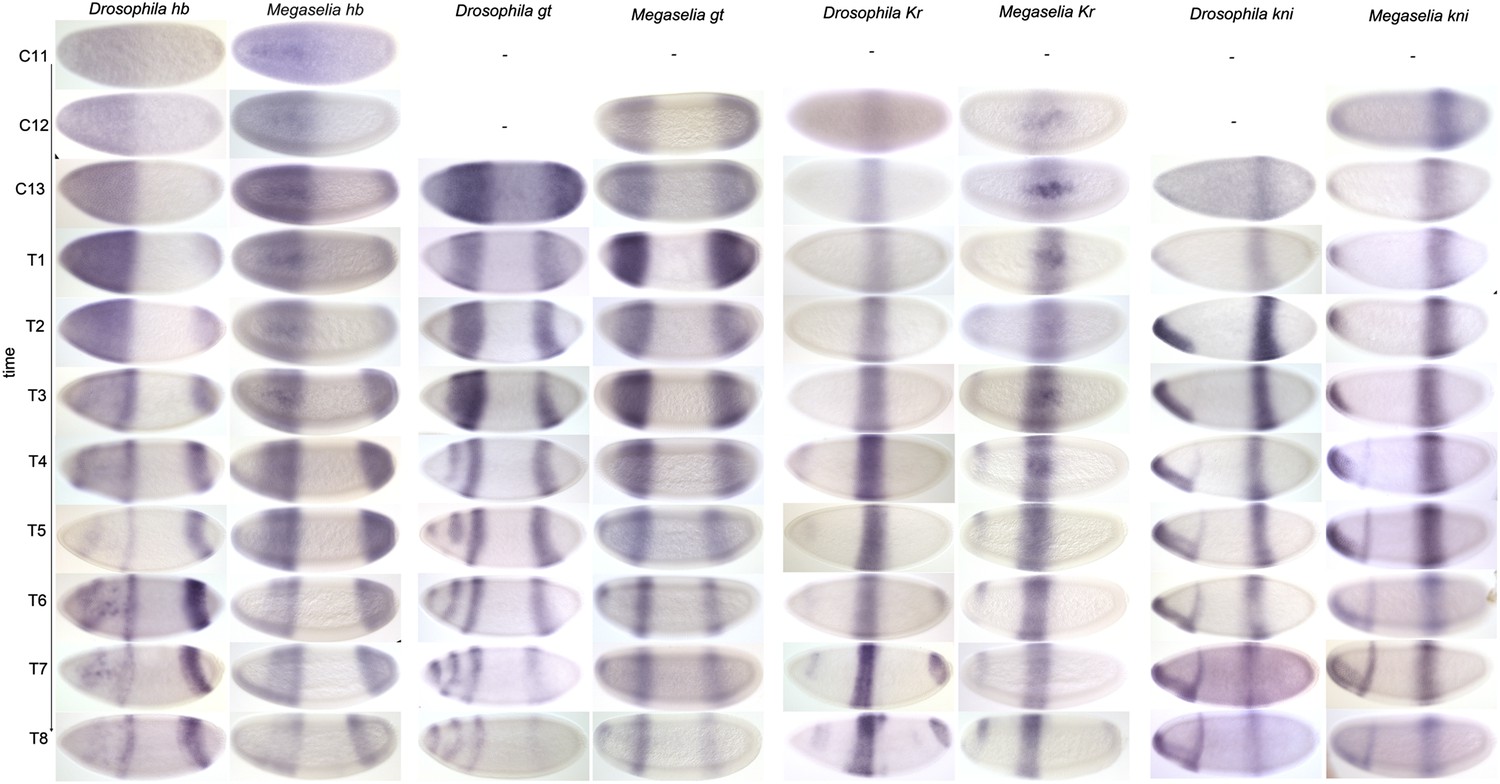
Expression data—trunk gap genes.
Time series of mRNA expression patterns of trunk gap genes hb, gt, Kr, and kni are shown for D. melanogaster (left) and M. abdita (right). Expression patterns are visualised by colorimetric (enzymatic) in situ hybridisation using wide-field microscopy as described in Crombach et al. (2012b). Early stages at the top, time progresses downwards. Embryo images show lateral views: anterior to the left, dorsal up. C11–13: cleavage cycles 11–13; T1–8: time classes subdividing C14A as defined in Surkova et al. (2008b) and Wotton et al. (2014). D. melanogaster patterns for C14A were published in Crombach et al. (2012a) and are shown for comparison.
Figure 12
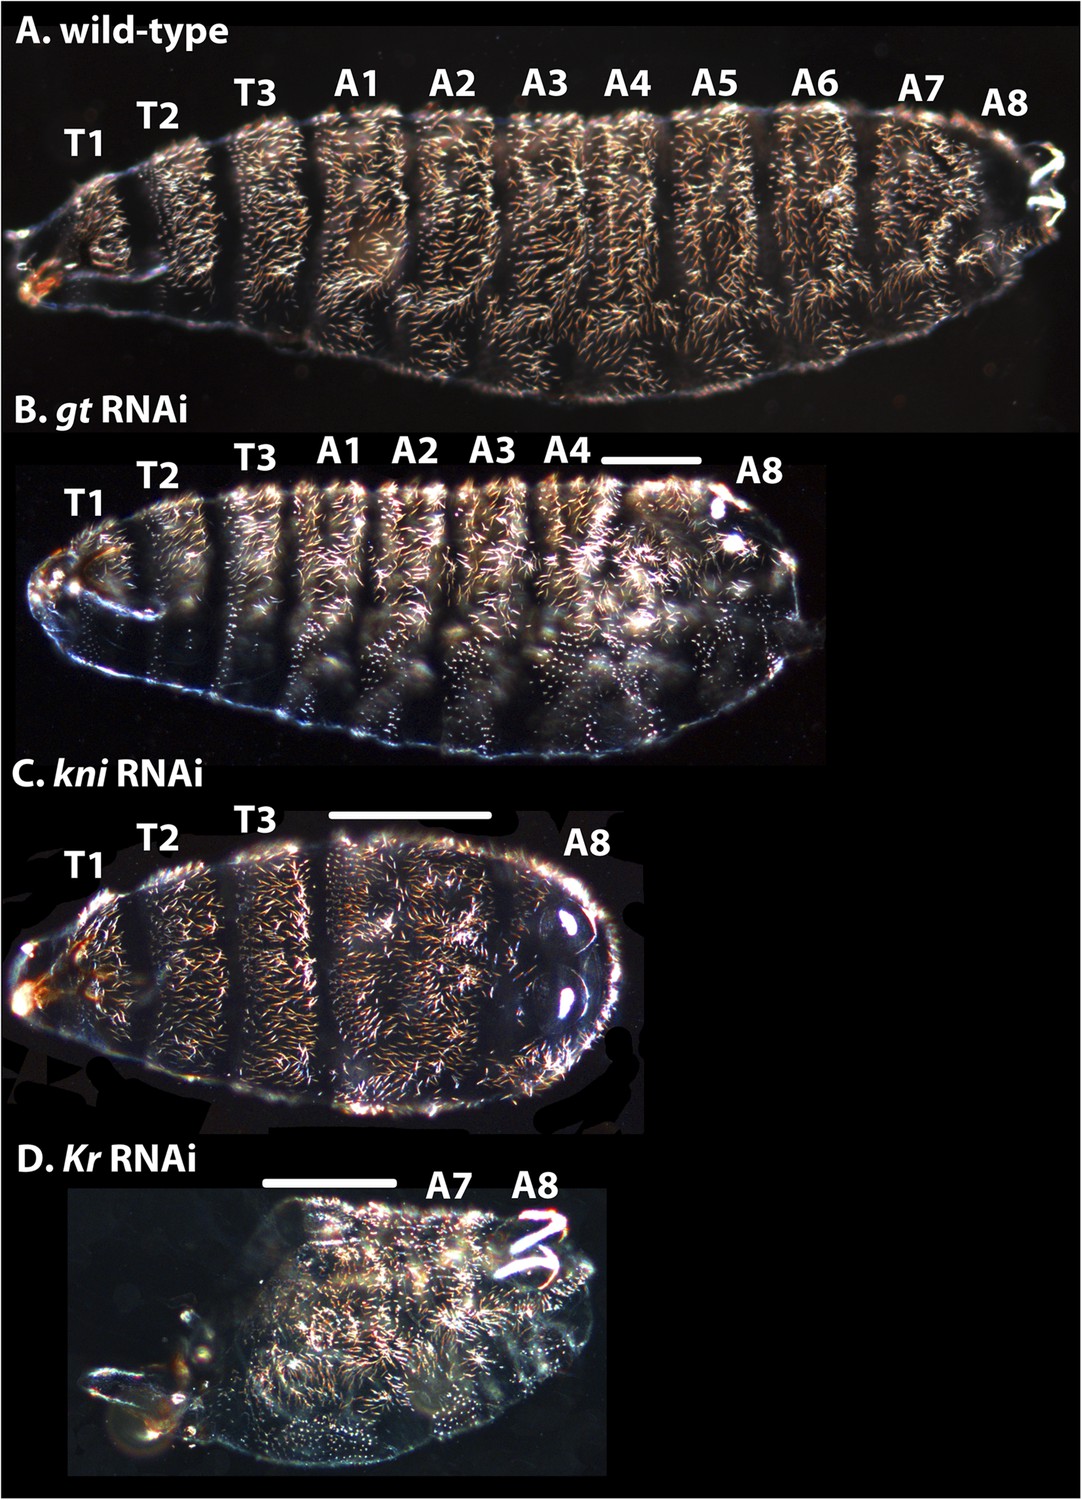
Cuticle phenotypes resulting from RNAi knock-down of gt, kni, and Kr in M. abdita.
(A) A wild-type cuticle is shown for comparison to severe phenotypes in gt (B), kni (C), and Kr (D) RNAi-treated embryos. We tentatively assign segment identity to persisting abdominal segments based on their relative spatial order, the position of expression domains of the knocked-down genes in the blastoderm (see Appendix I), and comparison to the corresponding cuticle phenotypes in D. melanogaster. T1–T3; thoracic segments, A1–A8; abdominal segments; solid line indicates fused segments. Cuticles are shown in lateral (A, B), ventral (C), or ventro-lateral (D) view. Anterior is to the left. hb RNAi knock-down phenotypes were previously published in Stauber et al. (2000).
Tables
Table 1
mRNA expression datasets for M. abdita. and D. melanogaster
| Domain | ant hb | ant gt | Kr | kni | post gt | post hb | |||||
|---|---|---|---|---|---|---|---|---|---|---|---|
| Boundary | P | A | P | A | P | A | P | A | P | A | P |
| C11 | 4 | - | - | - | - | - | - | - | - | - | - |
| - | - | - | - | - | - | - | - | - | - | - | |
| C12 | 22 | 2 | 2 | 8 | 7 | 4 | 4 | 4 | - | 2 | - |
| 4 | - | - | 1 | 1 | - | 1 | 1 | - | - | - | |
| C13 | 8 | 11 | 11 | 7 | 7 | 14 | 14 | 11 | 2 | 5 | - |
| 31 | 8 | 8 | 9 | 6 | 16 | 14 | 11 | - | 1 | - | |
| T1 | 8 | 6 | 5 | 9 | 8 | 10 | 10 | 7 | 3 | 7 | - |
| 15 | 14 | 14 | 10 | 7 | 15 | 13 | 11 | 10 | 5 | - | |
| T2 | 7 | 7 | 7 | 7 | 7 | 19 | 19 | 7 | 4 | 8 | - |
| 13 | 8 | 10 | 6 | 5 | 19 | 16 | 8 | 9 | 8 | 1 | |
| T3 | 19 | 14 | 13 | 8 | 8 | 12 | 12 | 15 | 10 | 18 | - |
| 16 | 11 | 15 | 9 | 5 | 17 | 15 | 14 | 17 | 11 | 6 | |
| T4 | 4 | 11 | 13 | 10 | 9 | 14 | 14 | 13 | 13 | 4 | - |
| 7 | 11 | 12 | 10 | 4 | 18 | 17 | 9 | 13 | 10 | 7 | |
| T5 | 5 | 8 | 8 | 8 | 7 | 11 | 11 | 9 | 8 | 4 | - |
| 12 | 16 | 17 | 16 | 11 | 18 | 17 | 14 | 14 | 10 | 8 | |
| T6 | 4 | 10 | 10 | 7 | 7 | 8 | 8 | 10 | 10 | 4 | 3 |
| 9 | 14 | 14 | 17 | 15 | 15 | 15 | 14 | 12 | 11 | 14 | |
| T7 | 2 | 7 | 7 | 13 | 13 | 8 | 8 | 6 | 6 | 2 | 2 |
| 5 | 8 | 8 | 11 | 11 | 5 | 5 | 8 | 6 | 10 | 9 | |
| T8 | 8 | 9 | 8 | 6 | 6 | 6 | 6 | 7 | 5 | 8 | 8 |
| 8 | 12 | 12 | 6 | 6 | 6 | 6 | 7 | 6 | 9 | 8 | |
-
This table shows the number of embryos used to calculate median positions for each expression boundary at each point in time (M. abdita: white rows; D. melanogaster: grey rows). Ant: anterior, Post: posterior domain. A indicates anterior, P posterior boundary of a domain. Time classification as defined in Wotton et al. (2014) for M. abdita and in Surkova et al. (2008b) for D. melanogaster: C11–13 correspond to cleavage cycles 11 to 13; T1–8 represent time classes subdividing C14A. Our M. abdita expression dataset consists of a total of 367 embryos (91 stained for hb, 83 for Kr, 87 for gt, and 106 for kni). An additional 115 embryos make up the dataset for maternal co-ordinate and terminal gap genes shown in Supplementary file 1. The D. melanogaster gap gene dataset has been published previously (Crombach et al., 2012a). It is included here for comparison.
Table 2
Overview of the RNAi dataset for M. abdita
| hb RNAi | gt RNAi | Kr RNAi | kni RNAi | tll RNAi | hkb RNAi | tll:hkb RNAi | |
|---|---|---|---|---|---|---|---|
| hb | n/a | 17/28 (60%) | 21/41 (51%) | 35/52 (67%) | 12/29 (41%) | 21/22 (95%) | 15/15 (100%) |
| gt | 28/35 (80%) | n/a | 13/20 (65%) | 24/30 (80%) | 24/30 (80%) | 10/10 (100%) | 35/36 (97%) |
| Kr | 24/53 (46%) | 7/17 (41%) | n/a | 26/40 (65%) | 7/18 (38%) | 10/10 (100%) | 12/21 (57%) |
| kni | 9/14 (64%) | 11/25 (44%) | 3/21 (14%) | n/a | 6/44 (14%) | 4/10 (40%) | 16/16 (100%) |
| Total | 102 | 70 | 82 | 122 | 121 | 52 | 88 |
-
A total of 637 RNAi-treated embryos were used for the analysis. This table shows the number of embryos that were stained for each of the trunk gap genes (rows), in each RNAi-treated background (columns), and the number of embryos that showed a knock-down phenotype (see also percentages). The total number of embryos used for each knock-down experiment is shown in the bottom row. A more detailed breakdown of embryos per cleavage cycle and time class, including detailed plots of boundary positions, is provided in Supplementary file 4.
Additional files
-
Supplementary file 1
Maternal co-ordinate and terminal gap gene mRNA expression dataset for M. abdita. This file contains a table with numbers of embryos in our dataset for maternal co-ordinate and terminal gap gene mRNA expression in M. abdita.
- https://doi.org/10.7554/eLife.04785.018
-
Supplementary file 2
Boundary positions/shifts and domain widths/overlaps contain tables with numerical comparisons of expression data between M. abdita and D. melanogaster. (A) Comparison of expression data between M. abdita and D. melanogaster: gap domain boundary positions. (B) Comparison of expression data between M. abdita and D. melanogaster: gap domain widths. (C) Comparison of expression data between M. abdita and D. melanogaster: gap domain boundary shifts. (D) Comparison of expression data between M. abdita and D. melanogaster: gap domain overlaps.
- https://doi.org/10.7554/eLife.04785.019
-
Supplementary file 3
Megaselia segmentation gene expression.
- https://doi.org/10.7554/eLife.04785.020
-
Supplementary file 4
RNAi dataset.
- https://doi.org/10.7554/eLife.04785.021
Download links
A two-part list of links to download the article, or parts of the article, in various formats.
Downloads (link to download the article as PDF)
Open citations (links to open the citations from this article in various online reference manager services)
Cite this article (links to download the citations from this article in formats compatible with various reference manager tools)
Quantitative system drift compensates for altered maternal inputs to the gap gene network of the scuttle fly Megaselia abdita
eLife 4:e04785.
https://doi.org/10.7554/eLife.04785


