Death following traumatic brain injury in Drosophila is associated with intestinal barrier dysfunction
- University of Wisconsin-Madison, United States
- University of Wisconsin–Madison, United States
Figures
Figure 1 with 1 supplement
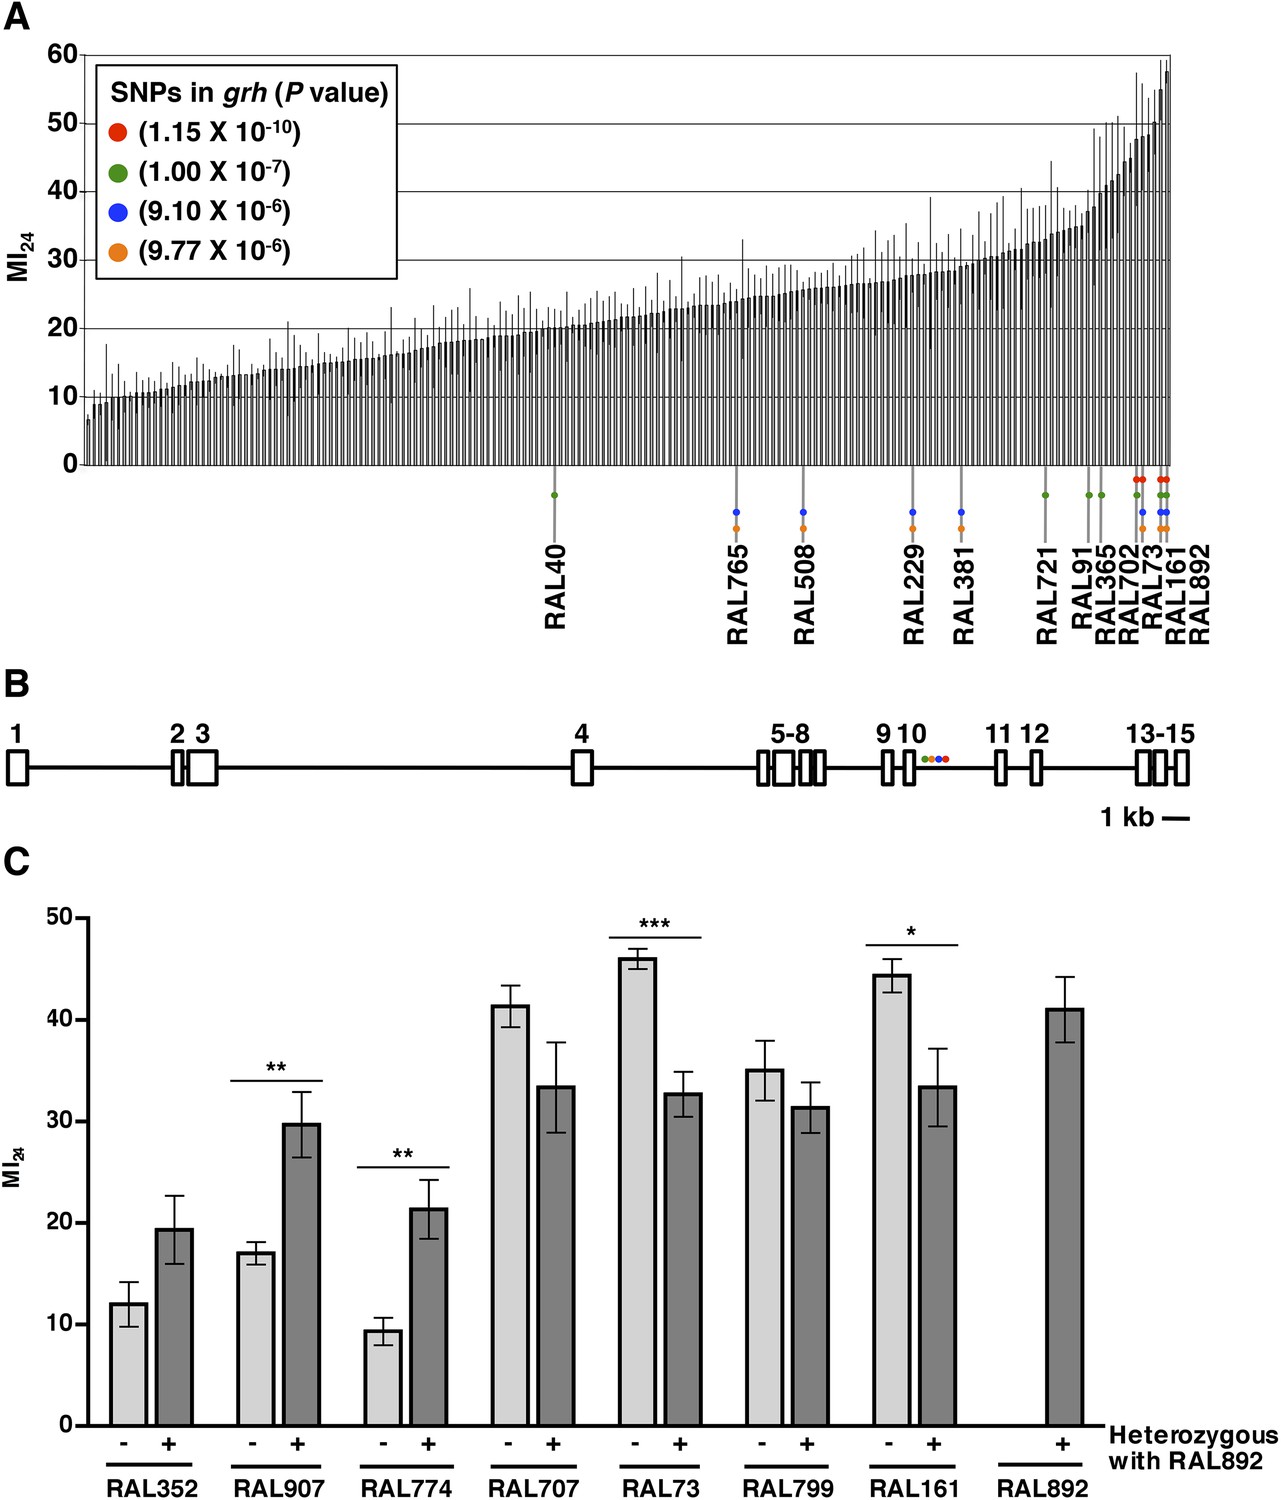
The MI24 greatly varies among 0–7 day old RAL flies and is associated with SNPs in grh.
(A) Average and standard deviation of the MI24 for 179 RAL lines. Supplementary file 1 lists MI24 values for each of the RAL lines. Colored dots represent SNPs in grh associated with the MI24 and are used to indicate the RAL lines that contain the SNPs. (B) Schematic diagram of the intron-exon structure of grh with the location of the four SNPs associated with the MI24 (St Pierre et al., 2014). Numbered boxes indicate exons and lines indicate introns. Note that spacing of the colored dots is not drawn to scale. (C) SNPs affect the MI24. Average and standard error of the mean (SEM) of the MI24 for RAL lines (light gray bars) and progeny from crosses between RAL lines and RAL892 (dark gray bars). *p < 0.05, **p < 0.01, and ***p < 0.001, one-tailed t test comparison.
Figure 1—figure supplement 1
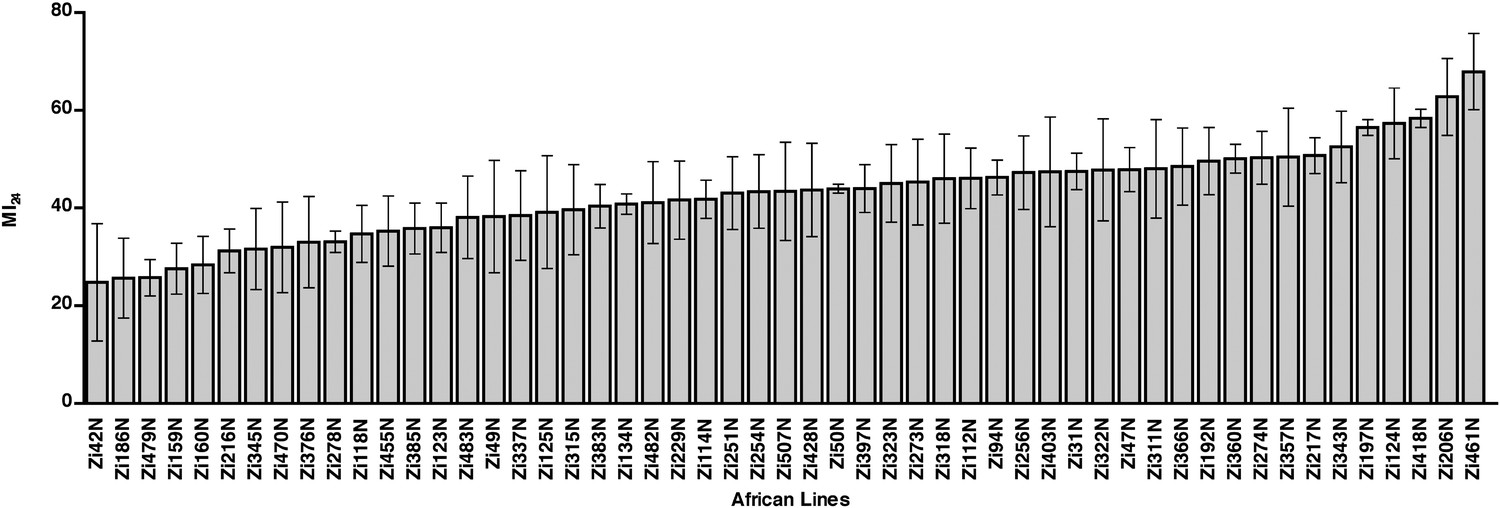
The MI24 greatly varies among 0–7 day old wild-type African lines.
Average and standard deviation of the MI24 for 53 African lines. Supplementary file 2 lists MI24 values for each of the African lines.
Figure 2 with 1 supplement
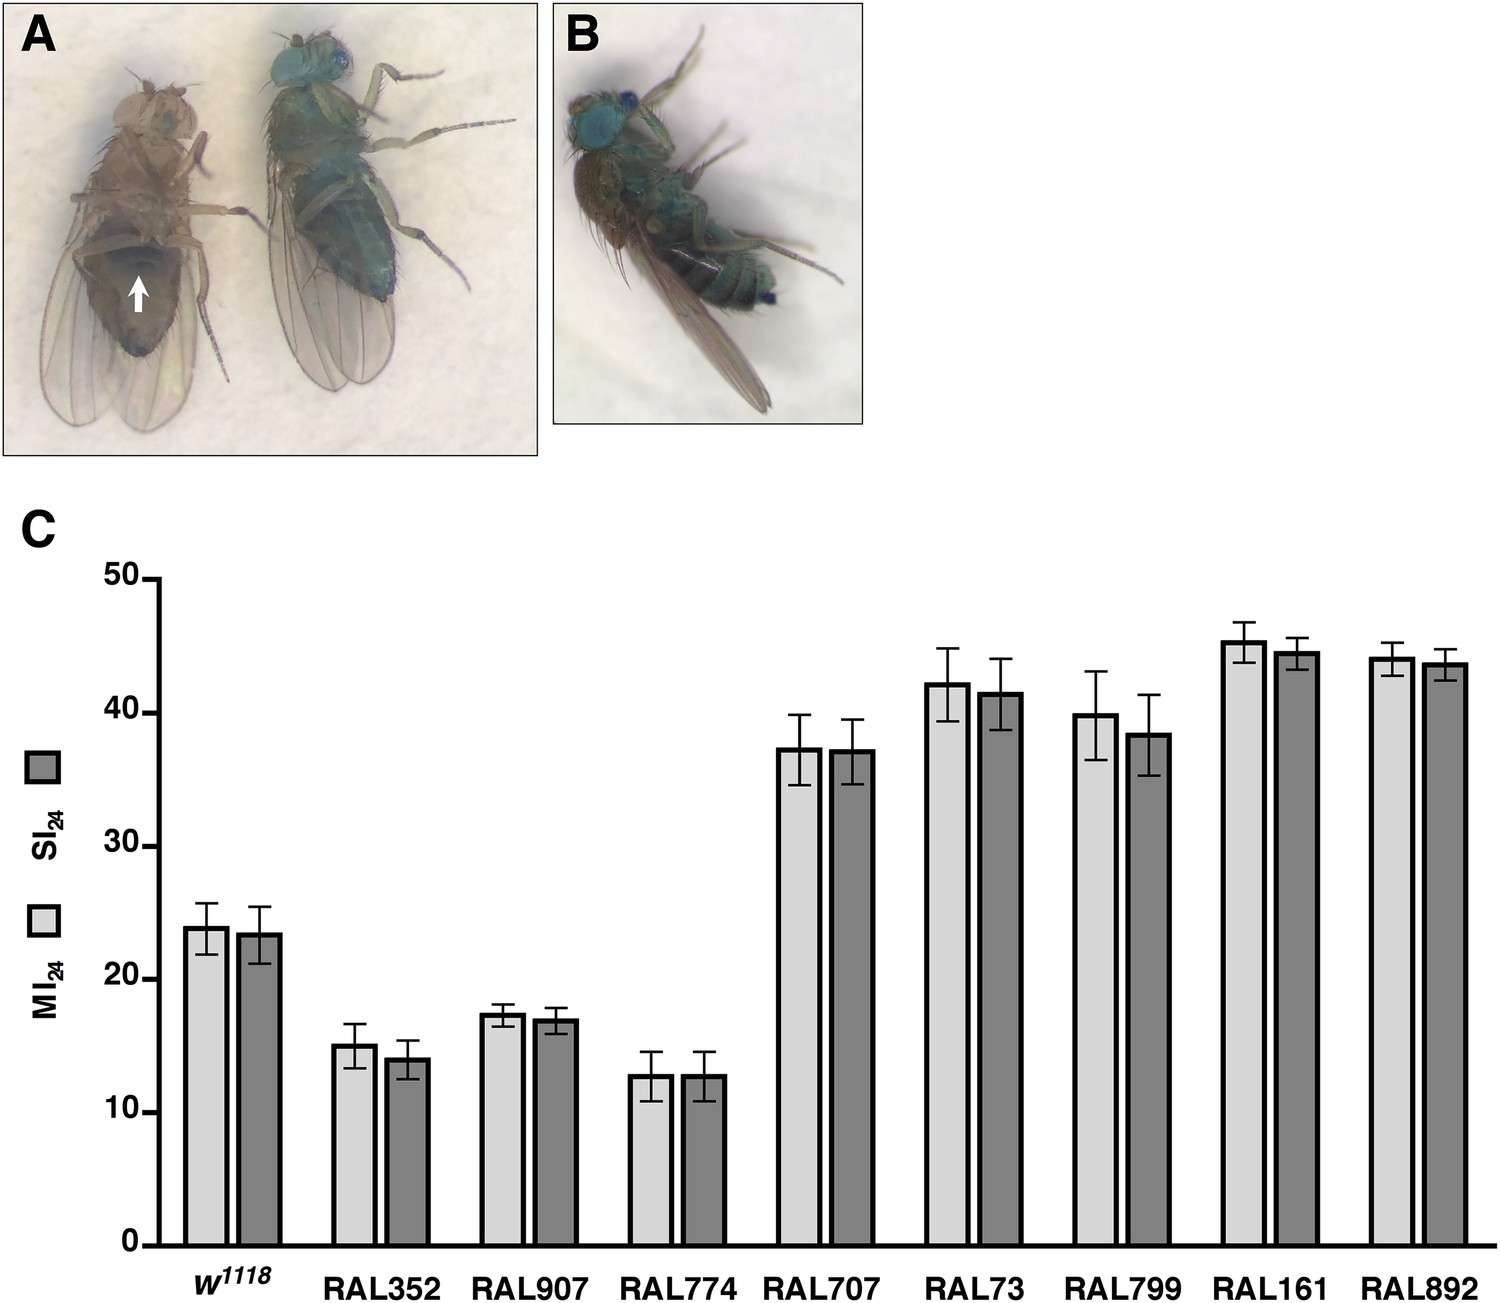
Traumatic injury causes intestinal barrier dysfunction.
(A) Flies that were fed molasses food with blue dye. In flies without traumatic injury (left), the dye was confined to the gut (arrow). In some flies with traumatic injury (right), the dye leaked out of the intestine into the hemolymph and dispersed throughout the body, producing a ‘Smurf’ phenotype (Rera et al., 2011; Rera et al., 2012). (B) A fly that was fed molasses food with blue dye and received brain injury from head compression. (C) Average and SEM of the MI24 (light gray bars) and SI24 (dark gray bars) for the indicated fly lines. The MI24 and SI24 were not significantly different for any of the fly lines (p > 0.32, one-tailed t test). The correlation coefficient (r) between the MI24 and SI24 was 1.0.
Figure 2—figure supplement 1
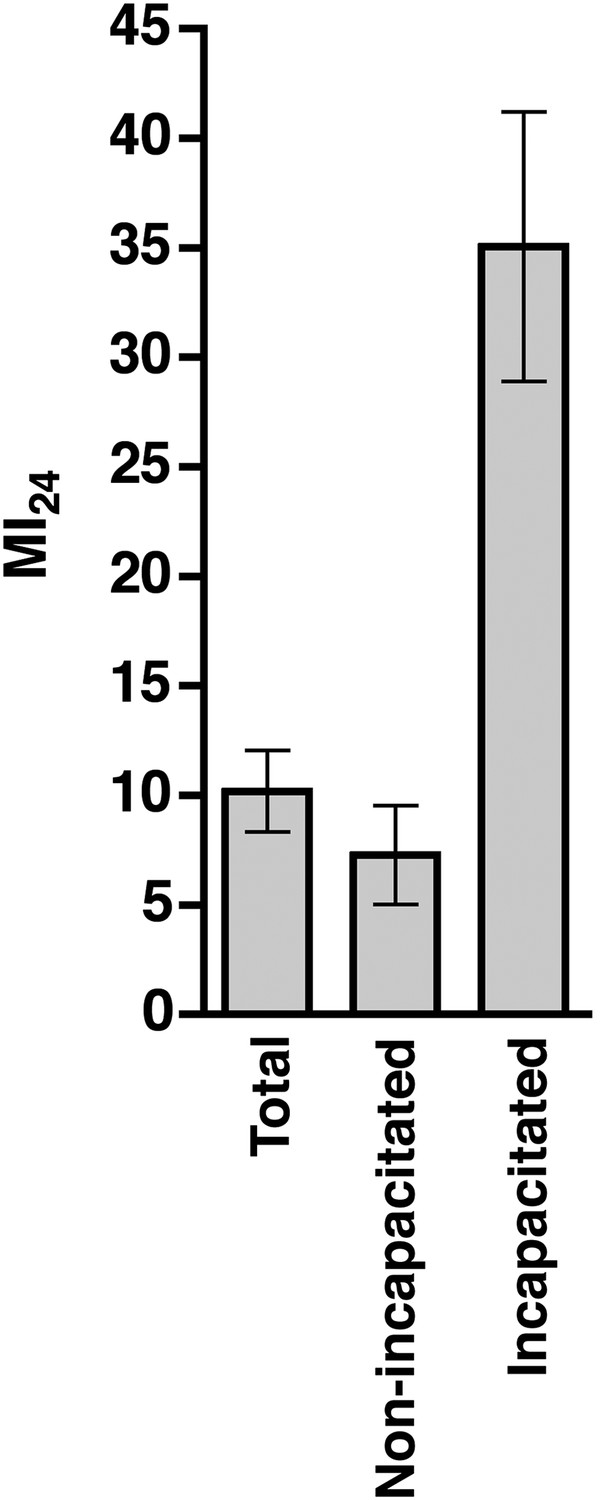
Incapacitated flies had a significantly higher MI24 than non-incapacitated flies (p = 0.007, one-tailed t test).
Average and standard deviation of the MI24 for 599 total flies, of which 535 were non-incapacitated and 64 were incapacitated.
Figure 3

Traumatic injury causes BEB disruption.
(A) A w1118 fly without traumatic injury that was injected with tetramethylrhodamine-dextran molecules. Note the accumulation of fluorescence at the border of the eye (arrow), which reflects an intact BEB. (B) A w1118 fly with traumatic injury that was injected with tetramethylrhodamine-dextran molecules. Note the fluorescence throughout the eye, which reflects BEB permeability. (C) Average and SEM of the percent of HIT device-treated (+) and untreated (−) w1118 flies with a permeable BEB. Traumatic injury (TI) significantly increased the percent of flies with a permeable BEB (p = 0.0017, one-tailed t test). (D) The dye penetration scale from − to ++++ for RAL flies. Arrows indicate the fluorescent pseudopupil. (E) The percent of flies with (+) or without (−) traumatic injury in each scale category for the indicated RAL lines. At least 85 flies were examined for each condition.
Figure 4 with 1 supplement

Traumatic injury causes an increase in the amount of bacteria and glucose in the hemolymph of w1118 flies.
(A) Average and SEM of the number of bacterial colonies per microliter of hemolymph from flies without (−) or with (+) traumatic injury (TI). Flies without traumatic injury had 0.8 ± 0.9 bacterial colonies per microliter of hemolymph. (B) Average and SEM of glucose concentration at times after traumatic injury. A significant increase in glucose concentration occurred between 2 and 8 hr, and a significant decrease in glucose concentration occurred at 24 hr. (C) Average and SEM of glucose concentration in flies fed either molasses food or water for the indicated amount of time after traumatic injury. Molasses food significantly increased the glucose concentration. In contrast, water significantly decreased the glucose concentration. *p < 0.05, **p < 0.01, and ***p < 0.001, one-tailed t test comparison between flies without (−) and with (+) traumatic injury.
Figure 4—figure supplement 1
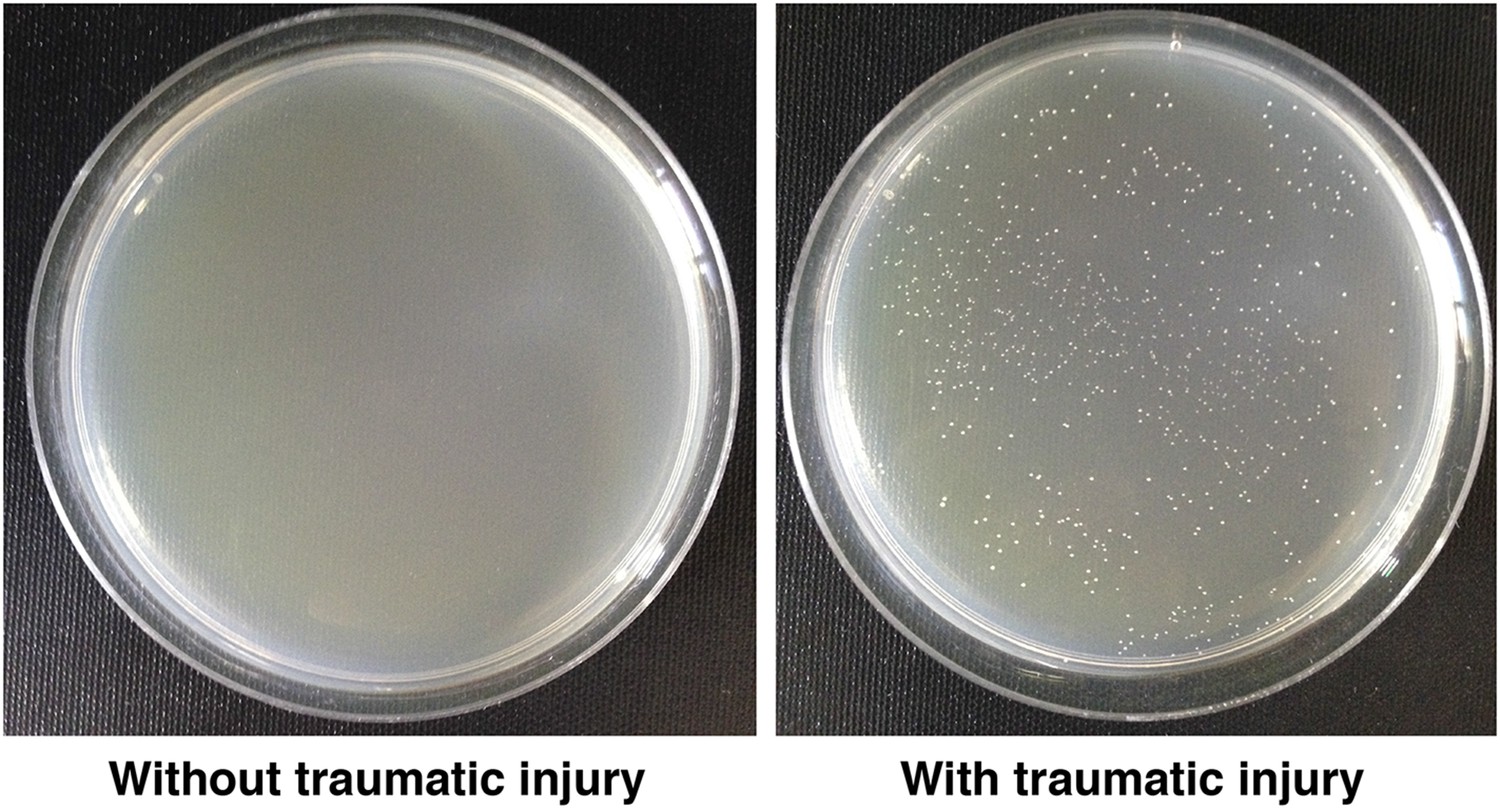
Traumatic injury causes bacteria to leak into the hemolymph.
LB plates spread with hemolymph from w1118 flies not subjected to traumatic injury (left) or subjected to traumatic injury (right).
Figure 5 with 1 supplement
Endogenous bacteria do not affect the probability of death following traumatic injury.
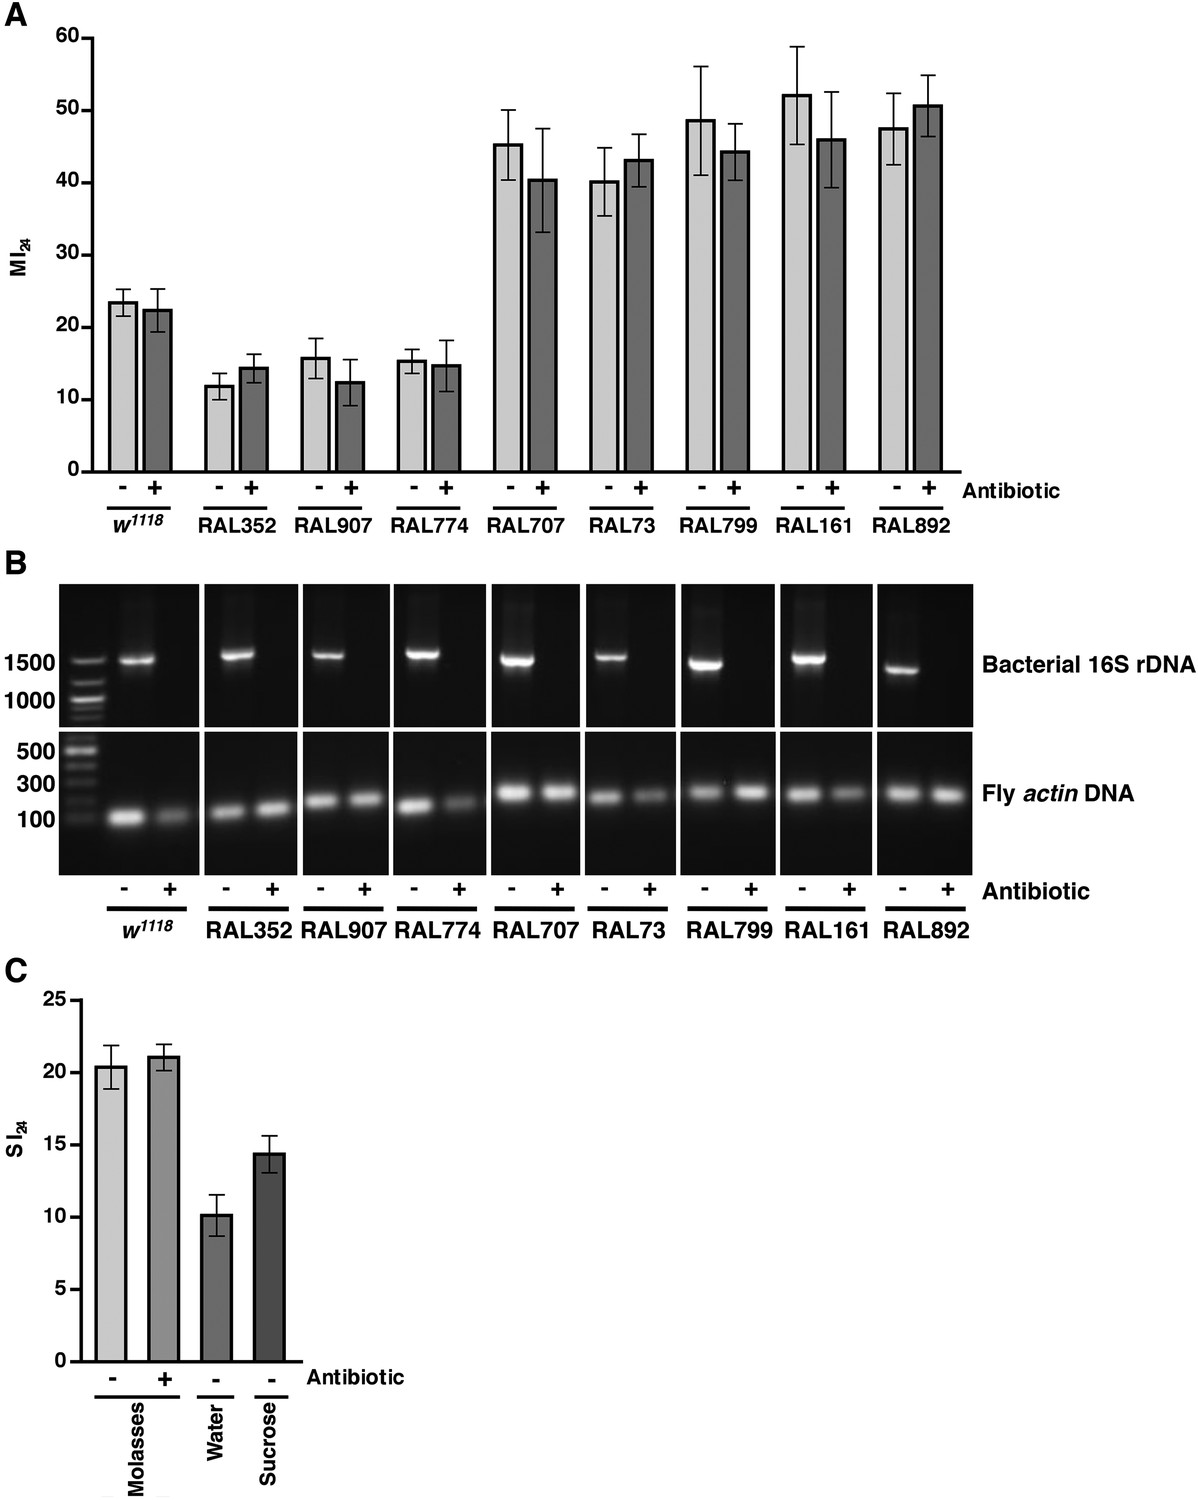
(A) Average and SEM of the MI24 for the indicated fly lines fed for 5 day on molasses food (light gray bars) or on molasses food containing antibiotics (dark gray bars) before being subjected to the standard injury protocol. (B) Levels of bacteria in fly lines shown in panel A, as detected by PCR analysis for bacterial 16S rDNA and fly actin as a loading control. DNA extracted from flies fed (+) or not fed (−) antibiotics was used as a template. Indicated on the left are DNA size markers in basepairs. (C) Average and SEM of the SI24 for w1118 flies with the indicated treatments. Flies fed antibiotics had an SI24 that was not significantly different than flies without antibiotics (p = 0.36, one-tailed t test). Flies fed water after the primary injury had an SI24 that was significantly lower than flies fed molasses food after the primary injury (p < 0.0001, one-tailed t test). Flies fed 1.2 M sucrose after the primary injury had an SI24 that was significantly higher than flies fed water after the primary injury (p = 0.0027, one-tailed t test).
Figure 5—figure supplement 1
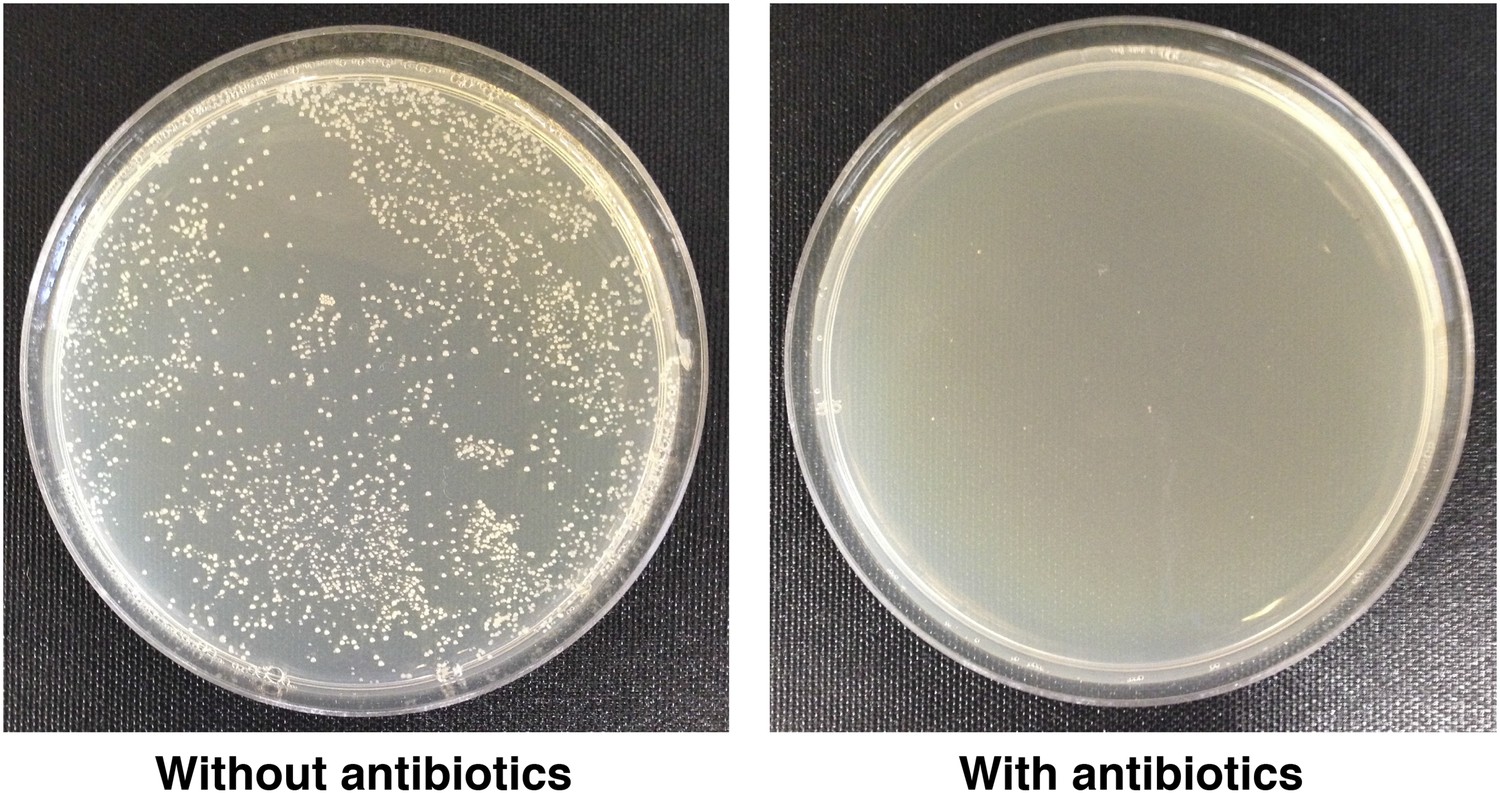
Antibiotic treatment of flies eliminates endogenous bacteria.
LB plates spread with extracts from whole RAL892 flies fed food without antibiotics (left) or with antibiotics (right).
Figure 6 with 4 supplements
Analyses of the role that bacteria play in activation of the innate immune response by traumatic injury and the role that the level of activation of the innate immune response plays in causing death following traumatic injury.
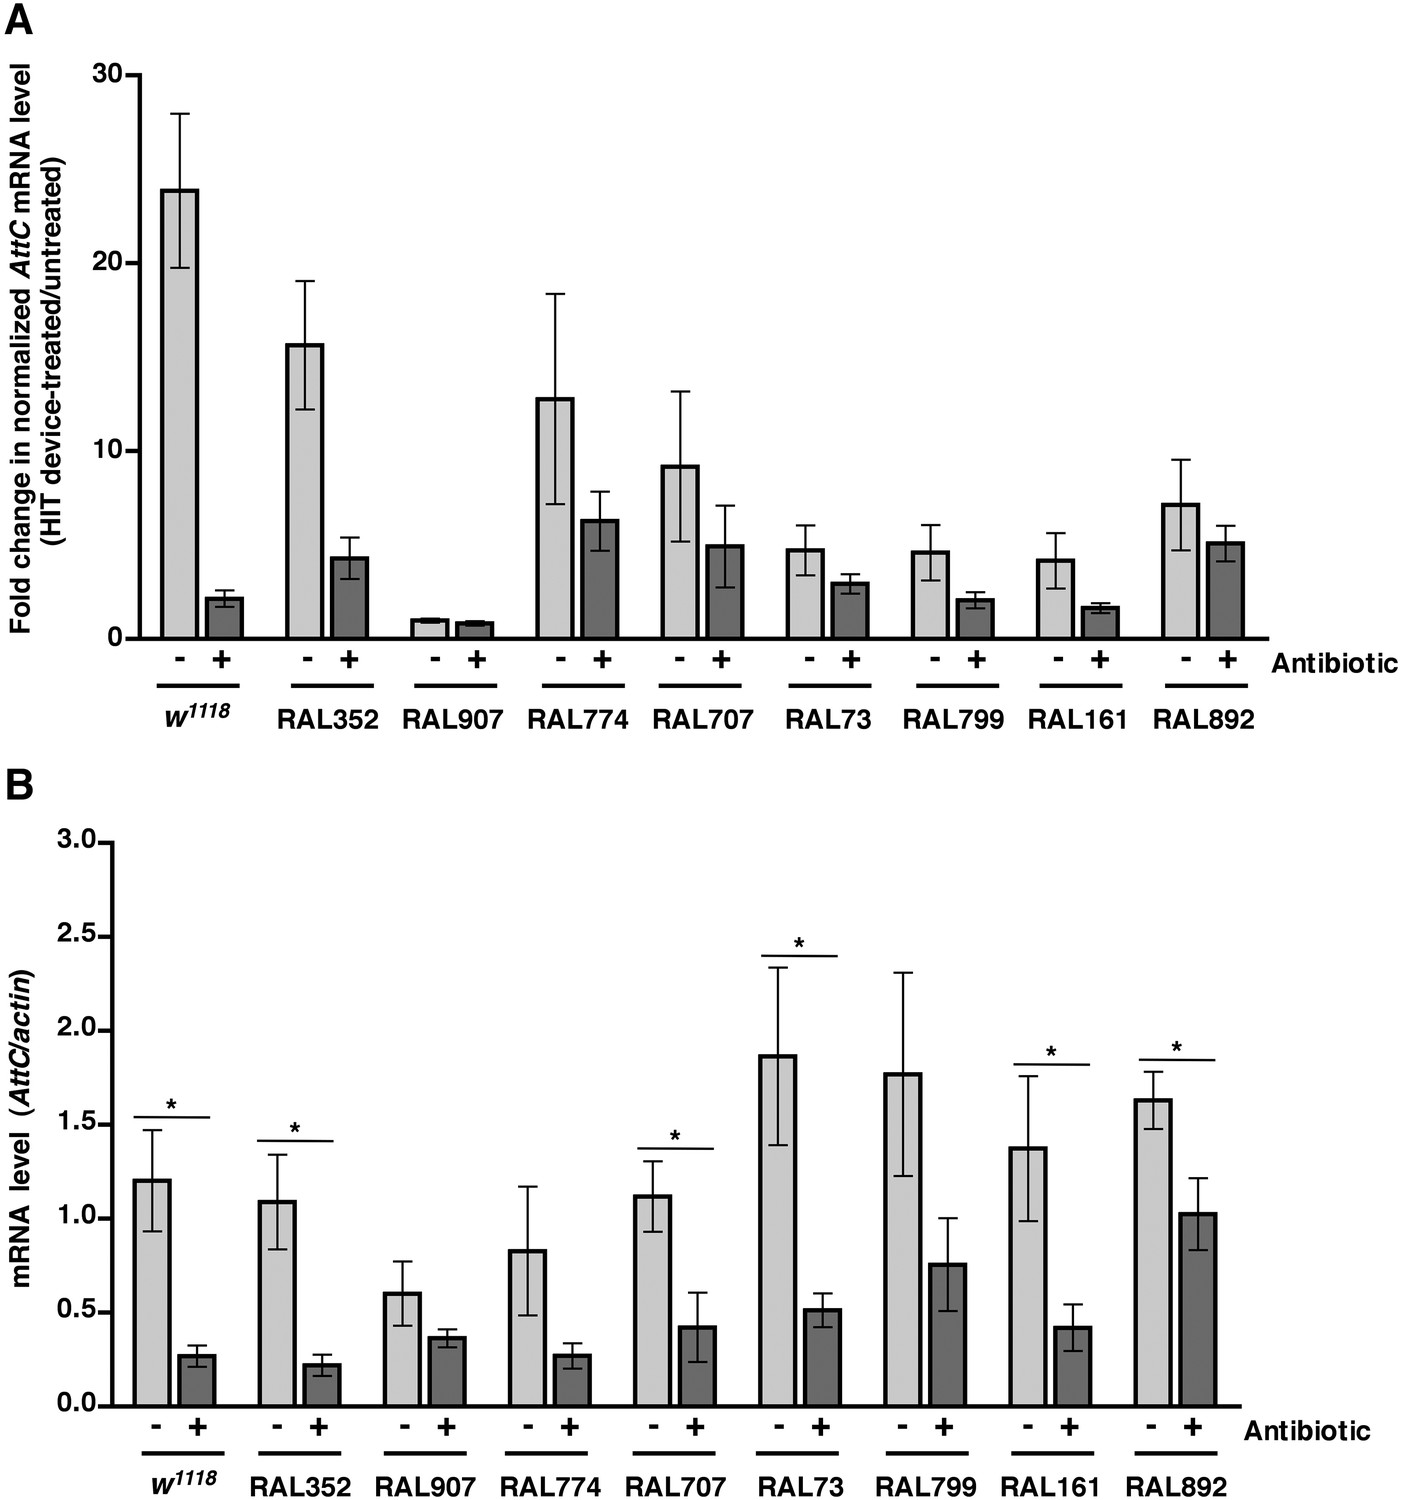
(A) Average and SEM of AttC expression normalized to actin expression in HIT device-treated flies relative to untreated flies. This analysis was performed with flies fed food without antibiotics (light gray bars) or with antibiotics (dark gray bars). Expression levels were determined 2 hr after treatment with the standard injury protocol. Analogous data are shown for DiptB and Mtk in Figure 6—figure supplements 1, 3, respectively. (B) Average and SEM of AttC expression normalized to actin expression in antibiotic-fed flies (dark gray bars) and flies without antibiotics (light gray bars) 2 hr after treatment with the standard injury protocol. Analogous data are shown for DiptB and Mtk in Figure 6—figure supplements 2, 4, respectively. *p < 0.05, one-tailed t test.
Figure 6—figure supplement 1
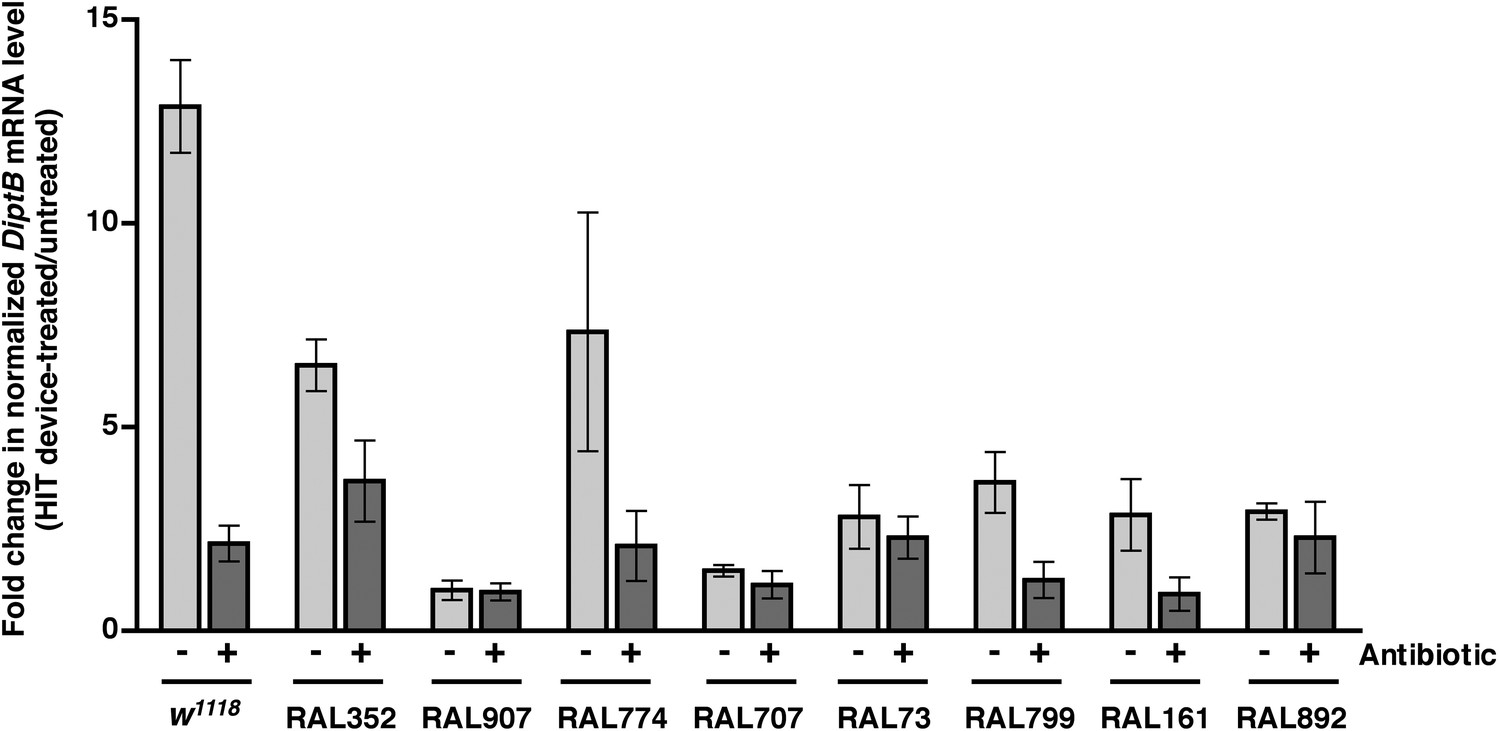
Level of DiptB expression normalized to actin expression in HIT device-treated flies relative to untreated flies for flies without antibiotics (light gray bars) and antibiotic-fed flies (dark gray bars).
Expression levels were determined 2 hr after treatment with the standard injury protocol. Average and SEM of at least three independent experiments.
Figure 6—figure supplement 2
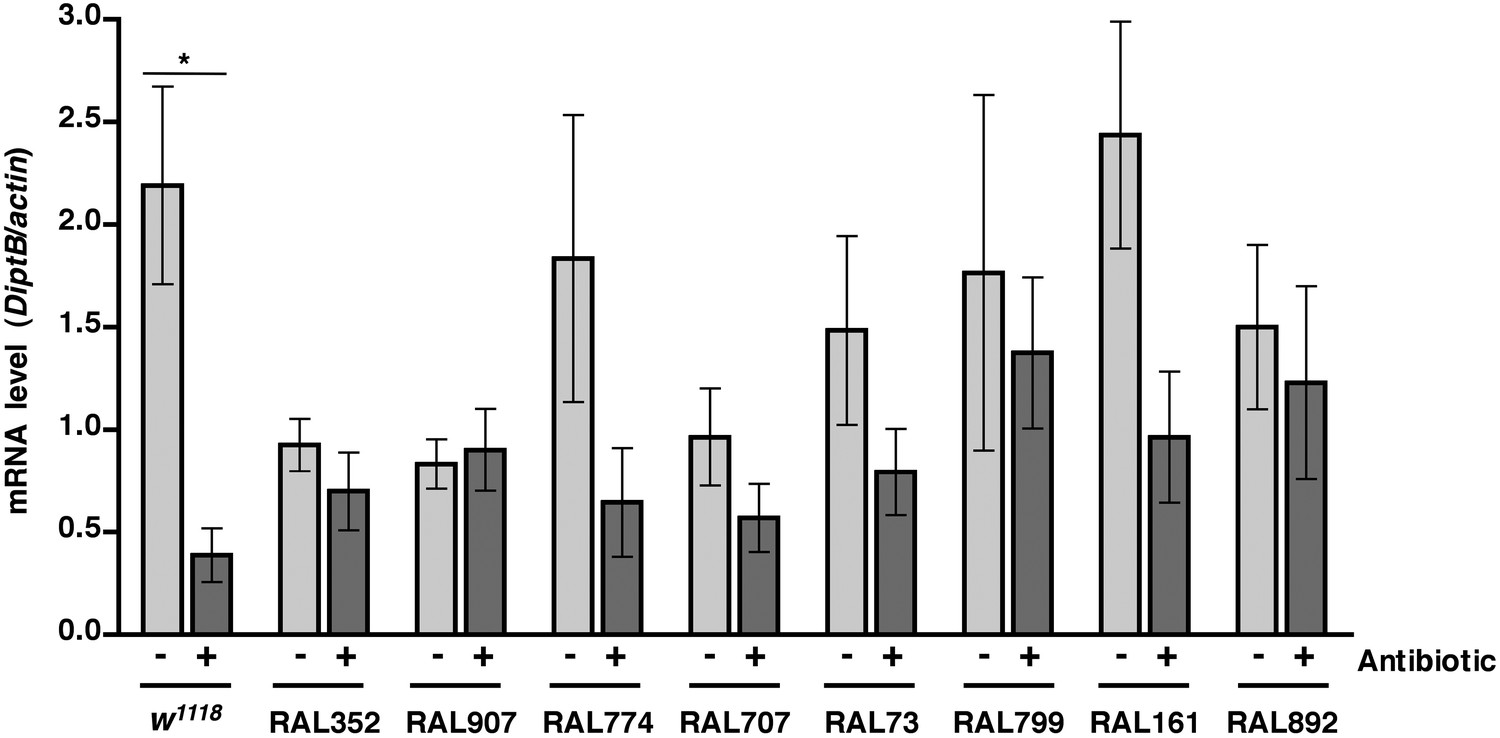
Level of DiptB expression normalized to actin expression 2 hr after treatment with the standard injury protocol in flies without antibiotics (light gray bars) antibiotic-fed flies (dark gray bars).
Average and SEM of at least three independent experiments. *p < 0.05, one-tailed t test.
Figure 6—figure supplement 3

Level of Mtk expression normalized to actin expression in HIT device-treated flies relative to untreated flies for flies without antibiotics (light gray bars) and antibiotic-fed flies (dark gray bars).
Expression levels were determined 2 hr after treatment with the standard injury protocol. Average and SEM of at least three independent experiments.
Figure 6—figure supplement 4
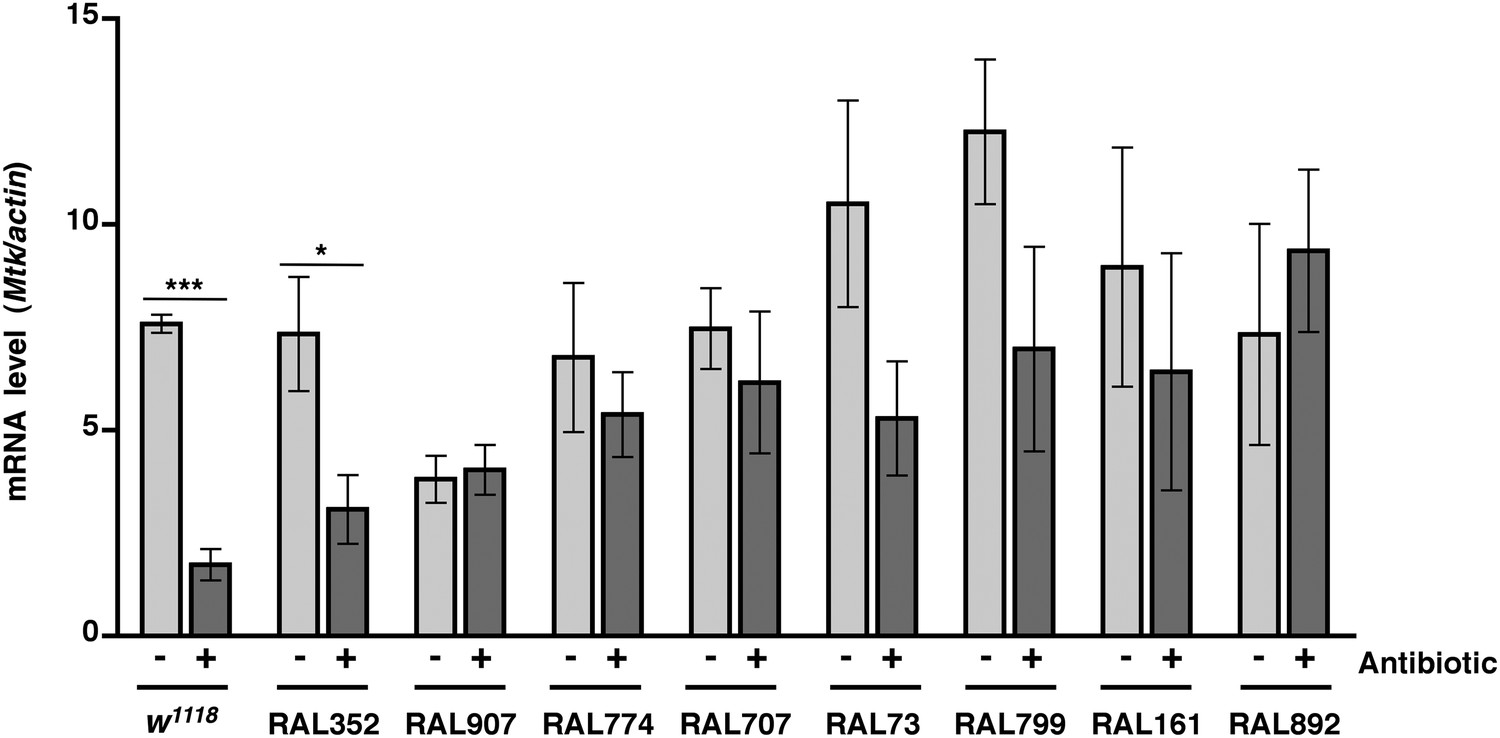
Level of Mtk expression normalized to actin expression 2 hr after treatment with the standard injury protocol in flies without antibiotics (light gray bars) and antibiotic-fed flies (dark gray bars).
Average and SEM of at least three independent experiments. *p < 0.05, ***p < 0.001, one-tailed t test.
Figure 7
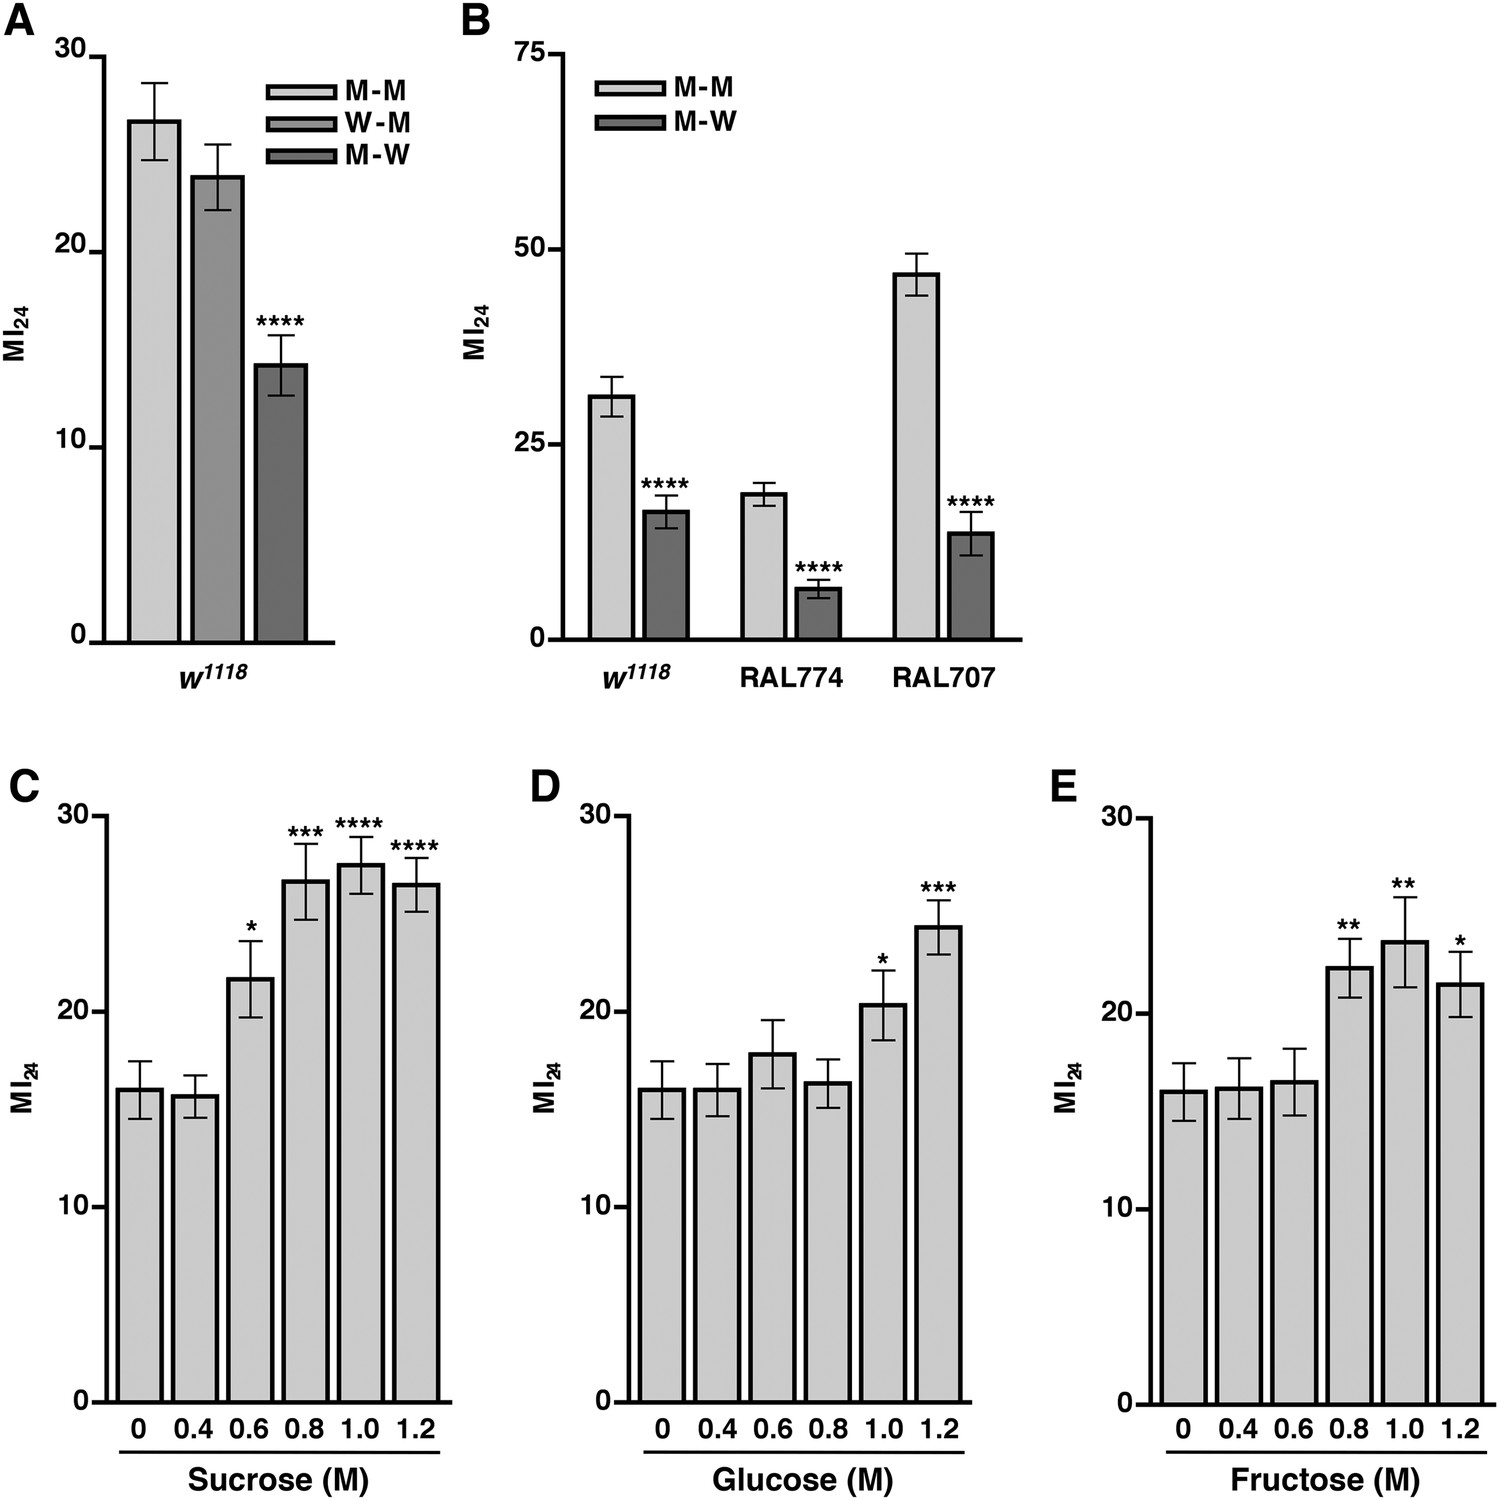
Food ingested after the primary injury affects the MI24.
(A) Average and SEM of the MI24 for flies fed water (W) or molasses food (M) for 24 hr before or after the primary injury, for example, W–M means water for 24 hr before the primary injury and molasses food for 24 hr after the primary injury. (B) Average and SEM of the MI24 for flies of the indicated genotype and food treatments. (C–D) Average and SEM of the MI24 for flies fed the indicated molar (M) concentrations of (C) sucrose, (D) glucose, and (E) fructose for 24 hr after the primary injury. *p < 0.05, **p < 0.01, ***p < 0.001, ****p < 0.0001, one-tailed t test.
Figure 8

In general, FOXO target gene expression is not affected in response to traumatic injury.
mRNA expression level of the indicated genes normalized to actin expression in non-Smurfed (light gray bars) and Smurfed (dark gray bars) flies 2 hr after the standard injury protocol. (A) w1118 flies cultured on molasses food after the primary injury, (B) RAL774 flies cultured on molasses food after the primary injury, (C) RAL892 flies cultured on molasses food after the primary injury, and (D) w1118 flies cultured on 1.2 M sucrose after the primary injury. InR, Lip4, Impl2, and Thor are FOXO target genes, and TAF1 is not a FOXO target gene. *p < 0.05, **p < 0.01, one-tailed t test.
Figure 9
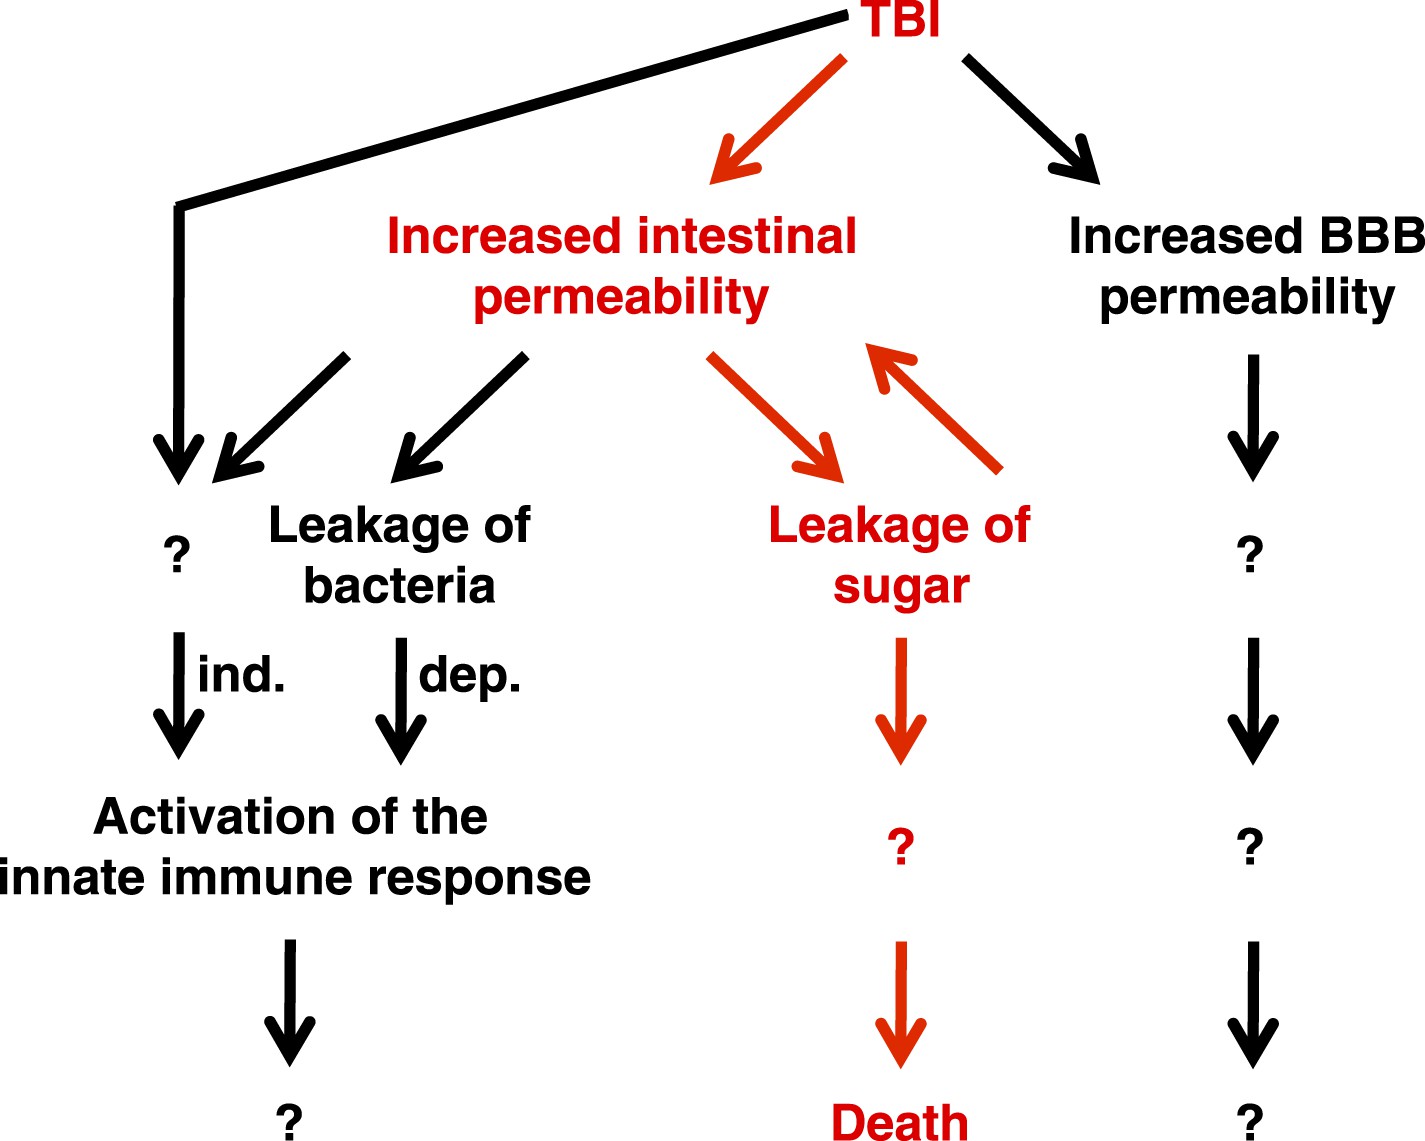
Genetic, cellular, and molecular data presented in this study suggest a model for the pathway of events following TBI.
Intestinal barrier dysfunction may play an important role in promoting death following TBI (indicated in red). TBI induces additional physiological changes (indicated in black) that do not cause death but may contribute to other outcomes such as neurodegeneration. Bacteria-independent and bacteria-dependent pathways that activate the innate immune response are indicated by ‘ind.’ and ‘dep.’, respectively.
Additional files
-
Supplementary file 1
MI24 values for RAL lines (listed by increasing MI24).
- https://doi.org/10.7554/eLife.04790.020
-
Supplementary file 2
MI24 of African lines (listed by increasing MI24).
- https://doi.org/10.7554/eLife.04790.021
-
Supplementary file 3
SNPs associated with the MI24 (listed alphabetically based on gene symbol).
- https://doi.org/10.7554/eLife.04790.022
-
Supplementary file 4
The occurrence of selected SNPs in RAL lines examined in the figures.
- https://doi.org/10.7554/eLife.04790.023
-
Supplementary file 5
Primers for PCR.
- https://doi.org/10.7554/eLife.04790.024
Download links
A two-part list of links to download the article, or parts of the article, in various formats.
Downloads (link to download the article as PDF)
Open citations (links to open the citations from this article in various online reference manager services)
Cite this article (links to download the citations from this article in formats compatible with various reference manager tools)
Death following traumatic brain injury in Drosophila is associated with intestinal barrier dysfunction
eLife 4:e04790.
https://doi.org/10.7554/eLife.04790


