G-actin provides substrate-specificity to eukaryotic initiation factor 2α holophosphatases
- University of Cambridge, United Kingdom
Figures
Figure 1 with 2 supplements
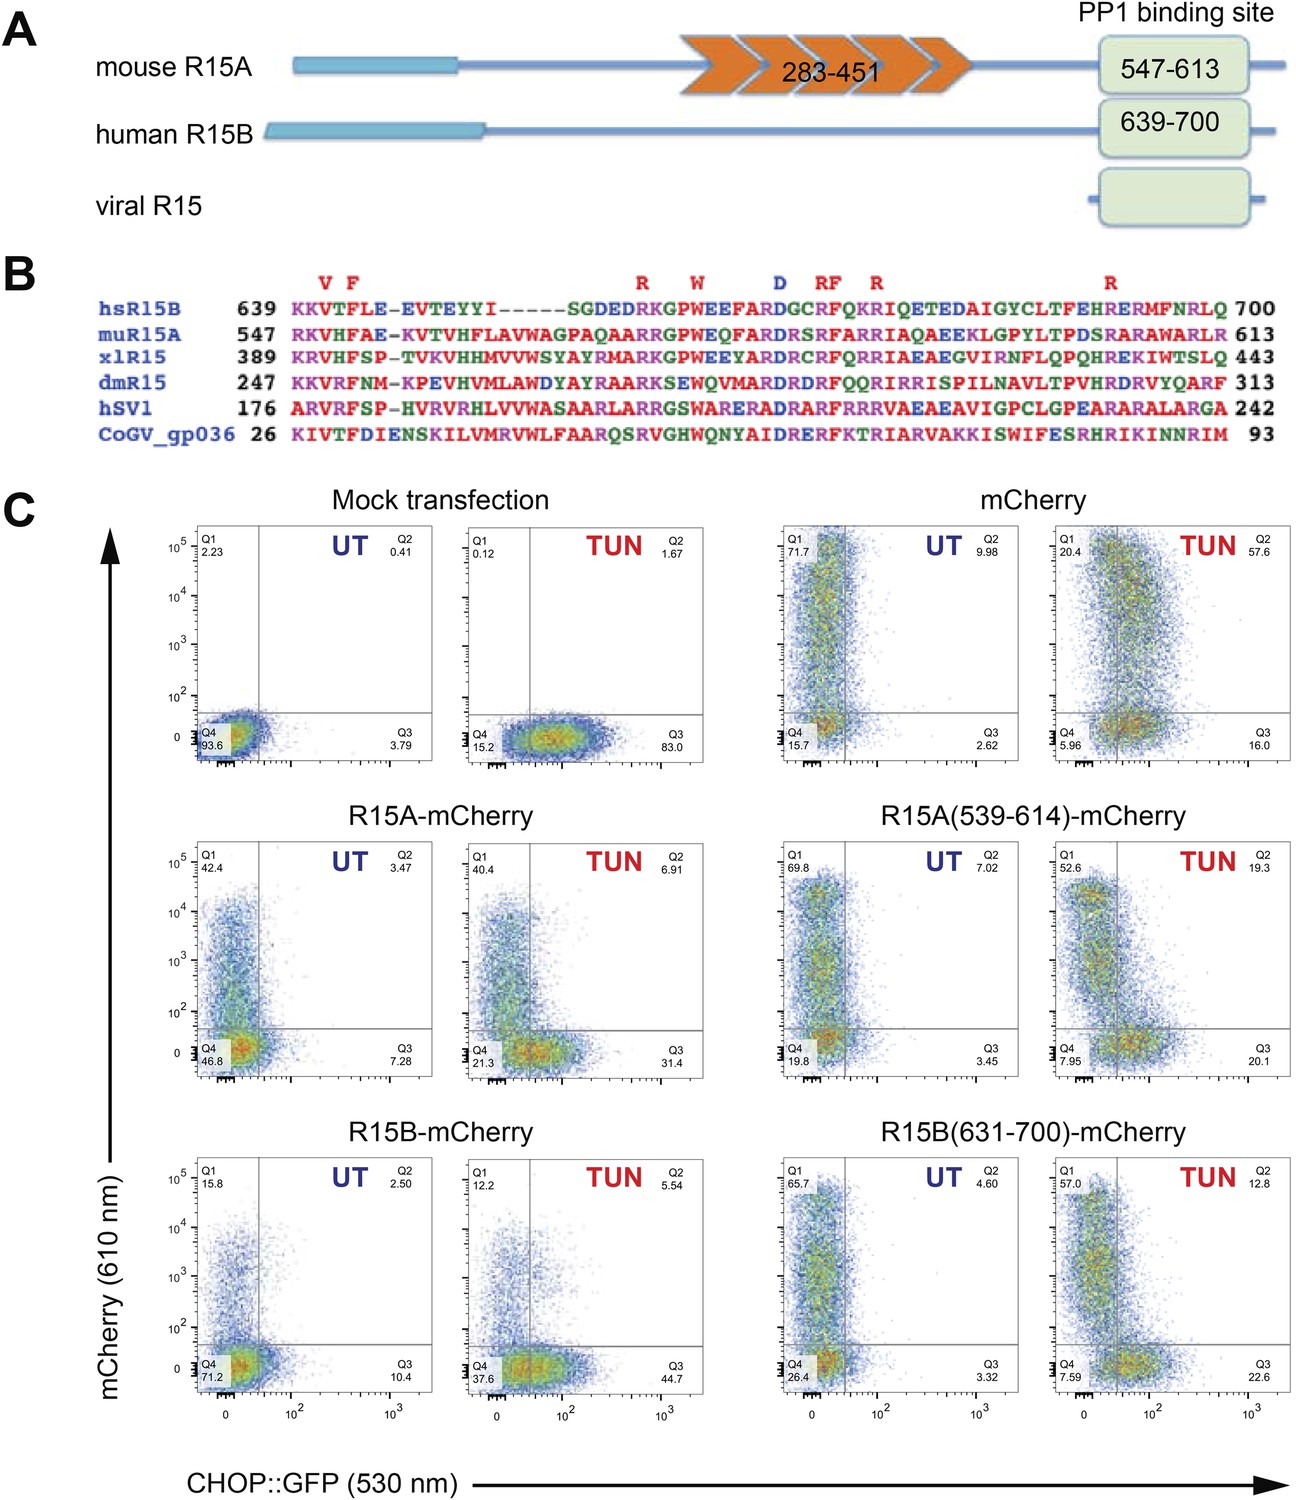
A core functional domain in the C-terminus of PPP1R15 family members inhibits the integrated stress response (ISR).
(A) Cartoon depicting the domain organization of mammalian and viral PPP1R15 proteins. The N-terminal membrane-interaction domain is depicted by a broad line, the repeats, found in the PPP1R15A/GADD34 isoform, are shown in orange and the C-terminal, conserved functional domain that binds the catalytic subunit (PP1) is shown in green. (B) Alignment of the conserved 70 residue portion of representative PPP1R15 family members: human PPP1R15B/CReP (hsR15B; UNIPROT: Q5SWA1), mouse PPP1R15A/GADD34 (muR15A; UNIPROT: P17564), frog PPP1R15 (xlR15; UNIPROT: Q9W1E4), fruit-fly PPP1R15 (dmR15; UNIPROT: Q9W1E4), human herpes simplex virus PPP1R15 (HSV1; UNIPROT: P36313), insect virus PPP1R15 (coGV-gp036; UNIPROT: Q1A4R0). Residues conserved in members of the PPP1R15 family across phyla are noted above the alignment. (C) Two-dimensional plots of fluorescent intensity of individual CHO cells containing a stably-integrated ISR reporter, CHOP::GFP (Novoa et al., 2001), following transfection with plasmids encoding mCherry and fusions of PPP1R15 with mCherry. Where indicated the cells were exposed to the ER stress-inducing toxin tunicamycin (TUN). GFP fluorescent intensity, reporting on the activity of the UPR (X-axis) was detected at 530 nm following excitation at 488 nm, whereas mCherry fluorescent intensity, reporting on the level of PPP1R15-mCherry fusion proteins (Y-axis) was detected at 610 nm following excitation at 561 nm. Suppression of the ISR by PPP1R15 is reflected by the accumulation of CHOP::GFPweak/mCherrystrong cells in quadrant 1 (Q1) and is conspicuous in cells transduced with either the full-length PPP1R15 expression vectors (R15A-mCherry and R15B-mCherry) or their C-terminal core functional fragments [R15A(539–614)-mCherry and R15B(631–700)-mCherry].
Figure 1—figure supplement 1
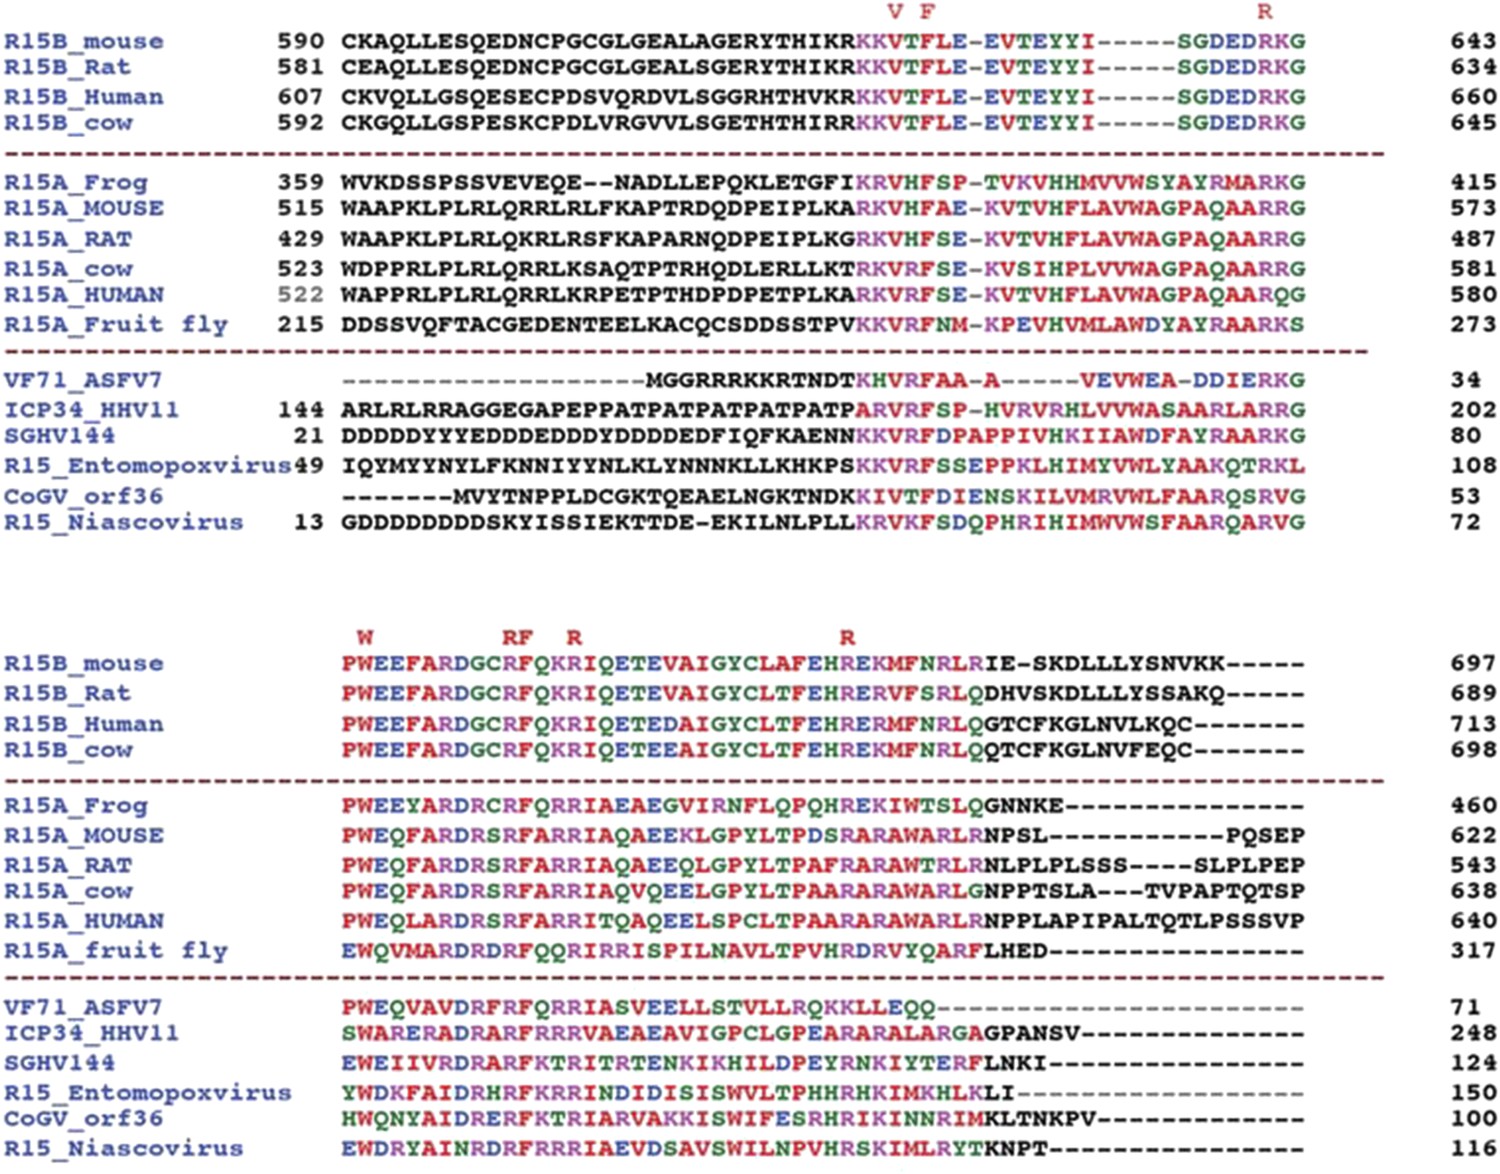
An extended alignment of PPP1R15 regulatory subunit family members reveals that the conservation of amino acid sequence is confined to a ∼70 residue segment.
Alignment of C-terminal sequences of PPP1R15B from mouse (Q8BFW3), rat (D3ZP67), human (Q5SWA1) and cow (E1BKX2), PPP1R15A from frog (Q9W1E4), mouse (P17564), rat (Q6IN02), cow (Q2KI51), human (O75807), fruit-fly (Q9W1E4) and their hypothetical viral analogues from African swine fever virus (VF71_ASFV7, Q65212), human herpes simplex virus 1 (ICP34_HHV11, P36313), Amsacta moorei entomopoxvirus (NP_064975), Glossina pallidipes salivary gland hypertrophy virus (SGHV144, YP_001687092), Choristoneura occidentalis granulovirus (CoGV_orf36, YP_654457) and Trichoplusia niascovirus 2c (YP_803309).
Figure 1—figure supplement 2
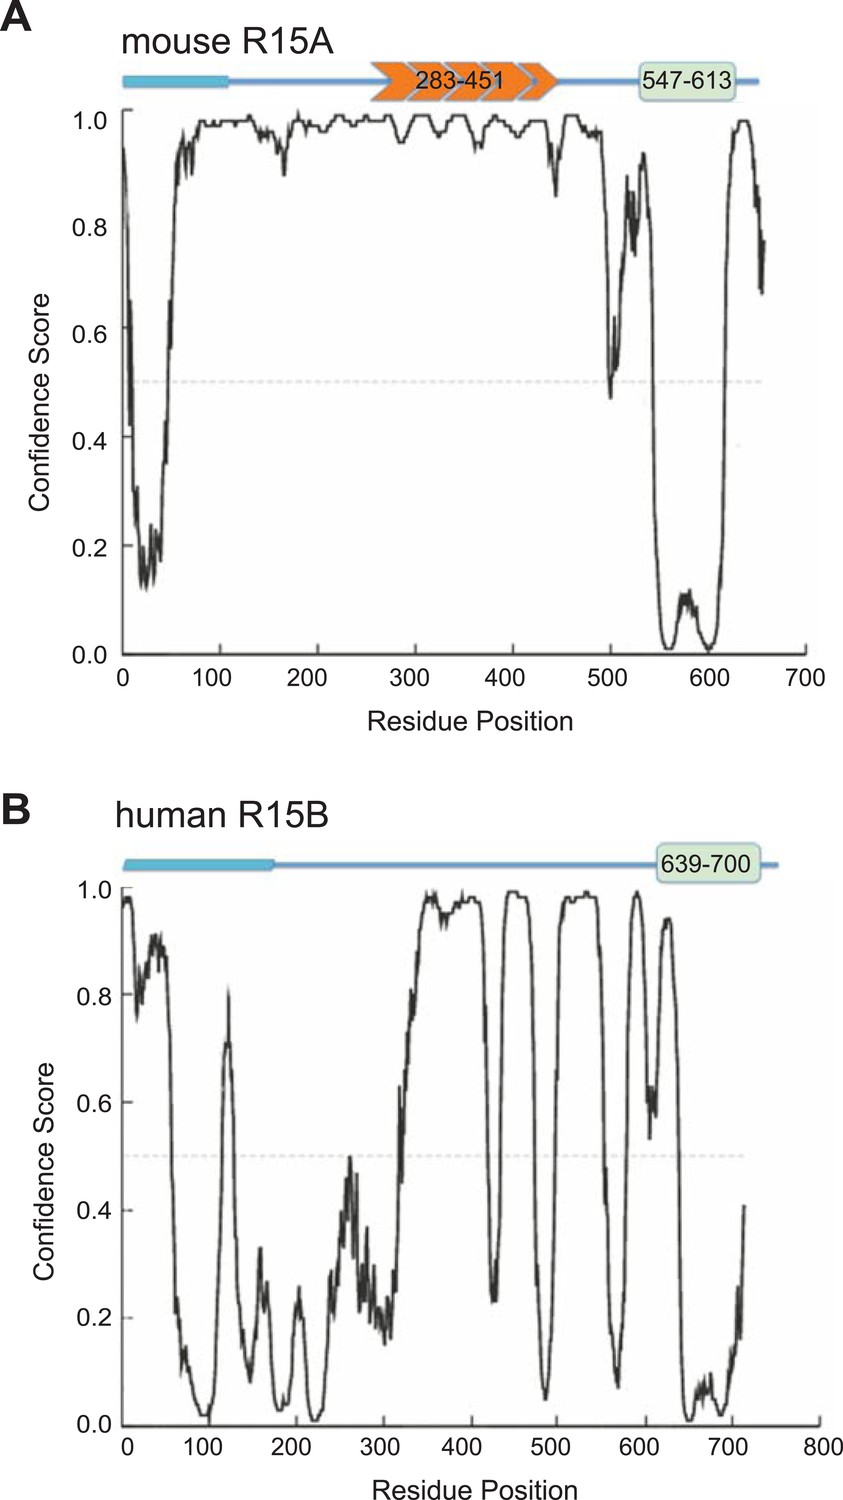
Disordered and ordered regions predicted in PPP1R15 regulatory subunits.
Disorder prediction (based on DISOPRED [Ward et al., 2004]) along the primary sequence of mouse PPP1R15A (UNIPROT P17564, ‘A’) and human PPP1R15B (UNIPROT Q5SWA1, ‘B’), superimposed on a schema of their functional domains (from Figure 1). Note that the conserved potentially ordered region is confined to the C-terminal 70 residues implicated functionally in eIF2a dephosphorylation.
Figure 2 with 1 supplement
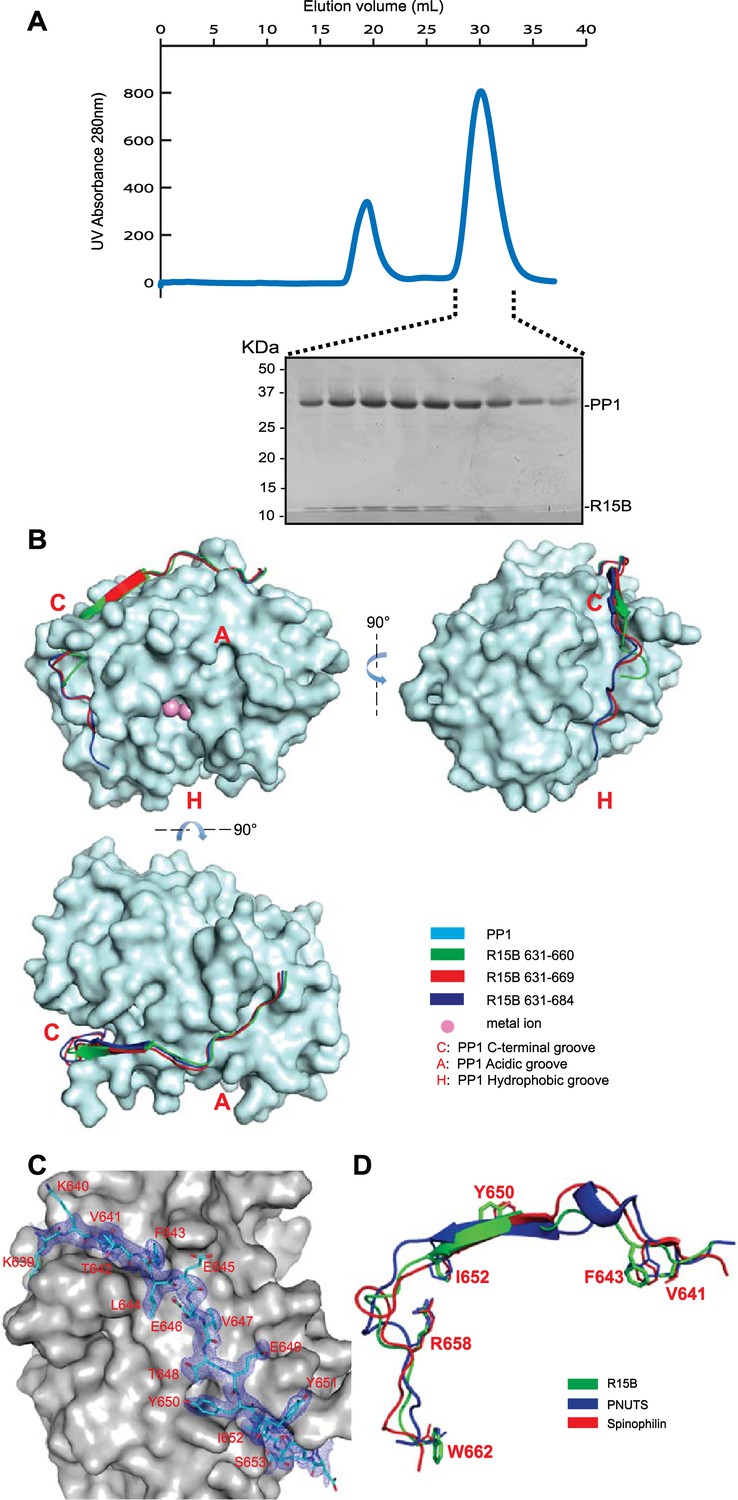
PPP1R15 engages the PP1 catalytic subunit through multiple contacts.
(A) UV protein absorbance trace of a PPP1R15B(630–701)-PP1G(7–300) binary complex expressed in bacteria and resolved by size-exclusion chromatography. The indicated fractions from the chromatogram are presented in the Coomassie-stained SDS-PAGE below. The position of PP1 and the PPP1R15 peptide is indicated. (B) Cartoon representation of the indicated segments of human PPP1R15B (in colored ribbon diagram) in complex with mouse PP1G (in cyan surface representation) shown from three perspectives. The position of the hydrophobic (H), C-terminal (C) and acidic (A) groves of PP1 are provided for orientation and the metal ions at the enzymes active site are colored pink. (C) Cartoon representation of PPP1R15B residues K639 to R653 in stick diagram and the corresponding density map, contoured to 1 rmsd. The backside of PP1G is shown in grey surface presentation. (D) Structure of the PP1-binding portion of PPP1R15B from the complex shown in ‘B’ aligned to the PP1-binding portions of the regulatory subunits PNUTS (PDB: 4MP0) and spinophilin (PDB: 3EGG). Side-chains of PPP1R15B residues that make important contacts with PP1G and their counterparts in PNUTS and spinophilin are shown in stick diagram.
Figure 2—figure supplement 1
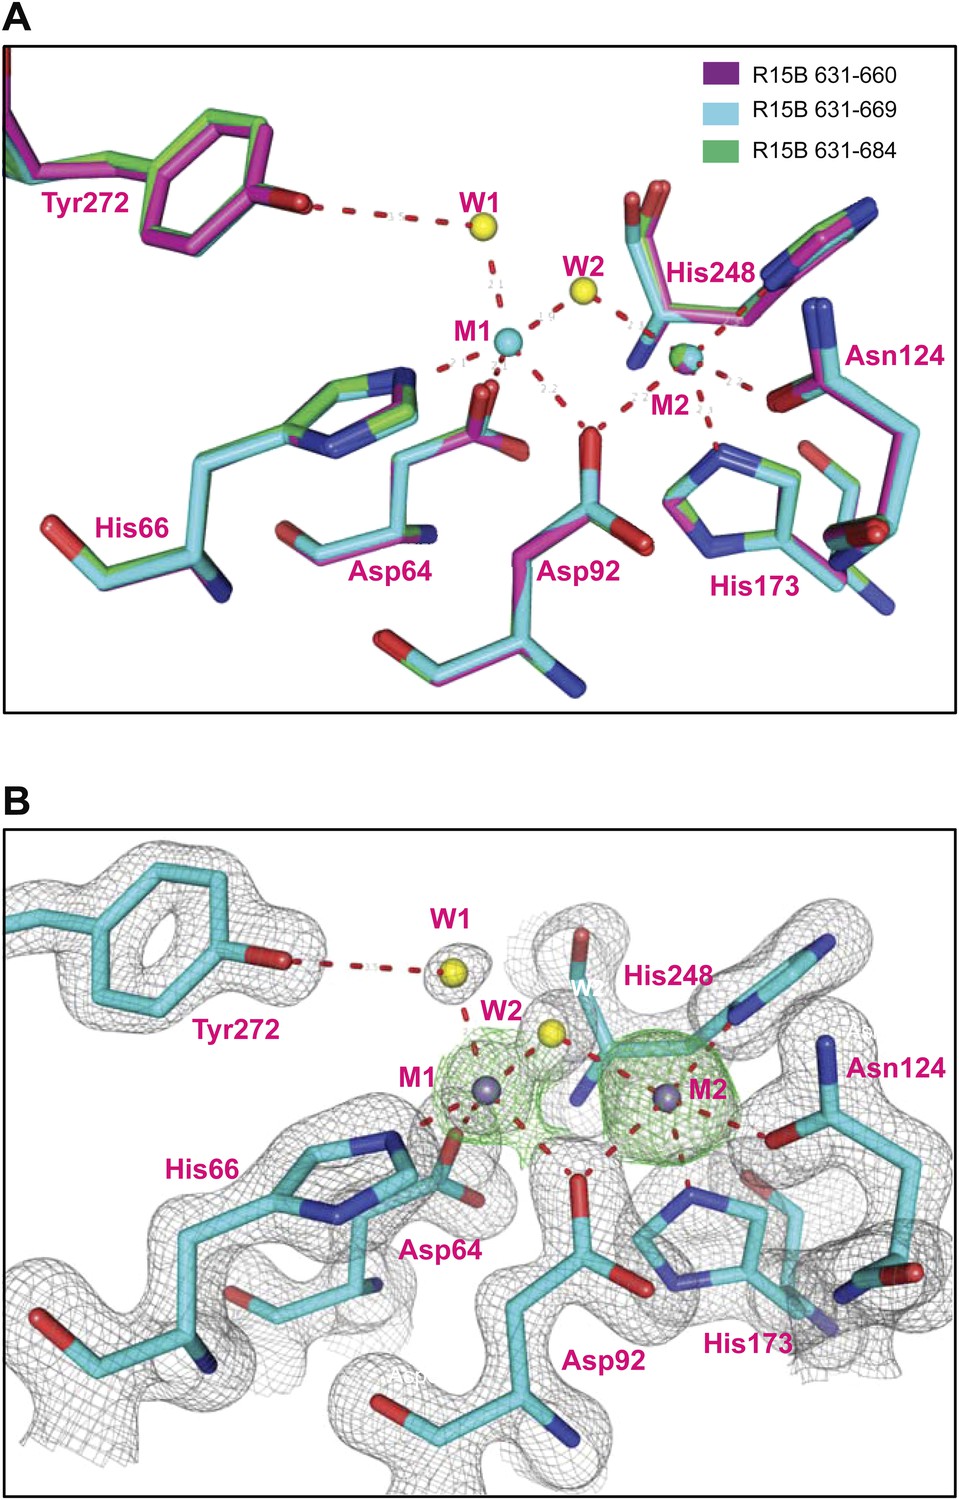
Variable occupancy of the M1 metal binding site in the PP1G-PPP1R15B binary complexes.
(A) Detail of the PP1G active site in the binary complexes constituted with different PPP1R15B chain lengths: 631–660 (magenta), 631–669 (cyan), 631–684 (green). Note an identically-positioned metal atom in the M2 position of all three structures but occupancy of the M1 site that is observed only in the crystal forms derived from the 631–669 construct. (B) Grey contours show the final 2nFo-DFc electron density and green contours show the SAD log-likelihood gradient map (McCoy and Read, 2010) that detects anomalous scatterers, for the PP1G-PPP1R15B (631–669) crystal form in which both metal sites are occupied.
Figure 3 with 2 supplements
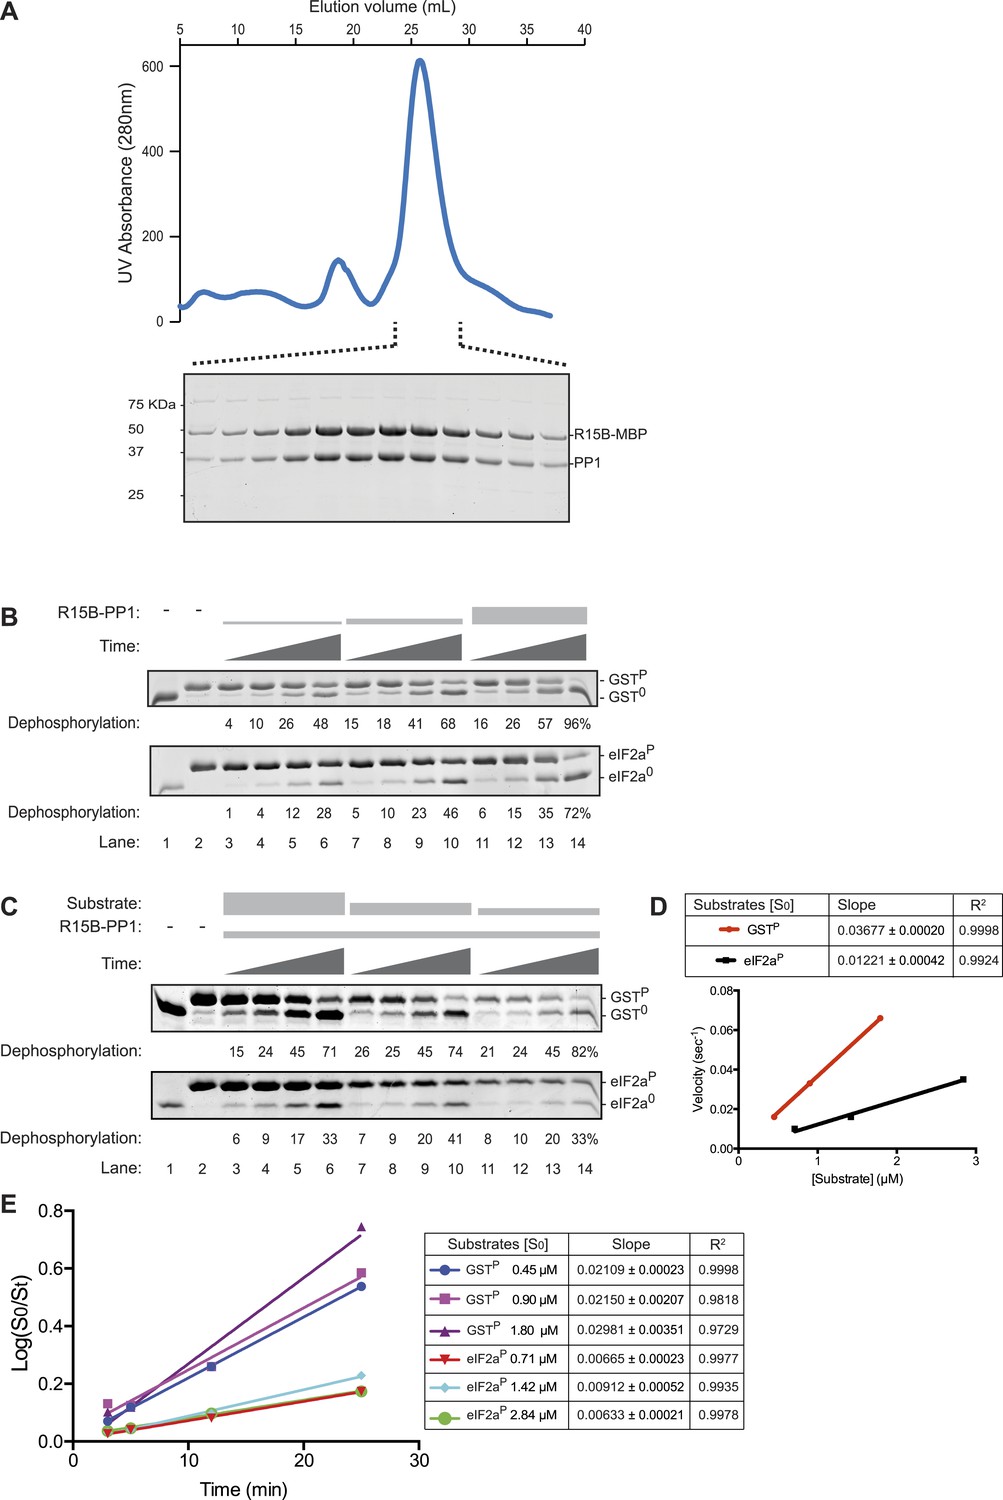
The PPP1R15B-PP1 binary complex lacks substrate specificity.
(A) UV protein absorbance trace of a PPP1R15B-PP1G complex co-expressed in bacteria as a GST-PPP1R15B(631–701)-MBP fusion protein alongside untagged PP1G(7–300), purified by glutathione affinity chromatography and, after cleavage of the GST tag, resolved by size-exclusion chromatography. The indicated fractions from the chromatogram are presented in the Coomassie-stained SDS-PAGE below. The position of PP1G and the PPP1R15B peptide (PPP1R15B-MBP, a fusion with E. coli maltose binding protein, MBP, that maintains its stability) are indicated. (B) Images of Coomassie-stained Phos-Tag SDS-PAGE in which the non specific substrate and product (GSTP and GST0, upper panel) and the specific substrate and product (eIF2aP and eIF2a0, lower panel) have been resolved. Escalating concentrations of the binary complex (the enzyme) shown in ‘A’ (ranging from ∼6.5 nM to 25 nM) have been applied identically to the two substrates (GSTP at 1.7 µM and eIF2aP at 2.8 µM) for 3, 5, 12, or 25 min. The fraction of the substrate dephosphorylated is indicated under each experimental point. The phosphorylated and unphosphorylated substrates were loaded onto lanes 1 and 2 to serve as a reference for their mobility in the absence of enzyme. Shown is a representative experiment reproduced 4 times. (C) As in ‘B’. Dephosphorylation reactions were conducted with a fixed concentration of the binary complex shown in ‘A’ [PPP1R15B-MBP and PP1G, at 26 nM] and varying concentration of substrate over a time frame of 3, 5, 12, and 25 min. (D) Plot of the initial velocity of the reaction (calculated at the 5 min time point, when excess substrate remains) as a function of substrate concentration derived from the data shown in ‘C’. Note that across a concentration range of substrate over which both reaction velocities are substrate-dependent, the binary complex is more effective at dephosphorylating the non-specific substrate, GSTP, than the specific substrate, eIF2aP. Shown is a representative experiment reproduced twice. (E) Plot of the logarithm of the time-dependent change in ratio of substrate concentration at t = 0 to the substrate concentration at t [log(S0/St)] from the six dephosphorylation time courses experiments shown in ‘C’. The slope (mean ± SD), indicative of the relative enzyme velocity, and the linear regression coefficient of the different reactions initiated at the indicated substrate concentration [S0] are noted.
Figure 3—figure supplement 1
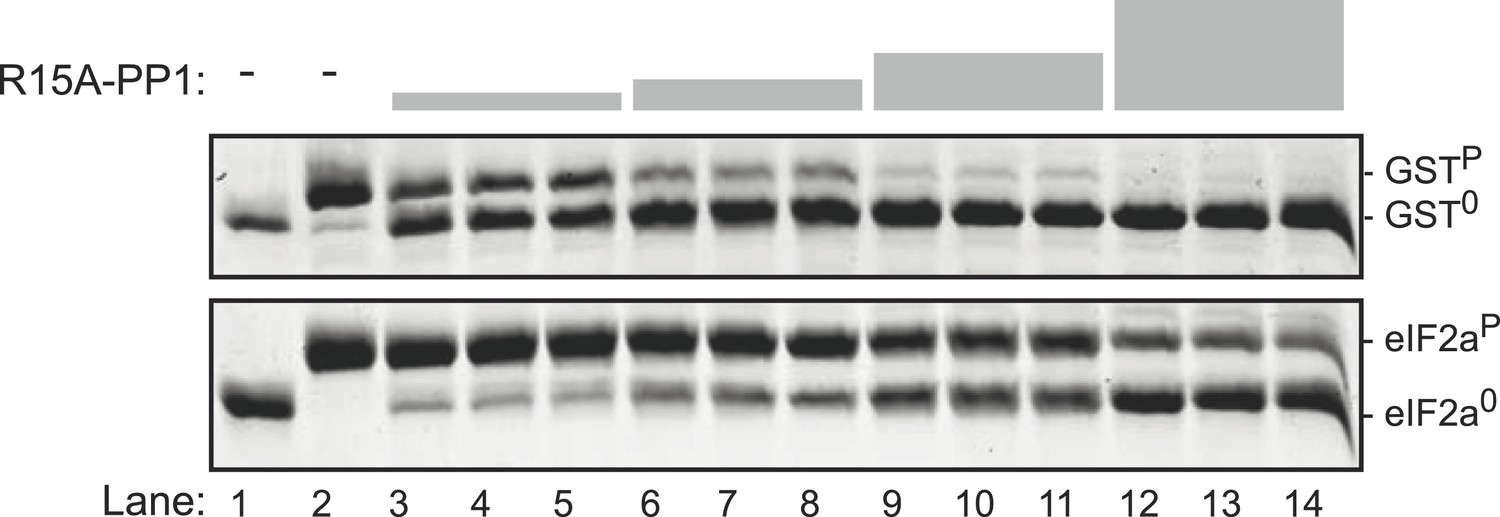
The PPP1R15A-PP1 binary complex also lacks selectivity towards the specific (eIF2aP) substrate over the non-specific (GSTP) substrate.
Images of Coomassie-stained Phos-Tag SDS-PAGE in which phosphorylated and de-phosphorylated non-specific substrate and product (GSTP and GST0, upper panel) and the specific substrate and product (eIF2aP and eIF20, lower panel) have been resolved. Escalating concentrations of the PPP1R15A(539–614)-PP1G(7–300) (ranging from 7 nM to 60 nM) have been applied in triplicate, identically to the two substrates (at 2.7 µM) for 30 min. Note that exposure to enzyme that results in nearly complete dephosphorylation of the non-specific substrate (GSTP) leave much of the specific substrate (eIF2aP) in its phosphorylated state. The phosphorylated and unphosphorylated substrates were loaded onto lanes 1 and 2 to serve as a reference for their mobility in the absence of enzyme.
Figure 3—figure supplement 2
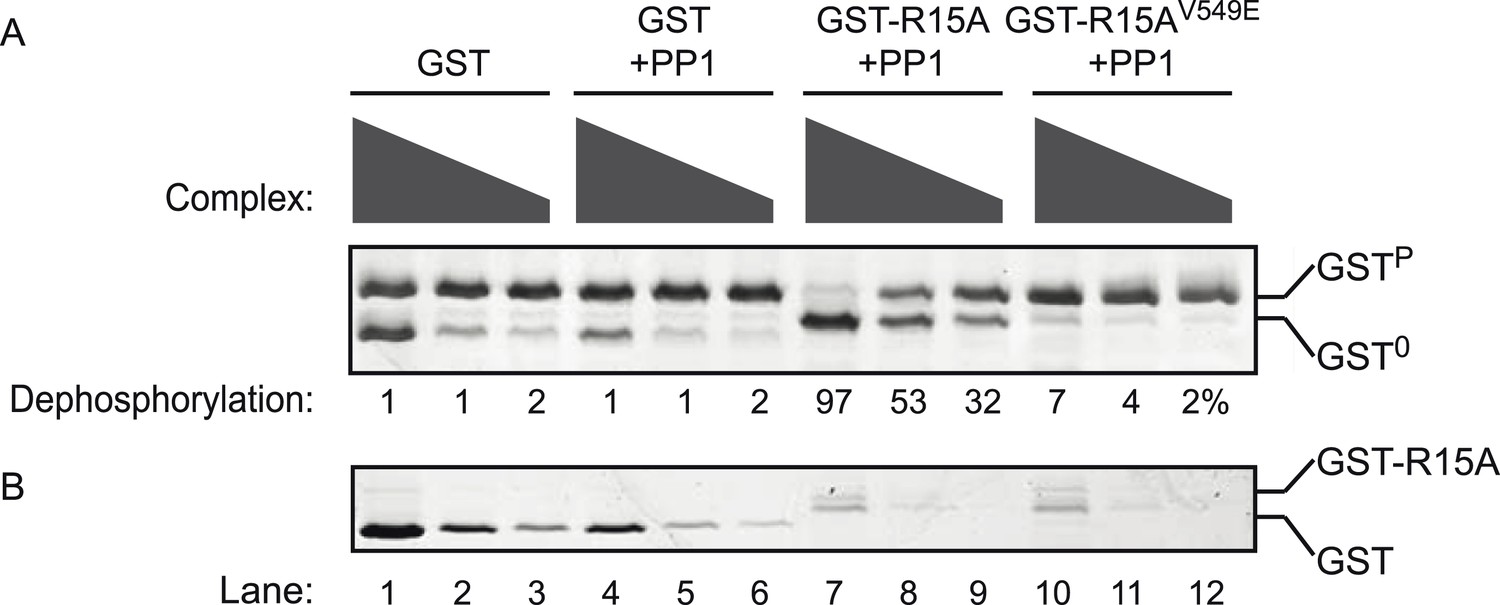
Phosphatase activity of the purified bacterially-expressed complexes is dependent on the presence of both the regulatory (PPP1R15A) and catalytic (PP1G) subunits.
(A) Image of Coomassie-stained Phos-Tag SDS-PAGE in which phosphorylated (GSTP) and non-phosphorylated (GST0) GST have been resolved. Escalating concentrations of the indicated complexes purified from bacteria by glutathione affinity chromatography were applied to the substrate (GSTP, ∼2 µM) for 20 min. The complex used in lanes 1–3 was purified from E. coli expressing GST alone (no catalytic subunit) (and applied at concentrations of 0.2–1.6 µM). The complex used in lanes 4–6 was purified from E. coli expressing GST and untagged PP1G catalytic subunit (and applied at concentrations 0.1–0.8 µM). The complex used in lanes 7–9 was purified from E. coli expressing GST-PPP1R15A(539–614) and untagged PP1G catalytic subunit (and applied at concentrations of 0.08–0.64 µM). The complex used in lanes 10–12 was purified from E. coli expressing GST fusion to a mutant PPP1R15A(539–614)V549E that binds weakly to PP1, and untagged PP1G catalytic subunit (and applied at concentrations of 0.08–0.64 µM). (B) The lower panel is a Coomassie-stained Phos-Tag SDS-PAGE of the same reaction shown in panel A, but in the absence of substrate. The migration of the GST and GST-PPP1R15A(539–614) is indicated. The position of the substrate (GSTP), product (GST0), and the conspicuous GST signal emanating from reactions in which high concentrations of GST were introduced as a control enzyme (lanes 1 and 4) generating a signal that overlaps with the GST0 signal is indicated. Note that dephosphorylation of the substrate is restricted to lanes 7–9 in which both PP1 and PPP1R15 have been expressed in the E. coli.
Figure 4 with 3 supplements
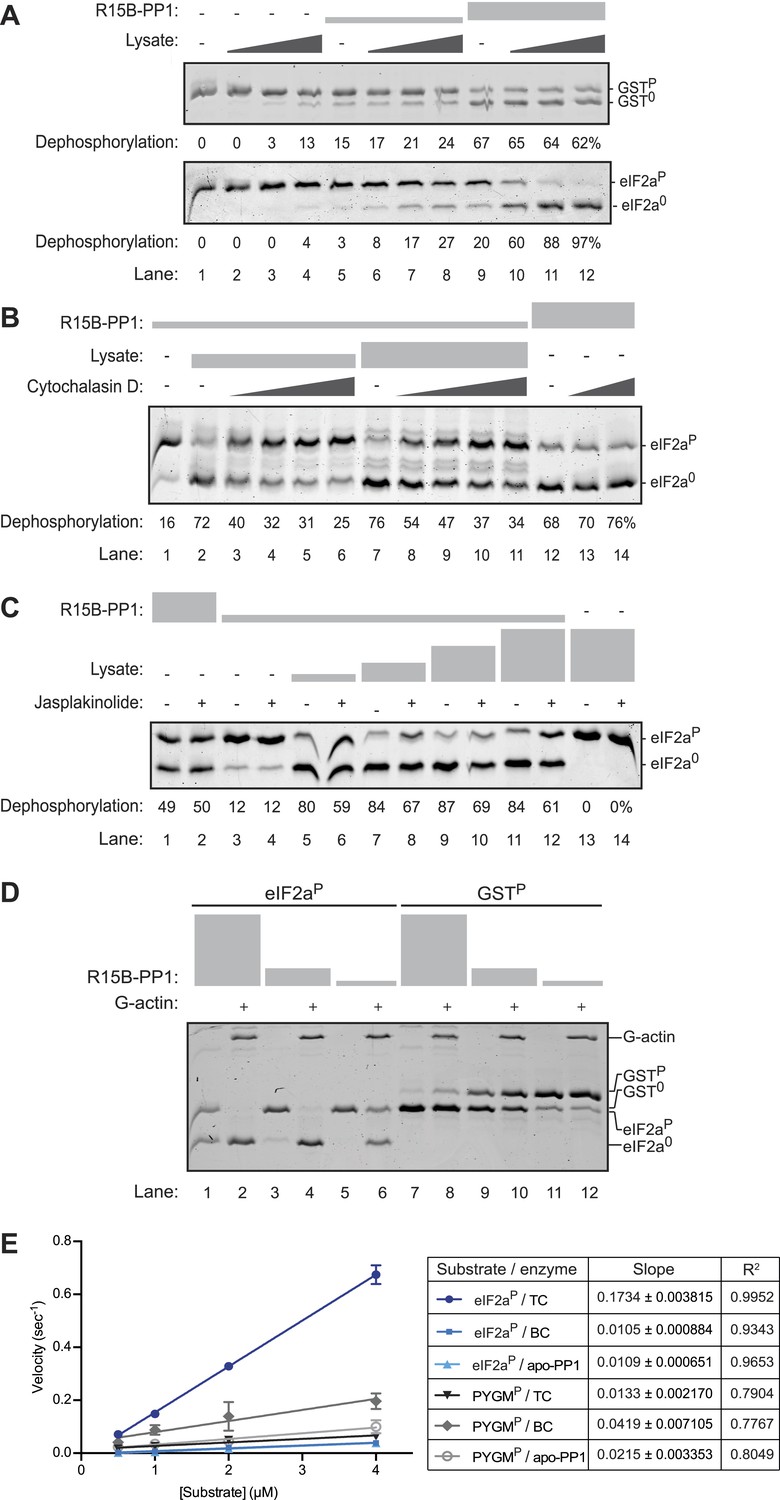
An activity in tissue lysate that endows the PPP1R15B-PP1G binary complex with specificity towards eIF2aP can be mimicked by pure G-actin.
(A) Images of Coomassie-stained Phos-Tag SDS-PAGE in which a phosphorylated non-specific substrate and de-phosphorylated product (GSTP and GST0, upper panel) and the specific substrate and product (eIF2aP and eIF20, lower panel) have been resolved. Escalating concentrations of tissue lysate (ranging from 12–100 ng/µl of protein) were incubated with low (1.5 nM) and high concentration (7.5 nM) of the PPP1R15B-PP1G complex (shown in ‘Figure 3A’) and applied identically to the two substrates (at ∼2 µM) for 20 min after which the substrate was purified away from other proteins and resolved on the gel shown. The fraction of the substrate dephosphorylated is indicated under each experimental point. (B) As in ‘A’ with the G-actin-binding compound cytochalasin D added to a final concentration ranging from 12.5 to 100 µM. (C) As in ‘A’ with the F-actin-stabilizing compound jasplakinolide added at a final concentration of 10 µM. (D) As in ‘A’ but with pure, latrunclulin B-blocked G-actin (∼1 µM) in place of tissue lysate. As the entire content of the reaction was loaded (without further purification of the substrate) the actin is visible in this gel, whilst the PPP1R15B-PP1 binary complex, present in quantities below the detection limit of the stained gel, is invisible. (E) Plot of the substrate concentration-dependence of the velocity of dephosphorylation of eIF2aP or phosphorylase A (PYGMP) by apo-PP1G, the binary PP1G-PPP1R15B (BC) or the ternary PP1G-PPP1R15B-actin complex (TC), assayed over a physiologically relevant concentration range of the eIF2aP substrate (well below the enzyme's Km for that substrate, see Figure 4—figure supplement 1). Shown are the mean ± SD of measurements performed in triplicate. The regression coefficient (R2) and slope (±SD), of the linear regression of each of the six enzyme-substrate pairs are indicated. Note: at substrate concentrations below the Km, the slope of the linear regression reflects the relative velocity of the reaction (proportional to the Kcat/Km of the particular enzyme-substrate pair).
Figure 4—figure supplement 1
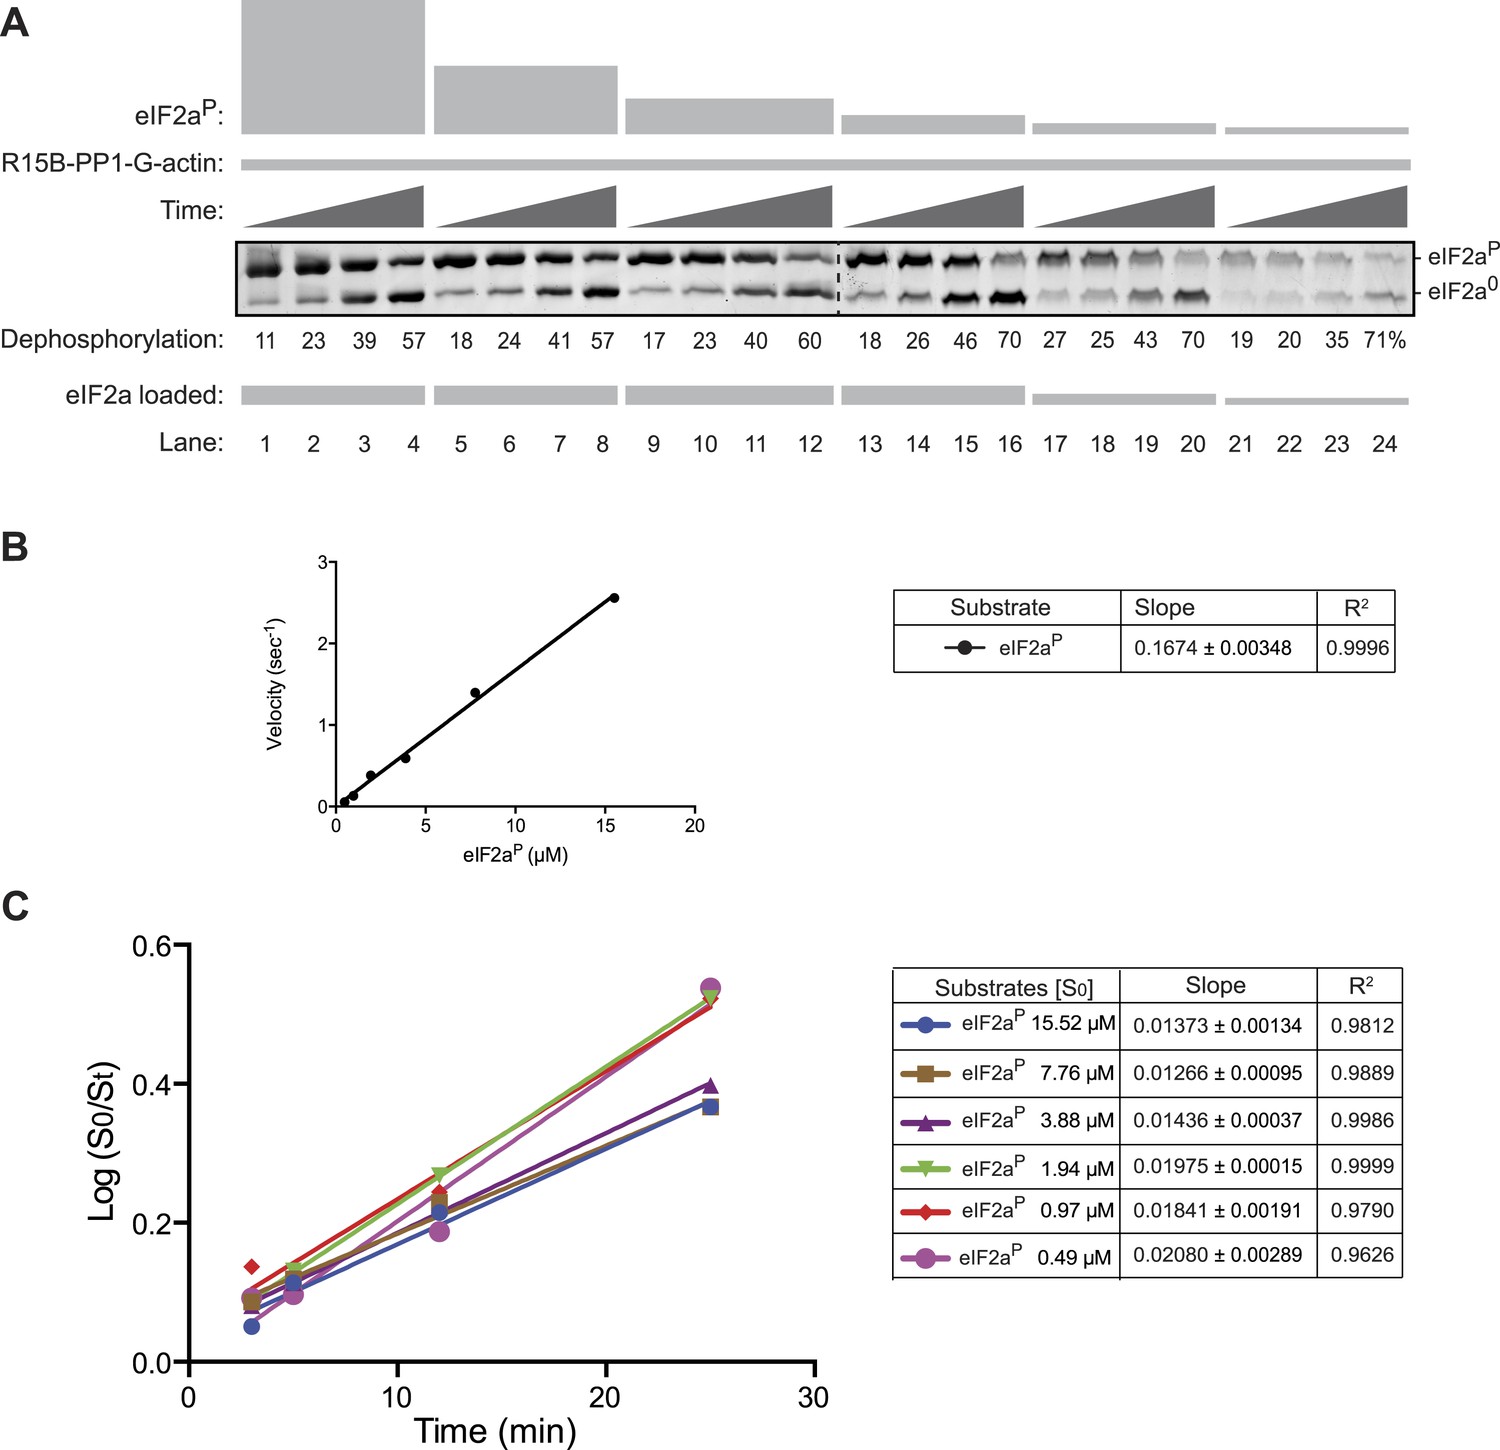
Substrate concentration dependence of the velocity of eIF2aP dephosphorylation by the PPP1R15B-PP1G-Actin ternary complex.
(A) Image of Coomassie stained Phos-Tag gels of eIF2aP dephosphorylation reactions by a ternary complex constituted of PPP1R15B-PP1G (5 nM) and G-actin (1 µM). Time points of 3, 5, 12, and 25 min were sampled and the concentration of substrate was varied over a range from 0.5 to 15 µM. To ensure resolution of the Phos-Tag gel, the volume of the sample loaded from the reactions containing high concentration of substrate (lanes 1–12) was adjusted to ensure equality in the total mass of substrate plus product (total eIF2a) in each lane. The entire reaction containing lower concentrations of substrate was loaded onto the gel (lanes 13–24). Shown is an experiment reproduced twice with similar results. (B) Plot of the relation between the initial velocity of the reaction (calculated at the 5 min time point) and concentration of substrate at t = 0. Note that the reaction velocity increased linearly over this concentration range and that the enzyme could not be saturated by substrate over the 30× concentration range accessible to testing. (C) Plot of the logarithm of the time-dependent change in ratio of substrate concentration at t = 0 to the substrate concentration at t [log(S0/St)] from the six dephosphorylation time courses experiments shown in ‘A’. The slope (mean ± SD), indicative of the relative enzyme velocity, and the linear regression coefficient of the reactions initiated at different substrate concentration [S0] are indicated. Note the similar slope and strong fit to a linear regression of reactions initiated at different substrate concentration and allowed to progress through to extensive substrate depletion.
Figure 4—figure supplement 2

Estimation of the concentration of eIF2a by quantitative immunoblotting of HEK293T cell lysates.
(A) Plot of the relationship between fluorescent intensity of the eIF2a signal in immunoblot to the mass of recombinant eIF2a (in pico moles) applied to the blot. An image of the immunoblot is provided in the inset. (B) Immunoblot of ascending volumes of HEK293T cell lysates from biological duplicate samples applied to the same membrane used to derive the calibration curve shown in ‘A’, above. The intensity of the fluorescent signal, the corresponding mass of eIF2a (derived from the standard curve shown in ‘A’) the packed cell volume and the corresponding estimated cytosolic volume of the lysate applied to each lane are indicated, as is the derivative estimated concentration of eIF2a in that sample. The latter was calculated from the first two loadings of each sample (lanes 1, 2, 5, and 6, where the fluorescent signal is not saturated) and is based on the assumption that 60% of the packed cell volume is intracellular, of which ½ is comprised of cytosol (the rest being nucleus and organelles). Yielding an estimated eIF2a concentration of 1.13 ± 0.15 µM (mean ± SD, n = 4).
Figure 4—figure supplement 3
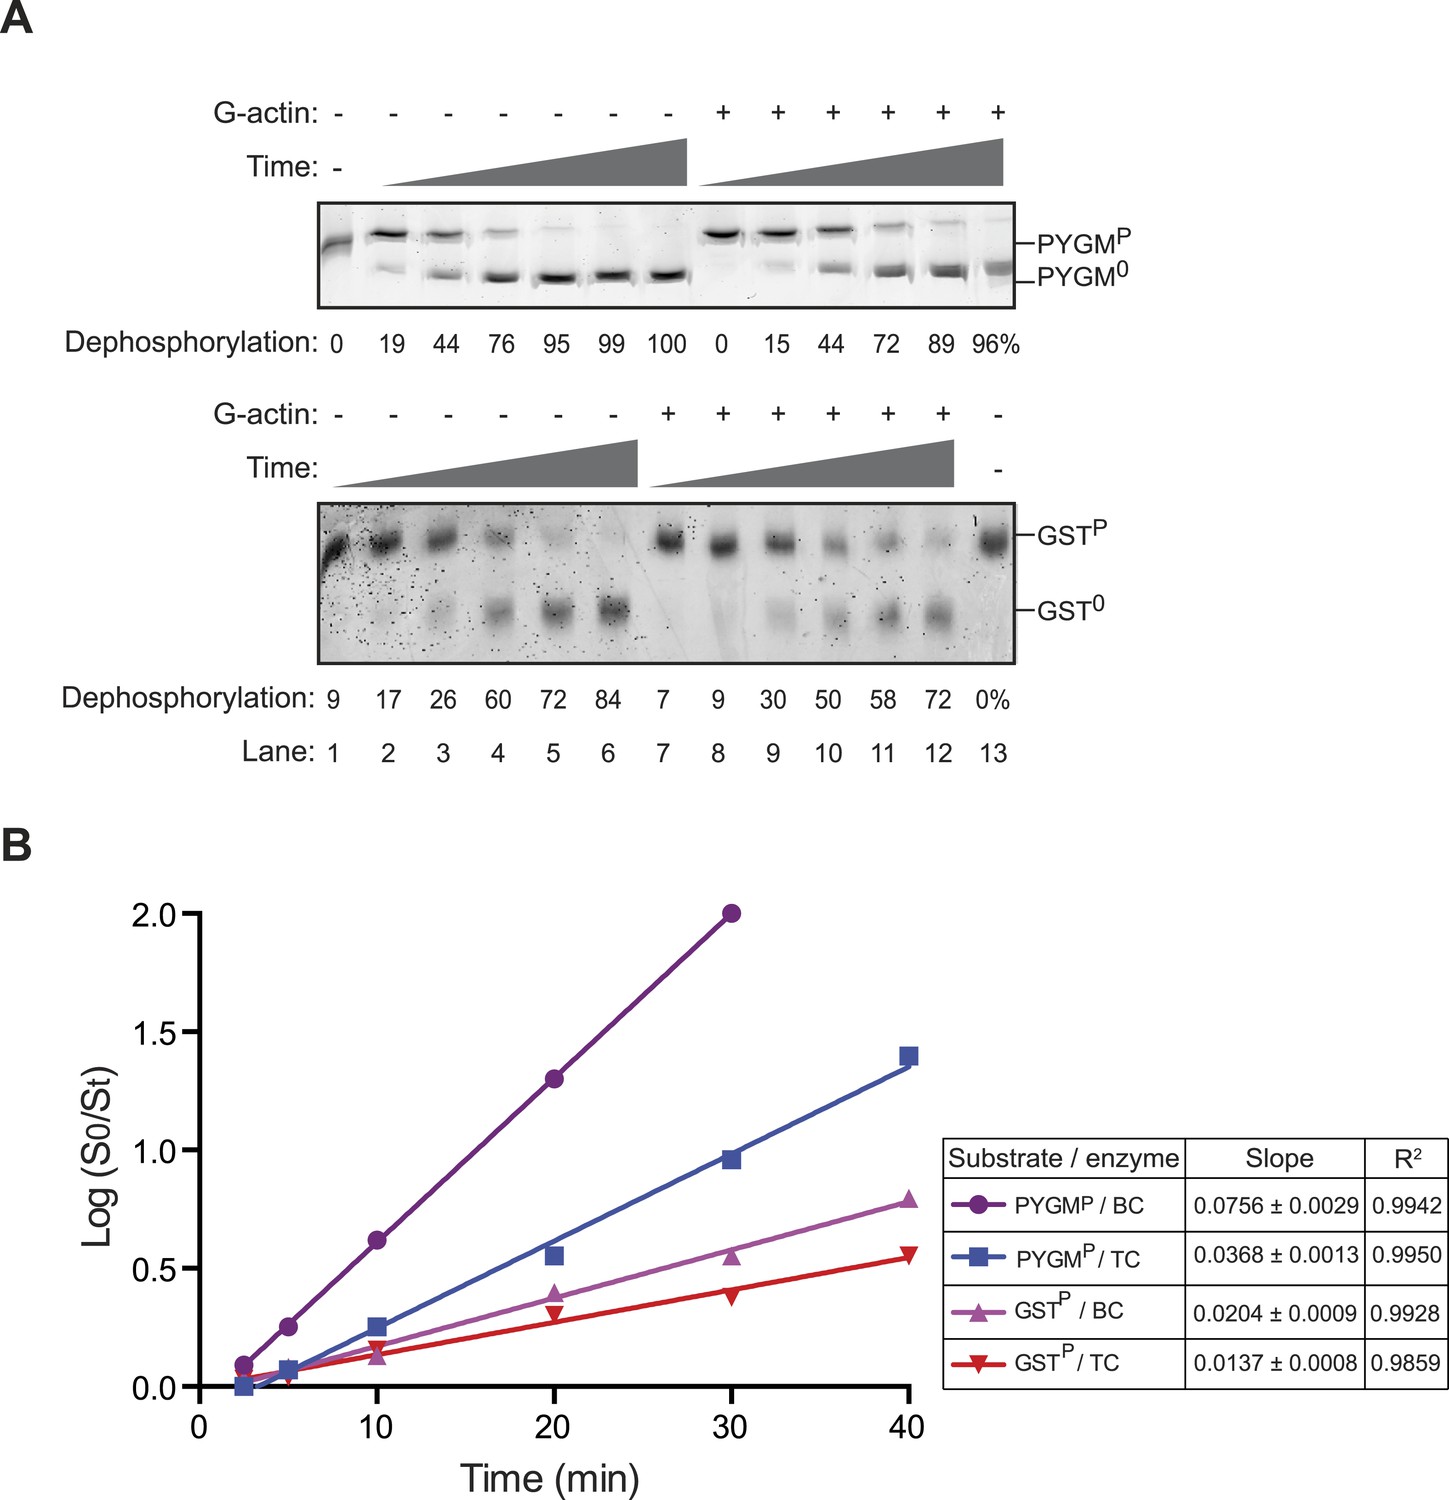
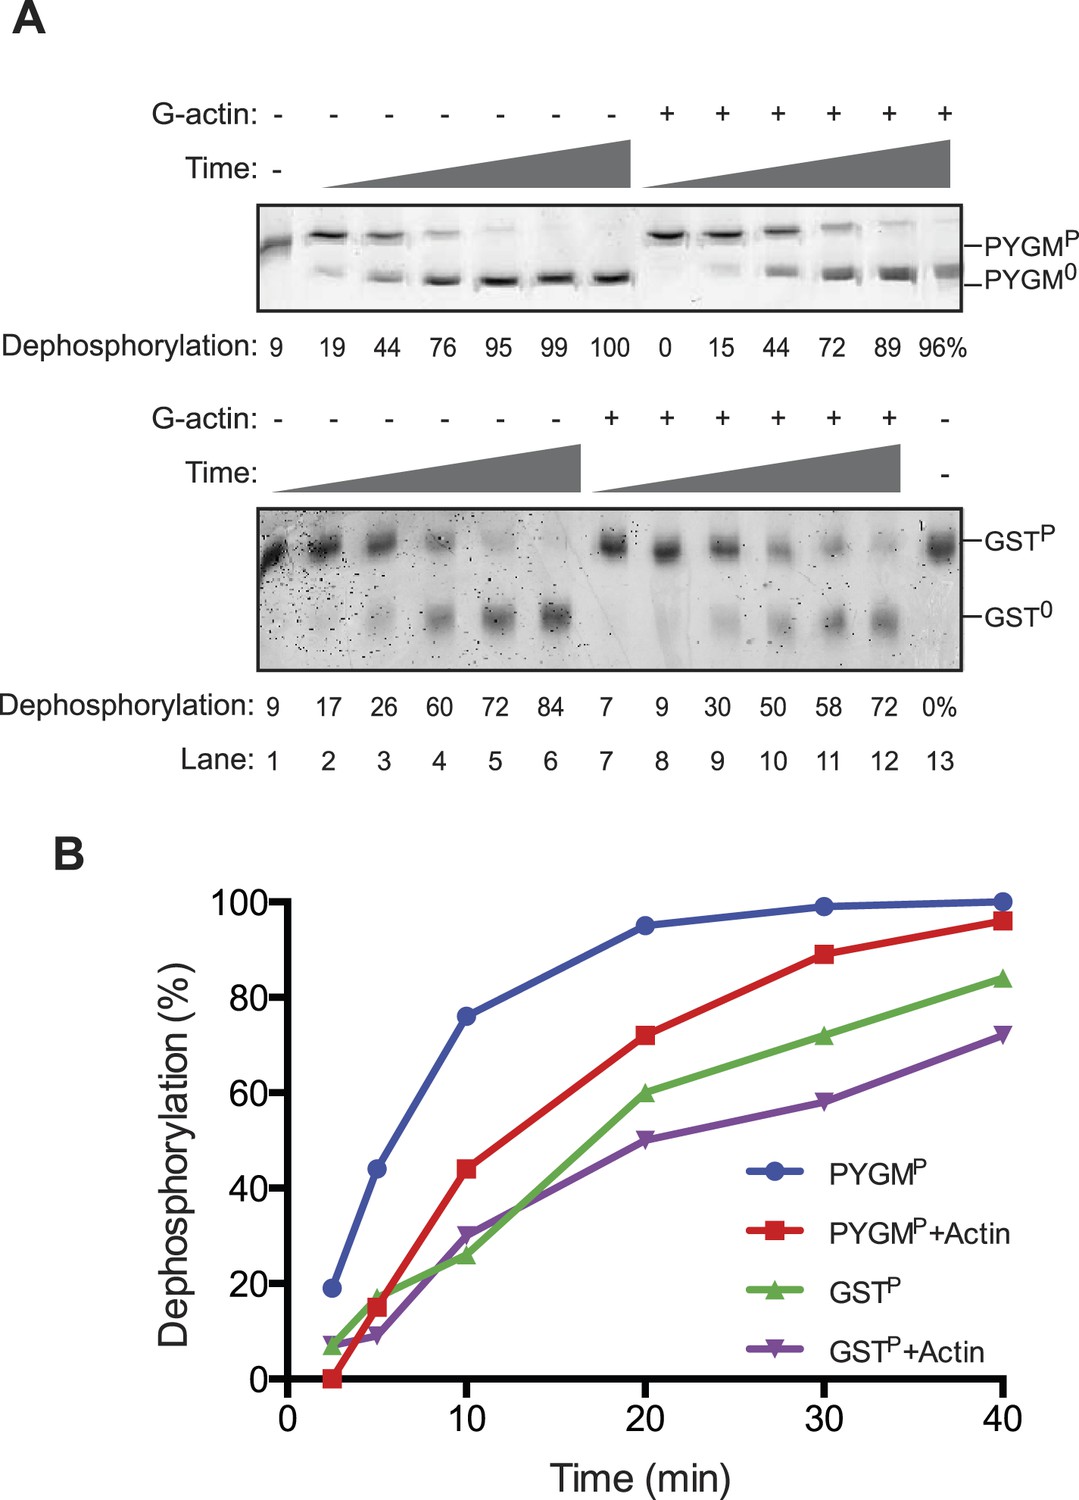
Incorporation of G-actin inhibits PPP1R15B-PP1G phosphatase activity directed against non-specific substrates.
(A) Images of Coomassie stained Phos-Tag gels of a time course (2.5–40 min) of dephosphorylation reactions of phosphorylase A (PYGMP, upper panel) or GSTP (lower panel) (both at 1 µM) by a complex constituted of PPP1R15B-PP1G (15 nM) in the presence or absence of G-actin (1 µM). Shown is a representative sample of an experiment reproduced three times. (B) Plot of the logarithm of the time-dependent change in ratio of substrate concentration at t = 0 to the substrate concentration at t [log(S0/St)] from the four dephosphorylation time courses experiments shown in ‘A’; phosphorylase A (PYGMP) or GSTP, by a binary complex of PPP1R15B-PP1G (BC, without Actin) or a ternary complex of PPP1R15B-PP1G-Actin (TC, with Actin). The slope (mean ± SD), indicative of the relative enzyme velocity, and the linear regression coefficient of the different reactions are noted.
Figure 5 with 1 supplement
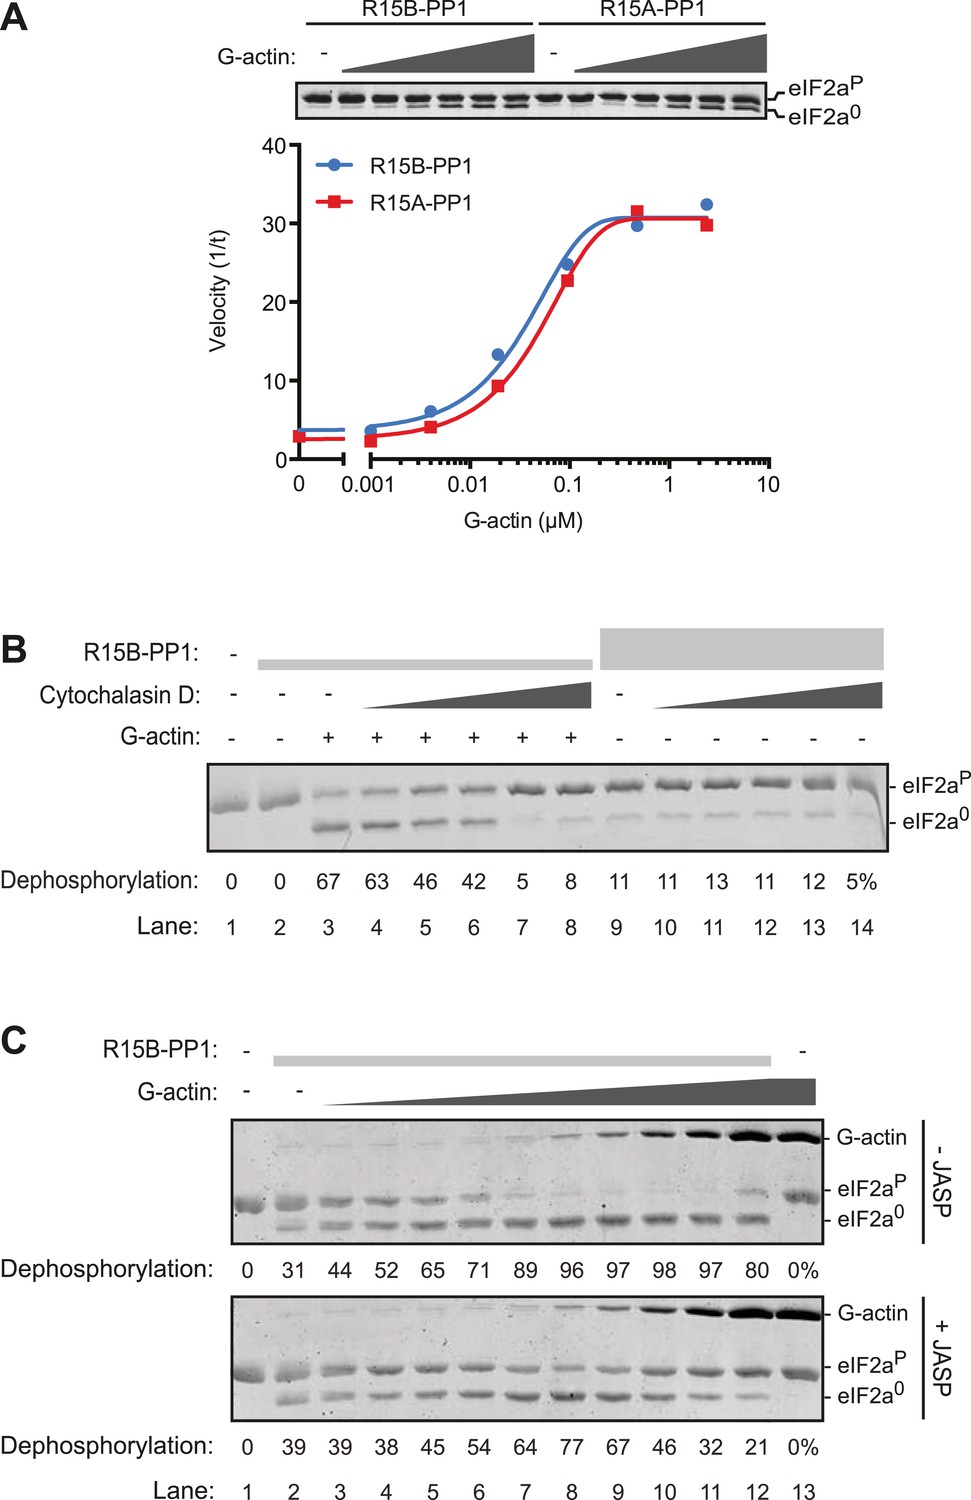
G-actin activates the eIF2aP-directed phosphatase activity of both PPP1R15A and PPP1R15B-containing binary complexes with an EC50 in the submicromolar range.
(A) Trace of the velocity of eIF2aP dephosphorylation by 16 nM PPP1R15A-PP1G (in red) and 68 nM PPP1R15B-PP1G (in blue) binary complexes in the presence of the indicated concentrations of G-actin (fitted to a non-linear regression). An image of the gel of a representative experiment is presented above the trace. (B) Image of a Coomassie-stained gel of dephosphorylation reactions by a specific [PPP1R15B-PP1G (25 nM) and actin (1 µM)] ternary complex (lanes 2–8) or a non-specific [PPP1R15B-PP1G (125 nM)] binary complex (lanes 9–14) in the presence of escalating concentrations of cytochalasin D (1.2–100 µM). (C) As in ‘B’ but with escalating concentrations of G-actin in the absence and presence of jasplakinolide, 1 µM.
Figure 5—figure supplement 1
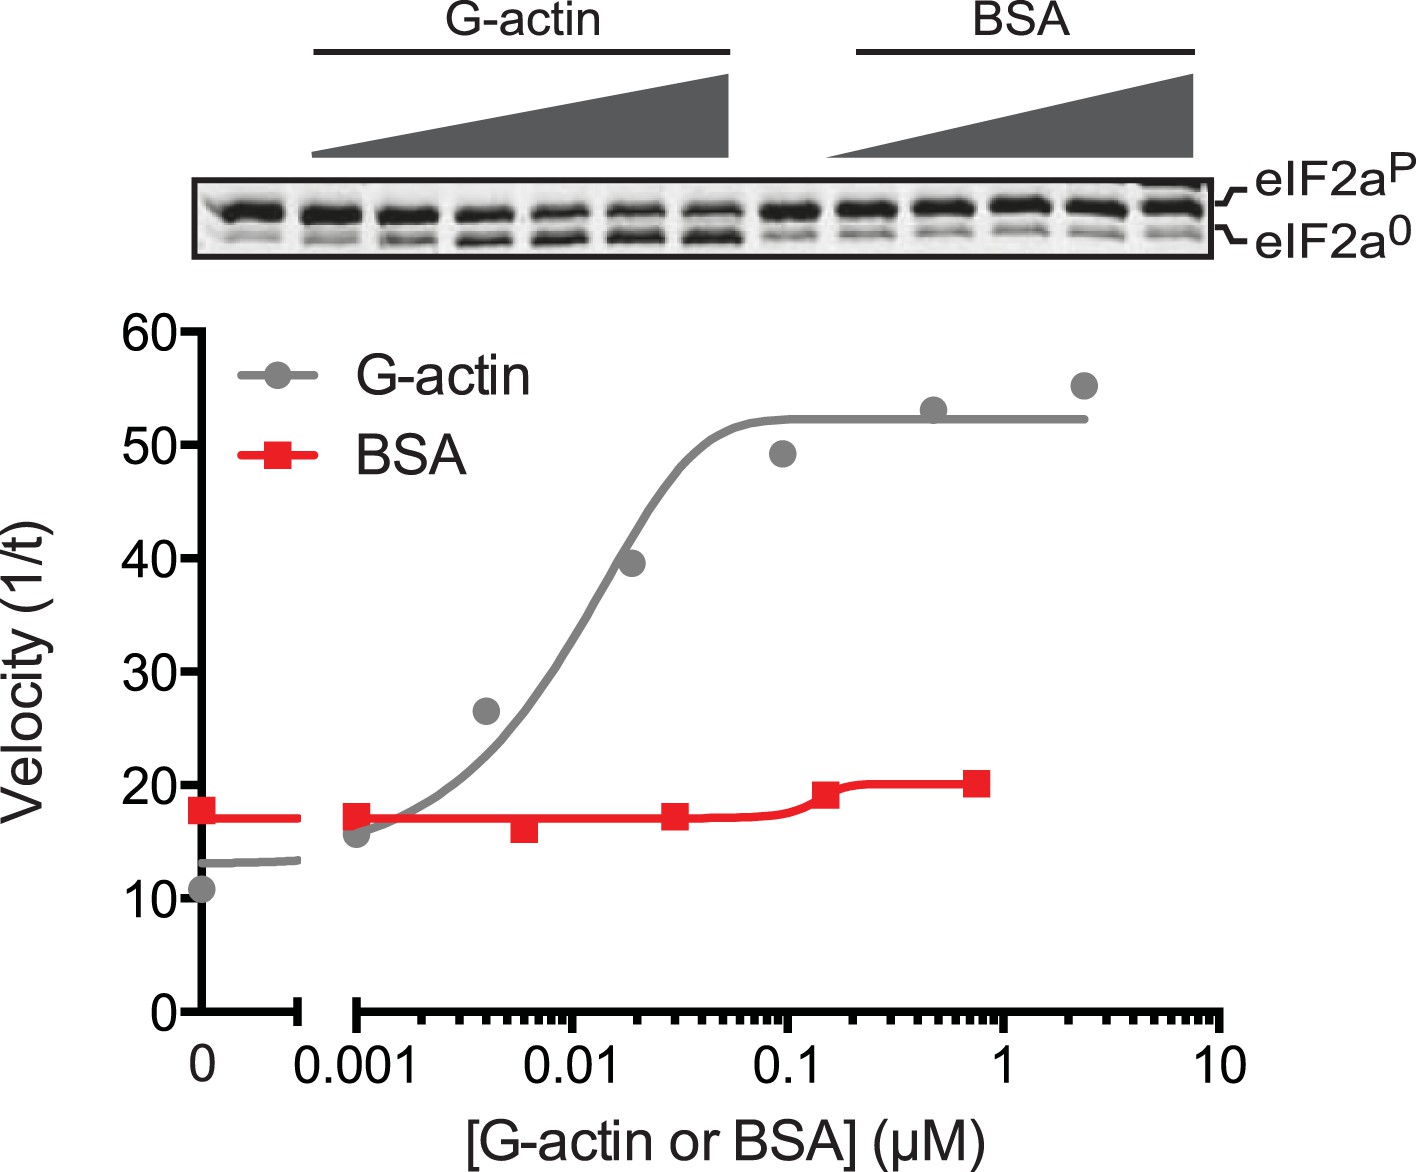
An irrelevant protein, bovine serum albumin, has no effect on the dephosphorylation of eIF2a by the PPP1R15B-PP1G binary complex.
Trace of the velocity of eIF2aP dephosphorylation by 68 nM PPP1R15B-PP1G binary complexes in the presence of the indicated concentrations of G-actin (grey) or bovine serum albumin (BSA, red) both fitted to a non-linear regression. An image of the gel of a representative experiment reproduced twice is presented above the trace.
Figure 6 with 1 supplement
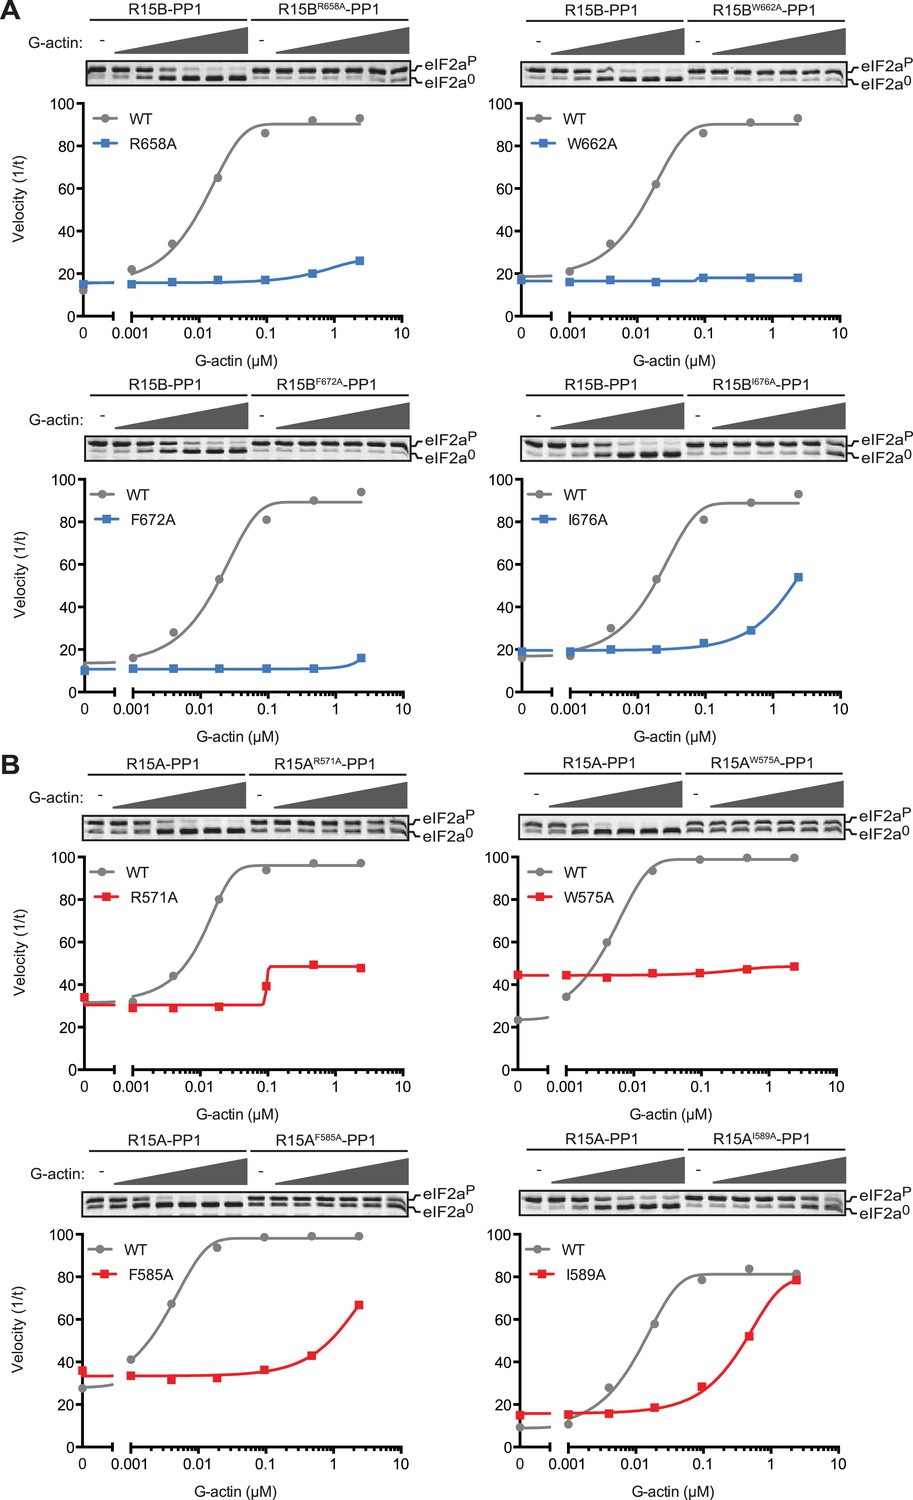
Mutations in conserved residues of the PPP1R15 core functional domain enfeeble its activation by actin.
(A) Traces of the velocity of eIF2aP dephosphorylation by wildtype and the indicated mutant PPP1R15B-PP1G complexes in the presence of the indicated concentrations of actin. (B) As in ‘A’ but with wildtype and mutant PPP1R15A-PP1G complexes. Note that the concentration of binary complex varied from 15–45 nM in the assays shown. It was purposely titrated to attain a velocity of dephosphorylation (in the absence of actin) comparable to ∼1/5 of that achieved by the wildtype enzyme in the presence of saturating concentration of actin. This ensures comparable activity of the wildtype and mutant enzymes in the absence of actin.
Figure 6—figure supplement 1
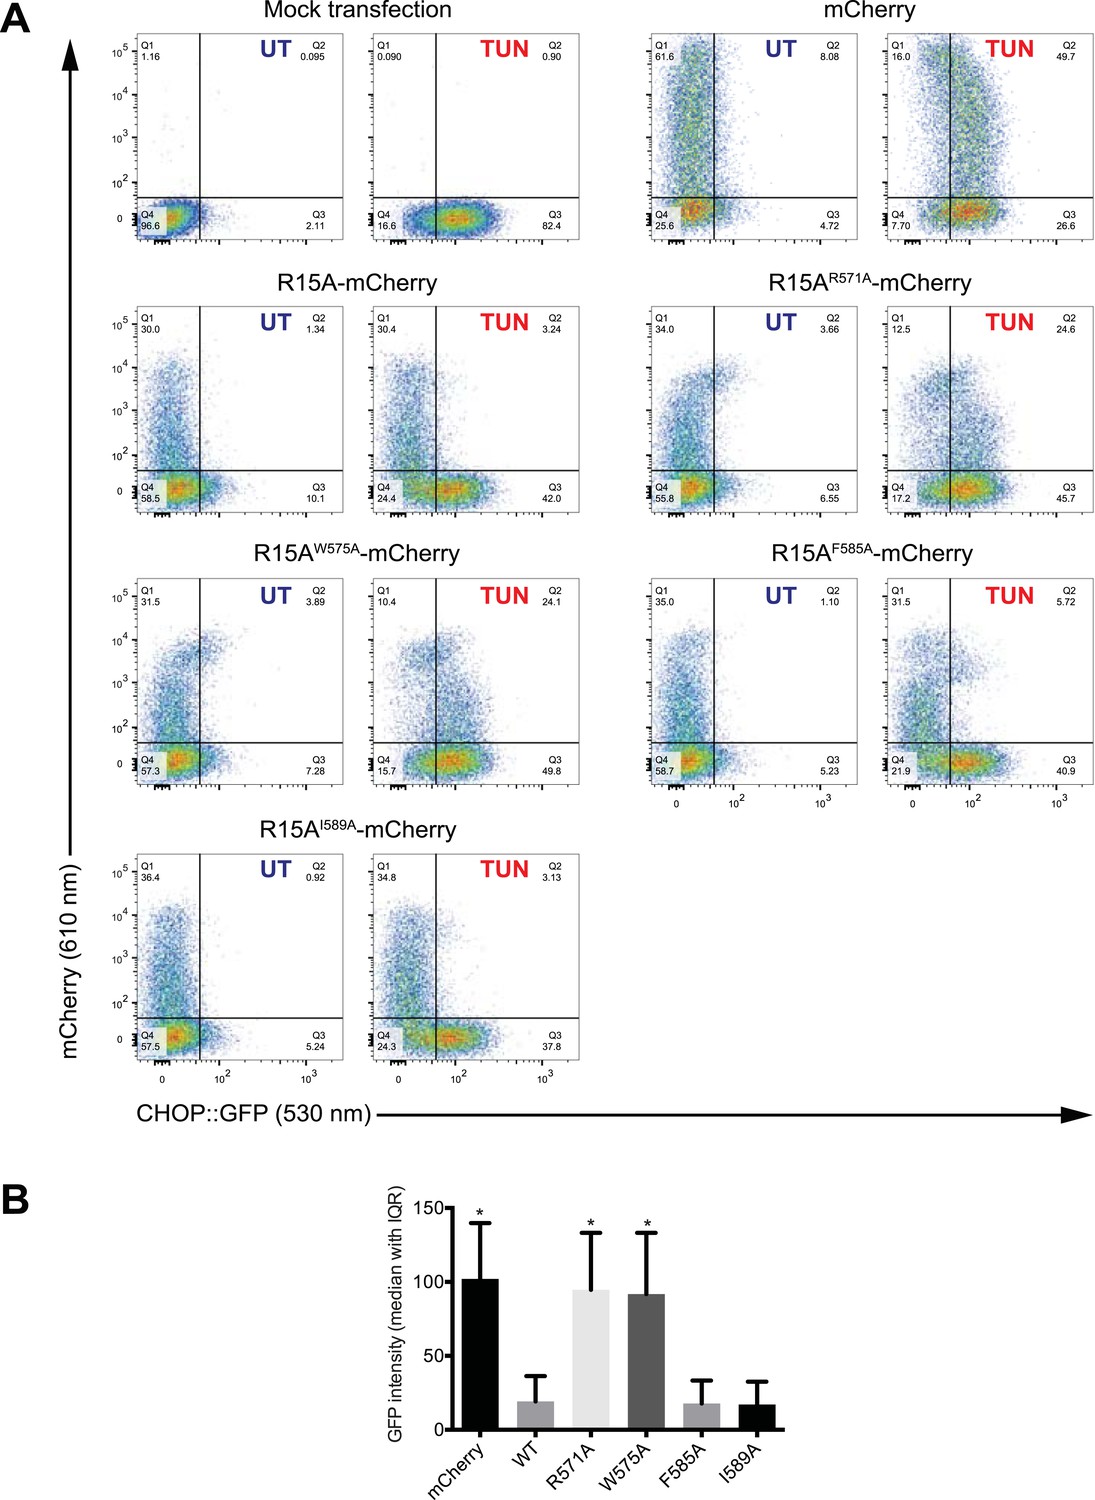
Mutations in conserved residues of PPP1R15A compromise function in vivo.
(A) Dual channel flow cytometric analysis of CHOP::GFP cells transfected with mCherry, fusion of wildtype PPP1R15A to mCherry or fusion of the indicated mutant derivatives of PPP1R15A to mCherry. Where indicated the cells were treated with the ER stress-inducing agent tunicamycin (TUN) to activate the ISR marker gene CHOP::GFP. (B) The bar diagram quantifies CHOP::GFP activation (the ISR marker) by tunicamycin in the mCherry marked cells (shown is the median ± InterQuartile Range of the GFP intensity of cells in quadrants 1 and 2, from ‘A’ above). It is suppressed in vivo by the wildtype and the weak F585A and I589A mutations, but the strong R571A and W575A mutations reversed the ability of PPP1R15A to suppress the ISR.
Figure 7 with 2 supplements
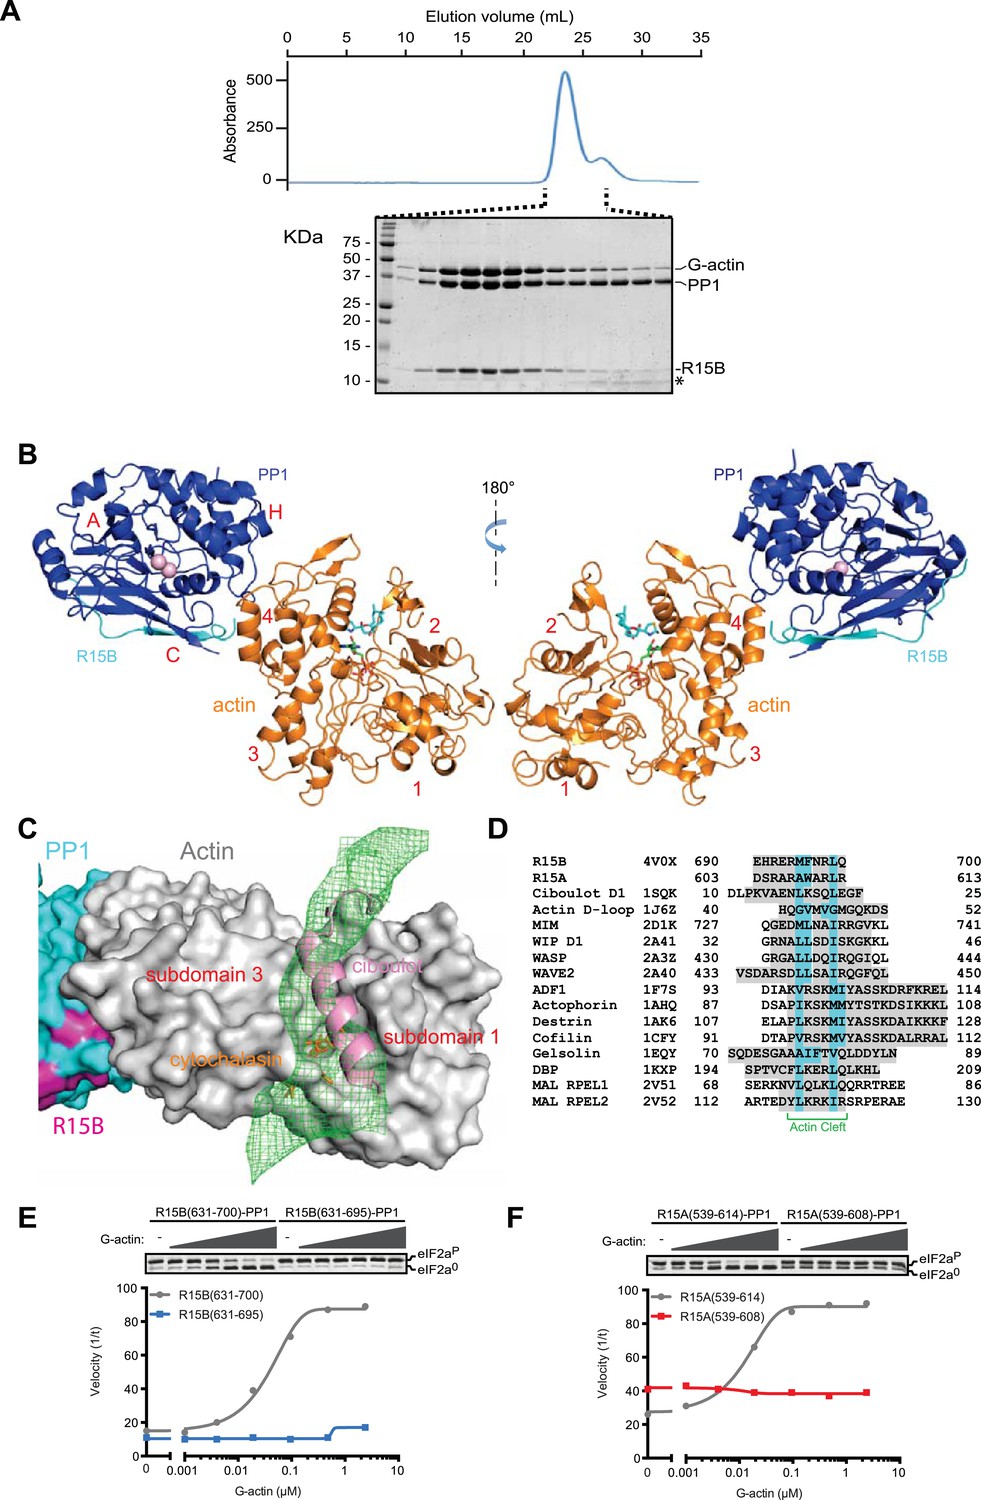
G-Actin joins PPP1R15B-PP1G binary complexes to extend its active site-facing surface.
(A) UV protein absorbance trace of a PPP1R15B(631–701)-PP1G(7–323)-G-actin complex assembled from the bacterially-expressed binary complex and rabbit muscle G-actin and resolved by size-exclusion chromatography. The indicated fractions from the chromatogram are presented in the Coomassie-stained SDS-PAGE below. The position of G-actin, PP1, and the PPP1R15B peptide (R15B) is indicated, as is a degradation product of the PPP1R15B peptide that elutes in later fractions (*). (B) Cartoon representation of the PP1G (purple), PPP1R15B (cyan), G-actin (yellow) holophosphatase complex. The peptide backbone is in colored ribbon diagram, the metal ions in the PP1G active site are shown as pink spheres whereas latrunculin B and ATP in the actin nucleotide binding pocket are shown in stick diagram (blue and green respectively). Actin's four lobes (1–4) are marked for reference. The image on the left provides a view of the holoenzyme's active site, whereas the view to the right is of the back side. Note that density attributable to PPP1R15B is only traceable through residue W662. (C) Close-up of actin's barbed end in the holophosphatase complex. Actin is shown in gray surface representation, PP1 in cyan, and PPP1R15B in magenta. Difference electron density after averaging in coot (likely representing PPP1R15B) is shown as a green mesh. The actin-binding helical peptide of drosophila Ciboulot, a prototypical G-actin binding protein (PDB: 1SQK) (Hertzog et al., 2004), in pink ribbon presentation and cytochalasin D, a small molecule inhibitor (PDB: 3EKS) (Nair et al., 2008), in orange stick diagram, are provided as landmarks. (D) Alignment of the C-terminal most residues of the conserved functional core of human PPP1R15B (R15B) and mouse PPP1R15A (R15A) with amphipathic helices of G-actin binding proteins seen to engage the cleft between domains I and III in the indicated PDB files (shaded grey). The residues observed (or predicted, in the case of PPP1R15) to constitute the hydrophobic face of the amphipathic helix are highlighted in teal. (E) Traces of the velocity of eIF2aP dephosphorylation by wildtype (grey) and the C-terminal truncation mutant PPP1R15B lacking F696-Q700 (blue) in the presence of the indicated concentrations of actin. (F) As in ‘D’ but comparing wildtype (grey) and C-terminal truncation mutant PPP1R15A lacking W609-R613 (red).
Figure 7—figure supplement 1
G-Actin also joins PPP1R15 A-PP1G binary complexes to form a stable ternary complex.
UV protein absorbance trace of a PPP1R15A(539–614)-PP1G(7–323)-G-actin complex assembled from the bacterially-expressed binary complex and rabbit muscle G-actin and resolved by size-exclusion chromatography on tandem S200 and S75 30/300 columns. The indicated fractions from the chromatogram are presented in the Coomassie-stained SDS-PAGE below. The positions of G-actin, PP1, the GST remnant, the PPP1R15A peptide and its degradation product are indicated (the latter by an asterisk).
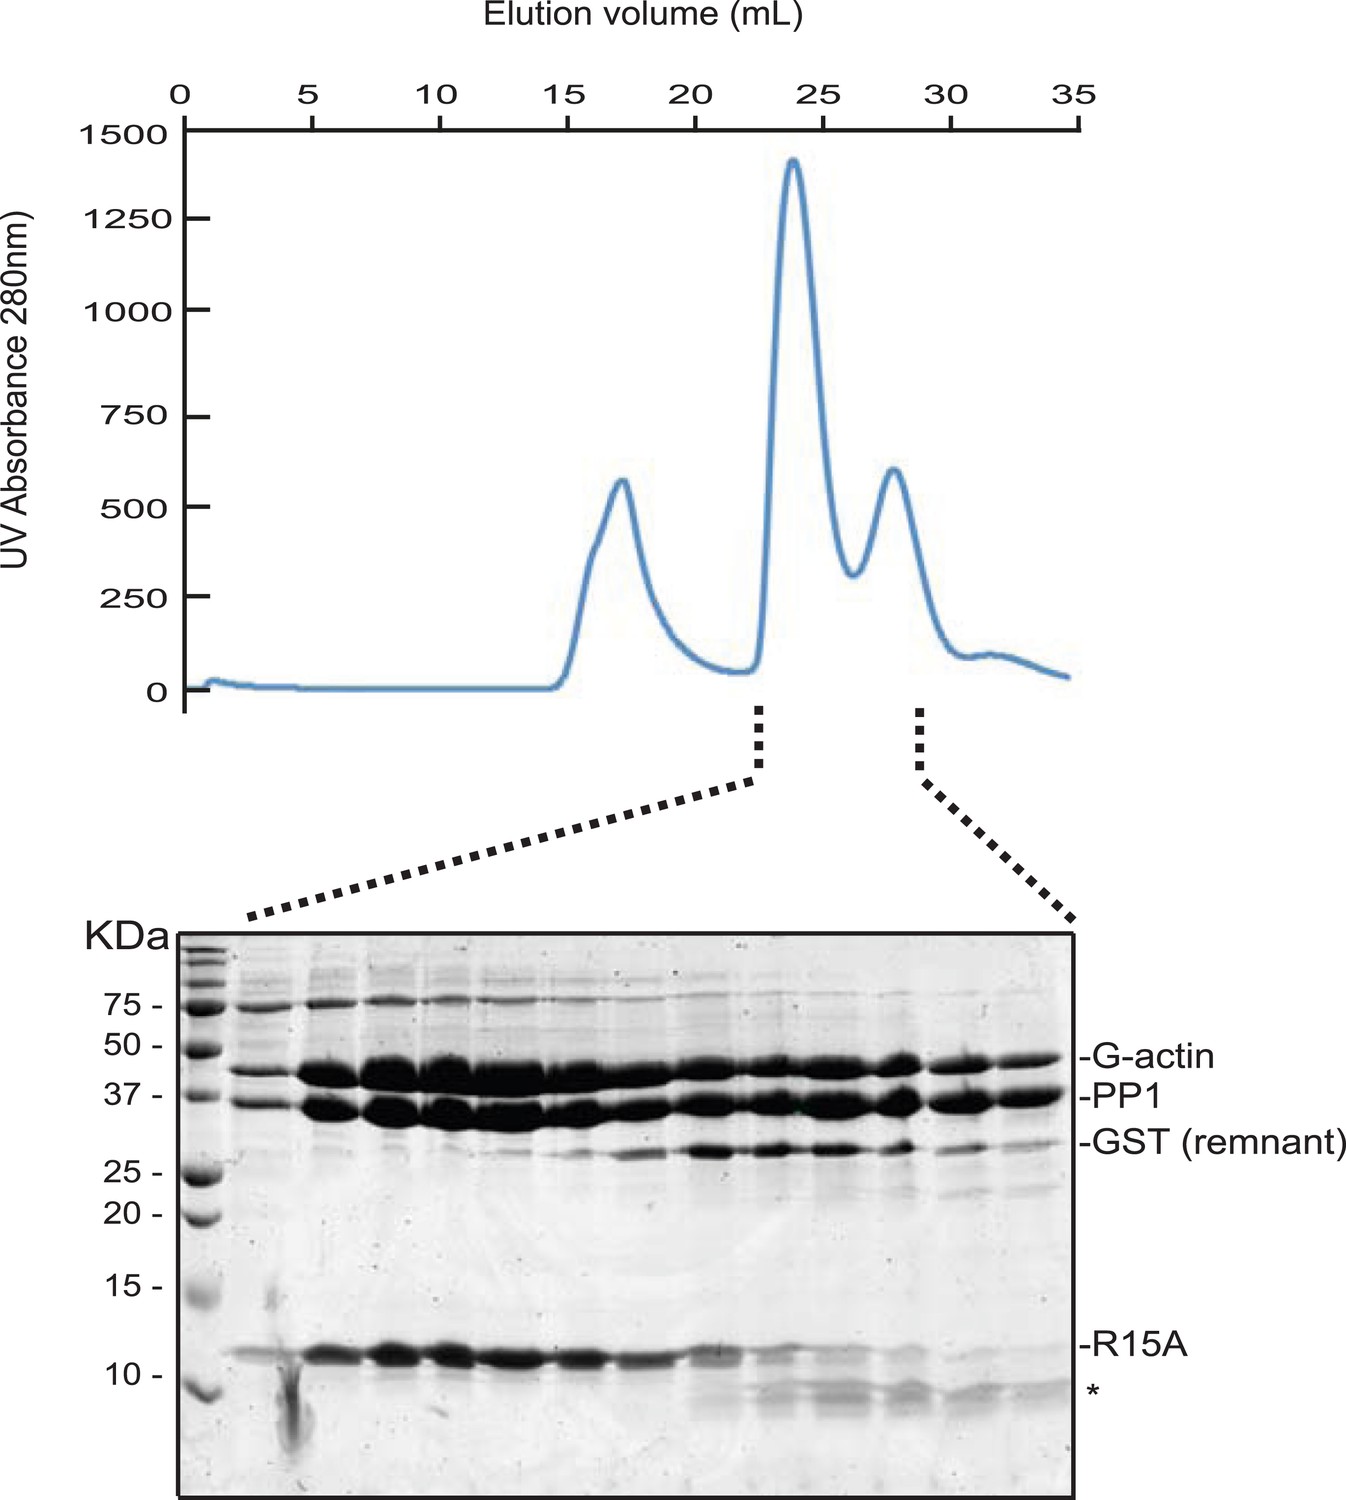
Figure 7—figure supplement 2
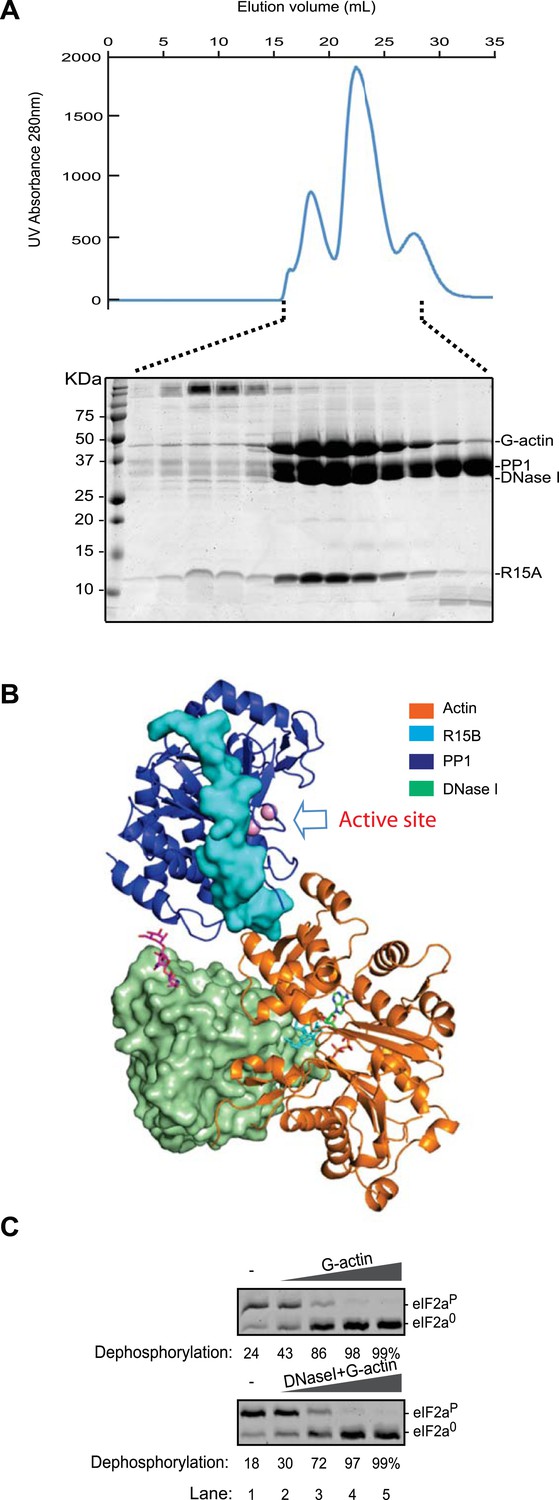
A ternary complex of DNase I, G-actin, PP1G and PPP1R15A retains its eIF2aP-directed phosphatase activity.
(A) UV protein absorbance trace of a PPP1R15A (539–614)-PP1G(7–323)-G-actin and DNase I complex assembled from the bacterially-expressed binary complex, rabbit muscle G-actin and bovine pancreatic DNase I, resolved by size-exclusion chromatography. The indicated fractions from the chromatogram are presented in the Coomassie-stained SDS-PAGE below. The positions of G-actin, PP1, DNase I, and the PPP1R15A peptide are indicated. (B) Cartoon representation of a model of the PPP1R15B, PP1G, and G-actin ternary complex with DNase I placed by superimposing the actin and DNase I complex (PDB: 2A41) (Chereau et al., 2005) onto the PPP1R15B, PP1G and G-actin ternary complex (PDB: 4V0U). Note that DNase I is bound to the backside of the ternary complex, facing away from the PP1 active site (arrow). (C) Images of Coomassie-stained Phos-Tag SDS-PAGE in which phosphorylated and dephosphorylated eIF2a (eIF2aP and eIF2a0) have been resolved. Escalating amounts of G-actin or a complex of G-actin and DNase I (final concentration, 10 nM–1 µM) were added to a reaction containing 25 nM PPP1R15B-MBP and PP1G complex (as in Figure 3A) and 2 µM eIF2aP substrate for 20 min.
Figure 8 with 2 supplements
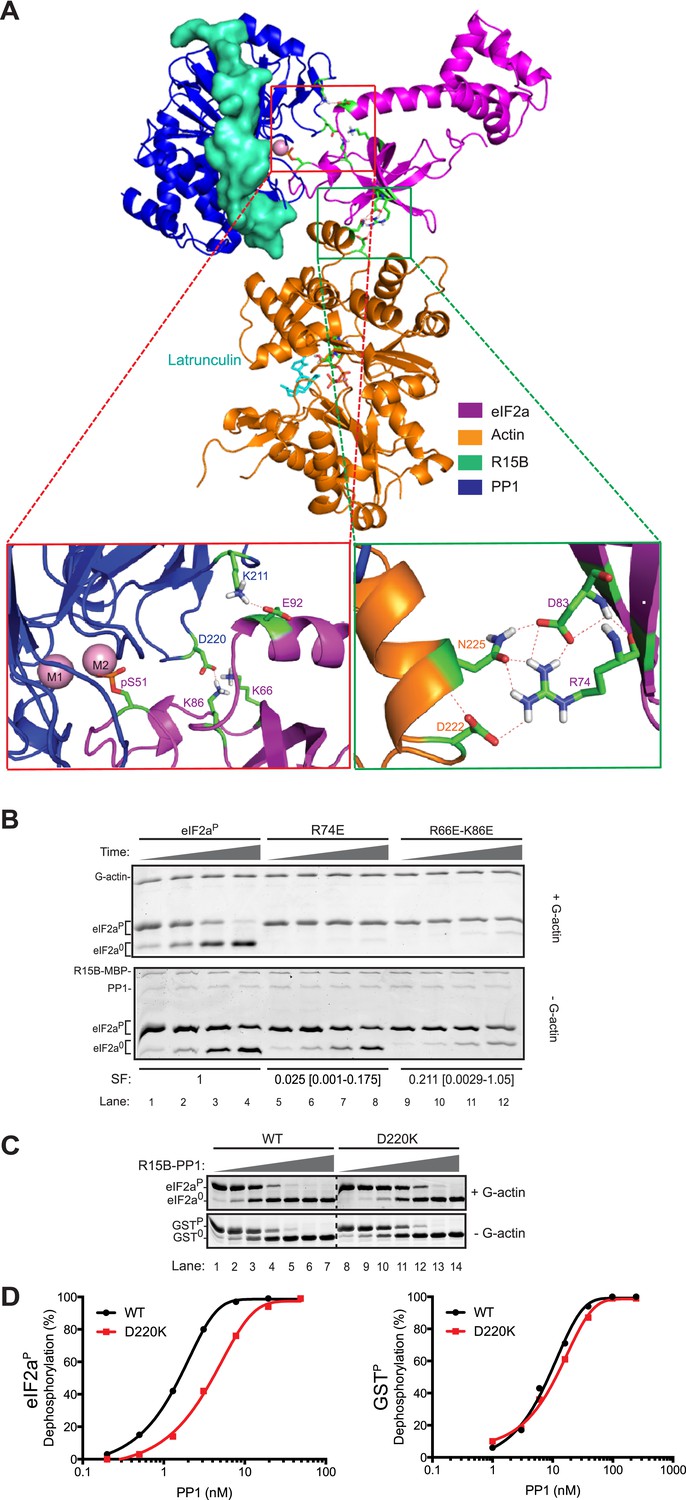
Mutation of residues predicted to affect substrate-enzyme binding enfeeble dephosphorylation by the selective ternary complex.
(A) High ambiguity driven protein docking by HADDOCK (Dominguez et al., 2003) model of yeast eIF2a's regulatory N-terminus (PDB: 1Q46) with substrate phospho-S51 docked at the active site of the PPP1R15B-PP1-actin ternary complex (PDB: 4V0U). The left close-up view shows the web of predicted hydrogen bonding between eIF2a E92 and PP1 K211 and eIF2a K66 (R66 in the mammalian eIF2a) and K86 and PP1 D220. The right close-up view is of the eIF2a residues R74 and D83 and actin residues D222 and N225. (B) Images of Coomassie-stained Phos-Tag SDS-PAGE in which phosphorylated and de-phosphorylated wildtype and the indicated eIF2a mutant forms have been resolved. The upper panel (‘+G-actin’) is of reactions with substrate at ∼2 µM exposed to 8.6 nM of the [PPP1R15B-MBP and PP1] binary complex with 1 µM (saturating) concentration of G-actin for 5, 10, 15, and 30 min. In the lower panel (‘−G-actin’), the concentration of binary complex was higher (0.26 µM). The specificity factor (SF) of the mutant substrates, based on the relative velocity of dephosphorylation by the PPP1R15B-MBP-PP1-actin ternary complex (TC) compared to the PPP1R15B-MBP-PP1 binary complex (BC) and normalized to the wildtype substrate (see Figure 8—figure supplement 2), is noted below each construct (mean and with 95% confidence limits):
Shown is a typical experiment reproduced four times. (C) As above; dephosphorylation reactions performed with escalating concentrations of binary complexes constituted with wildtype or the D220K PP1G mutant catalytic subunit and allowed to progress for 30 min. The substrate in the upper panel was wildtype eIF2aP (∼4 µM) and G-actin was added at a saturating concentration. The substrate in the lower panel is the non-specific GSTP (∼4 µM). (D) Plot of the relationship between dephosphorylation velocity and enzyme concentration for the enzyme-substrate pairs shown in panel ‘C’ above.
Figure 8—figure supplement 1
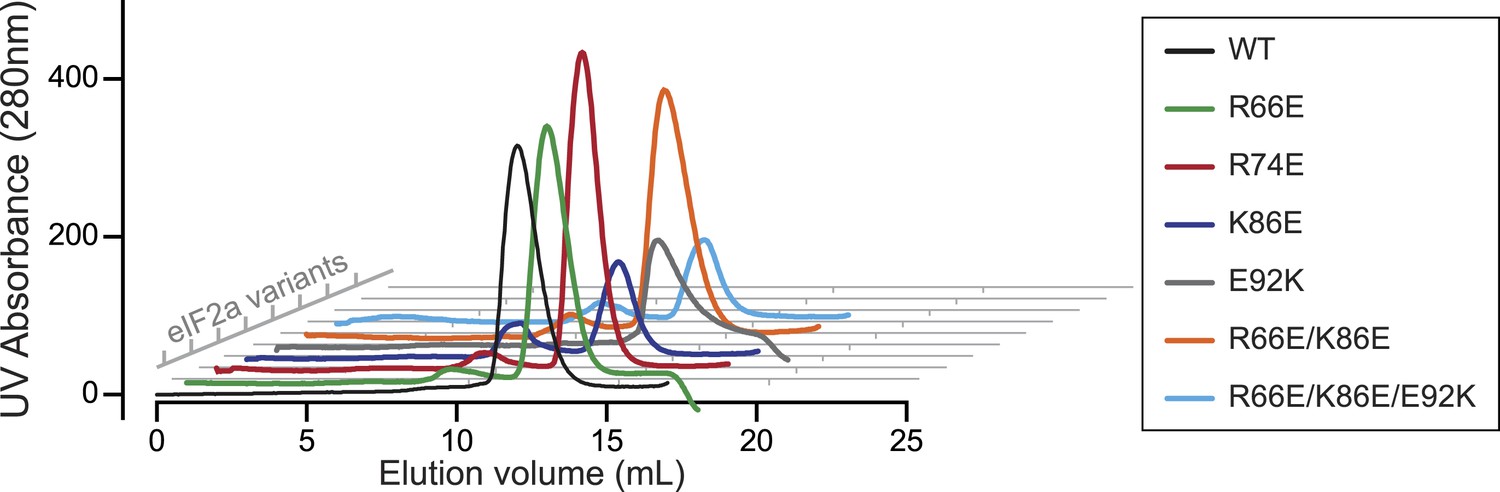
The wildtype and mutant eIF2aP substrates have indistinguishable retention profiles on size exclusion chromatography.
Shown are plots of UV protein absorbance traces of the indicated eIF2aP substrates discussed in the results section and utilized in the experiment shown in Figure 8. The bacterially-expressed proteins were purified by affinity tag (His 6X) chromatography, phosphorylated to completion by the kinase PERK, in vitro and resolved by size exclusion chromatography on a Superdex 75 30/300 mm column.
Figure 8—figure supplement 2
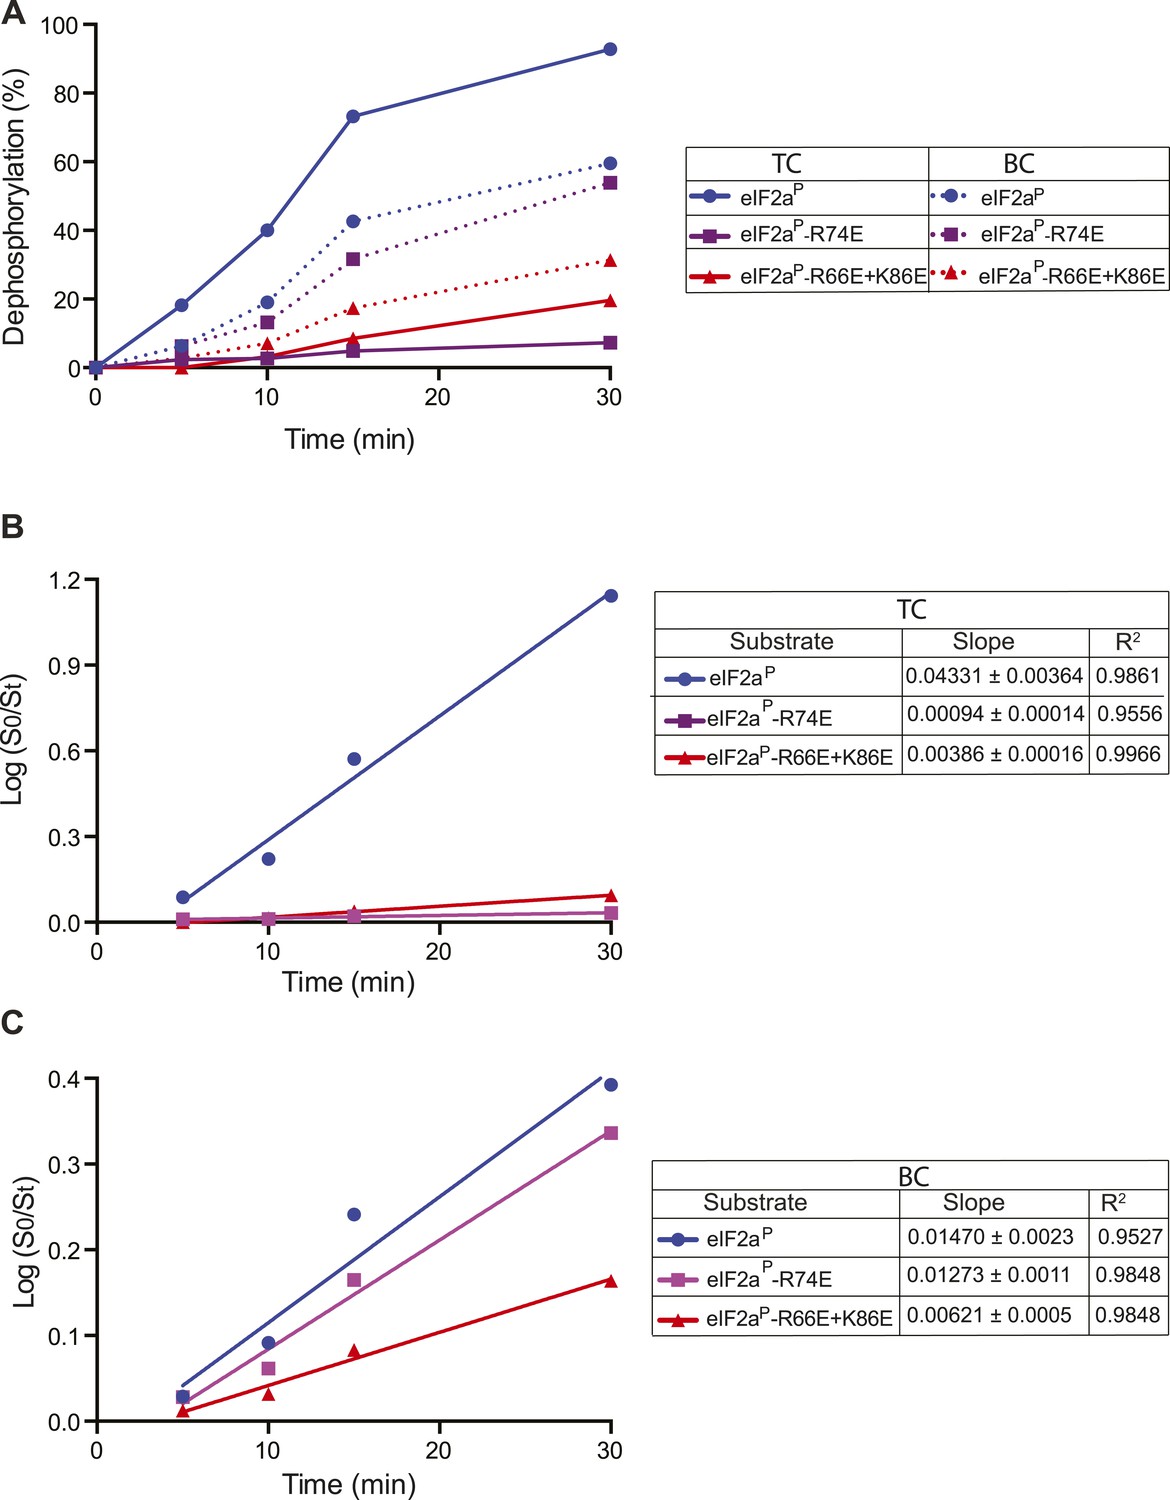
Kinetic analysis of dephosphorylation reactions shown in Figure 8B.
(A) Plot of time-dependent dephosphorylation of the indicated substrates by the PPP1R15B-MBP-PP1-actin ternary complex (TC) and the PPP1R15B-MBP-PP1 binary complex (BC). (B) Plot of the logarithm of the time-dependent change in ratio of substrate concentration at t = 0 to the substrate concentration at t [log(S0/St)] from dephosphorylation of the indicated substrates by the PPP1R15B-MBP-PP1-actin ternary complex (TC). The slope (mean ± SD), indicative of the relative enzyme velocity, and the linear regression coefficient of the different reactions are noted. (C) Dephosphorylation of the indicated substrates by PPP1R15B-MBP-PP1- binary complex (BC), analyzed as in ‘B’ above.
Author response image 1
Tables
Table 1
Structure parameters
| PP1G-PPP1R15B(631–660) | PP1G-PPP1R15B(631–669) | PP1G-PPP1R15B(631–684) | PP1G-PPP1R15B(631–701)-actin | |
|---|---|---|---|---|
| Data collection | ||||
| Synchrotron beamline | Diamond I02 | Diamond I02 | Diamond I03 | Diamond I04-1 |
| Space group | P21212 | P21212 | P41212 | C121 |
| Cell dimensions | ||||
| a,b,c; Å | 66.8, 67.89, 156.38 | 67.01, 67.86, 156.75 | 67.54, 67.54, 158.01 | 103.9, 149.9, 318.7 |
| α, β, γ; ⁰ | 90, 90, 90 | 90, 90, 90 | 90, 90, 90 | 90, 91.03, 90 |
| Resolution, Å | 51.26-1.61 (1.65-1.61) | 33.94-1.55 (1.58-1.55) | 51.34-1.85 (1.89-1.85) | 82.79-7.88 (8.08-7.88) |
| Rmerge | 0.084 (0.807) | 0.097 (0.737) | 0.094 (0.982) | 0.142 (0.680) |
| Rmeas | 0.101 (0.956) | 0.12 (0.927) | 0.107 (1.118) | 0.199 (0.953) |
| <I/σ (I)> | 12.5 (3.0) | 7.4 (1.8) | 9.7 (1.5) | 7.2 (1.6) |
| CC1/2 | 0.997 (0.746) | 0.995 (0.685) | 0.998 (0.914) | 0.980 (0.627) |
| Completeness, % | 99.8 (100) | 92.6 (99.9) | 100 (100) | 98 (99.2) |
| Redundancy | 6.3 (6.7) | 5.1 (4.9) | 7.8 (8.2) | 3.4 (3.5) |
| Refinement | ||||
| Rwork | 0.176 | 0.172 | 0.176 | 0.370 |
| Rfree | 0.203 | 0.203 | 0.222 | 0.400 |
| No. of reflections | 92584 | 96347 | 32078 | 5111 |
| No. of atoms | 5493 | 5701 | 2662 | 28185 |
| Average B-factors | 24.4 | 25.2 | 45.2 | 334 |
| Metal ion occupancies | Chain A: M2 0.95 | Chain A: M2 0.79 | Chain A: M2 0.76 | n/a |
| M1 0.25 | ||||
| Chain C: M2 0.99 | Chain C: M2 0.90 | |||
| M1 0.22 | ||||
| rms deviations | ||||
| Bond lengths (Å) | 0.006 | 0.006 | 0.011 | 0.0097 |
| Bond angles (⁰) | 1.044 | 1.054 | 1.221 | 1.271 |
| Ramachandran favoured region, % | 96.6 | 96.4 | 96.8 | 97.2 |
| Ramachandran outliers, % | 0 | 0 | 0 | 0 |
| MolProbity score(percentile) | 1.23 (98%) | 1.2 (98%) | 1.22 (98%) | 1.58 (100%) |
| PDB code | 4V0V | 4V0W | 4V0X | 4V0U |
Additional files
-
Supplementary file 1
List of the plasmids used in this study, their unique lab identifier, lab name, description, PMID of the relevant reference (if available), figure in which they first appear and cognate label in figure legend.
- https://doi.org/10.7554/eLife.04871.026
Download links
A two-part list of links to download the article, or parts of the article, in various formats.
Downloads (link to download the article as PDF)
Open citations (links to open the citations from this article in various online reference manager services)
Cite this article (links to download the citations from this article in formats compatible with various reference manager tools)
G-actin provides substrate-specificity to eukaryotic initiation factor 2α holophosphatases
eLife 4:e04871.
https://doi.org/10.7554/eLife.04871


