Evolving a 24-hr oscillator in budding yeast
- Harvard University, United States
Figures
Figure 1 with 1 supplement
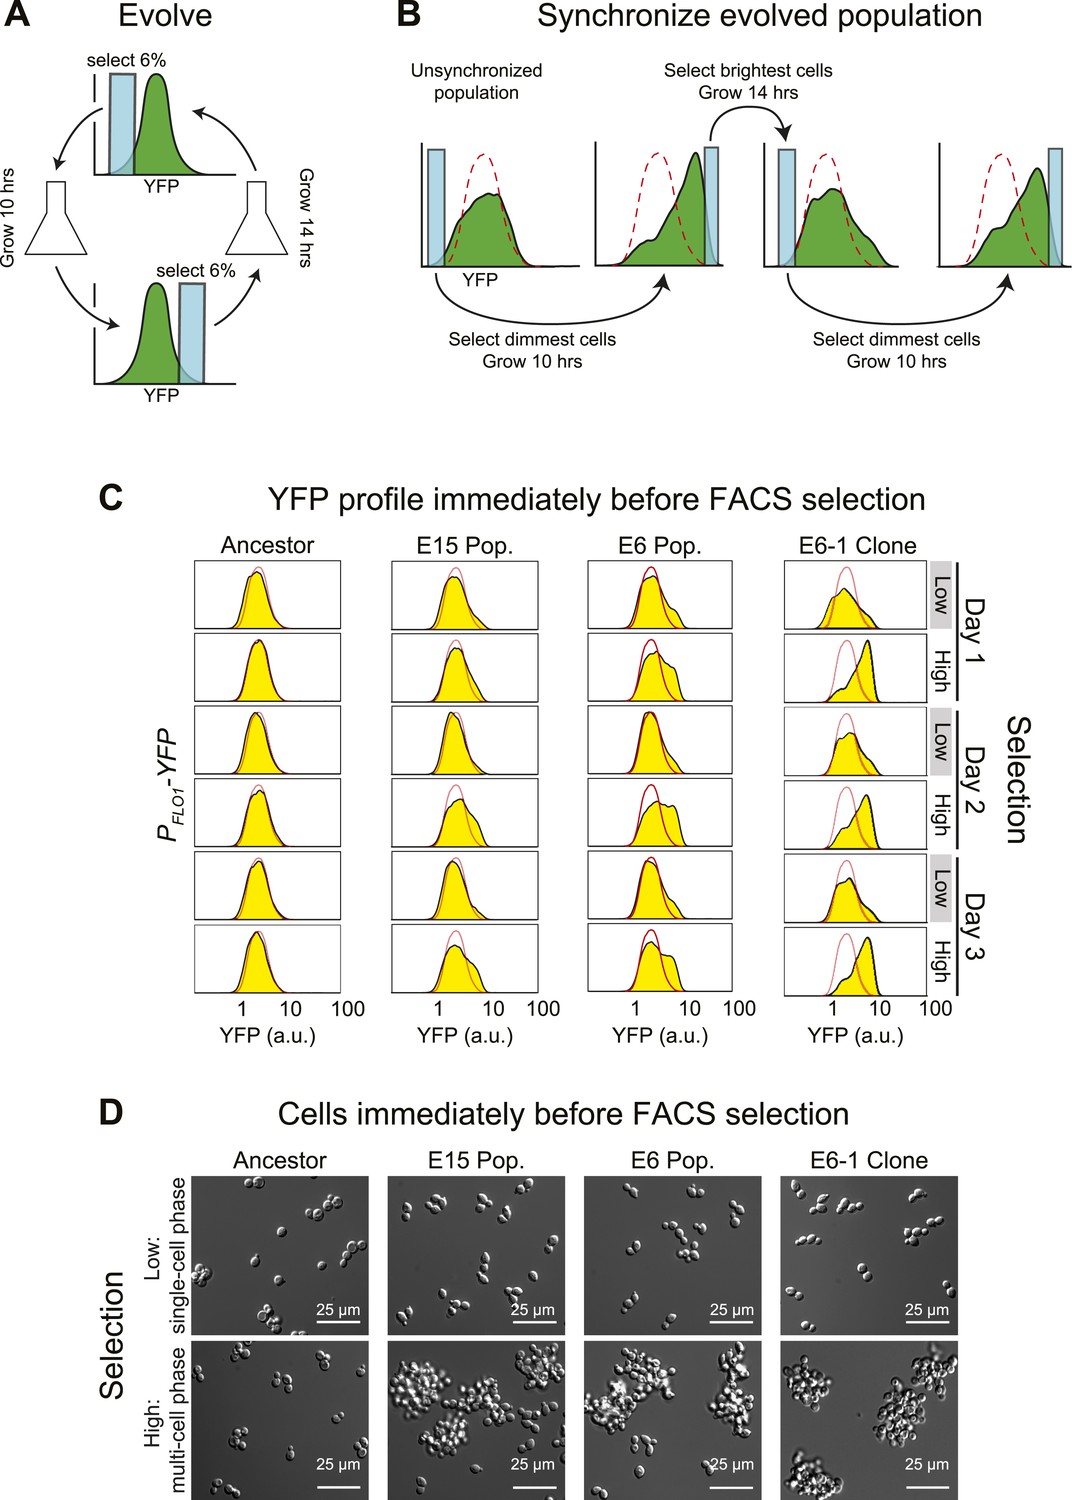
Cell association clock evolves from selecting for high and low YFP expression.
(A) Selection scheme for a 24-hr oscillator: cells were collected from the dimmest 6% (E6) of the distribution of YFP fluorescing events, grown exponentially at <1 × 10⁶ cells/ml for ∼10 hr and then the brightest 6% of events were collected and the cells in this population were grown for ∼14 hr at <1 × 10⁶ cells/ml. The selection cycle was repeated for 30 days. The E15 population was evolved in the same manner, but the dimmest and brightest 15% of events were collected in the two phases of the selection. (B) Scheme for synchronizing YFP oscillations from an unsynchronized population: the dimmest events from an unsynchronized population (blue box) are collected, thus selecting for cells at the single cell phase of the oscillation. After 10 hr of growth, distributions are first recorded and the brightest YFP events (clump of cells) are collected, grown for 14 hr, distributions are recorded again and the dimmest events are selected to complete the cycle. This cycle is repeated to keep the population maximally synchronized. The dashed red lines represent the fluorescence distribution of the ancestral population. (C) Representative density plots showing oscillations in YFP fluorescence of a FACS-synchronized sample of the E6 and E15 populations after terminating the selection, and a clone isolated from E6 (E6-1). The red outline overlay shows the average ancestral distribution. (D) Representative DIC images of synchronized populations immediately before FACS selection for low (single-cell phase) and high (multi-cell phase) YFP fluorescence.
Figure 1—figure supplement 1
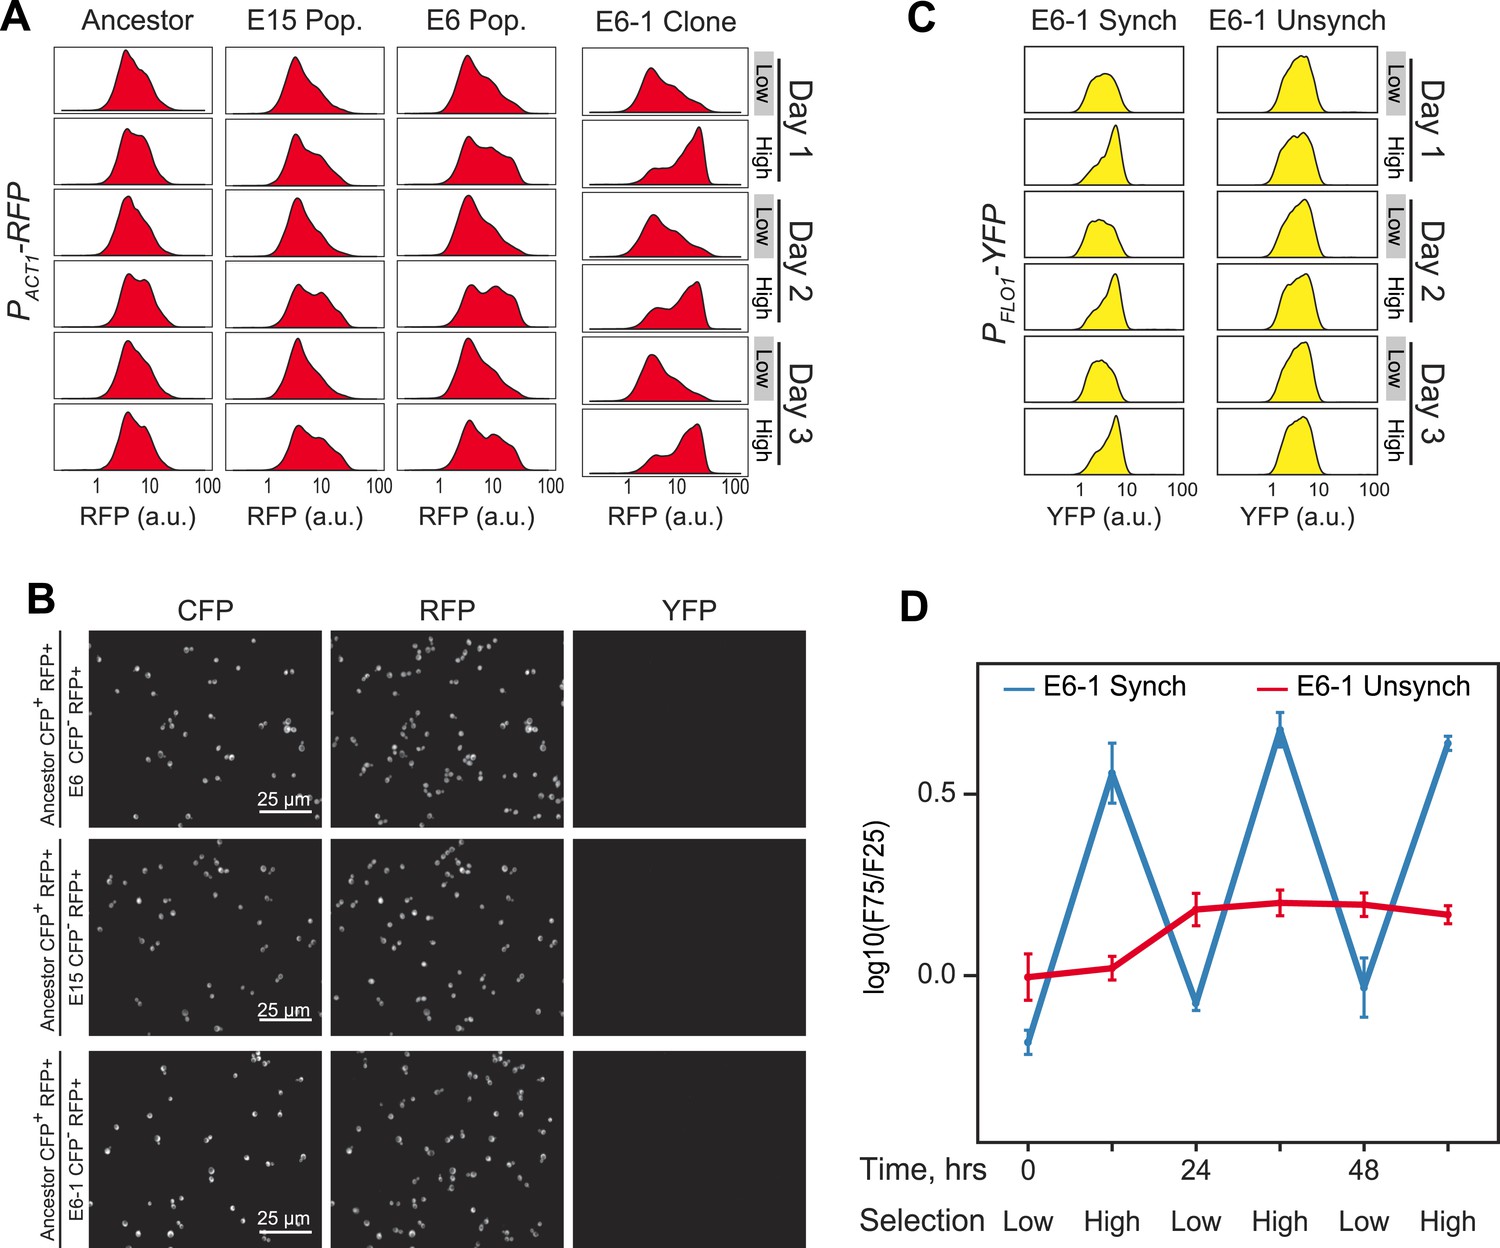
Evolution of 24-hr cell aggregation clock.
(A) Representative density plots showing RFP oscillations of a FACS-synchronized sample of the final E6/E15 populations and a clone isolated from E6 (E6-1). (B) Ancestor cells expressing cerulean fluorescent protein (CFP+) were mixed with the populations E6, E15 and the clone E6-1 (none of which expressed CFP, (CFP−)), sonicated to single cells, and imaged. There are no detectable changes in YFP or RFP levels, per cell, between ancestral and evolved populations. YFP cannot be detected by microscopy in any strain. (C) Representative YFP density plots of E6-1 cells either synchronized by FACS (synch) or passaged through the FACS by collecting cells from the entire YFP distribution (unsynch) at identical 10 and 14-hr intervals for 3 days. (D) Oscillations were quantified by calculating the log(F75/F25) ratio of synchronized and unsynchronized cultures of E6-1. See Figure 3A for a definition of the F75:F25 ratio.
Figure 2 with 1 supplement
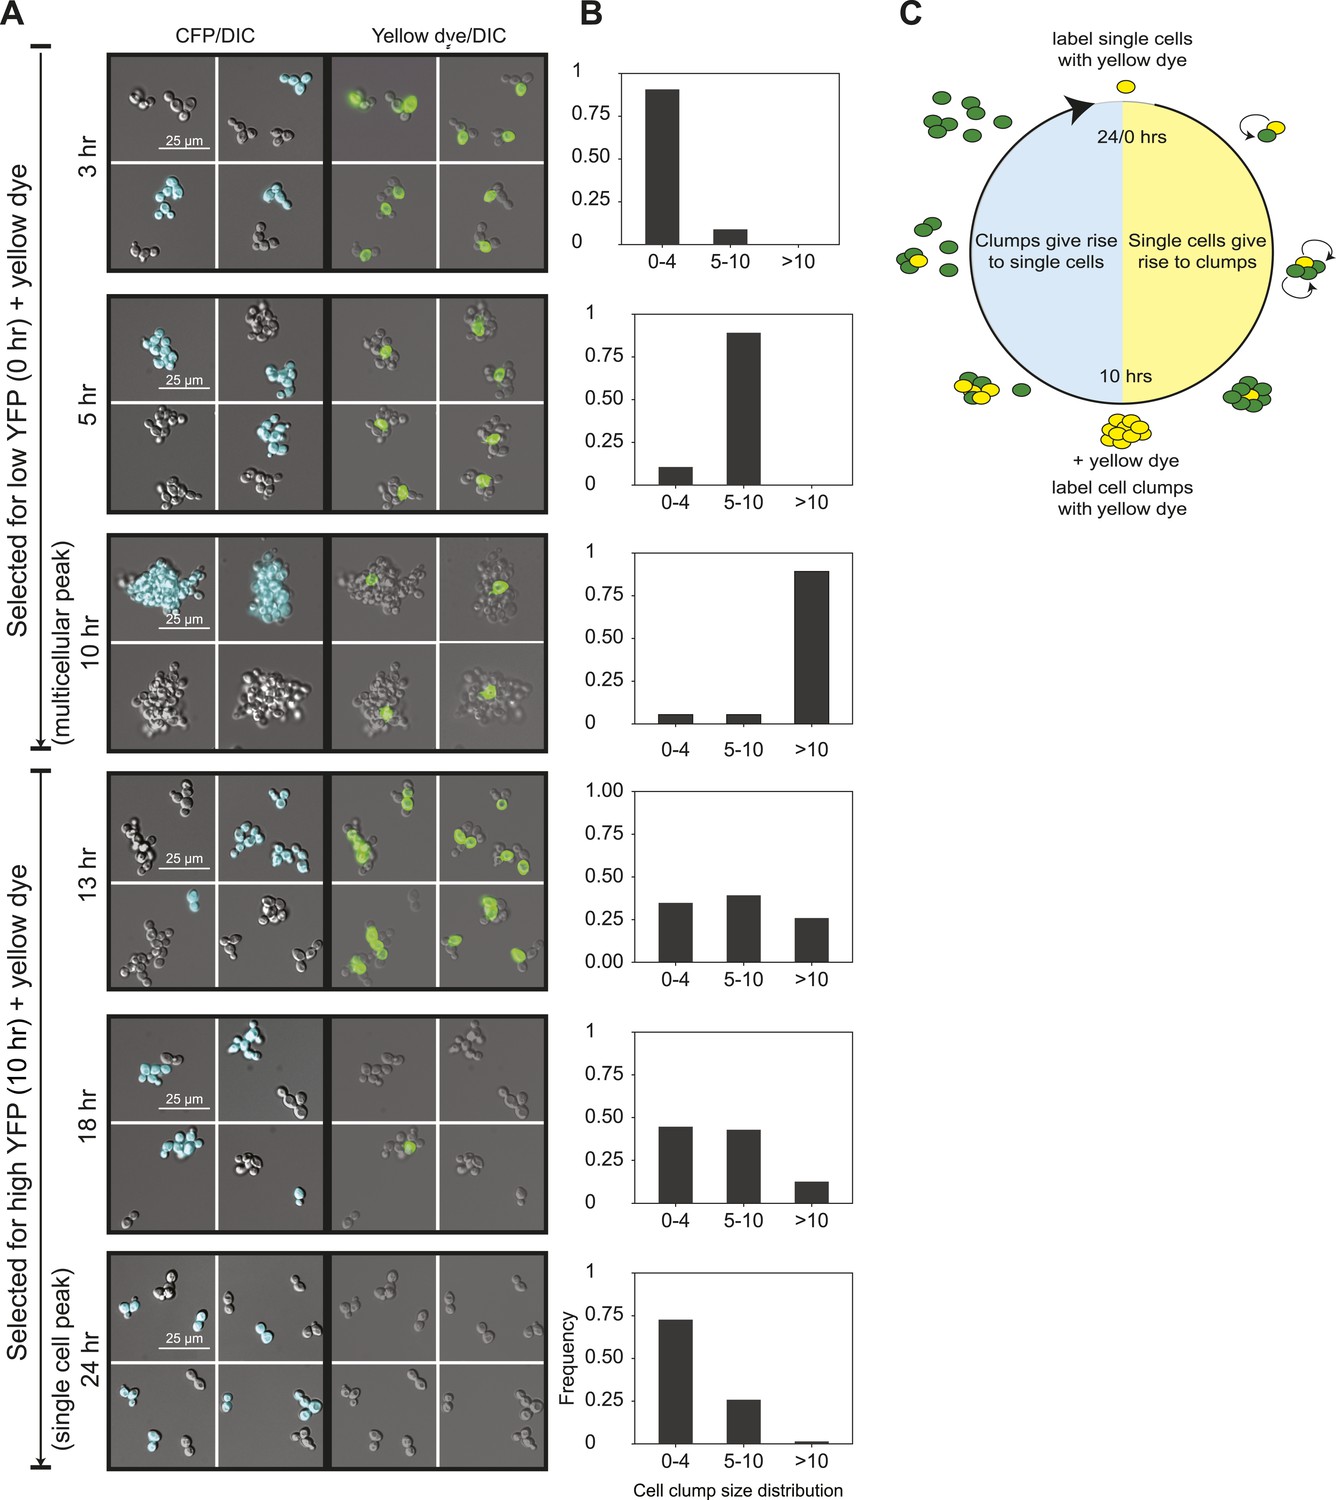
24-hour autonomous oscillations in dynamic aggregate assembly.
(A) Representative images of a synchronized E6-1 population at different points through the 24-hr cycle. The experiment contained two genetically similar subclones, one expressing cerulean fluorescent protein (CFP+) and the other not (CFP−). After FACS selection (0 and 10 hr) cell walls were covalently labeled with Oregon Green 488-x N-hydroxy succinimidyl ester, making them fluoresce brightly. Yellow-labeled single cells give rise to the multicellular phase by sticking to their daughters and clumps of different lineages do not mix (i.e., there are no CFP clumps with both CFP+ and CFP− cells). Labeled clumps give rise to single cells and smaller clumps by clump fragmentation and producing single-celled daughters. Time scale is in reference to the initial collection of single cells (Low YFP selection, T = 0 hr) over a 24-hr period. (B) The population from the experiment described in (A) was quantified by calculating the frequency of clumps containing 1–4, 5–10, and >10 cells. There is a synchronous rise in clump size during the transition from single cells to clumps and a gradual decay of clump sizes during the transition from clumps to single cells. (C) Schematic representation of oscillator dynamics: single cells give rise to the multicellular phase by sticking to their progeny to form a lineage-based clump. At the peak multicellular phase, clumps give rise to the single cell phase by fragmentation and producing single-celled daughters some of which adhere to their progeny to produce small clumps.
Figure 2—figure supplement 1
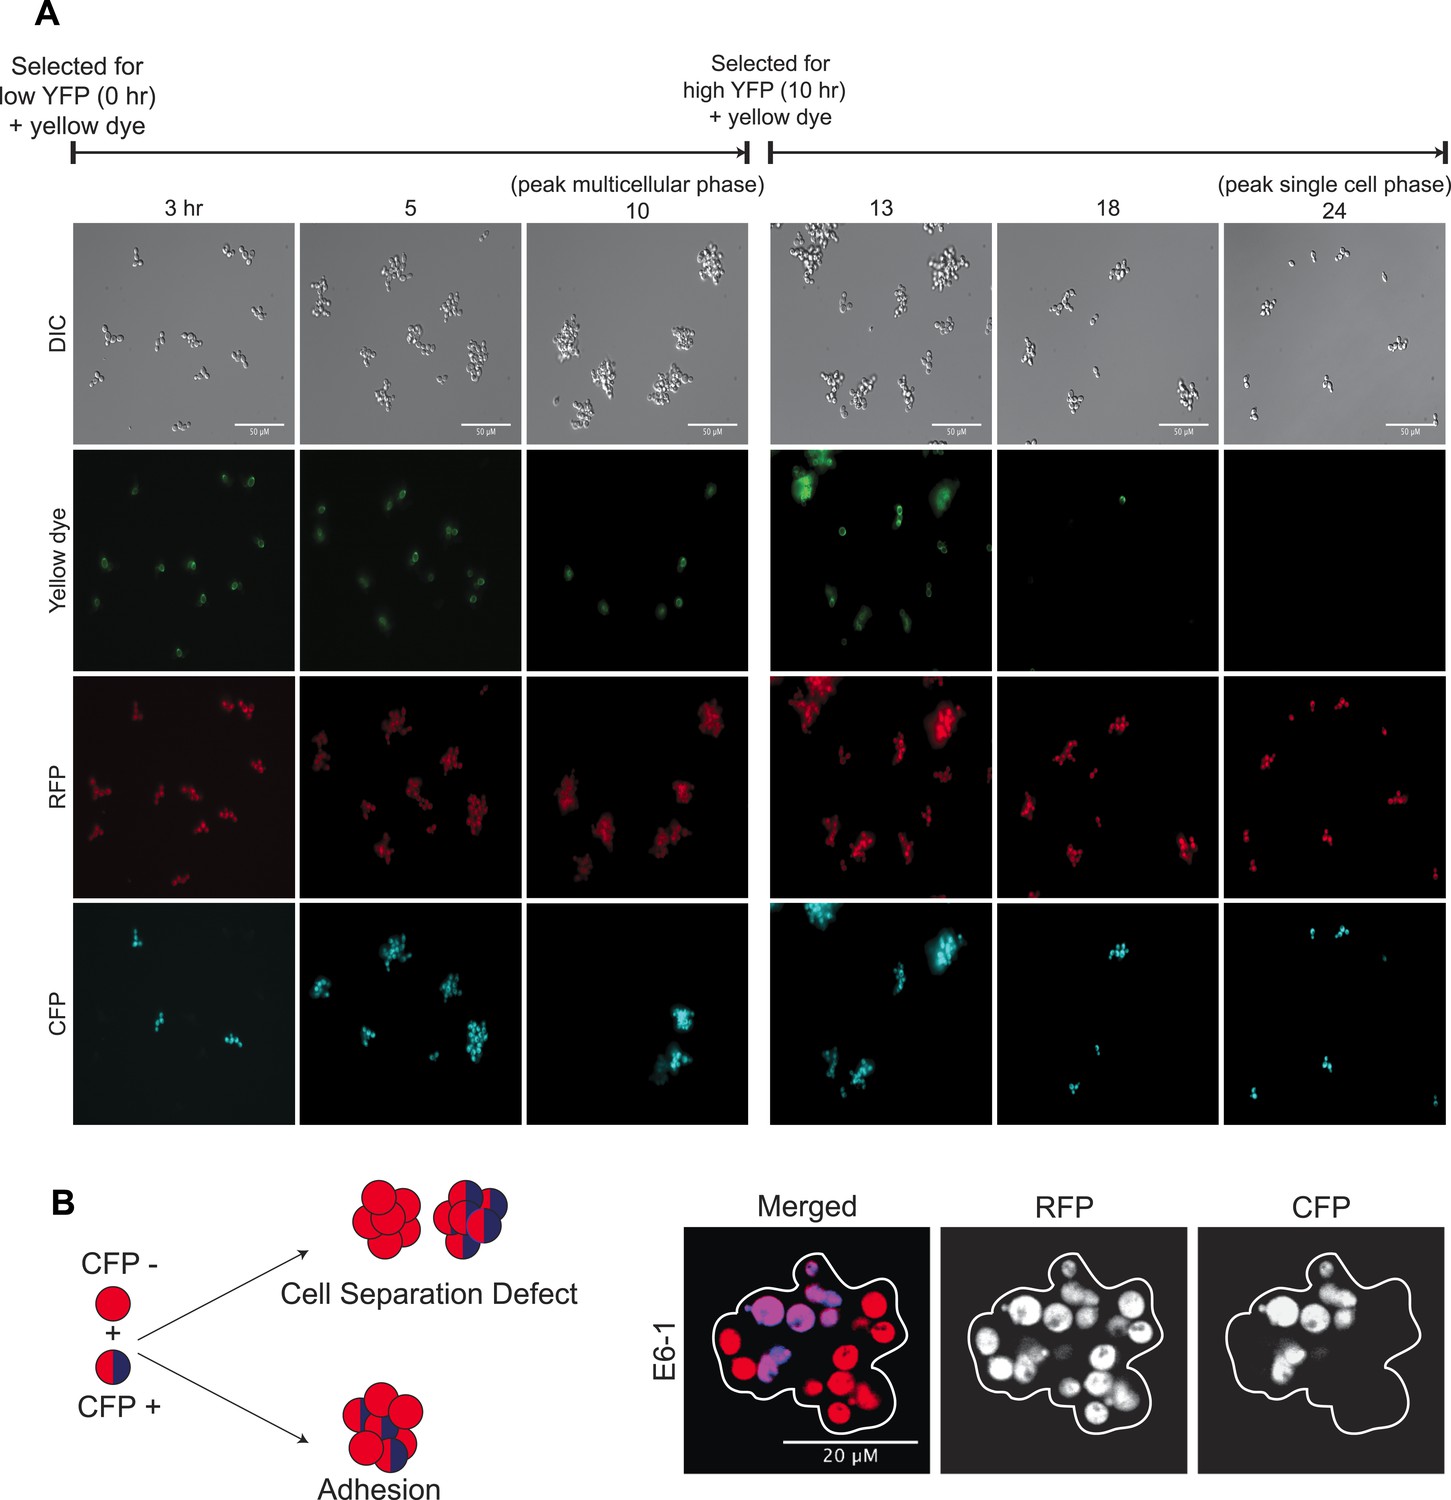
Dynamics of oscillator aggregate assembly.
(A) Low magnification images of synchronized E6-1 cultures that contained two subclones, one labeled with CFP (CFP+) and one without CFP (CFP−). Single cells that were selected as dim events by FACS and whose cell walls were labeled with Oregon green 488-X assemble a lineage-based clump and do not adhere to other cell lineages (i.e., no CFP (+/−) clumps) (left panels). At the peak multicellular phase, clumps were labeled with Oregon green 488-X and followed. These cells give rise to the single cell stage by fragmenting and producing non-adherent daughters so that the majority of the population is single celled by the end of the complete, 24-hr cycle (right panels). (B) Schematic of the mixing experiment performed by mixing, sonicating, and incubating asynchronous CFP+ and CFP− populations: cell separation defects will result in single colored clumps but adhesive cells will stick non-specifically to each other and produce clumps containing cells of both colors. Representative image of a single clump (white outline) showing E6-1 cells form clumps by adhering to each other.
Figure 3
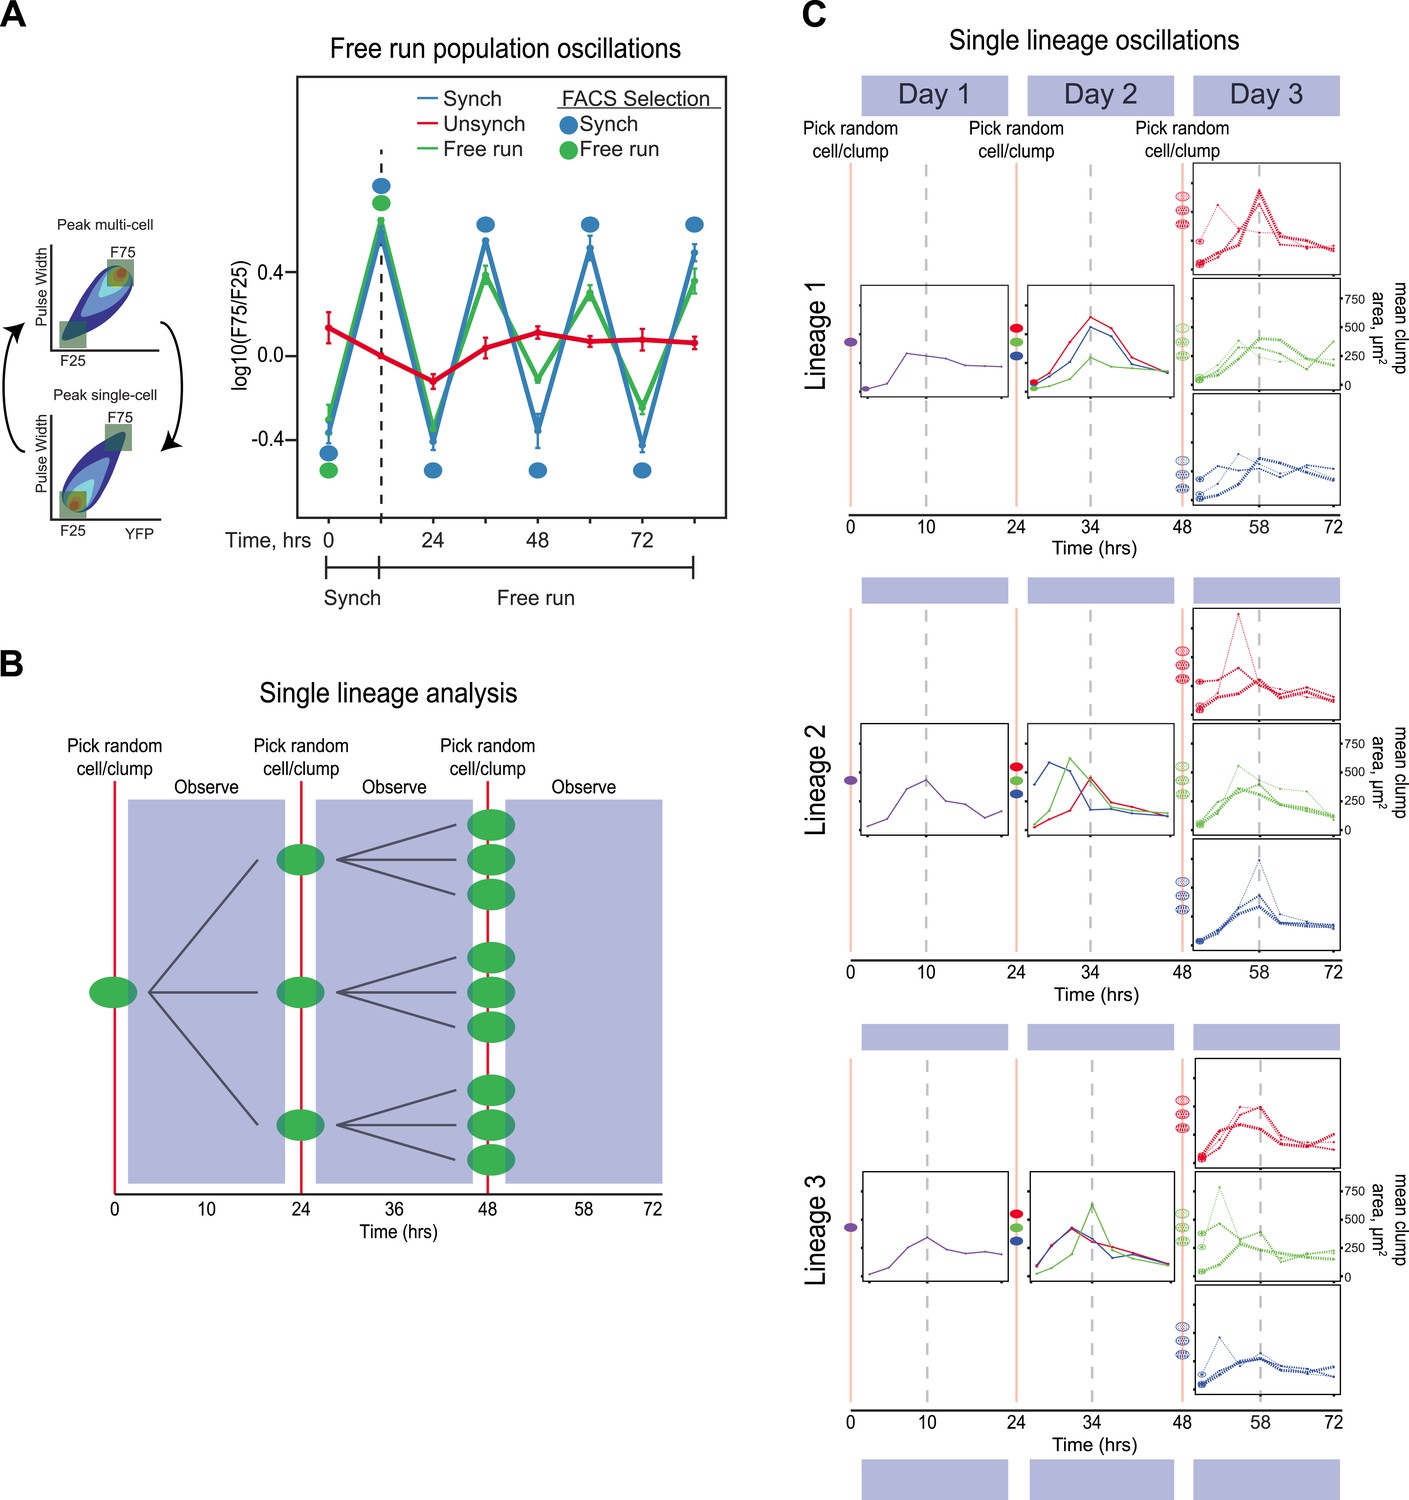
The evolved oscillator free runs for at least three cycles.
(A) Three populations were compared. (1) Unsynchronized: cells that had been passaged without earlier synchronization were passed through the FACS machine and diluted twice every 24 hr, with intervals of 10 and 14 hr between the two dilutions, but all cells that passed through the FACS machine were collected, regardless of their fluorescence level and then diluted. (2) Synchronized: a population was synchronized by selection for 3 days with selection at alternating 10 and 14 hr intervals. The culture was synchronized by FACS for another 3 days, by FACS selection and dilution twice every 24 hr, with intervals of 10 and 14 hr between the two dilutions. (3) Free run: a population was synchronized by selection for 3 days at 10:14 hr intervals. After 3 days of synchronization (marked by a dotted line), this culture was not subject to FACs but was simply diluted twice every 24 hr, with intervals of 10 and 14 hr between the two dilutions for an additional 3 days. All populations were diluted to ensure the population always reached the same final, pre-dilution density of ∼ 3 × 10⁵ cells/ml, well below the density that corresponds to the end of mid-log phase growth for budding yeast (3 × 10⁷ cells/ml). The initial, synchronized population used to start the free run was the same one that was used to start the population with continuing synchronization (Synch). The measured variable, F75/F25 is based on the distribution of fluorescence and pulse widths at each time point. For both measurements, the lowest value is set to 0% and the highest to 100%, with values scaled linearly in between and the number of events that lie between 0 and 25% for both fluorescence intensity and pulse width is counted as F25, and the number of events that lie between 75 and 100% for both fluorescence intensity and pulse width is counted as F75, and we plot log(F75/F25). (B) Schematic of the protocol for analyzing individual lineages. A single cell is deposited in a microtiter well, and its progeny are observed every 3.5 hr for 24 hr, before taking 3 objects randomly (single cells or cell clumps), and depositing them in fresh wells, observing for 24 hr, and finally taking 3 objects randomly (cells or cell clumps), from each of the three wells and depositing them in fresh wells, and observing for 24 hr. (C) Individual traces of lineages originating from three separate cells (Lineage 1, 2, 3). An unsynchronized population was used to establish lineages that arose from single cells, which were diluted once every 24 hr and never experienced any FACS synchronization. A single cell was placed in 100 µl of medium in a microtiter well and allowed to proliferate for 24 hr that corresponds to a maximum of 16 divisions, a 64,000-fold increase in cell density from 10 cells/ml to 640,000 cells/ml, more than 40-fold below the density at which the exponential rate of cell proliferation starts to fall. Individual cells and clumps were imaged every 3.5 hr for 72 hr. At each time point, at least 50% of the cells and clumps in the wells were imaged and the average two-dimensional area was calculated. All lineages produce approximately 24-hr oscillations without any FACS-based synchronization. Some lineages alter their phase but continue to produce ∼24-hr oscillations.
Figure 4
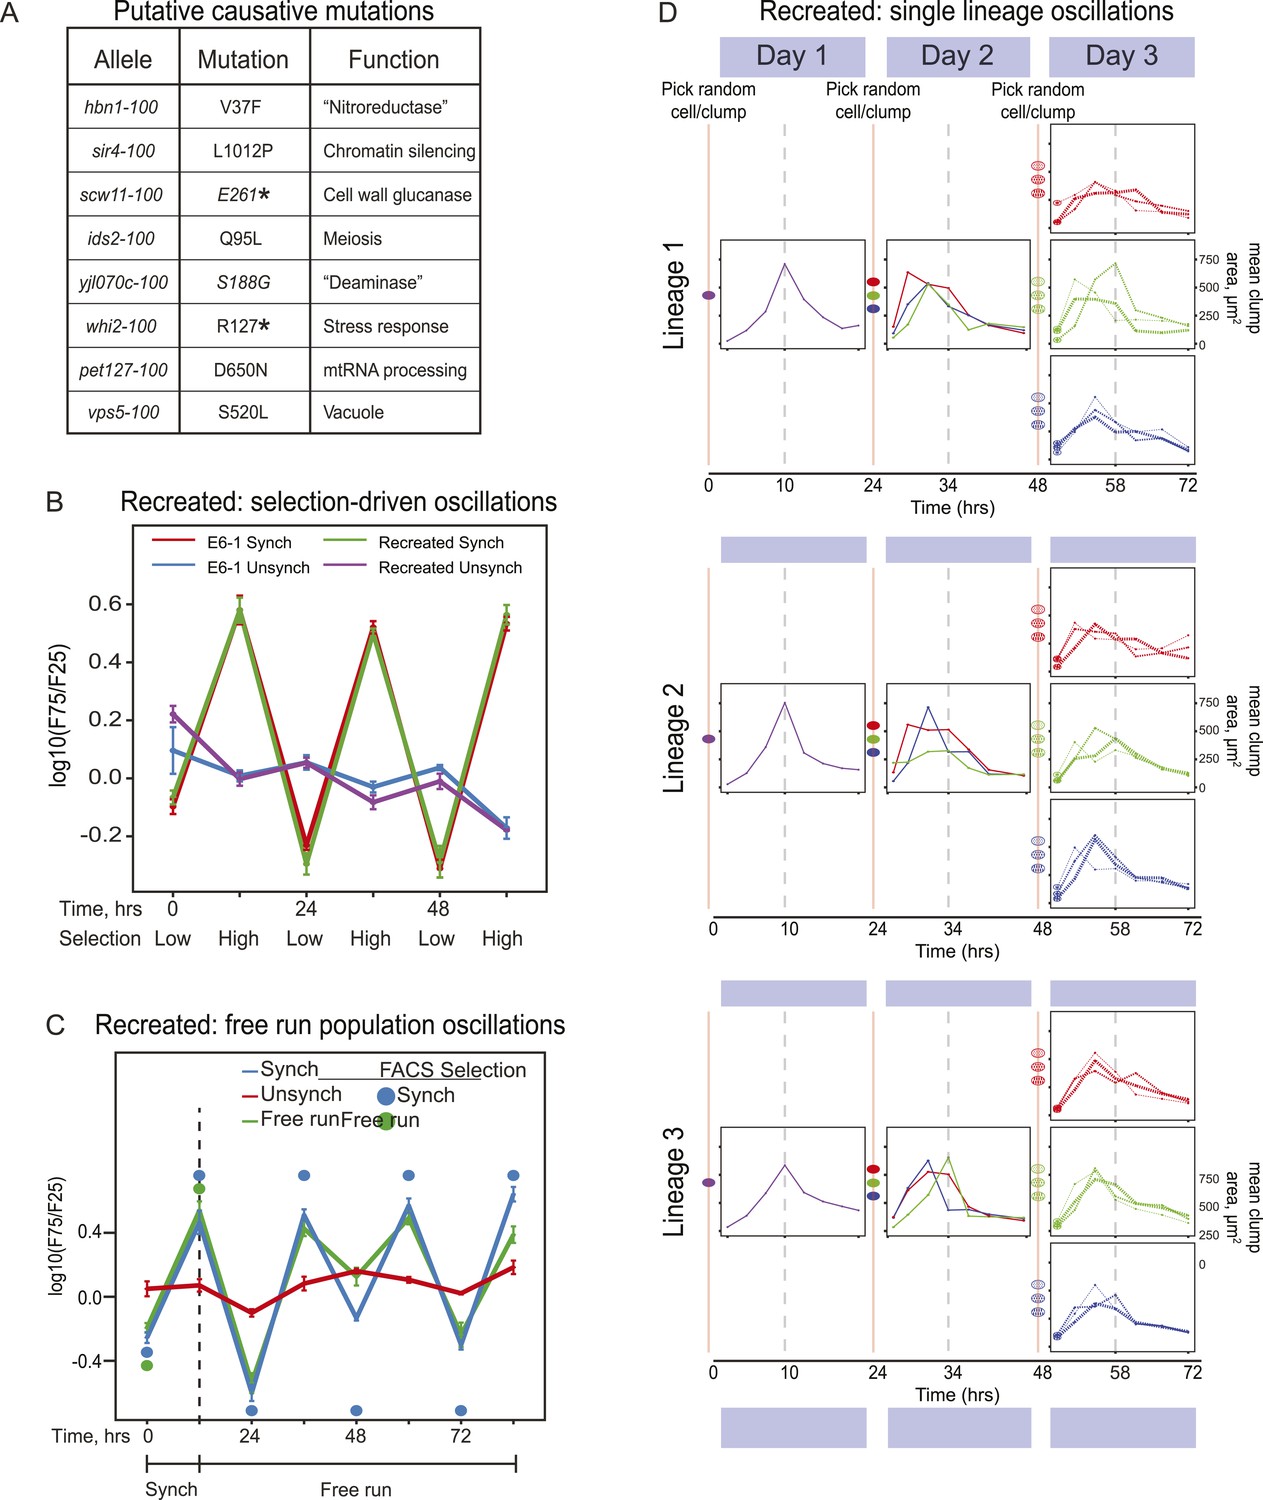
Reconstruction of an evolved oscillator (E6-1).
(A) Table of putative causal mutations. The mutations lie in the coding regions of the genes, and the allele number indicates the amino acid substitution that results. An asterisk denotes creation of a stop codon before the midpoint of the open reading frame. (B) The eight putative causal mutations were engineered into a wild type laboratory strain (Recreated), which was synchronized and its oscillations were compared to the evolved E6-1 clone by plotting the log(F75/F25), as explained in the legend to Figure 3A. (C) The recreated strain shows a similar ability to oscillate without selection as the evolved clone E6-1. Both cultures were synchronized by FACS for 3 days (only the last cycle is shown) and then allowed to free run by growing them exponentially at a constant temperature in the dark. (D) Individual lineages produce 24-hr oscillations in the absence of FACS-synchronization when subjected to the protocol described in Figure 3B.
Figure 5 with 1 supplement
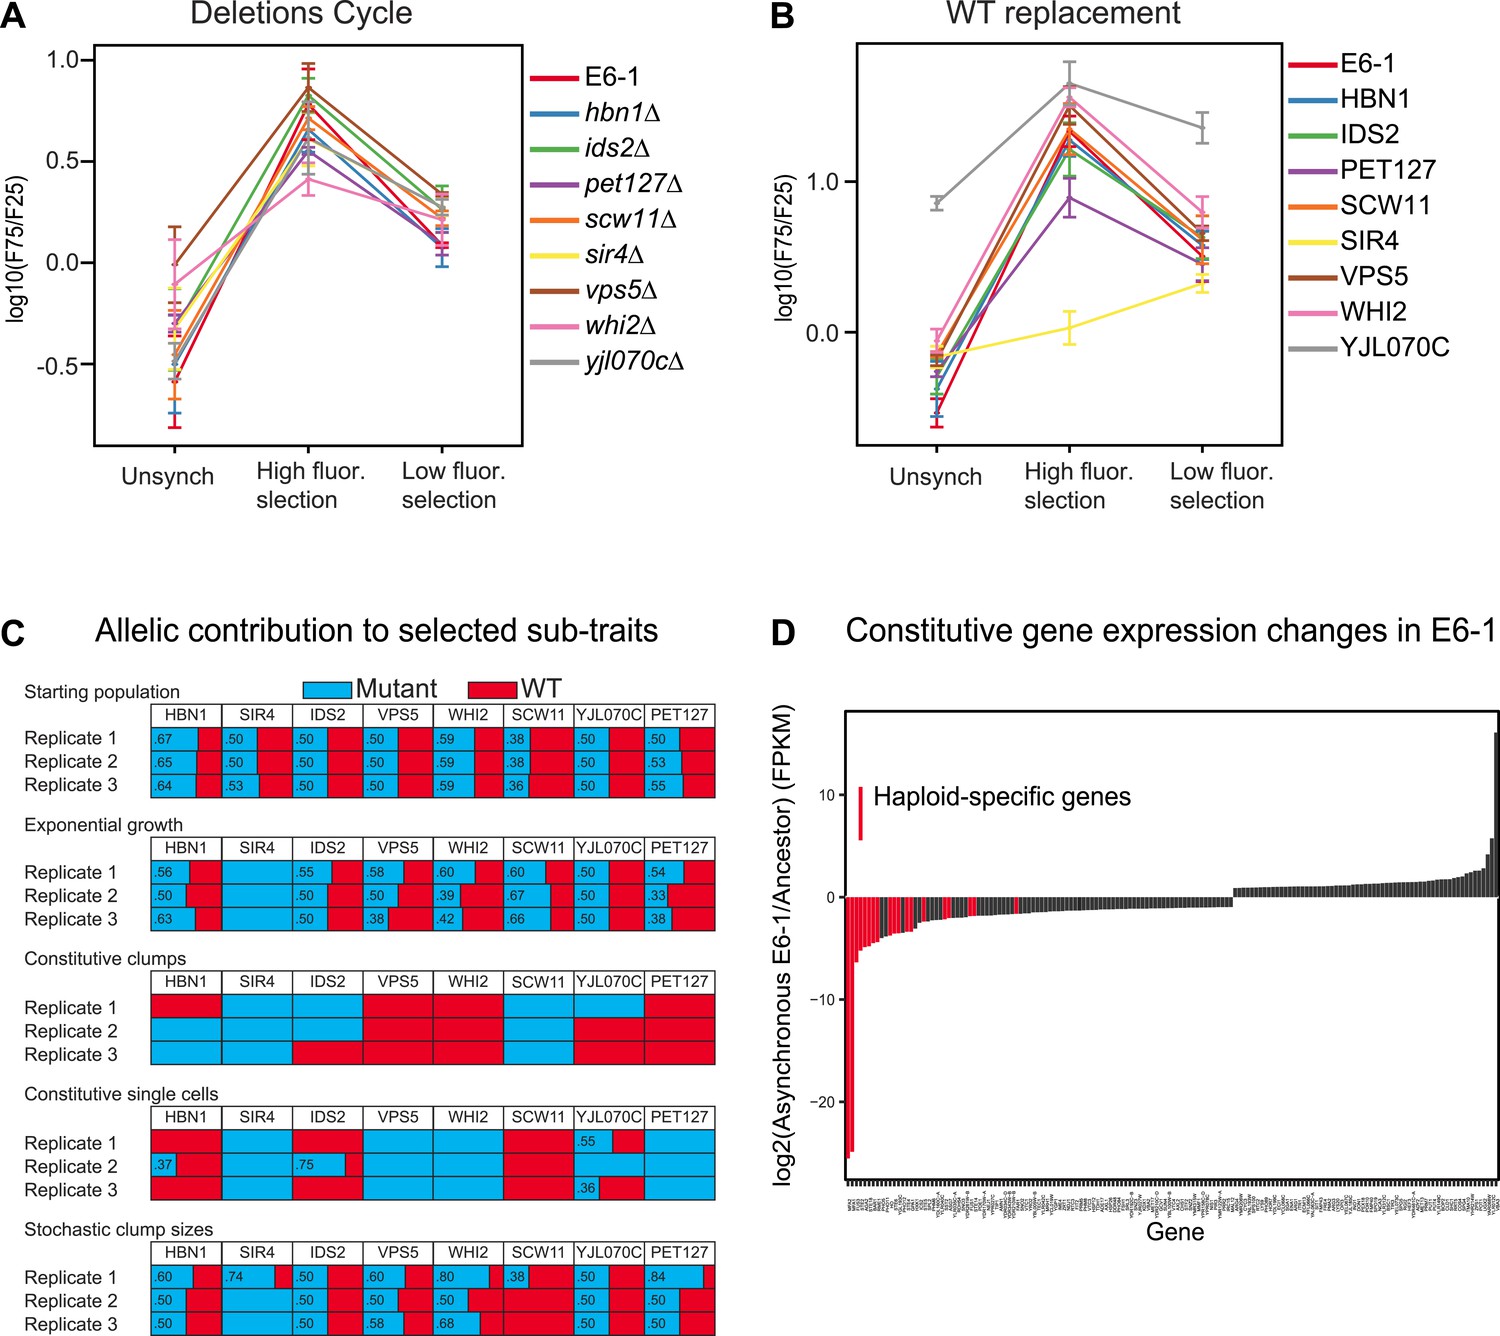
Analysis of putative causal mutations.
(A) Genes containing causal mutations were individually deleted in E6-1 and tested for oscillations after applying the standard synchronization protocol to an unsynchronized culture. The metric for oscillation, F75/F25 is described in the legend to Figure 3A. (B) E6-1 strains containing a wild type copy (WT) of the indicated gene, at the LEU2 locus, and deletion of the mutant allele from its endogenous locus were tested for oscillations after applying the standard synchronization protocol to an unsynchronized culture. (C) Effect of different mutant alleles on oscillator subtraits. The recreated strain was crossed to the ancestor to generate a pool of spores carrying all possible combinations of the wild type and evolved alleles at the genes that harbored putative causal mutations in clone E6-1. After selection, genomic DNA from the surviving spores was purified and the eight loci were PCR amplified and Sanger sequenced to estimate the relative frequency of the wild type and mutated alleles. (D) Gene expression changes in clone E6-1, relative to its ancestor. Six asynchronous E6-1 samples were analyzed as replicates against six aggregated ancestor samples. Haploid-specific genes (hsg), shown in red, are amongst the most repressed genes of E6-1. Overexpressed genes in the E6-1 are distributed among a variety of cellular processes. Data reported as the log2 ratio of E6-1 and ancestor fragments per kilobase per million fragments mapped (FPKM).
-
Figure 5—source data 1
Gene expression changes in clone E6-1, relative to its ancestor.
- https://doi.org/10.7554/eLife.04875.010
Figure 5—figure supplement 1
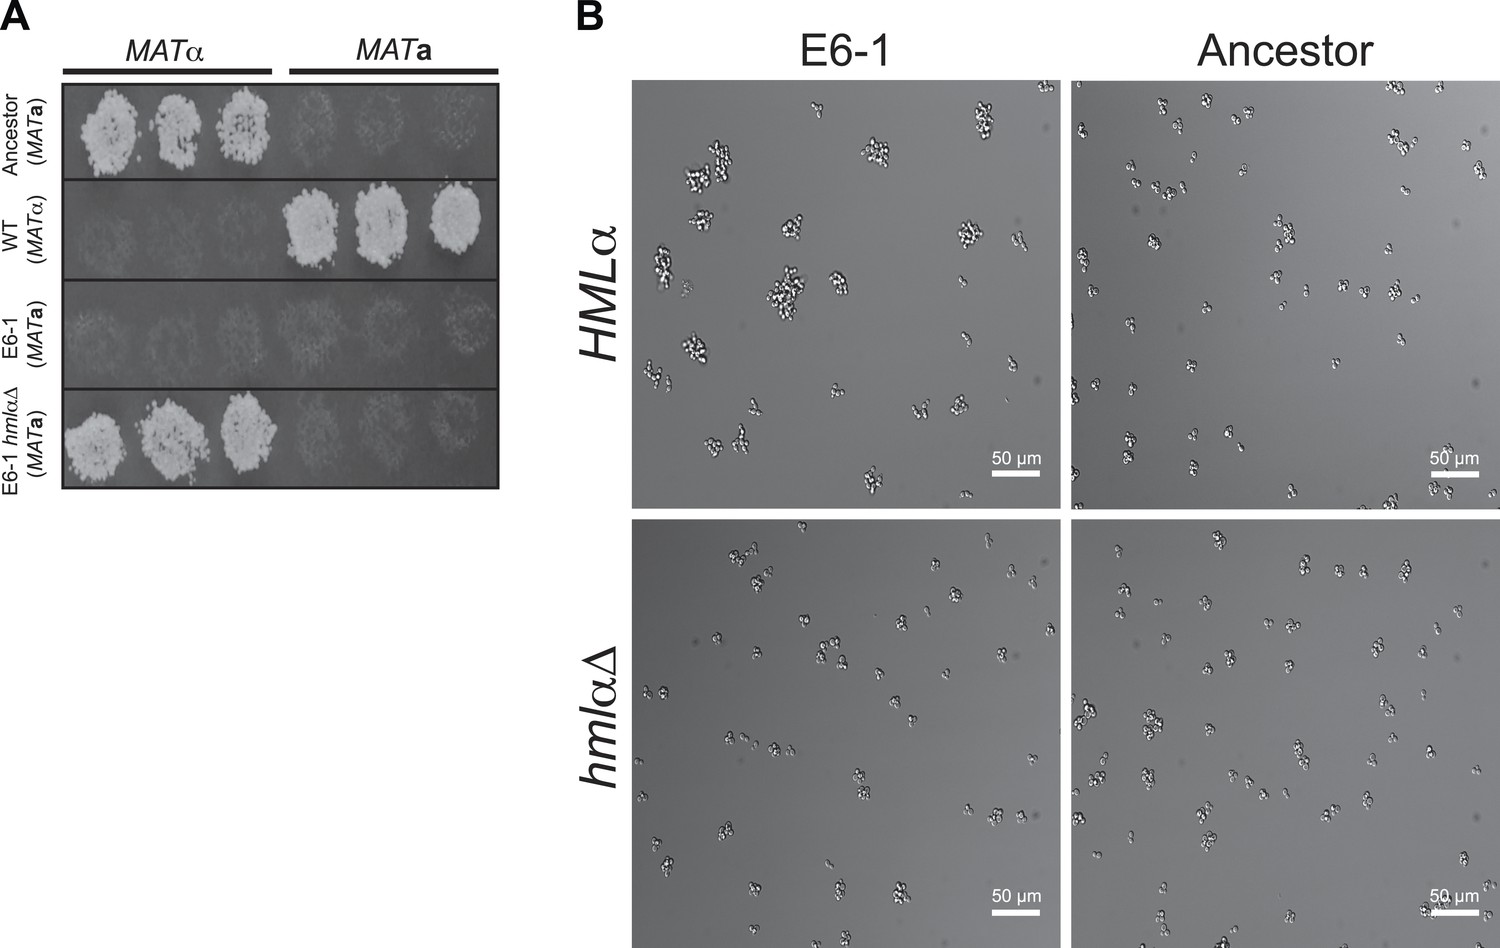
Restoration of haploid gene expression abolishes E6-1 aggregates.
(A) Mating competency was used as a proxy for expression of haploid specific genes. Strains were crossed to MATa or MATα tester strains and replica-plated to media that selects for successful mating. E6-1 cannot mate because it has lost haploid-gene expression but deletion of HMLα (hmlαΔ) restores haploid gene expression as assayed by restored mating ability. (B) Representative DIC images of unsynchronized populations. Deletion of HMLα in E6-1 reduces the frequency of large multicellular aggregates to a level indistinguishable from the ancestor.
Figure 6
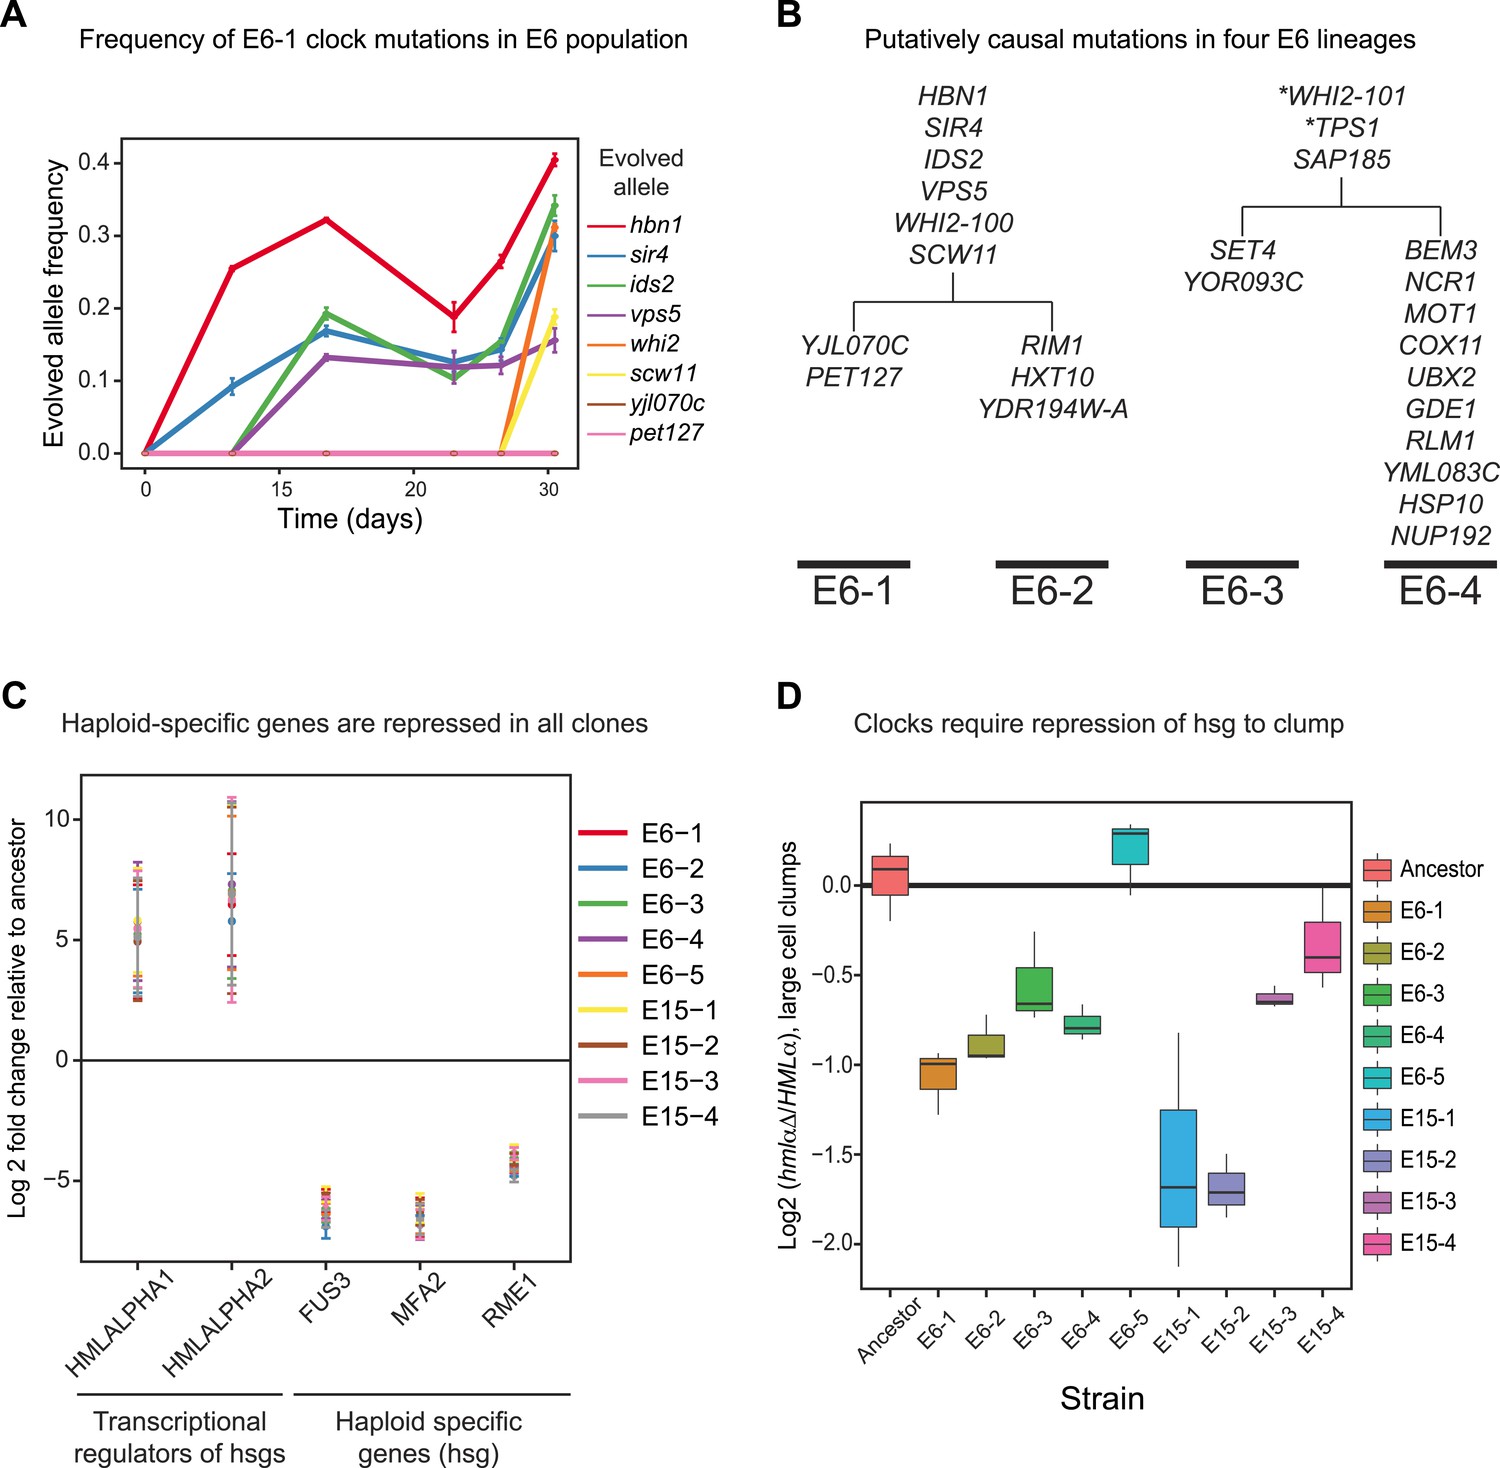
Genetically distinct clones evolve same oscillator through similar molecular changes.
(A) The frequencies of the causal mutations found in E6-1 were measured by Sanger sequencing a region surrounding each mutation from frozen stocks of the E6 population taken at the indicated times during the experimental evolution. The frequencies of yjl070c-S188G and pet127-D650N were too low to measure by Sanger sequencing, whose detection threshold is an allele frequency of 10%. (B) Bulk segregant analysis and whole genome sequencing on three other isolates from the E6 population. Mutations that segregated at frequencies above 0.95 in at least one lineage are listed. All four clones contain a mutation in WHI2, but the mutation in E6-1 and E6-2 is a different allele from that in E6-3 and E6-4. Mutations with asterisks did not segregate above 95% in both lineages: WHI2-101 segregated at 80% in E6-2 and TPS1 segregated at 88% in E6-3. Given the read depth, the probability of producing these deviations from the expected frequency of a non-causal mutation (0.5) by chance is 6 × 10⁻⁵ and 3 × 10⁻⁸, respectively. (C) Quantitative PCR (qPCR) was used to compare the mRNA abundance of the two genes at HMLα, which encodes two regulators of mating type- and haploid-specific gene (hsg) expression, and three representative haploid-specific genes from eight clones (E6-1,2,3,4,5 and E15-1,2,3) to the ancestor. All eight clones have increased gene expression from HMLα and reduced haploid-specific gene expression. (D) The importance of repressing haploid-specific gene expression for the evolved phenotype was assessed by comparing cells that expressed both alleles of the mating type information (HMLα) to cells that expressed only MATa information (hmlαΔ). The frequency of clumps larger than 3 to 4 cells was compared in asynchronous cultures of HMLα and hmlαΔ derivatives of each clone. Four clones from E15 and three from E6 cannot form clumps when HMLα is deleted. E6-5 was unaffected by deletion of HMLα.
-
Figure 6—source data 1
Amino acid change of candidate causal mutations.
(A) Table of the candidate causal mutations identified in clones E6-1,2,3,4 and the resulting amino acid change. (B) The entire WHI2 gene was PCR-amplified, Sanger sequenced, and aligned to the wild type sequence of WHI2 to identify mutations.
- https://doi.org/10.7554/eLife.04875.013
Additional files
-
Supplementary file 1
Table of the strains used and their relevant genotypes.
- https://doi.org/10.7554/eLife.04875.014
Download links
A two-part list of links to download the article, or parts of the article, in various formats.
Downloads (link to download the article as PDF)
Open citations (links to open the citations from this article in various online reference manager services)
Cite this article (links to download the citations from this article in formats compatible with various reference manager tools)
Evolving a 24-hr oscillator in budding yeast
eLife 3:e04875.
https://doi.org/10.7554/eLife.04875


