Native architecture of the Chlamydomonas chloroplast revealed by in situ cryo-electron tomography
- Max Planck Institute of Biochemistry, Germany
Figures
Figure 1
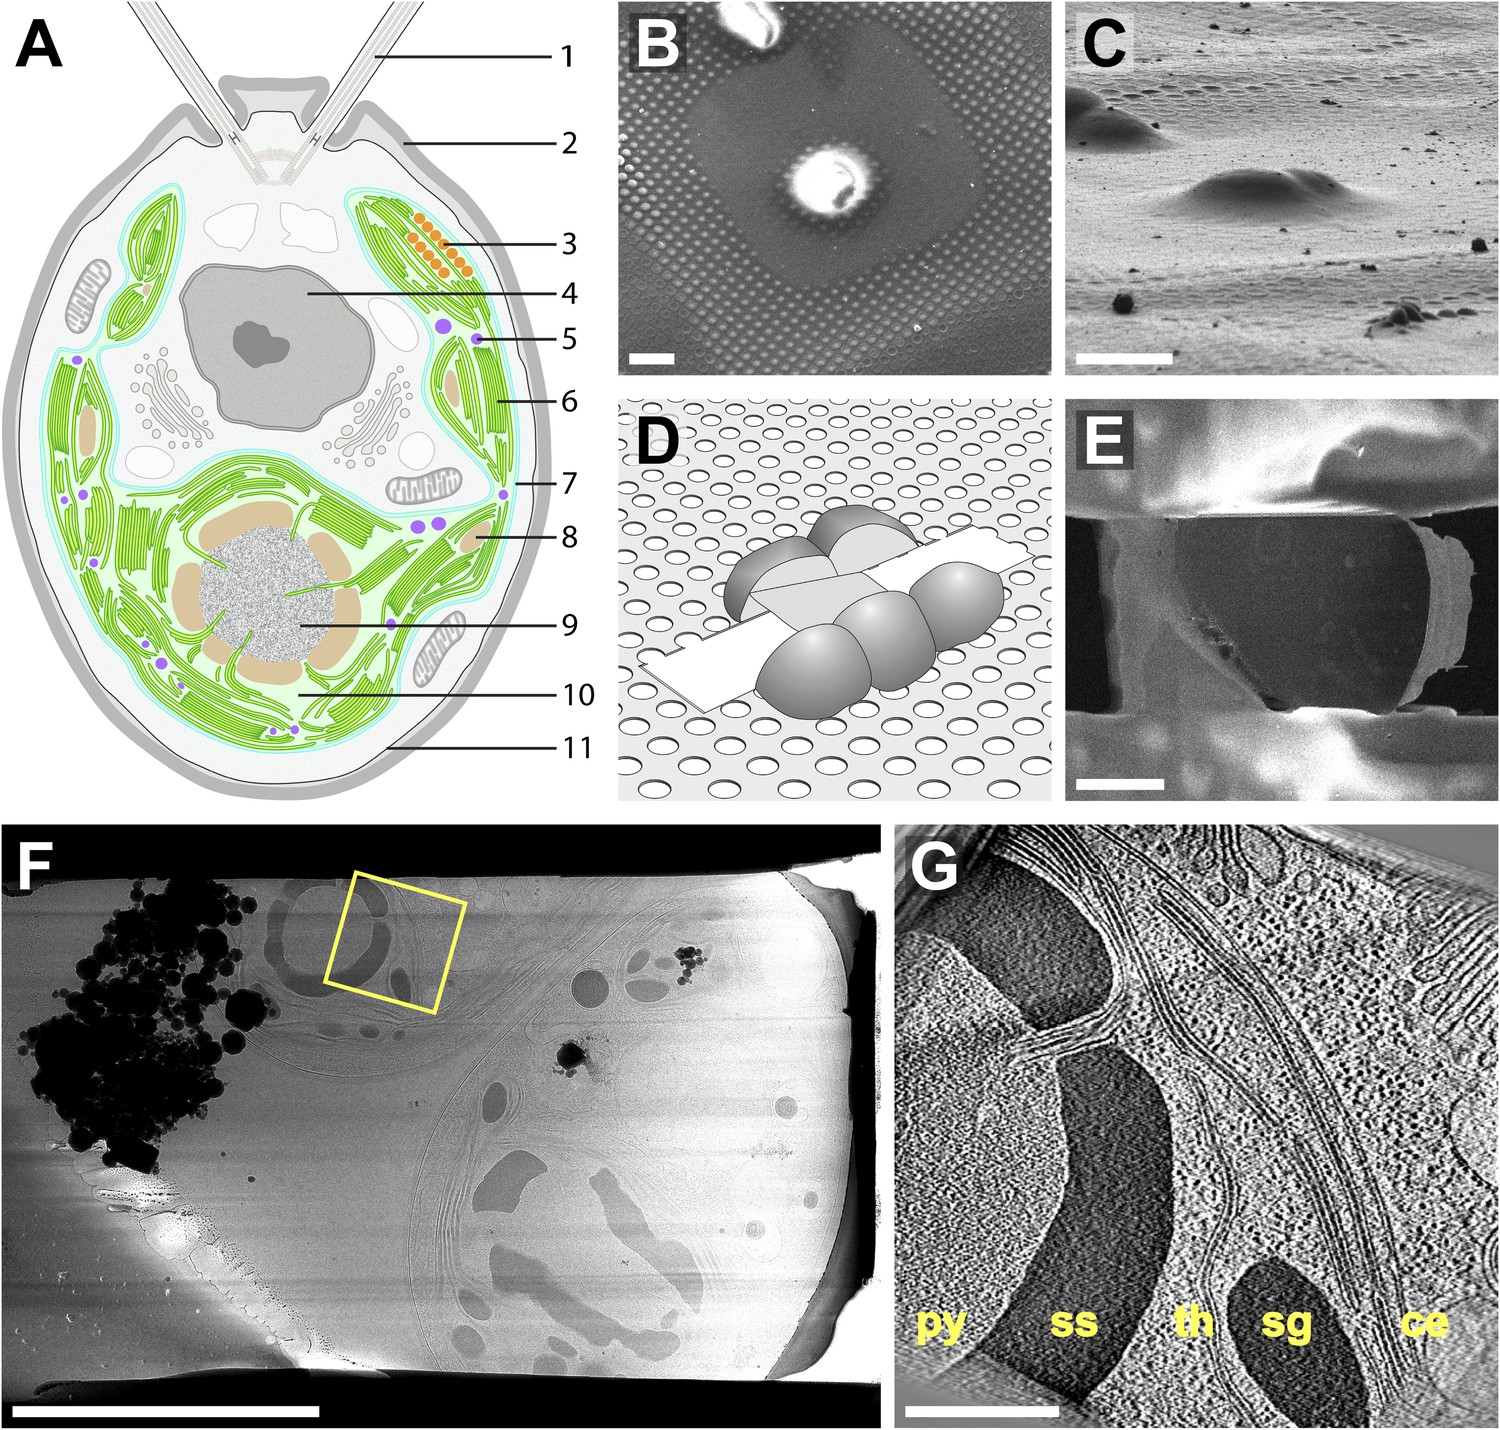
Cryo-FIB of plunge-frozen Chlamydomonas cells.
(A) Cross-section diagram of a Chlamydomonas cell. The chloroplast is shown in color. Labels: (1) flagellum, (2) cell wall, (3) eyespot, (4) nucleus, (5) plastoglobule, (6) thylakoids, (7) chloroplast envelope, (8) starch granule, (9) pyrenoid, (10) chloroplast stroma, (11) plasma membrane. (B–E) Preparation of FIB lamellas in the dual-beam microscope. (B) Top-view scanning electron microscopy (SEM) image of Chlamydomonas cells frozen onto the holey carbon of a 200 mesh grid. (C) The same cells imaged with the FIB (secondary electron detection) at the milling angle of 9°. (D) Schematic of a finished lamella. The direction of FIB milling is from left to right. (E) SEM top-view of the lamella milled from the cells shown in B and C. The direction of FIB milling is from right to left. (F) TEM high-defocus montaged overview of the same lamella. Unbinned pixel size: 30.1 Å. (G) Slice from a tomographic volume acquired at the position indicated by the yellow box in F. From left to right, RuBisCO complexes of the pyrenoid (py) are surrounded by a starch sheath (ss), followed by thylakoids (th), a starch granule (sg), and the chloroplast envelope (ce). Outside of the chloroplast, Golgi stacks and rough endoplasmic reticulum can be seen. Both cytoplasmic and chloroplast ribosomes are also visible. The tomogram was 2× binned. Unbinned pixel size: 9.6 Å. Scale bars: 10 μm in B–C, 5 μm in E–F, 500 nm in G. Figure accompanied by Video 1.
Figure 2
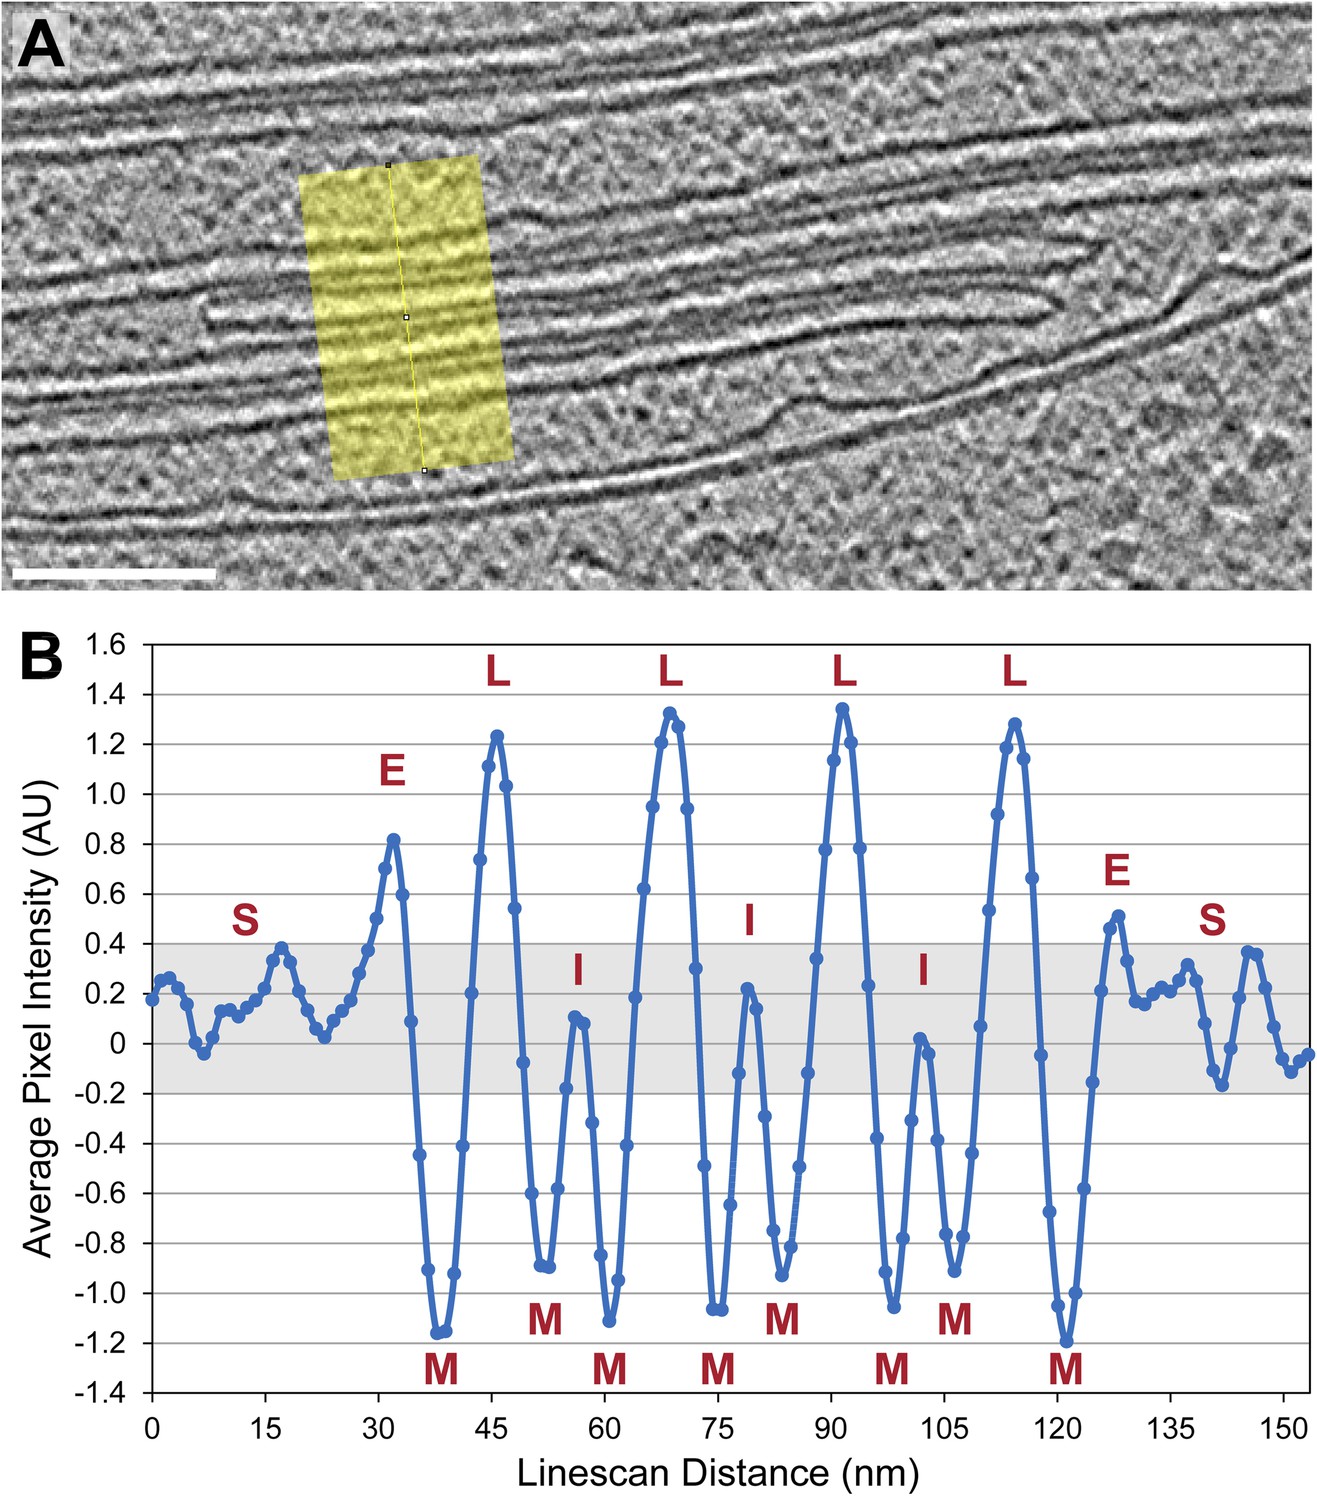
Thylakoid lumina are less dense than the interthylakoid stromal space and the chloroplast stroma.
(A) A line scan through a 2D slice of the tomogram shown in Figure 6A. While tomograms were binned twice for segmentation, here the tomogram was binned only once, reducing the pixel size to 11.4 Å while decreasing contrast (unbinned pixel size: 5.7 Å). Line width: 80 pixels. Scale bar: 100 nm. (B) A profile from the line scan in A (top to bottom), plotting the average pixel intensity along the line. S: chloroplast stroma, E: edge of the thylakoid stack, M: membrane, L: thylakoid lumen, I: interthylakoid stromal space. The grey area of the plot corresponds to the range of intensity values commonly found in the chloroplast stroma. While intensities of the interthylakoid stromal spaces are within this range, the thylakoid lumina are brighter (and thus less dense). AU: arbitrary units. Line scan analysis was performed with Fiji (ImageJ, NIH).
Figure 3
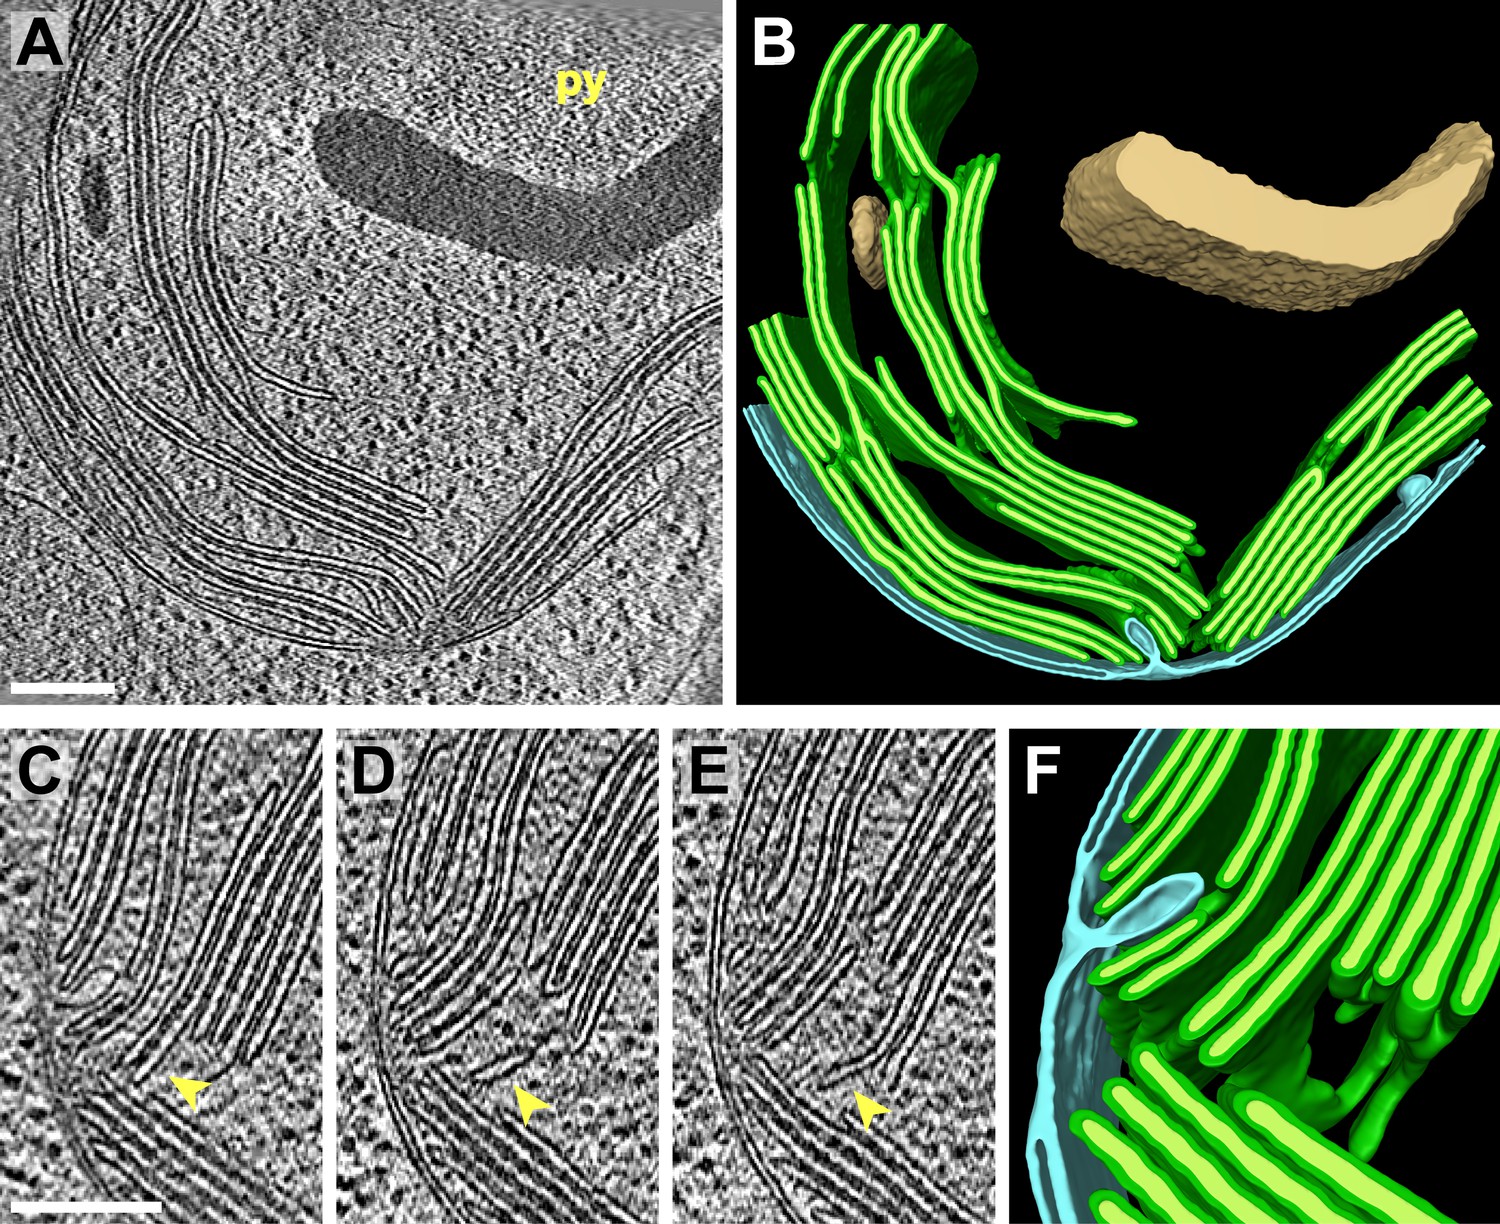
3D cellular architecture at the base of the chloroplast cup.
(A) A slice from a tomographic volume and (B) corresponding 3D segmentation showing thylakoid membranes (dark green) and lumina (light green), the chloroplast envelope (blue), and starch (tan). The dense cluster of RuBisCO complexes that make up the pyrenoid (py) can be seen in the upper right of the tomogram. (C–E) Three sequential slices from the same tomogram (rotated 90°) and (F) corresponding 3D segmentation, showing a thylakoid tip convergence zone. The double membrane of the chloroplast envelope has reduced definition in a small region adjacent to the converging thylakoid tips (loss of intermembrane space in A, C, and D). Pairs of adjacent thylakoids in a stack are often joined at intervals along their tips by 180° membrane loops. Two non-adjacent thylakoids (the second and fifth of the stack) are joined by a more topologically complex 3D loop (arrows). The tomogram was 2× binned. Unbinned pixel size: 7.1 Å. Segmented tomogram thickness: 183 nm. Scale bars: 200 nm. Figure accompanied by Video 2.
Figure 4
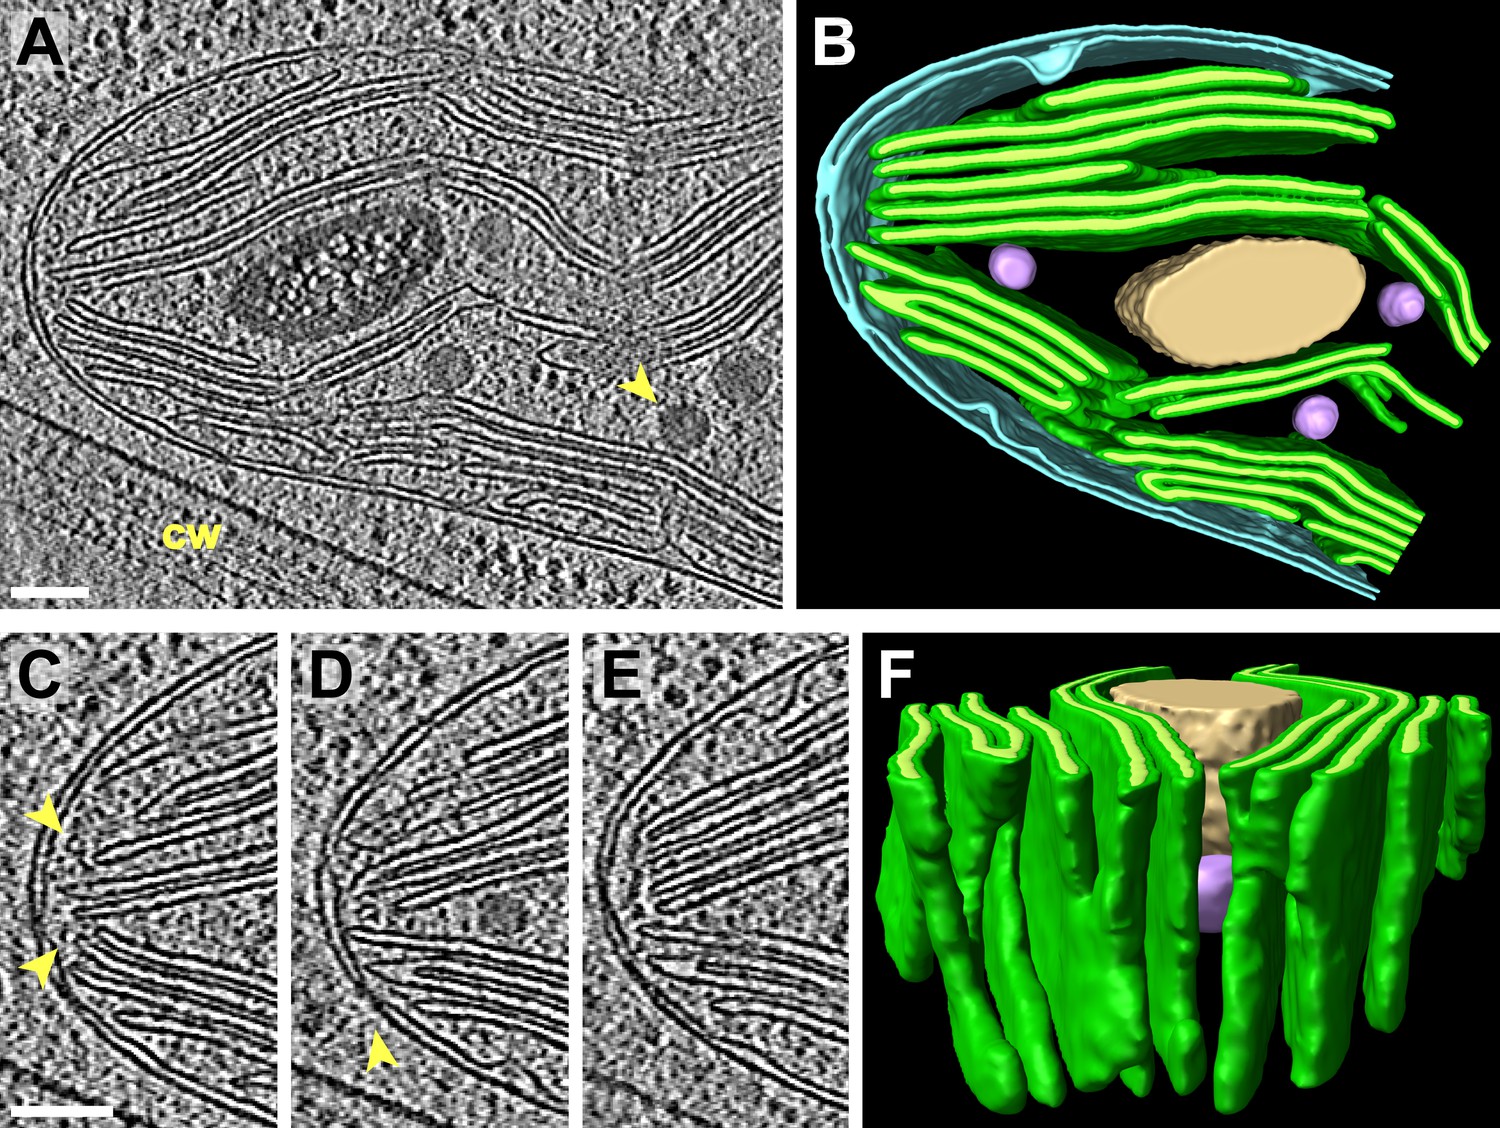
3D cellular architecture at the rim of the chloroplast cup.
(A) A slice from a tomographic volume and (B) corresponding 3D segmentation showing thylakoid membranes (dark green) and lumina (light green), the chloroplast envelope (blue), a starch granule (tan), and plastoglobules (purple, arrow in A). The rim of the chloroplast lobe is in close proximity to the cell wall (cw). (C–E) Three sequential slices from the same tomogram showing the thylakoid tip convergence zone at the chloroplast rim. Small vesicles (arrows in C) can be seen between the thylakoid tips and the chloroplast envelope, which loses definition in several locations (loss of intermembrane space in C–E). The arrow in D points to a circular structure in the membrane that could be a protein complex or just a single membrane bilayer. (F) In the corresponding 3D segmentation (which has been flipped 180° from B and tilted to face the chloroplast rim), the chloroplast envelope has been removed to reveal the interconnections between the thylakoid tips at the convergence zone. The tomogram was 2× binned. Unbinned pixel size: 5.7 Å. Segmented tomogram thickness: 126 nm. Scale bars: 100 nm. Figure accompanied by Video 3.
Figure 5
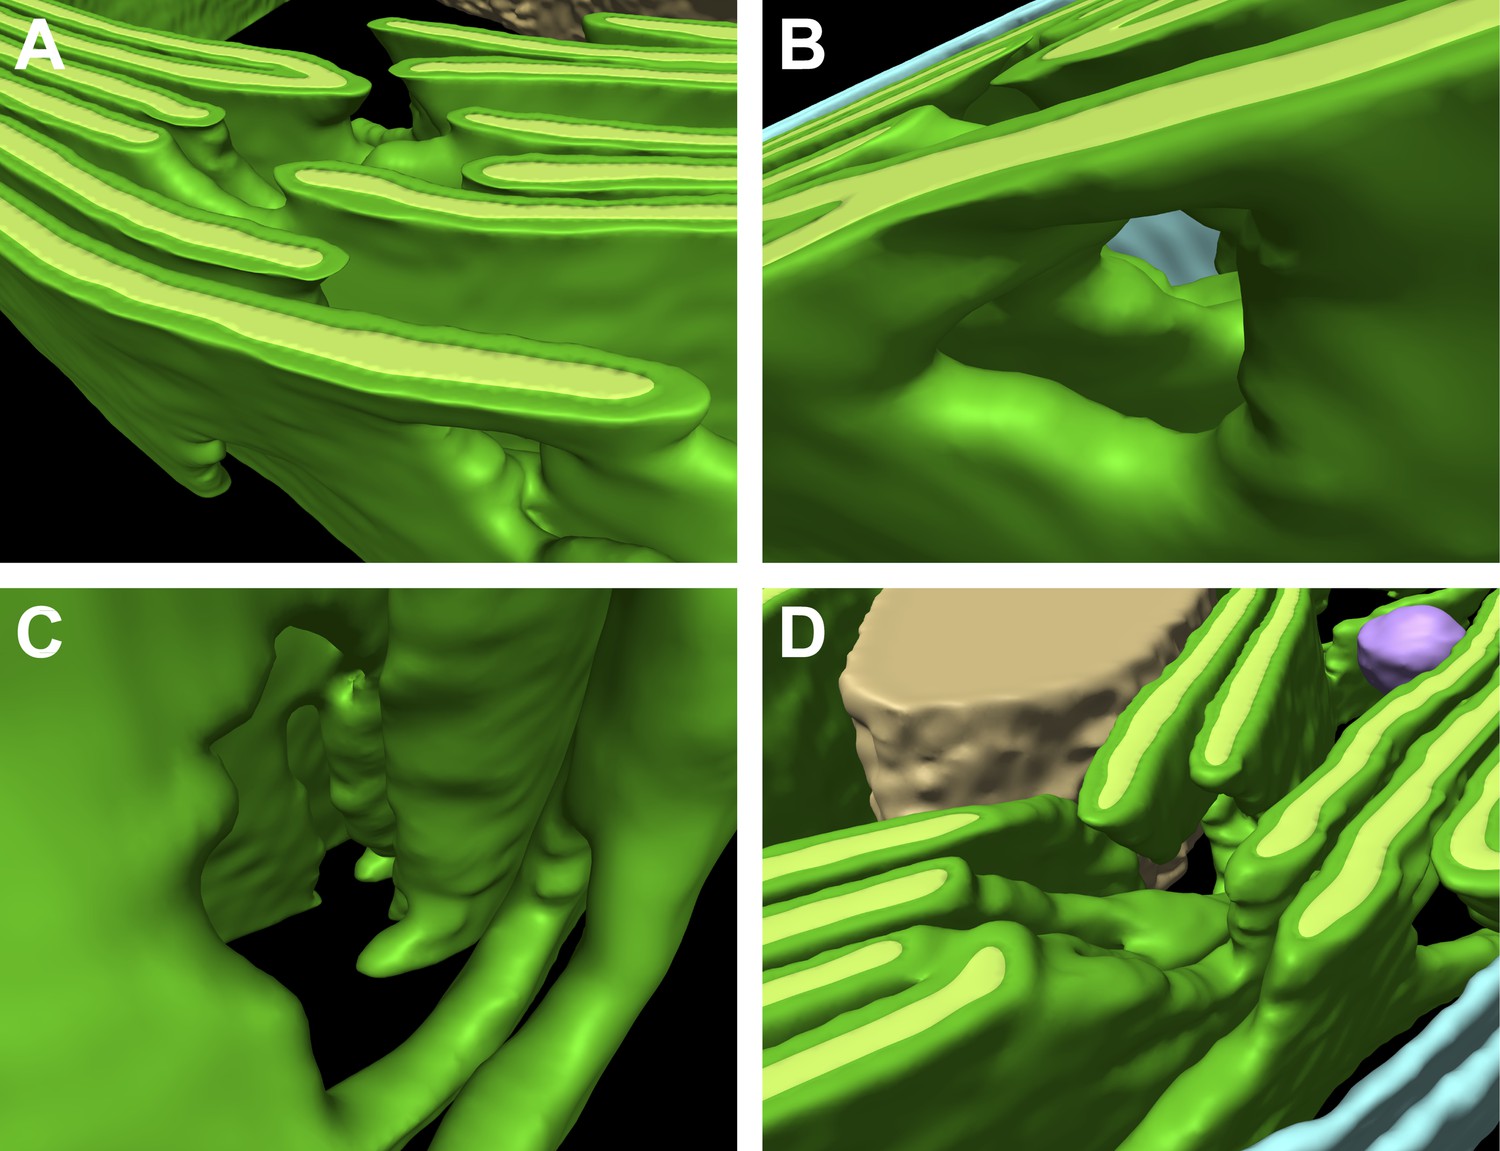
Thylakoid fenestrations.
Alternate views of the 3D segmentations from (A–C) Figure 3 and (D) Figure 4 showing fenestrations in thylakoid stacks. In each example, there are holes at similar positions in multiple adjacent thylakoids, enabling free diffusion of stromal components from one side of the thylakoid stack to the other. In A and D, the fenestrations are not completely within the limited thickness of the FIB lamella, and hence appear like indentations in the top surfaces of the segmented thylakoid volumes.
Figure 6

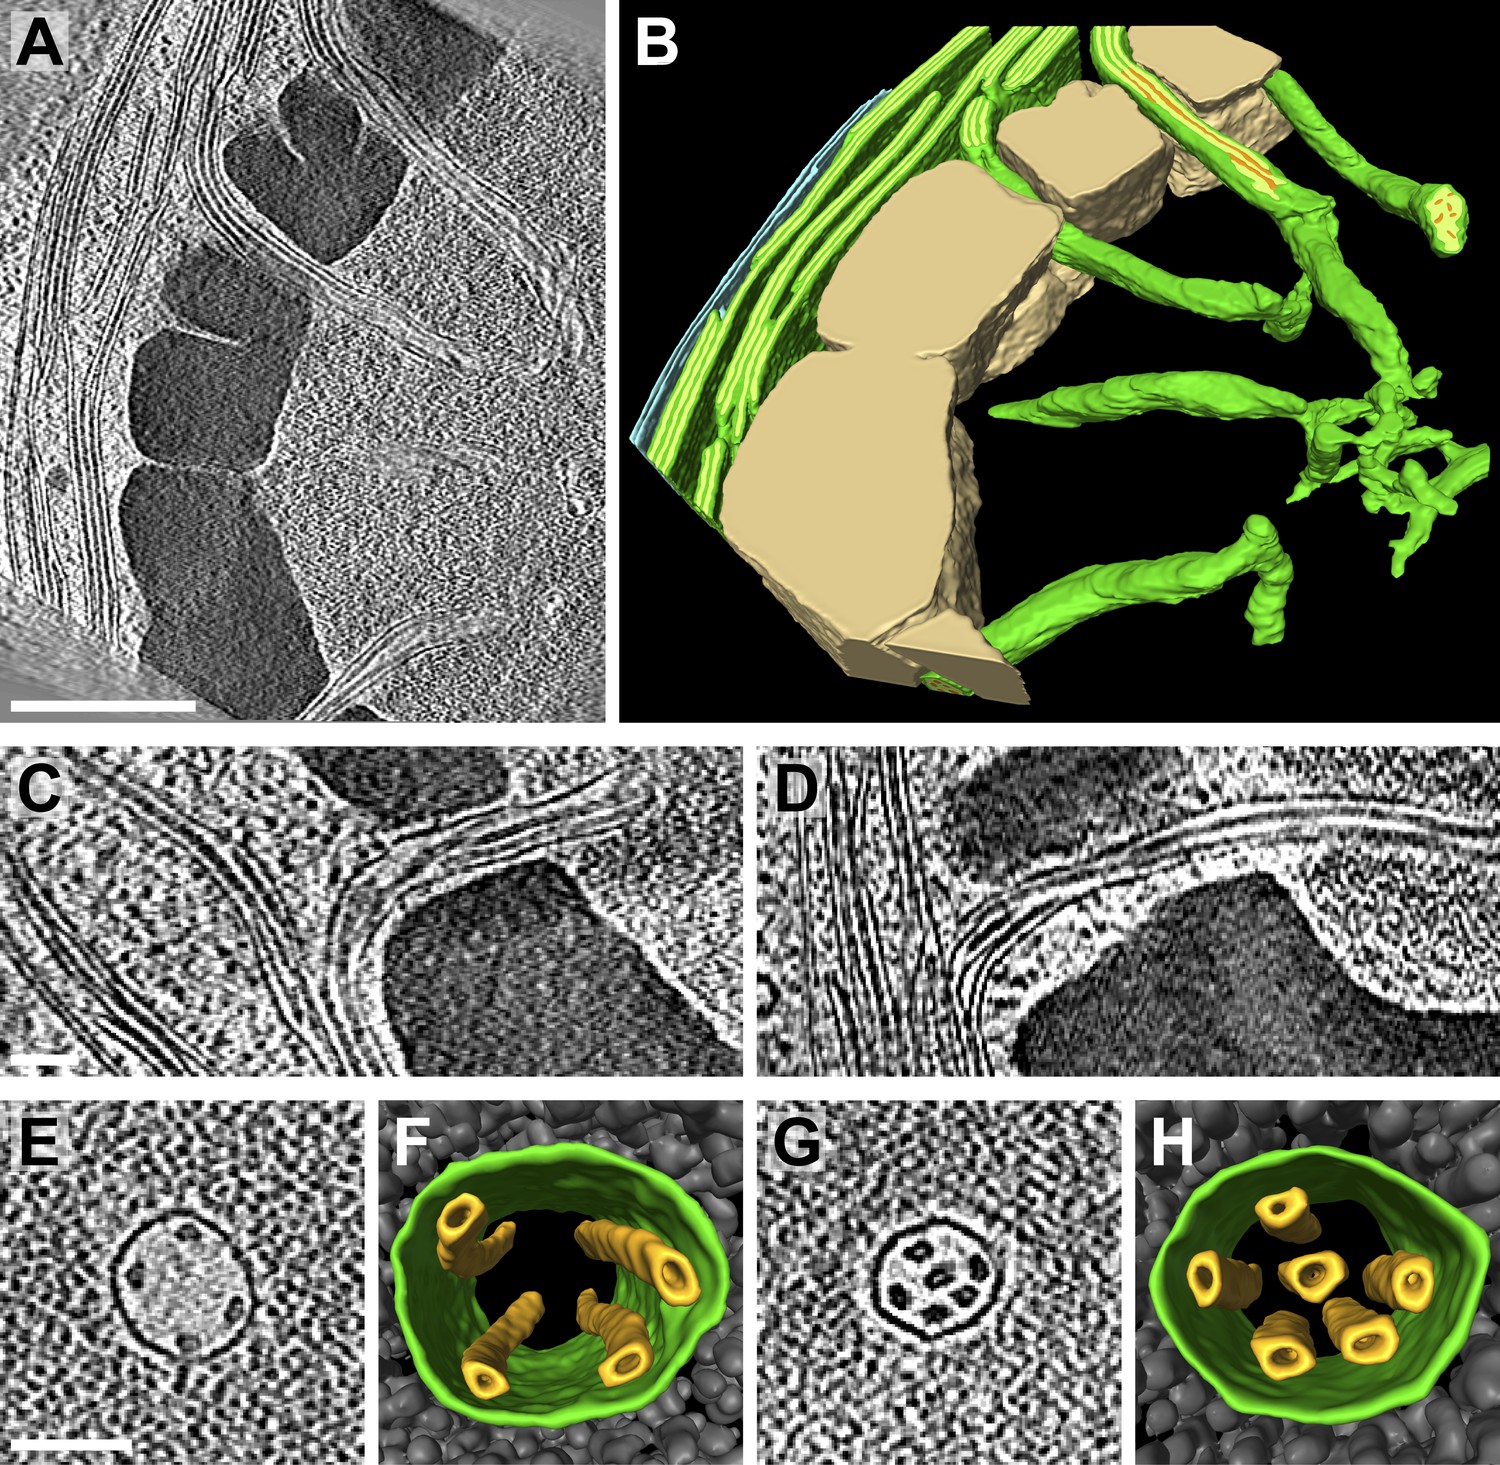
Spatial relationship between chloroplast envelope inner membrane invaginations and thylakoid tips.
(A and C) Slices from tomographic volumes and (B and D) corresponding 3D segmentations showing thylakoid membranes (dark green), thylakoid lumina (light green), and the chloroplast envelope (blue). Inner membrane invaginations (arrows) are frequently found in close proximity to the tips of thylakoid sheets. (E–G) Three sequential slices through a tomogram and (H) corresponding 3D segmentation, where a region of thylakoid tip (∼25 nm high and ∼20 nm wide) is connected to the chloroplast envelope inner membrane. The tomograms were 2× binned. Unbinned pixel size: 5.7 Å. Segmented tomogram thickness: 137 nm in B, 135 nm in D, 69 nm in H. Scale bar: 100 nm.
Figure 7
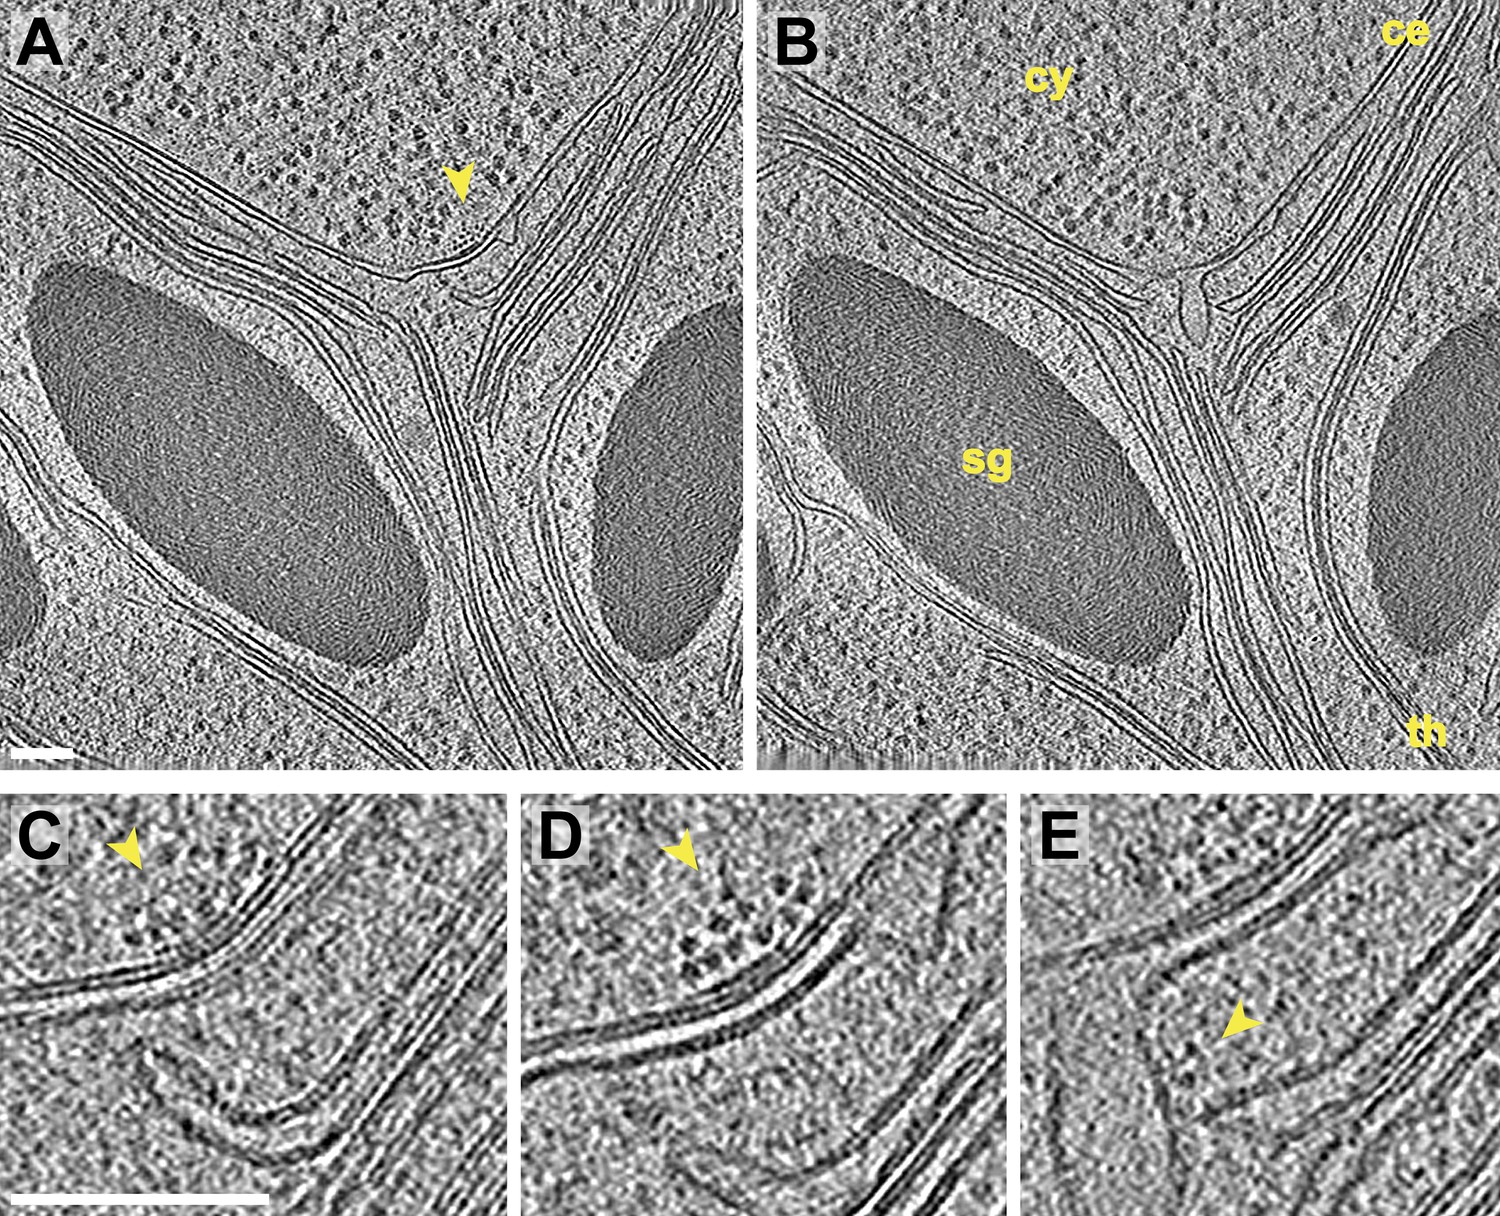
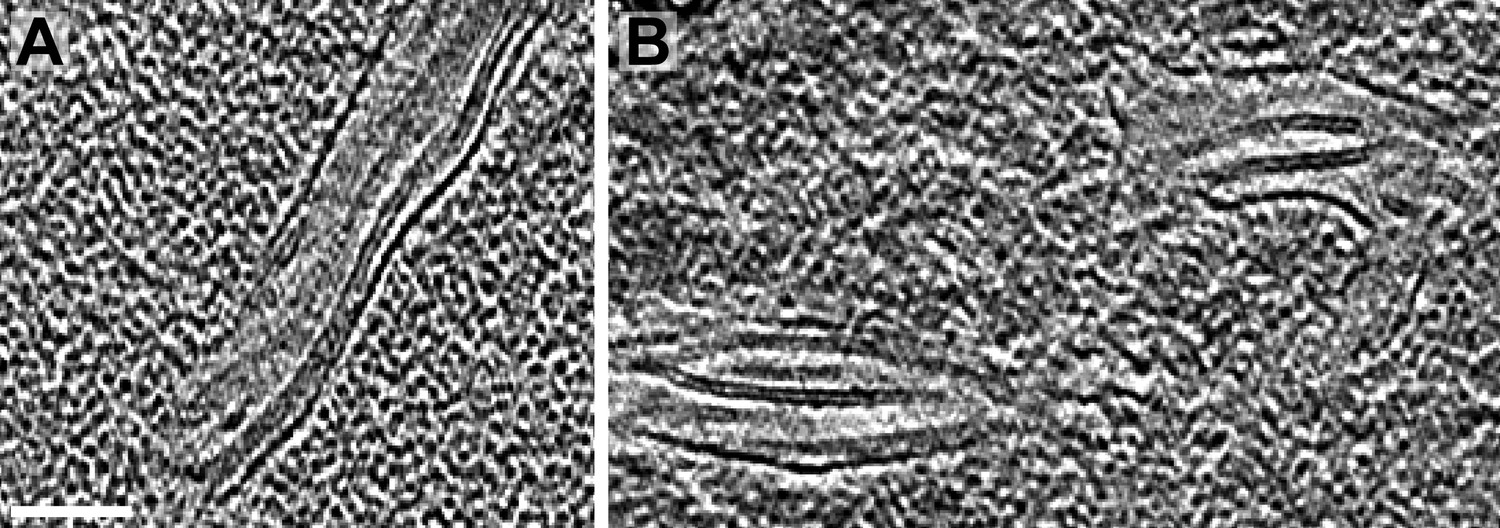
Inner membrane invaginations and membrane-associated complexes at the chloroplast base-lobe junction.
(A–B) Two sequential slices through a tomogram acquired with a direct electron detector, showing a junction between the base and the side (lobe) of the chloroplast cup. At the bend in the chloroplast envelope, an array of small complexes (arrow) is associated with the cytoplasmic surface of the envelope's outer membrane, between two invaginations in the inner membrane. The cytoplasm (cy), chloroplast envelope (ce), starch granules (sg), and thylakoids (th) are labeled. (C–E) Three sequential slices through the same tomographic volume, showing a magnified view of the chloroplast envelope at the base-lobe junction. D and E correspond to the views in A and B, respectively. Separate halves of lipid bilayers were fairly well resolved along relatively flat membranes. A thylakoid tip (C) bends ∼90° to point towards the chloroplast envelope and (E) nearly contacts a large inner membrane invagination. Small complexes (arrows) are clustered in an array on the outer membrane and are also associated with the inner membrane invagination close to the thylakoid tip. These particles each have a diameter of ∼6 nm. For comparison, the diameter of the F1 ATP synthase subunit is ∼9 nm and the diameter of the fully assembled RuBisCO complex is ∼12 nm (note that the RuBisCO large subunit and six ATP synthase components are encoded by the chloroplast genome and thus, are not imported). The tomogram was 3× binned in A–B and 2× binned in C–E. Unbinned pixel size: 3.4 Å. Scale bars: 100 nm.
Figure 8
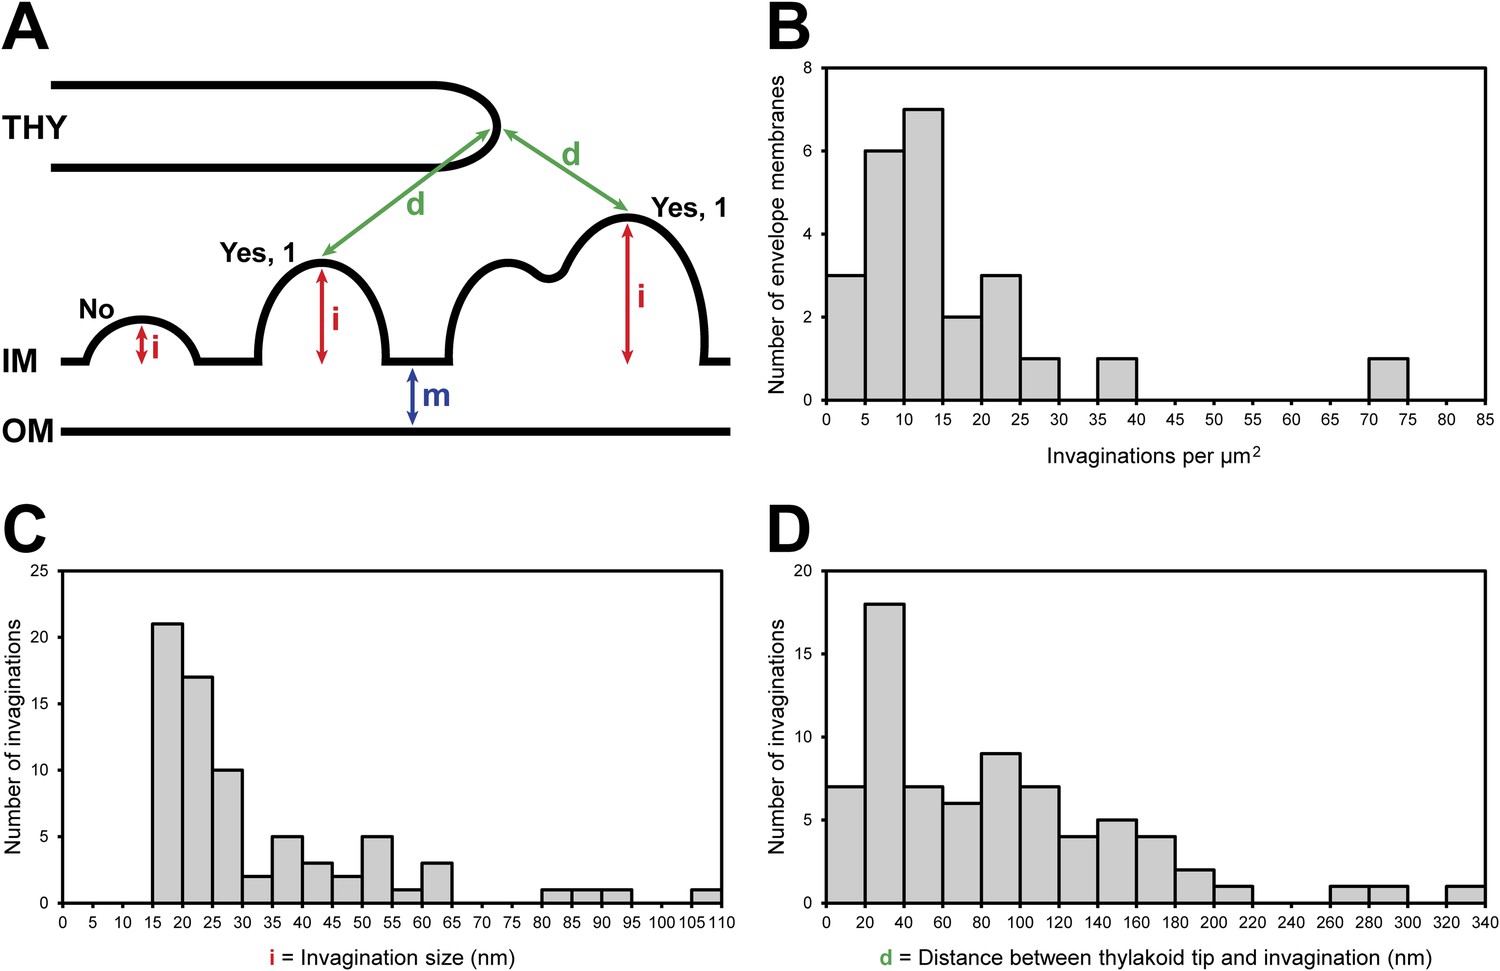
Chloroplast envelope inner membrane invagination size, density on the inner membrane, and distance from thylakoid tips.
(A) Diagram illustrating how chloroplast envelope inner membrane (B) invagination density, (C) invagination size, and (D) distance between invagination and thylakoid tip were quantified. Invaginations were counted if the distance they projected into the stroma (i, invagination size) was greater than the width of the chloroplast envelope's double membrane (m). For this reason, there are no invaginations less than 15 nm in size plotted in C. Invaginations with multiple tips were counted as single invaginations. The distance between thylakoids and invaginations (D) was measured as the shorted straight line through the 3D volume between the tip of an invagination and the tip of the nearest thylakoid.
Figure 9 with 1 supplement
Pyrenoid tubules connect thylakoids with the pyrenoid.
(A) A slice from a tomographic volume and (B) corresponding 3D segmentation showing thylakoid membranes (dark green), thylakoid lumina (light green), minitubules (orange), the chloroplast envelope (blue), and the pyrenoid starch sheath (tan). Cylindrical pyrenoid tubules extend from thylakoid stacks into the center of the pyrenoid through fenestrations in the starch sheath. Once inside the pyrenoid, the tubules twist (top tubule in A), can abruptly change direction by ∼90° (bottom tubule in B), lose their cylindrical geometry, and narrow to form an interconnected membrane network at the pyrenoid center. (C–D) Slices from two additional tomograms detailing how pyrenoid tubules extend from thylakoid stacks. Thylakoid lumina are continuous with pyrenoid tubule lumina. (E and G) Slices from higher magnification tomograms of the pyrenoid matrix and (F and H) corresponding 3D segmentations showing cross-sections of pyrenoid tubules (green) surrounded by RuBisCO complexes (grey). Multiple smaller minitubules (orange) are bundled within each pyrenoid tubule. The tomograms were 2× binned. Unbinned pixel size: 9.6 Å in A–D, 5.7 Å in E–H. Segmented tomogram thickness: 229 nm in B, 165 nm in F, 108 nm in H. Scale bars: 500 nm in A, 100 nm in C, D, E, and G. Figure accompanied by Videos 4 and 5.
Figure 9—figure supplement 1
Longitudinal views of pyrenoid minitubules.
(A–B) Slices from tomographic volumes showing the thin, hollow lumina of the pyrenoid minitubules. The tomograms were 2× binned. Unbinned pixel size: 5.7 Å. Scale bar: 100 nm.
Figure 10

Pyrenoid minitubule lumina are continuous with the interthylakoid stromal space.
Slices from a tomographic volume and different views of the corresponding 3D segmentation showing the transition from a thylakoid stack to a pyrenoid tubule. To ease visualization, the continuous luminal space has been segmented rather than the membranes. Colors indicate lumen connectivity. Lumina of the thylakoid stack are colored red, yellow, green, blue, and purple. The red and yellow lumina merge to form the orange lumen, which then connects to the green lumen. The light blue lumen bridges the green lumen with both the blue and purple lumina. All lumina converge in the white ‘neck’ region, where the thylakoids transition into a pyrenoid tubule. While the pyrenoid tubule lumen is continuous, the light green half is more directly connected to the orange and green thylakoid lumina, and the lavender half is more directly connected to the blue and purple lumina. The two indentations between the light green and lavender halves correspond to minitubules within the pyrenoid tubule. (A) Side view of the segmentation superimposed above a tomographic slice and (B) end-on view of the segmentation, rotated ∼90° from A. (C–D) The interior of one pyrenoid minitubule is continuous with the interthylakoid stromal space between the purple and blue lumina. (E–F) The interior of the second pyrenoid minitubule is continuous with the interthylakoid stromal space between the blue and green lumina. The yellow lumen has been removed in F to provide an unobstructed view. The view in D is inverted 180° from F to show both the top and bottom faces of the segmentation. In C and E, lines and arrows indicate the corresponding colored thylakoid lumina and halves of the pyrenoid tubule, respectively. The tomogram was 2× binned. Unbinned pixel size: 9.6 Å. Segmented tomogram thickness: 187 nm. Scale bars: 200 nm. Figure accompanied by Video 6.
Figure 11
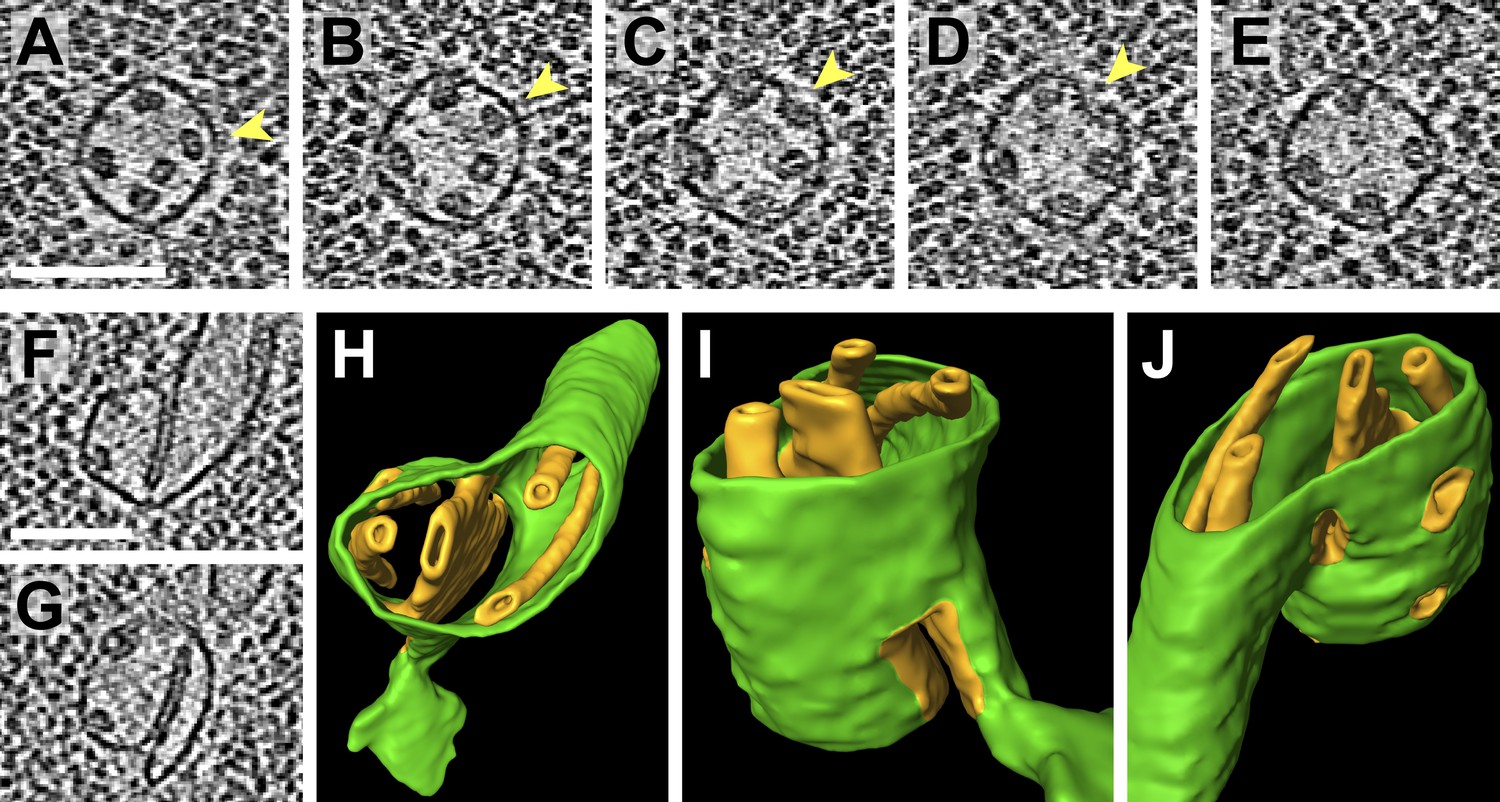
Pyrenoid minitubule lumina are continuous with the pyrenoid matrix.
(A–E) Sequential slices through a tomographic volume, following a pyrenoid tubule as it proceeds towards the center of a pyrenoid. In C and D, the minitubule marked with an arrow terminates by merging with the surrounding pyrenoid tubule, exposing the minitubule lumen to the pyrenoid matrix, which is packed with RuBisCO complexes. The tomogram in A–E was acquired with a direct electron detector. (F–G) Two slices from a tomogram and (H–J) corresponding 3D segmentation showing the merger of two pyrenoid tubules (green) near the center of a pyrenoid. In addition to the minitubules (orange) within each of the pyrenoid tubules, there is a larger internal membrane structure (orange) at the zone where the two pyrenoid tubules meet. This membrane structure is more sheet-like than the minitubules but also encloses a lumen that is continuous with the pyrenoid matrix. F and G show that the lumen of this membrane structure opens to the pyrenoid matrix on both sides of the merging pyrenoid tubules. In H and I, a non-cylindrical membrane (green) can be seen protruding from the merging tubules. The tomograms were 2× binned. Unbinned pixel size: 4.2 Å in A–E, 5.7 Å in F–J. Segmented tomogram thickness: 130 nm. Scale bars: 100 nm.
Figure 12
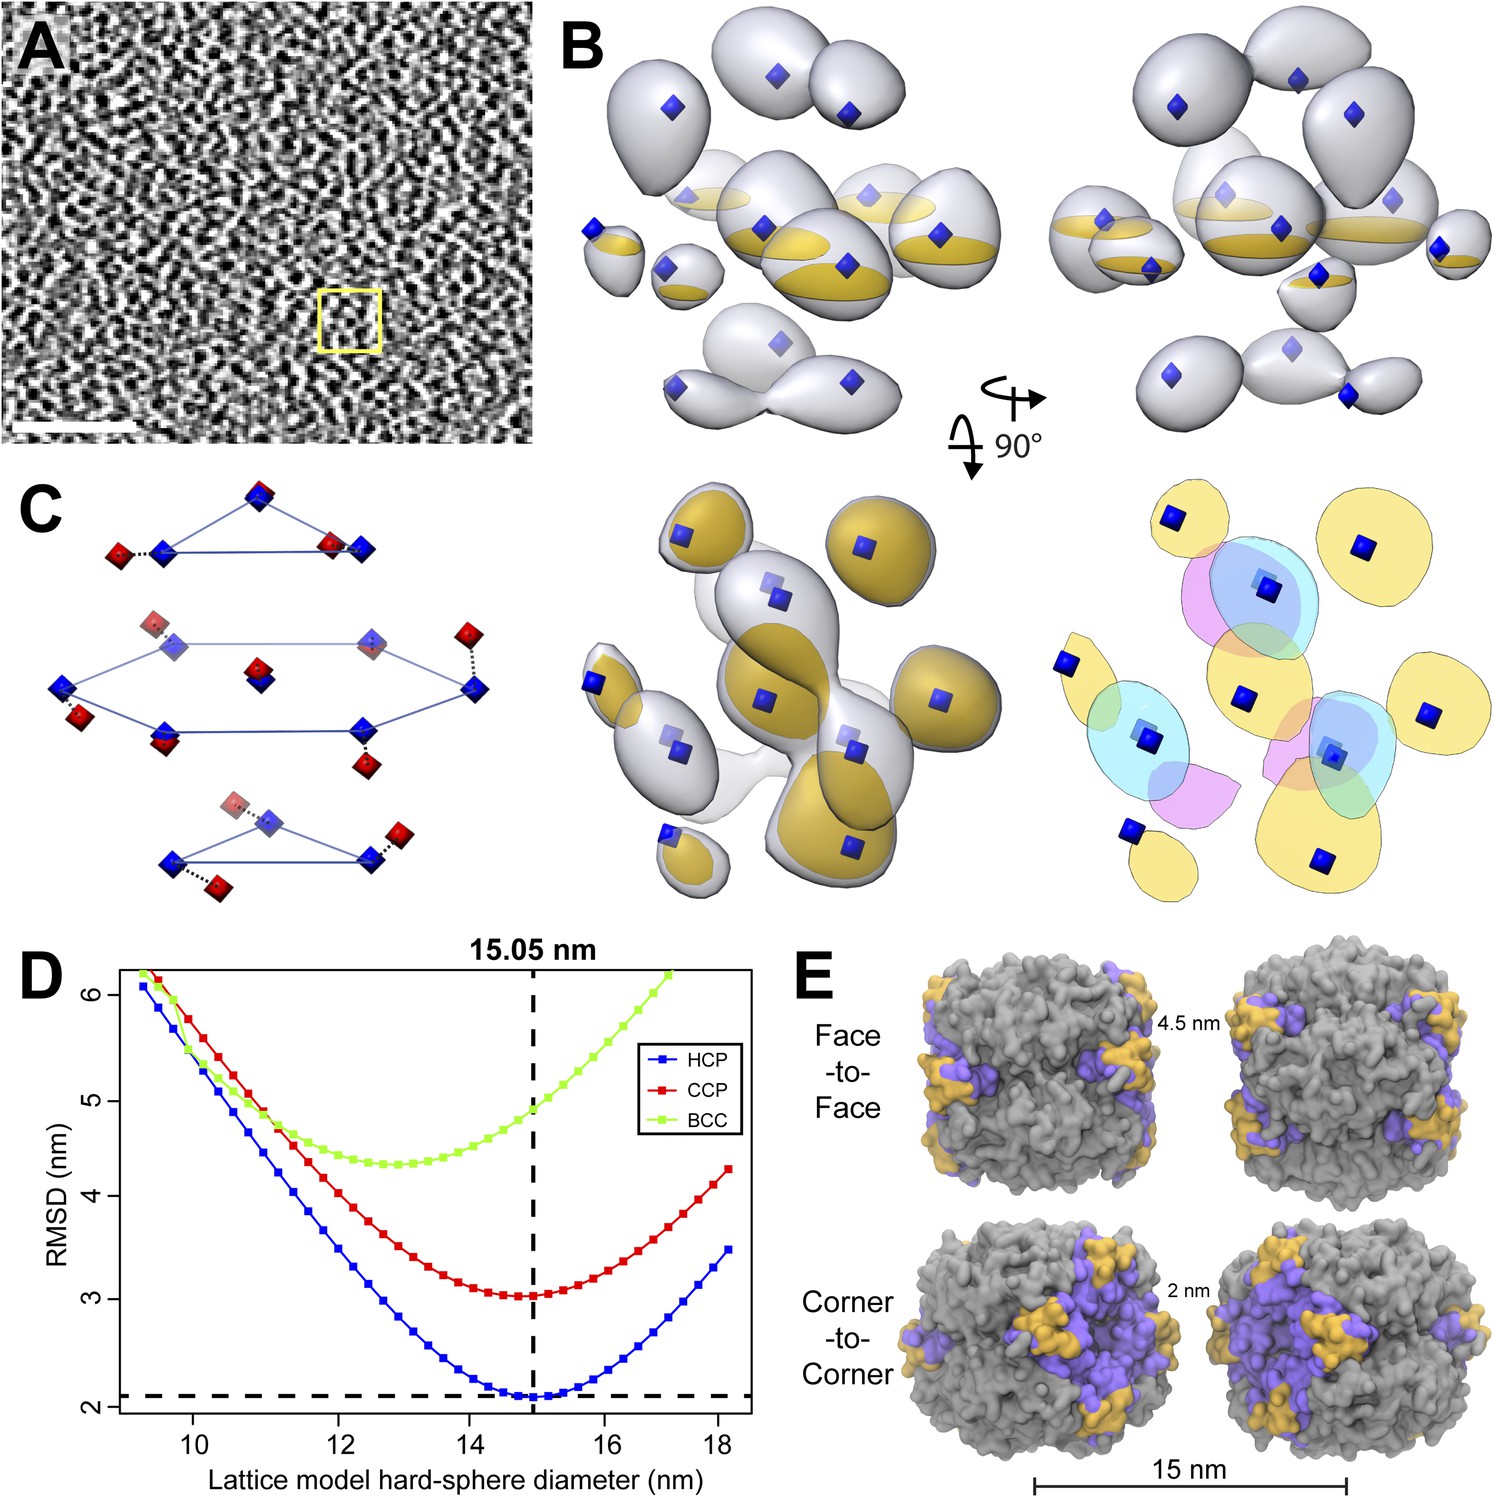
RuBisCO complexes in the pyrenoid show hexagonal close packing.
(A) A slice from a tomographic volume containing pyrenoid RuBisCO complexes. The yellow box indicates the size of the 45.6 nm3 subvolumes used for averaging. Unbinned pixel size: 5.7 Å. Scale bar: 100 nm. (B) Alignment and averaging of 10,625 subvolumes without imposing symmetry yielded a hexagonally packed 3D average (grey densities, 34.8 Å resolution at the FSC 0.5 cutoff). A 2D slice through this average (gold discs) is displayed to help illustrate the hexagonal arrangement. This average fits well to the ideal center points of hexagonal close packing (blue diamonds). In the lower right panel, a top view of 2D slices through the bottom (red), middle (yellow), and top (blue) layers of the average clearly shows the A-B-A arrangement of RuBisCO complexes. (C) The best fit between the ideal center points of hexagonal close packing (blue diamonds) and the center points of RuBisCO nearest neighbors determined by k-means clustering a 3D point cloud of template-matched RuBisCO positions (Figure 13) (red diamonds). (D) RMSD minimization of hard-sphere models of hexagonal close packing (HCP), cubic close packing (CCP), and body-centered cubic (BCC) packing with the nearest neighbor RuBisCO positions depicted in C. Varying the sphere diameter yields a unique minimum RMSD for each model. HCP with a sphere diameter of 15.05 nm shows the best fit, with an RMSD of 2.13 nm. (E) Two possible relative orientations of neighboring RuBisCO complexes with 15 nm between their centers. Grey: RuBisCO large subunit, purple: RuBisCO small subunit, orange: the two surface-exposed α-helices on the small subunit with hydrophobic residues required for pyrenoid formation. When the sides of two RuBisCO complexes directly face each other (face-to-face), there is ∼4.5 nm between the small subunits of each complex. If each complex is rotated 45° from the face-to-face orientation, opposing small complexes are ∼2 nm apart (corner-to-corner). This 2 nm separation is the smallest possible distance between two complexes. Model generated from the Chlamydomonas RuBisCO crystal structure (Taylor et al., 2001).
Figure 13
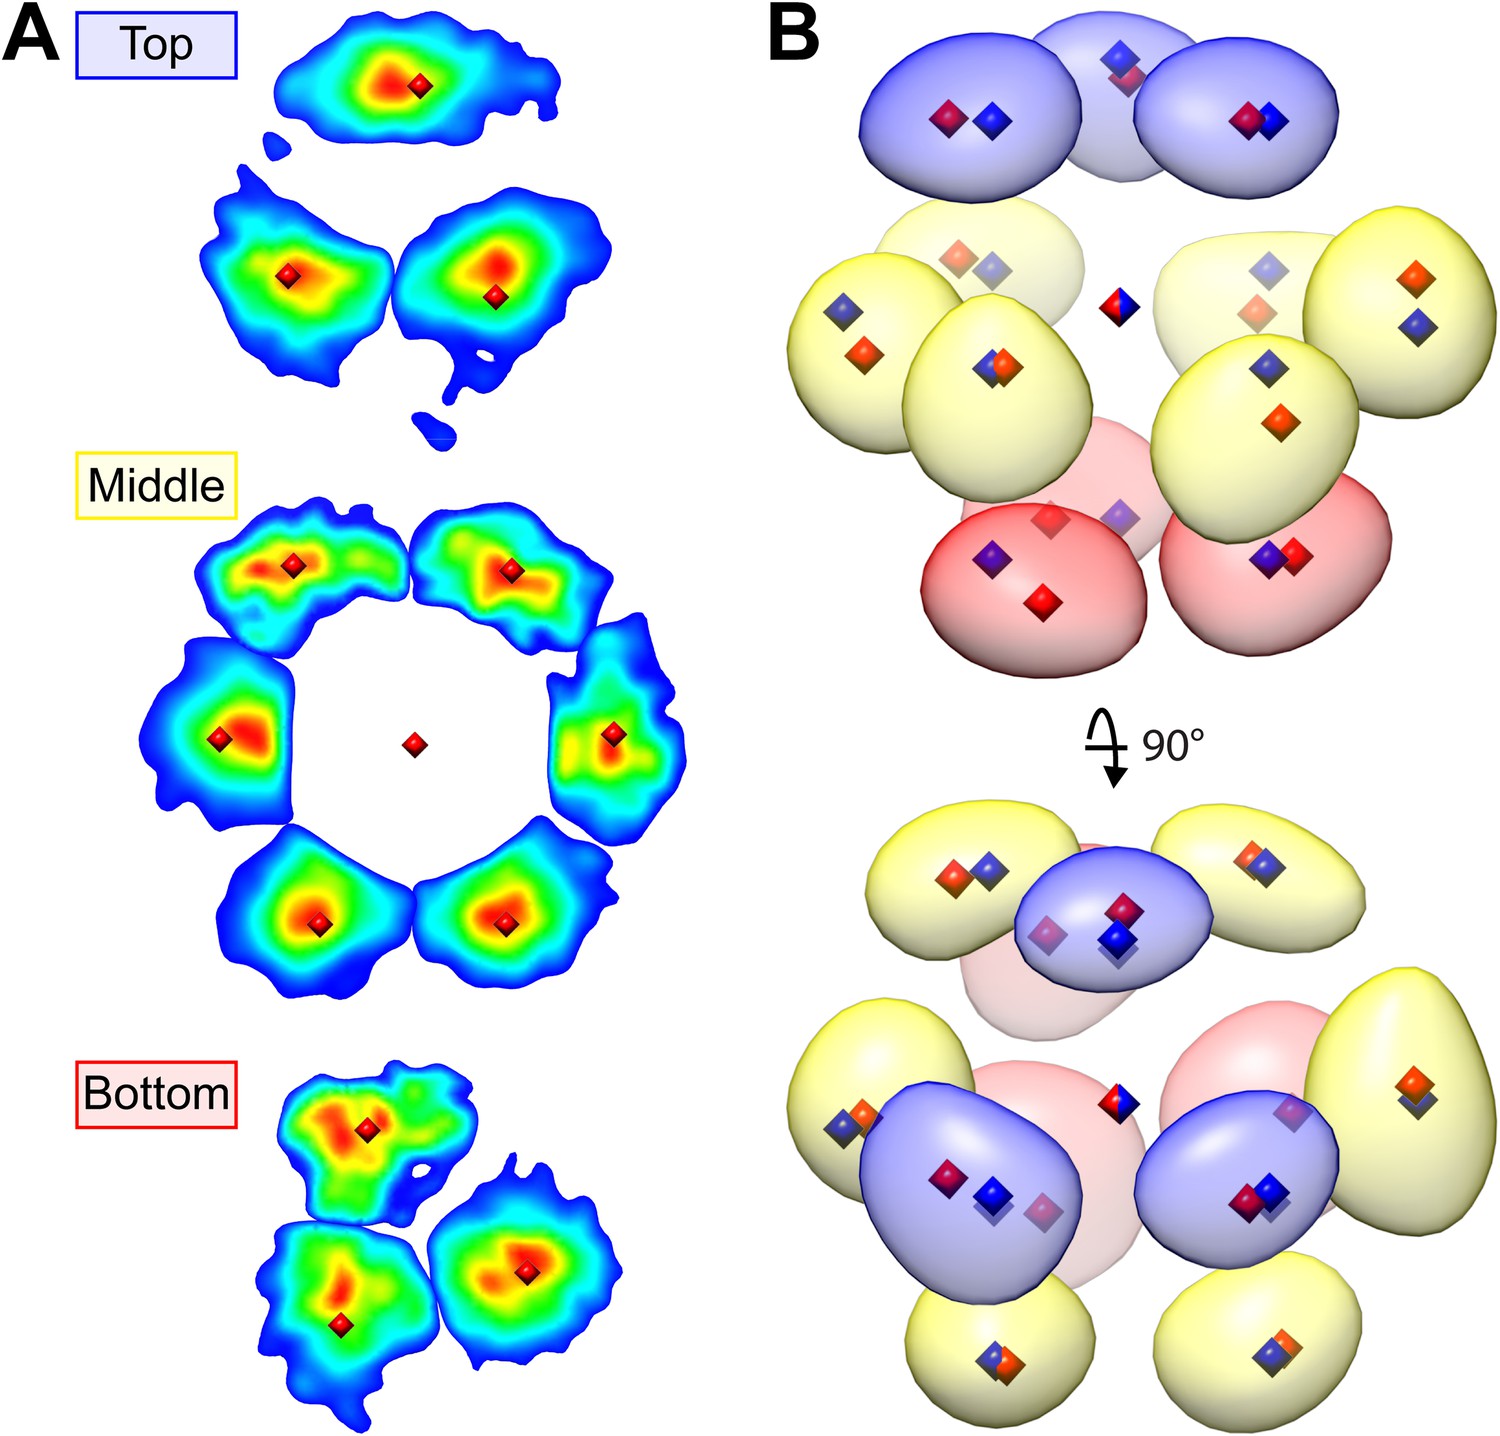
Hexagonal close packing of RuBisCO complexes determined by template matching and nearest neighbor point cloud clustering.
Each RuBisCO complex was localized in the tomograms by template matching. The nearest neighbors of each RuBisCO were overlaid into a 3D point cloud by applying the transformations obtained from subvolume alignment. (A) 2D slices through the top, middle, and bottom of the point cloud. Color indicates point density (red: highest density, blue: lowest density). Center positions for each of the nearest neighbors (red diamonds) were determined by applying k-means clustering to the point cloud. (B) A Gaussian-smoothed representation of the 3D point cloud showing the clear A-B-A arrangement of hexagonal close packing. The blue, yellow, and red densities correspond to the top, middle, and bottom slices in A. Red diamonds: center positions generated by k-means clustering, blue diamonds: ideal center points of hexagonal close packing.
Figure 14
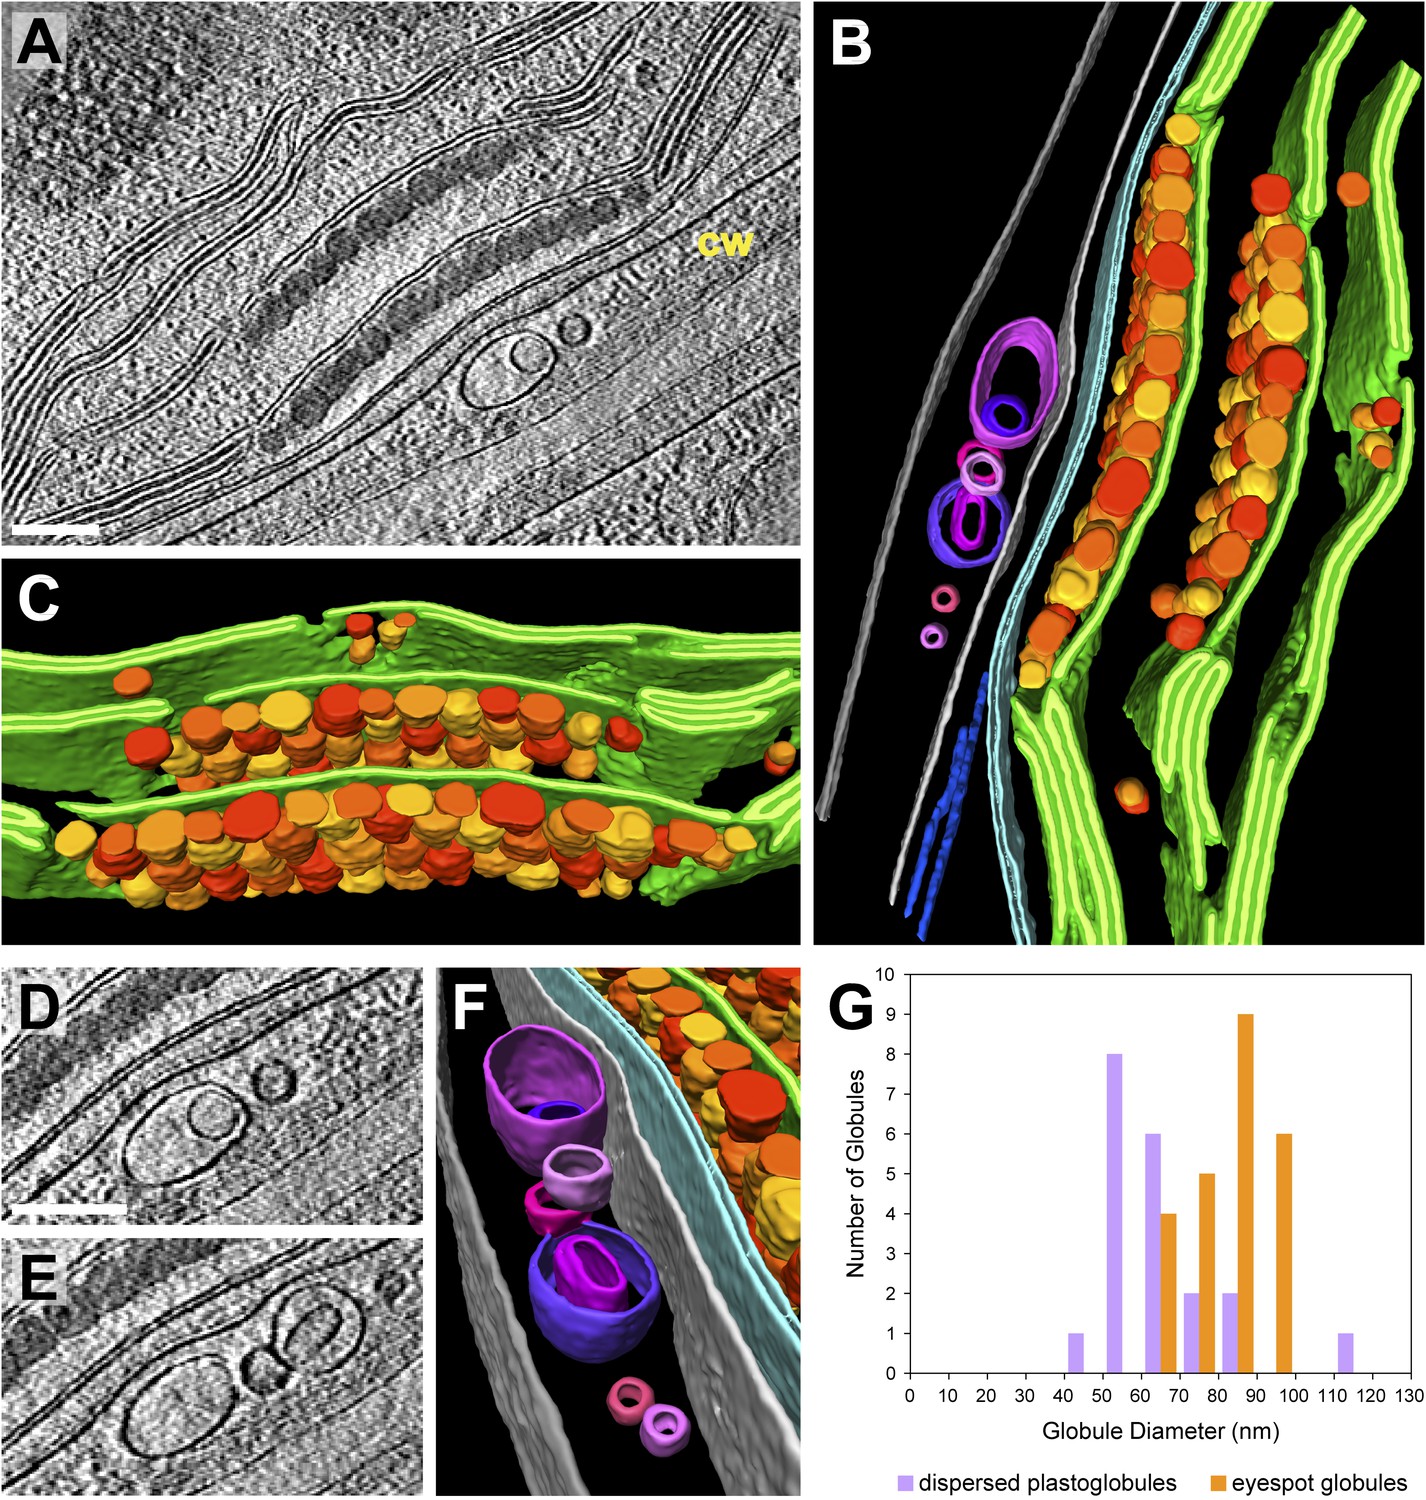
3D architecture of the eyespot.
(A) A slice from a tomographic volume (cw: cell wall) and (B) corresponding 3D segmentation (rotated ∼90° from A) showing thylakoid membranes (dark green), thylakoid lumina (light green), eyespot globules (yellow, orange, and red), the chloroplast envelope (light blue), flagellar root microtubules (dark blue), the plasma membrane (light grey), the outer border of the cell wall (dark grey), and cell wall vesicles (purple and pink). (C) A view of the segmentation with the chloroplast envelope and plasma membrane removed, revealing the close-packed arrangement of eyespot globules along specialized thylakoid regions. (D–E) Two sequential tomogram slices and (F) corresponding 3D segmentation showing vesicular bodies adjacent to the eyespot, embedded between the plasma membrane and the outer border of the cell wall. (G) Histogram comparing eyespot globule sizes with the sizes of plastoglobules found elsewhere in the chloroplast. The tomogram was 2× binned. Unbinned pixel size: 9.6 Å. Segmented tomogram thickness: 210 nm. Scale bars: 200 nm.
Videos
Video 1
Sequential sections back and forth through the tomographic volume in orthographic view.
Visible structures include the pyrenoid, thylakoids, starch, and the chloroplast envelope, as well as portions of the rough endoplasmic reticulum and Golgi apparatus. The tomogram was 2× binned. Unbinned pixel size: 9.6 Å. Corresponds to Figure 1G.
Video 2
Sequential sections back and forth through the tomographic volume in orthographic view, followed by reveal and tour of the 3D segmentation in perspective view.
The tour focuses on the thylakoid tip convergence zone and the topologically complex looping structure connecting two non-adjacent thylakoid tips. The tomogram was 2× binned. Unbinned pixel size: 7.1 Å. Corresponds to Figure 3.
Video 3
Sequential sections back and forth through the tomographic volume in orthographic view, followed by reveal and tour of the 3D segmentation in perspective view.
The tour focuses on the thylakoid tip convergence zone at the rim of the chloroplast cup. Halfway through the tour, the chloroplast envelope is removed to reveal the interconnections between adjacent thylakoid tips. The tomogram was 2× binned. Unbinned pixel size: 5.7 Å. Corresponds to Figure 4.
Video 4
Sequential sections back and forth through the tomographic volume in orthographic view, followed by reveal and tour of the 3D segmentation in perspective view.
The tour focuses on the pyrenoid tubules, which fenestrate the starch sheath and transition from cylindrical channels to an interconnected network of smaller membranes at the center of the pyrenoid. The tomogram was 2× binned. Unbinned pixel size: 9.6 Å. Corresponds to Figure 9A–B.
Video 5
Sequential sections back and forth through the tomographic volume in orthographic view, followed by reveal and tour of the 3D segmentation in perspective view.
The segmentation shows the fine structure of a pyrenoid tubule that encases four minitubules. The tomogram was 2× binned. Unbinned pixel size: 5.7 Å. Corresponds to Figure 9E–F.
Video 6
Sequential sections back and forth through the tomographic volume in orthographic view, followed by reveal and tour of the 3D segmentation in perspective view.
The tour first shows how one pyrenoid minitubule (indentation between the light green and lavender halves of the pyrenoid tubule) originates from the space between the blue and purple thylakoids (Figure 10C–D). The segmentation is then flipped over to reveal how a second minitubule originates from the space between the green and blue thylakoids (Figure 10E–F). The tomogram was 2× binned. Unbinned pixel size: 9.6 Å. Corresponds to Figure 10.
Download links
A two-part list of links to download the article, or parts of the article, in various formats.
Downloads (link to download the article as PDF)
Open citations (links to open the citations from this article in various online reference manager services)
Cite this article (links to download the citations from this article in formats compatible with various reference manager tools)
Native architecture of the Chlamydomonas chloroplast revealed by in situ cryo-electron tomography
eLife 4:e04889.
https://doi.org/10.7554/eLife.04889


