Delay-dependent contributions of medial temporal lobe regions to episodic memory retrieval
- University of California, Davis, United States
Figures
Figure 1

Task design and regions of interest.
(A) Overview of the experimental design. Here, all fMRI analyses are conducted on data from the item recognition phase. (B) ROIs included in the main analyses, including the anterior hippocampus (ant. HF), posterior hippocampus (post. HF), perirhinal cortex (PRC), and parahippocampal cortex (PHC). Coronal MRI slices show manually-traced ROIs from a representative subject, resliced to functional resolution and warped into MNI space for display on a template brain.
Figure 2 with 2 supplements

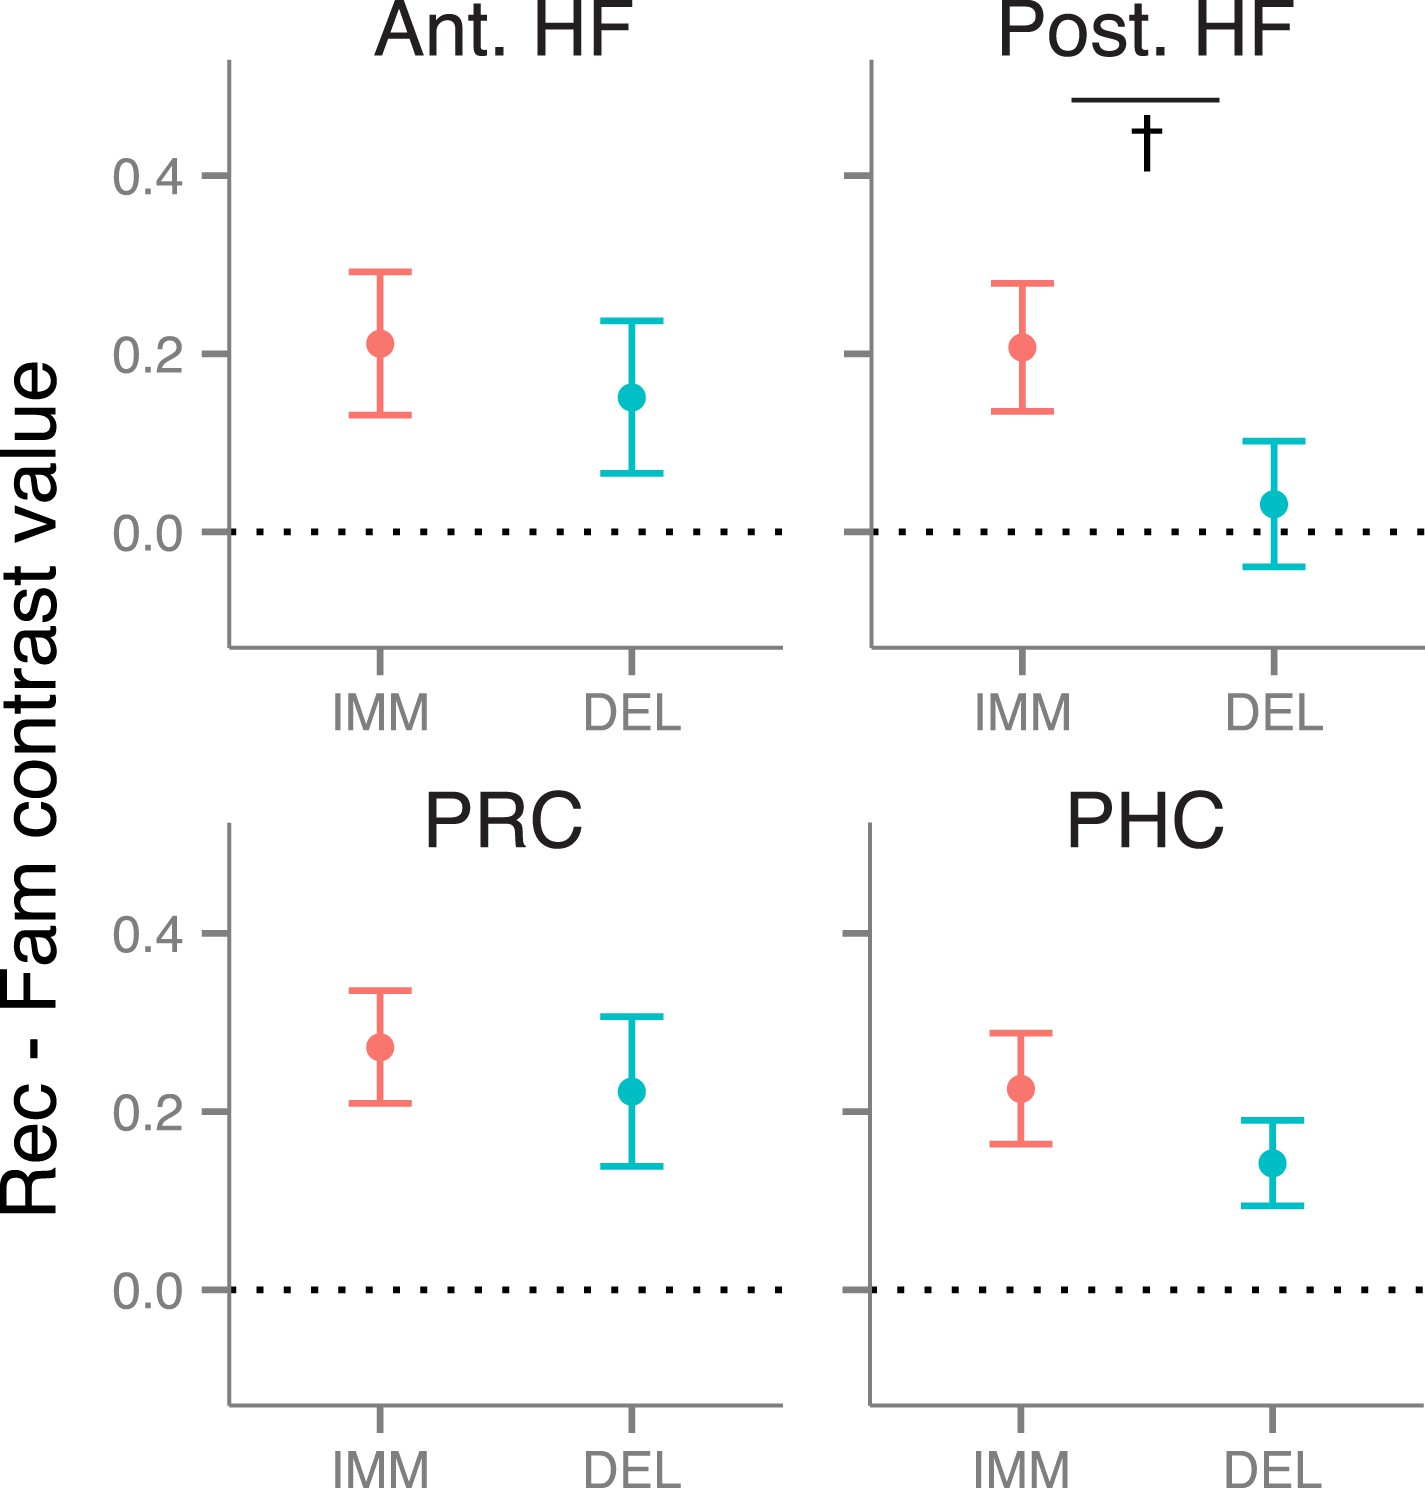
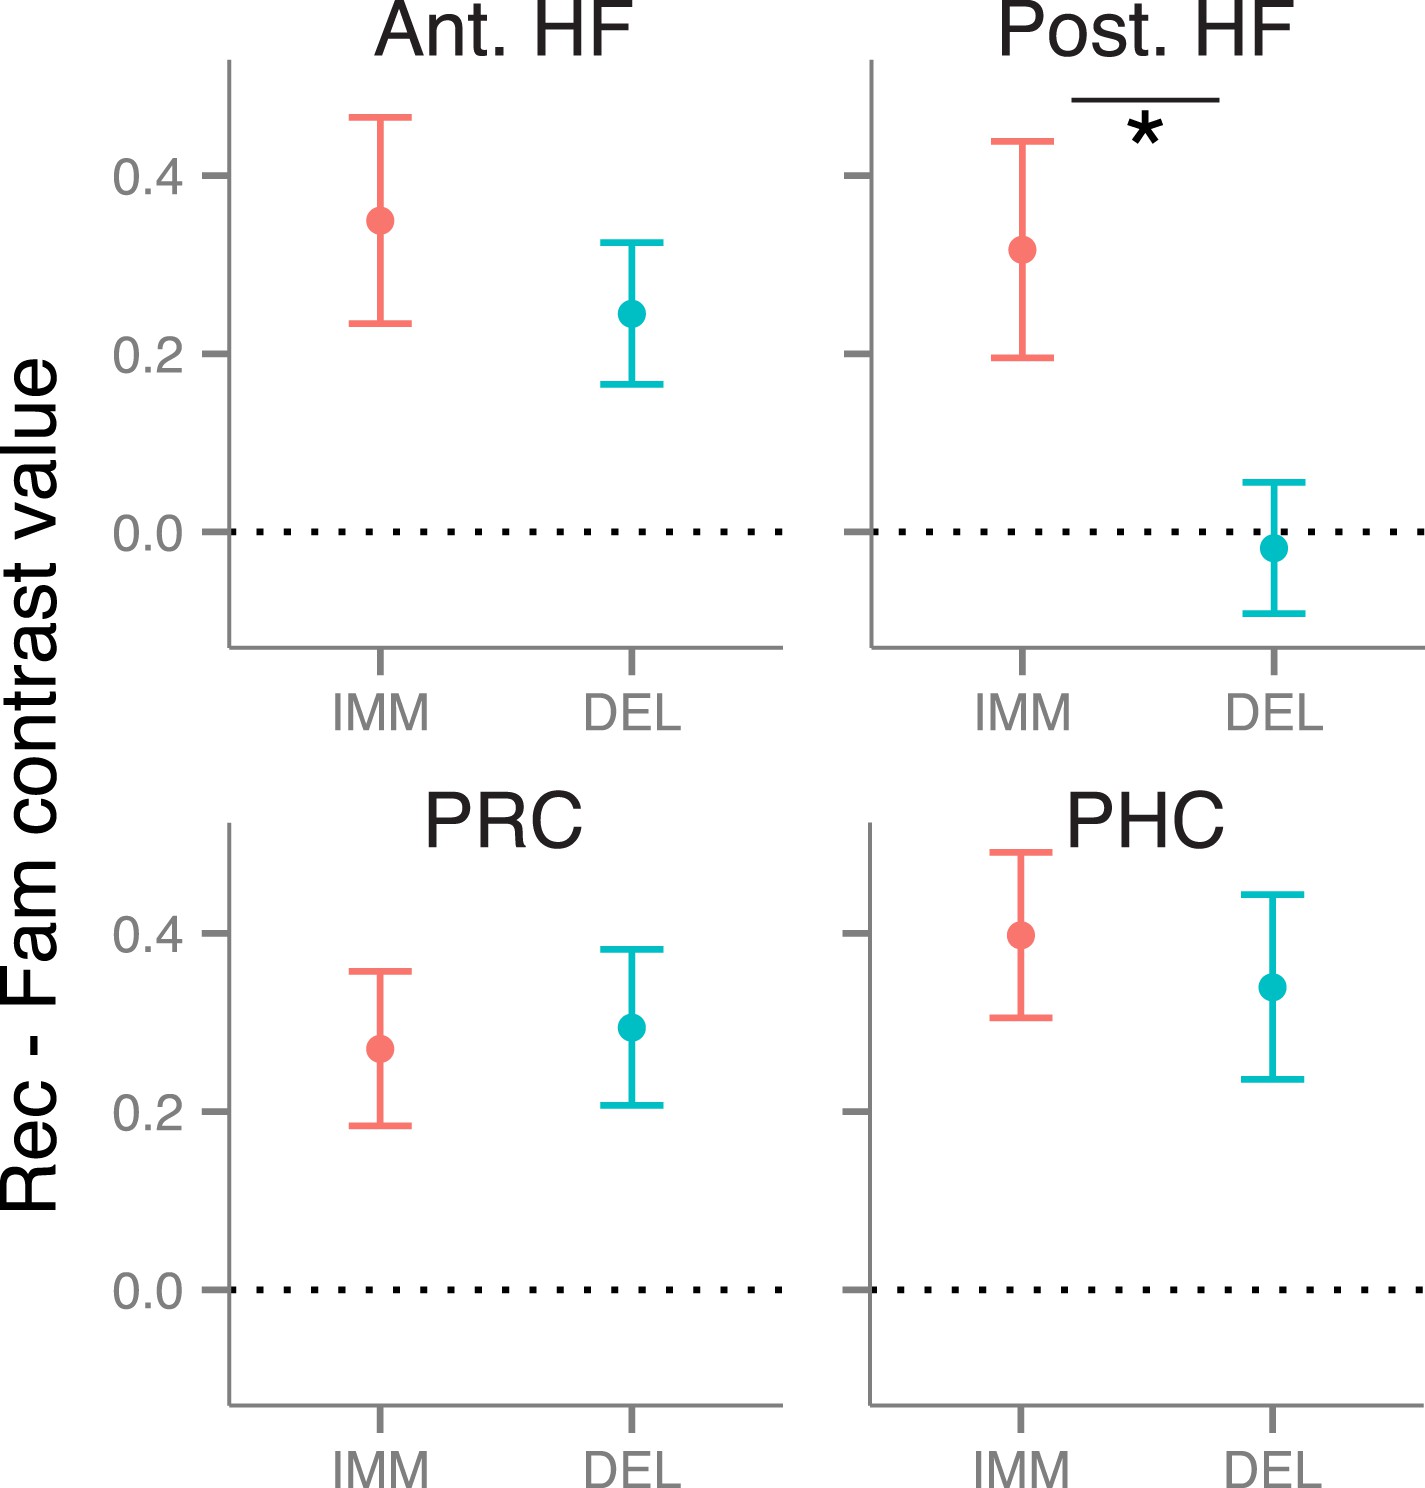
Recollection-related activity in the MTL.
Univariate estimates of recollection-related activity (i.e., the difference in activation for recollection and familiarity trials) for left hemisphere MTL ROIs (similar results hold for right hemisphere ROIs; see Figure 2—figure supplement 1). Asterisk (*) denotes a significant interaction between delay (immediate, delayed) and memory status (recollection, familiarity), p < 0.05. Error bars denote the standard error of the mean. See Figure 2—figure supplement 2 for results from a model in which the number of recollection and familiarity trials were matched between delays. Summary statistics for individual subjects are contained in Figure 2—source data 1, and group-averaged activity estimates for all conditions can be found in Supplementary file 1.
-
Figure 2—source data 1
Activation estimates for MTL ROIs.
- https://doi.org/10.7554/eLife.05025.007
Figure 2—figure supplement 1
Recollection-related activity in right-hemisphere MTL ROIs.
https://doi.org/10.7554/eLife.05025.008
Figure 2—figure supplement 2
Recollection-related activity in a model controlling for the number of trials between delays.
https://doi.org/10.7554/eLife.05025.009
Figure 3 with 2 supplements
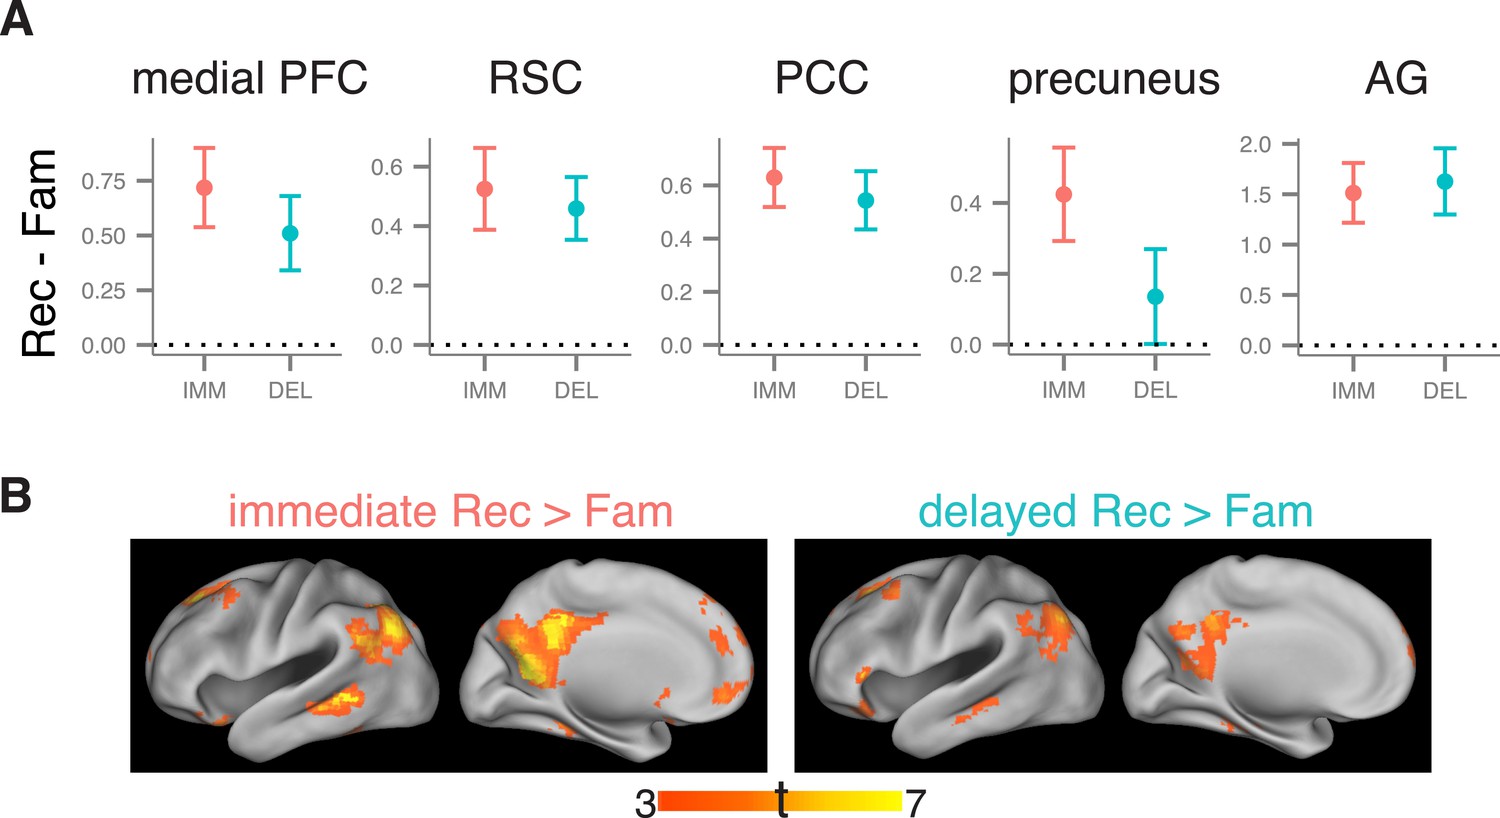
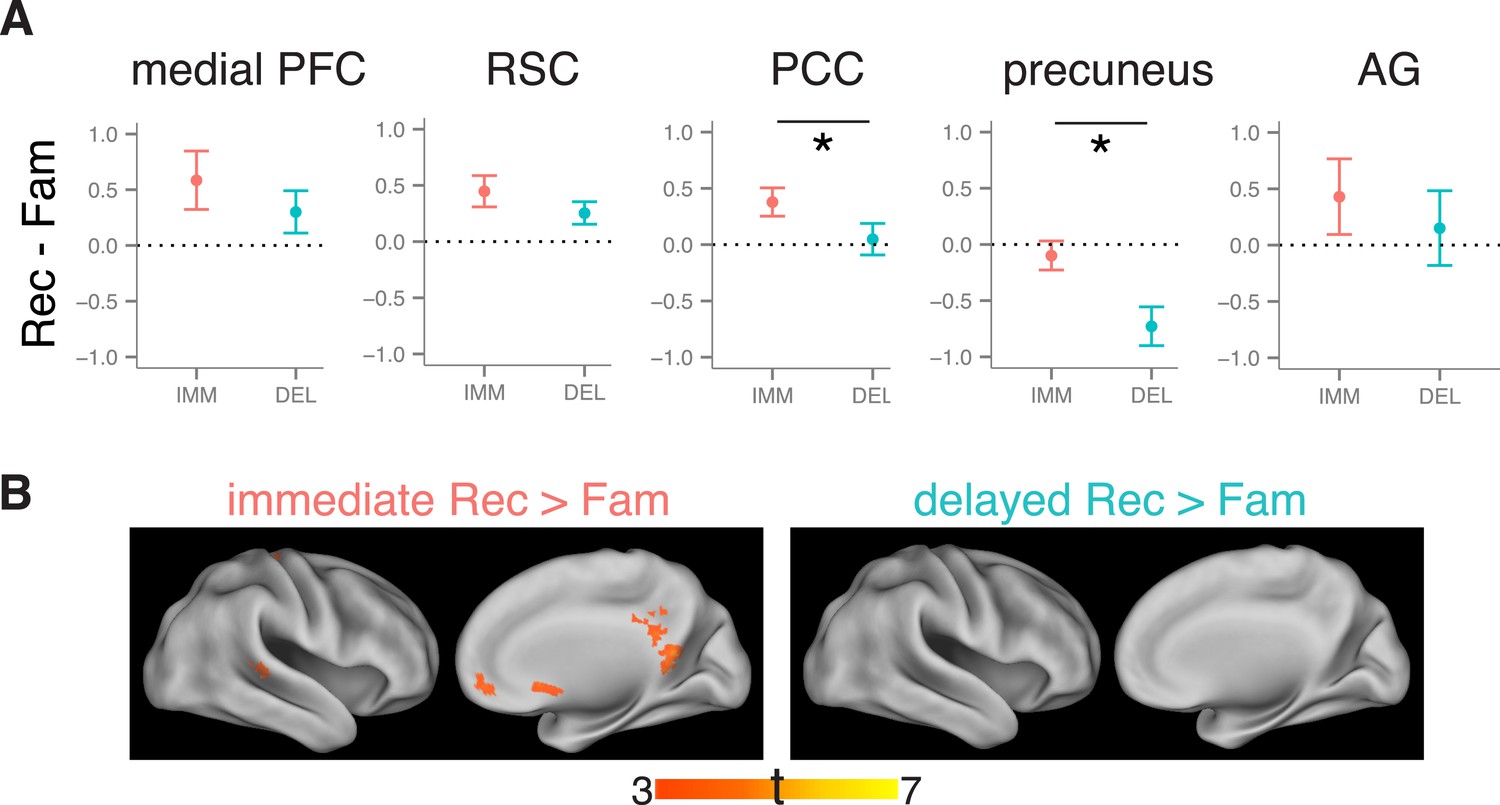
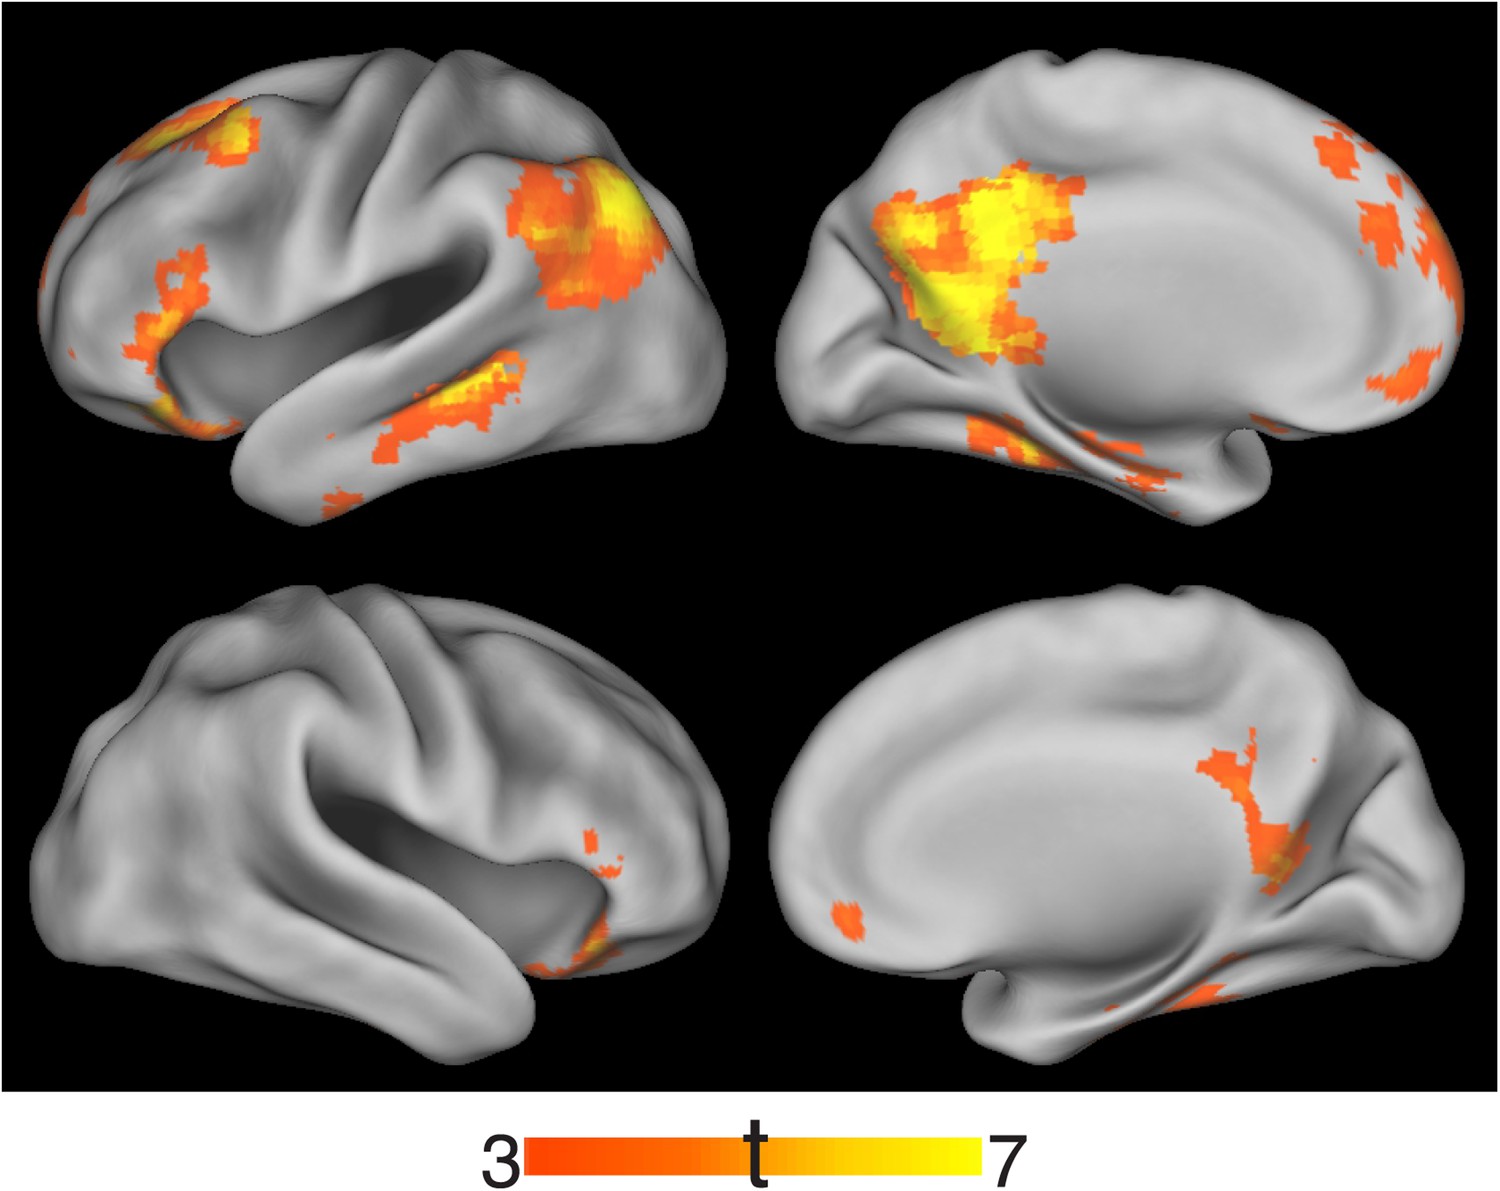
Recollection-related activity in the cortical recollection network.
(A) Univariate estimates of recollection-related activity, that is, the difference in activation for recollection and familiarity trials, for cortical ROIs in the recollection network. Results for left-hemisphere ROIs are shown (see Figure 3—figure supplement 1 for right-hemisphere ROIs). Error bars denote the standard error of the mean. Note that although the precuneus appears to show a reduction in recollection-related activity over time, the interaction was not significant. Summary statistics for individual subjects are contained in Figure 3—source data 1. (B) Voxel-wise maps of recollection-related activity, that is, the difference between recollection and familiarity trial activity, thresholded to display significant clusters (voxel-wise p < 0.001, cluster-corrected p < 0.05). Maps are displayed separately for immediate and delayed recollection. Surface images were rendered in Caret using the PALS atlas (left hemisphere shown; see Figure 3—figure supplement 1 for right hemisphere). Peaks are reported in Supplementary file 2. The conjunction of immediate and delayed recollection-related activity is shown in Figure 3—figure supplement 2.
-
Figure 3—source data 1
Activation estimates for cortical recollection network ROIs.
- https://doi.org/10.7554/eLife.05025.011
Figure 3—figure supplement 1
Recollection-related activity in the right hemisphere of the cortical recollection network.
https://doi.org/10.7554/eLife.05025.012
Figure 3—figure supplement 2
Conjunction of immediate and delayed recollection-related activity.
https://doi.org/10.7554/eLife.05025.013
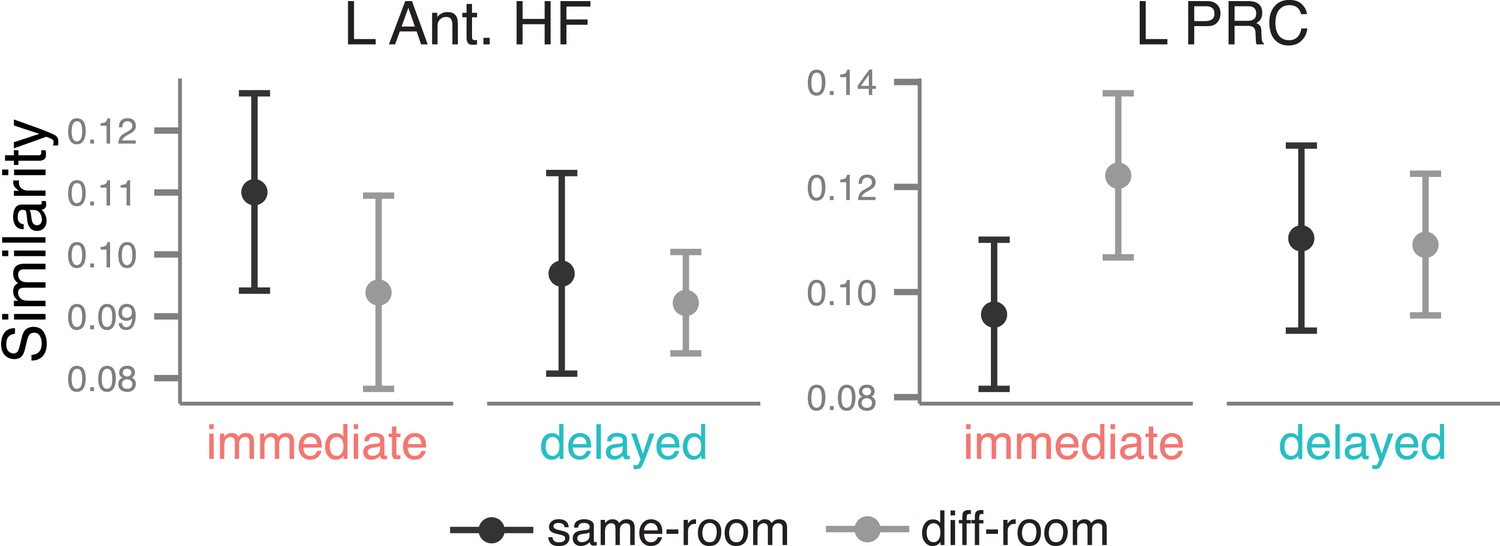
Figure 4 with 3 supplements
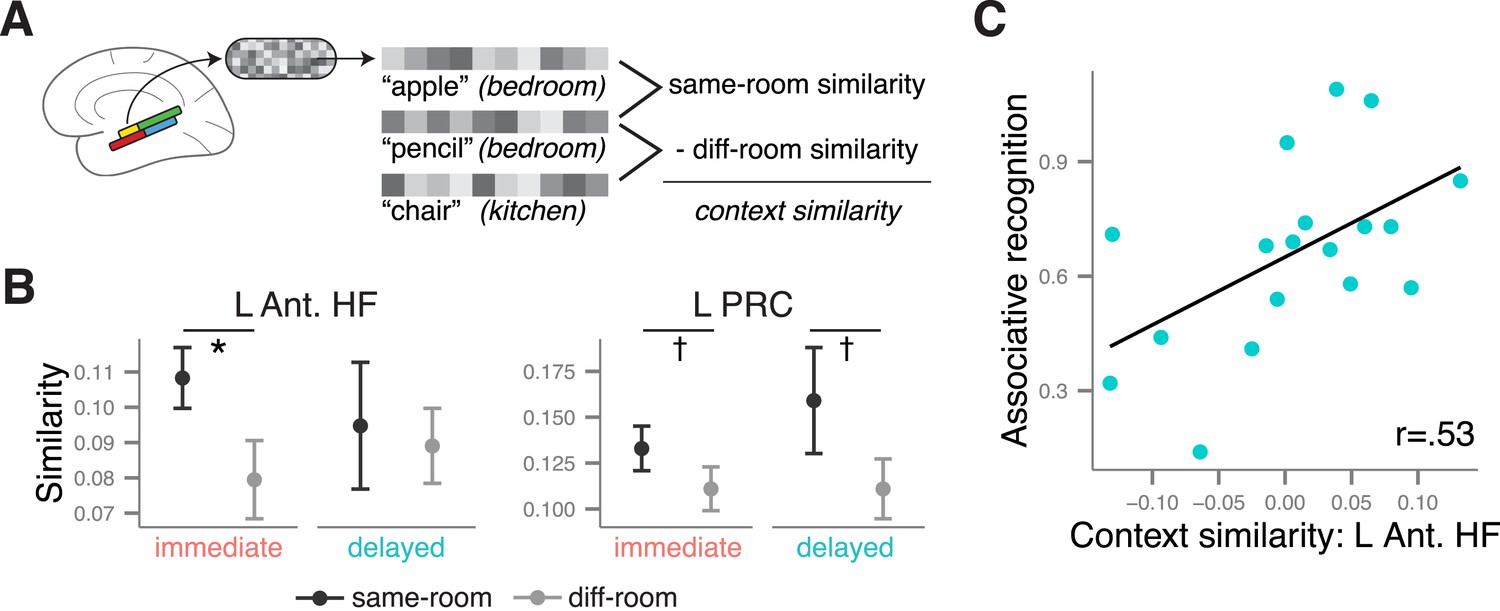
Context similarity in anterior MTL during recollection.
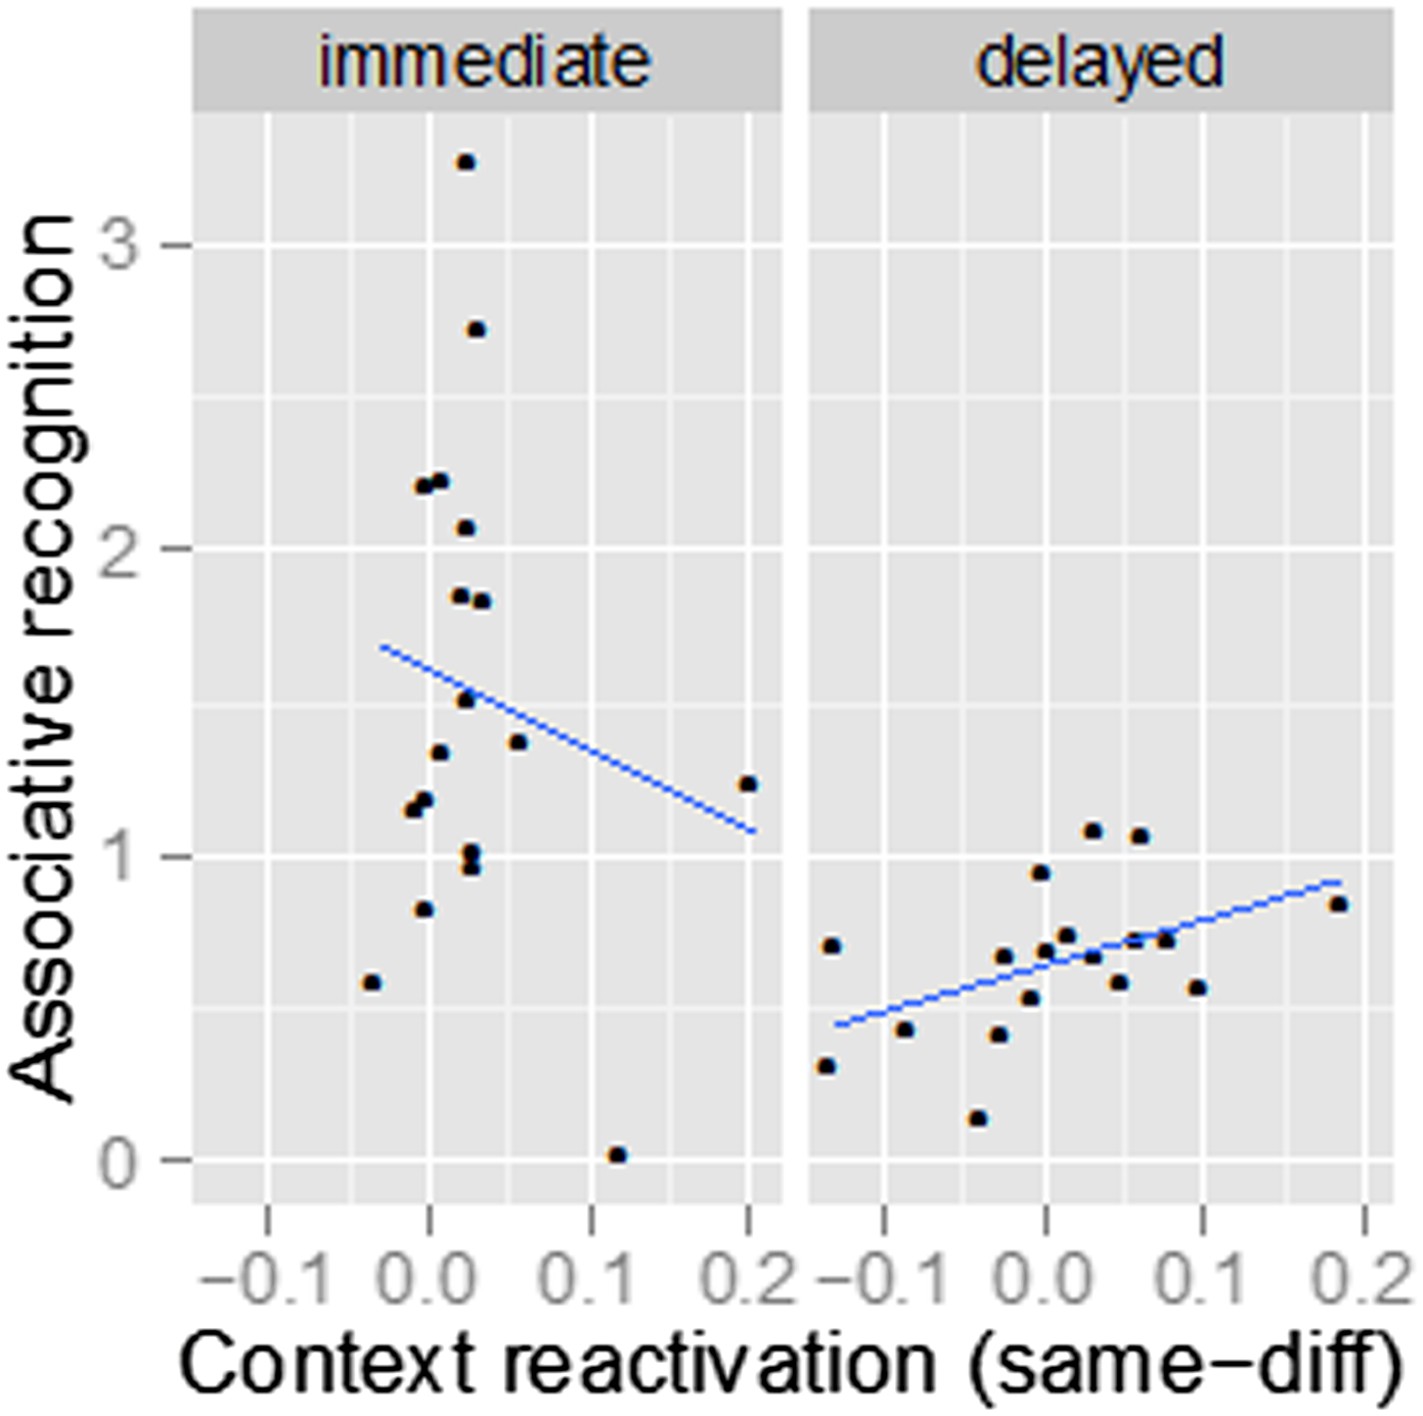
(A) Schematic of the pattern similarity analysis procedure. (B) Estimates of pattern similarity (Pearson's r) for same-room and different-room pairs are plotted for the left anterior HF and left PRC (see Figure 4—figure supplement 1 for other regions). Asterisk (*) denotes a significant effect of context similarity, that is, the difference in similarity for same- and different-room pairs, p < 0.05. Error bars denote the standard error of the mean. The cross (✝) denotes a marginally significant effect, p < 0.08. Summary statistics for individual subjects are contained in Figure 4—source data 1. A non-parametric randomization test confirmed that same-room similarity was greater than what was likely to be observed by chance (Figure 4—figure supplement 2). Furthermore, these effects were observed only for recollection trials, not familiarity trials (Figure 4—figure supplement 3). (C) The relationship between associative recognition accuracy (d′) and context similarity in the left anterior HF.
-
Figure 4—source data 1
Pattern similarity estimates.
- https://doi.org/10.7554/eLife.05025.015
Figure 4—figure supplement 1
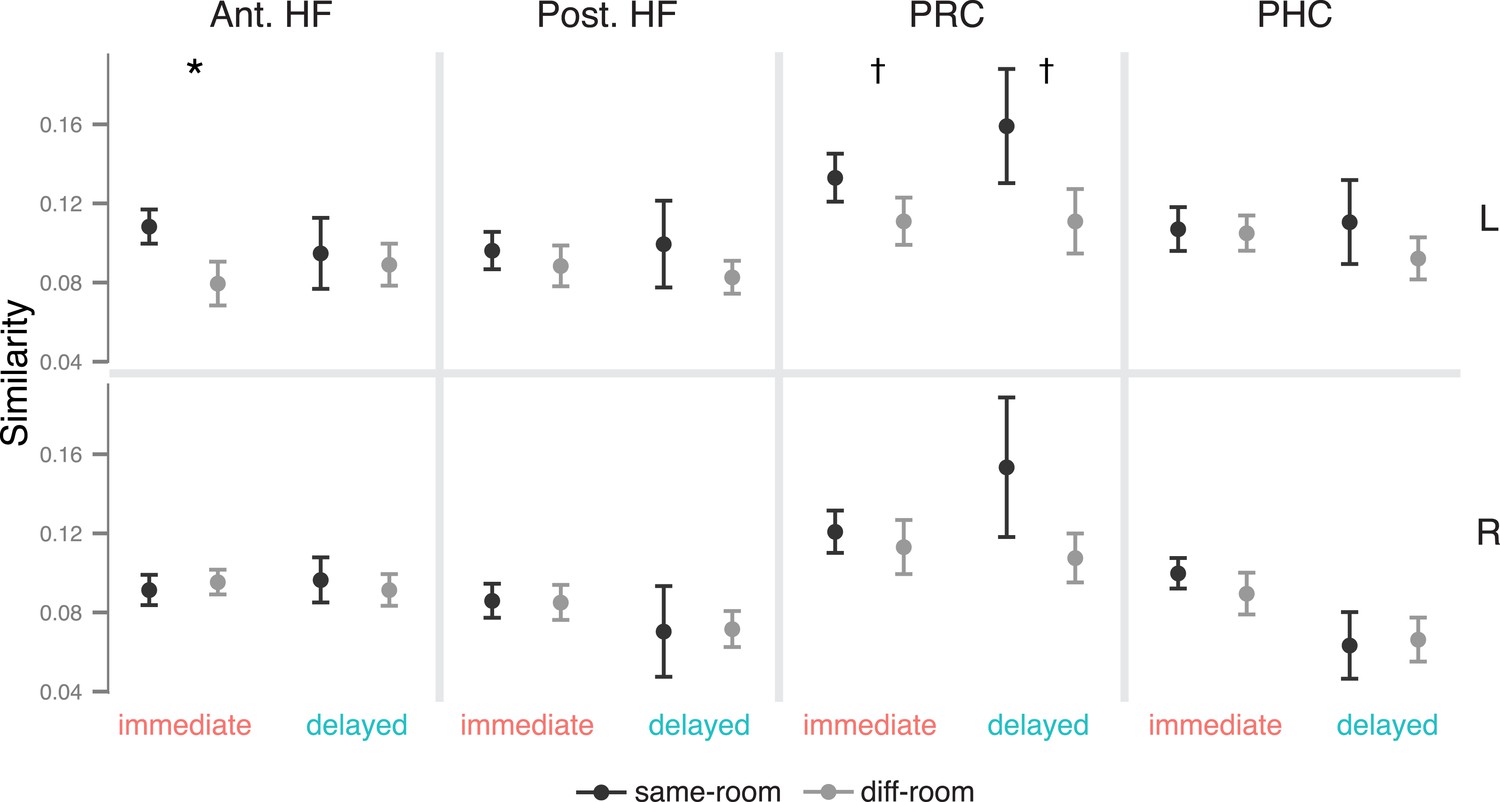
Context similarity effects in all MTL ROIs.
https://doi.org/10.7554/eLife.05025.016
Figure 4—figure supplement 2
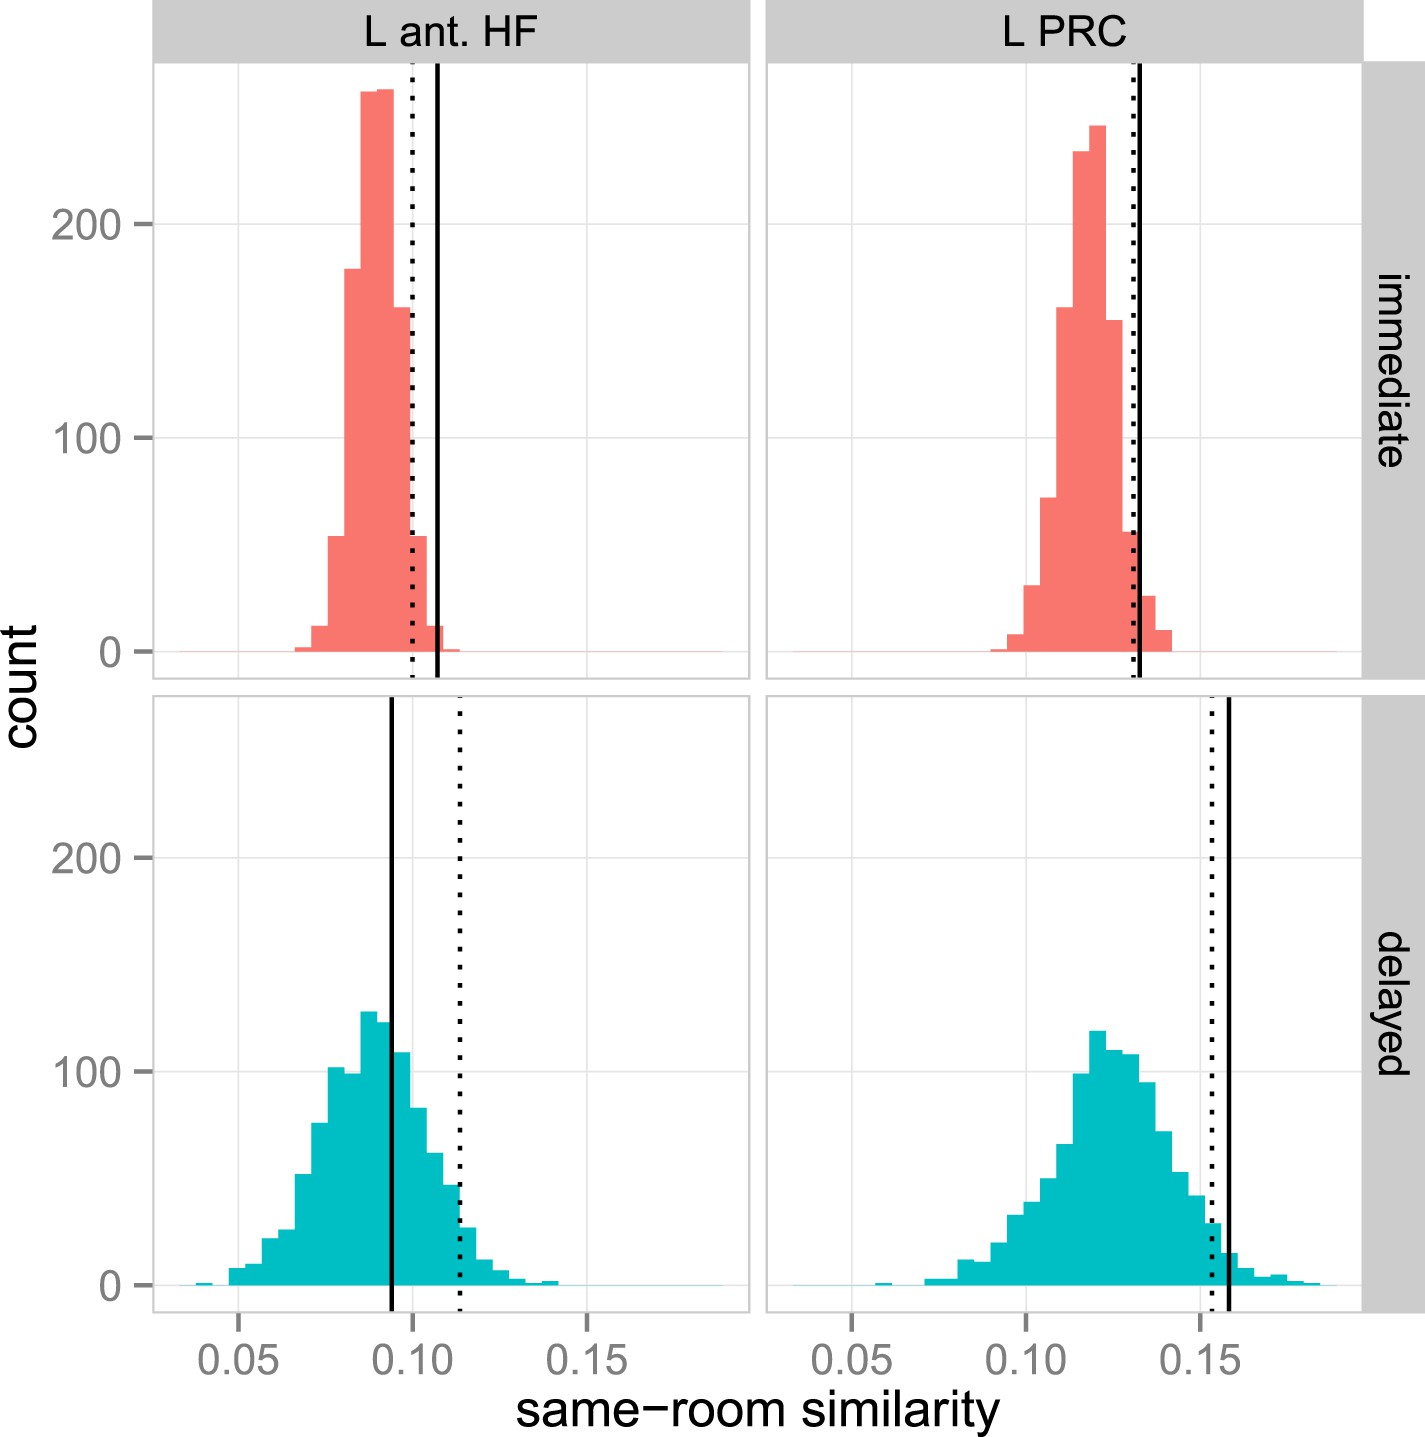
Randomization test confirming context similarity effects in the anterior MTL.
https://doi.org/10.7554/eLife.05025.017
Figure 4—figure supplement 3
Context similarity in the anterior MTL during familiarity.
https://doi.org/10.7554/eLife.05025.018
Author response image 1
Tables
Table 1
Behavioral results
| Item recognition | ‘R’ rate | ‘4’ or ‘5’ rate | d′ | Recollection | Familiarity |
|---|---|---|---|---|---|
| Immediate | 0.46 ± 0.22 | 0.40 ± 0.22 | 1.79 ± 0.43 | 0.44 ± 0.22 | 0.46 ± 0.18 |
| Delayed | 0.25 ± 0.19 | 0.43 ± 17 | 1.14 ± 0.32 | 0.22 ± 18 | 0.32 ± 0.13 |
| Novel | 0.04 ± 0.05 | 0.23 ± 0.09 | – | – | – |
| Associative recognition | ‘intact’ rate | d′ | % correct for ‘R’ responses | % correct for ‘4’ or ‘5’ responses |
|---|---|---|---|---|
| Immediate intact | 0.78 ± 0.13 | 1.34 ± 0.59 | 73.5 ± 16.6 | 68.6 ± 14.8 |
| Delayed intact | 0.64 ± 0.17 | 0.59 ± 0.38 | 65.1 ± 18.4 | 57.7 ± 11.4 |
| Immediate recombined | 0.34 ± 0.14 | – | – | – |
| Delayed recombined | 0.43 ± 0.13 | – | – | – |
-
Note: Summary statistics for individual subjects are contained in Table 1—source data 1.
-
Table 1—source data 1
Behavioral data.
- https://doi.org/10.7554/eLife.05025.005
Additional files
-
Supplementary file 1
MTL activity estimates for all conditions (related to Figure 2).
- https://doi.org/10.7554/eLife.05025.019
-
Supplementary file 2
Table of peak coordinates from the voxel-wise comparison of recollection and familiarity trial activity (related to Figure 3).
- https://doi.org/10.7554/eLife.05025.020
-
Source code 1
Custom Matlab code for the pattern similarity analysis.
- https://doi.org/10.7554/eLife.05025.021
Download links
A two-part list of links to download the article, or parts of the article, in various formats.
Downloads (link to download the article as PDF)
Open citations (links to open the citations from this article in various online reference manager services)
Cite this article (links to download the citations from this article in formats compatible with various reference manager tools)
Delay-dependent contributions of medial temporal lobe regions to episodic memory retrieval
eLife 4:e05025.
https://doi.org/10.7554/eLife.05025


