The majority of transcripts in the squid nervous system are extensively recoded by A-to-I RNA editing
- Tel Aviv University, Israel
- University of Connecticut Health Center, United States
- Bar-Ilan University, Israel
- University of Puerto Rico Medical Sciences Campus, Puerto Rico
Figures
Figure 1
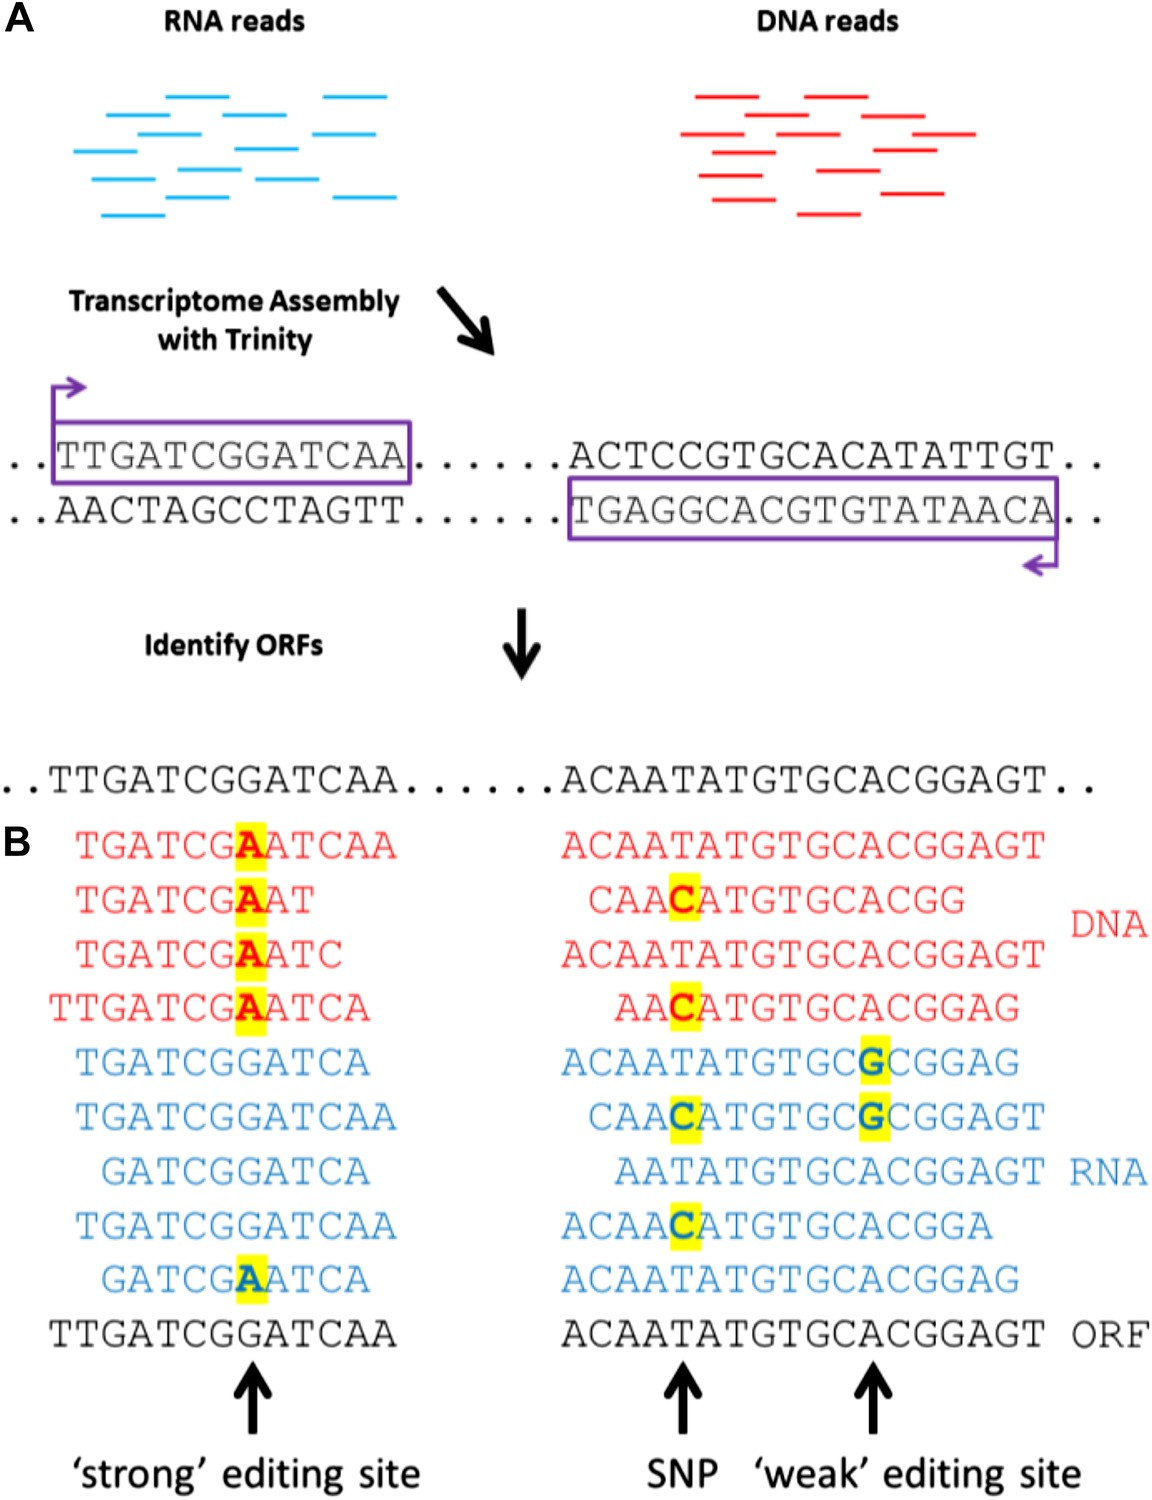
A general approach to detect RNA editing sites in organisms that lack a sequenced genome.
(A) Squid RNA-seq data is used to create a de novo transcriptome followed by the detection of conserved ORFs. (B) ‘Weak’ and ‘strong’ editing sites are detected by comparing RNA and DNA reads from the same animal to the ORFs from the transcriptome. ‘Weak’ editing sites were detected by observing the minority of the RNA reads to differ from the consensus transcriptome nucleotide. ‘Strong’ editing sites, where the consensus transcriptome includes the edited nucleotide, were detected by observing all DNA reads to differ from the transcriptome nucleotide.
Figure 2 with 5 supplements
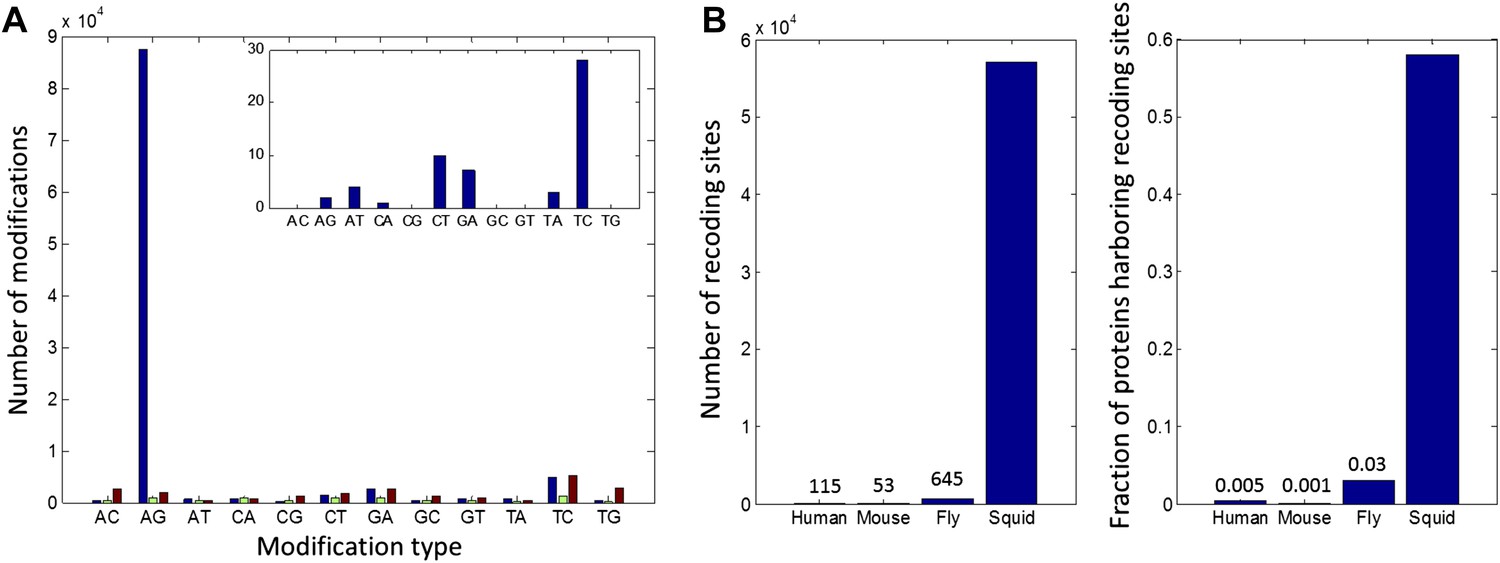
High number of RNA editing sites in squid translates into an extraordinary number of recoding events.
(A) The number of nucleotide modifications observed in the squid nervous system for each possible substitution type (in blue, 87% of all detected modifications were A-to-G). A similar analysis of human and Rhesus macaque sequencing data (green and brown, respectively) shows low levels, and no enrichment, of A-to-I editing in coding regions, as reported previously. In the inset, the distribution of nucleotide modifications observed in squid mitochondria-encoded genes, used here as a negative control. The ADAR enzymes have no reported activity in the mitochondria and, accordingly, no A-to-G overrepresentation is observed. Also see Figure 2—figure supplement 1. (B) Scope of recoding due to RNA editing in squid, both in the total number of recoding events and the total number of genes affected, is orders of magnitude higher than human, mouse, and fly (numbers for other organisms are based on recent publications using RNA-seq datasets comparable to the one used here [Danecek et al., 2012; Ramaswami et al., 2013; St Laurent et al., 2013]).
Figure 2—figure supplement 1
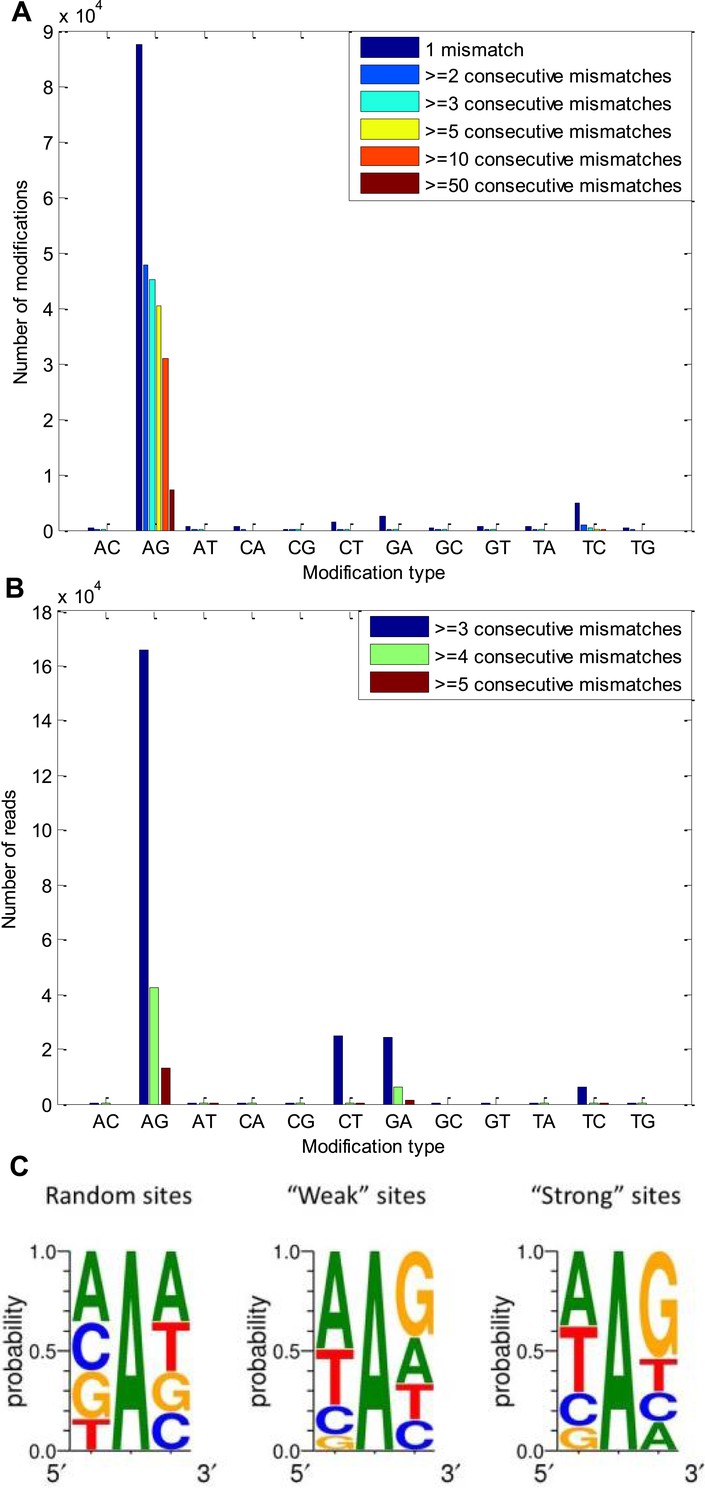
A-to-G modifications appear in clusters of consecutive identical mismatches and show distinctive 5′ and 3′ neighbor preferences.
(A) The number of modifications observed for each possible modification type, considering only modifications that appear in clusters. About half of the A-to-G modifications appear in clusters of at least three consecutive same-type mismatches, in accordance with the expected properties of A-to-I editing sites, found in other organisms (Morse et al., 2002; Levanon et al., 2004). (B) The number of reads with 3, 4, and 5 consecutive identical mismatches for each possible modification type. Most of these reads contained A-to-G modifications. (C) The sequence surrounding of the observed A-to-G modifications, compared with that surrounding random adenosines in our model transcriptome. The sequence surrounding the ‘weak’ sites and the ‘strong’ sites (Figure 1B) are similar to each other and to what is known for other species (Kleinberger and Eisenberg, 2010).
Figure 2—figure supplement 2
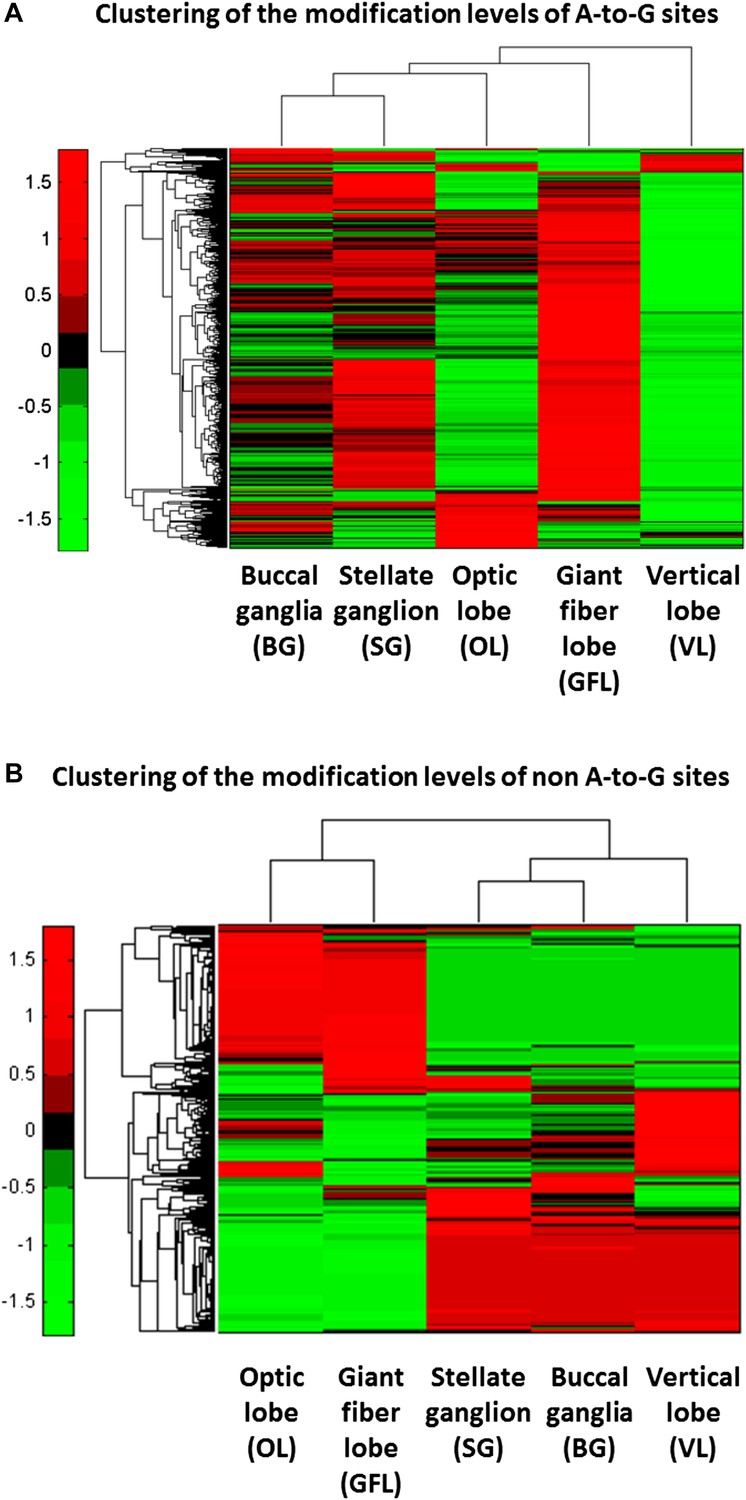
Hierarchical clustering reveals tissue selectivity in the modification levels of the A-to-G sites, but not in the non A-to-G sites.
(A) For the A-to-G sites, different tissues show varying levels of editing, globally, as well as site-specific tissue-dependent regulation. For example, higher modification levels (red) are observed in the GFL tissue whereas low levels (green) are observed in the VL tissue. Yet, some sites (top rows) are edited more strongly in VL. (B) Hierarchical clustering of the non A-to-G modification levels in the five different neuronal tissues. Consistently with the modifications being due to genomic polymorphisms, data cluster according to the animal it was taken from: modification levels in the GFL and OL tissues, which were taken from one individual animal, form one cluster, as do the VL, BG and SG tissues, taken from another individual animal. Modification levels are, by and large, uniform across tissues coming from the same individual animal. Note that in both panels only sites with significantly variable modification levels are presented (binomial analysis was performed with Bonferroni-corrected p-value of 0.05 as a cutoff), each row represents one modification site. Abbreviations: Giant fiber lobe (GFL), Optic lobe (OL), Vertical lobe (VL), Buccal ganglia (BG), and Stellate ganglion (SG).
Figure 2—figure supplement 3

Validation of editing using Sanger sequencing.
(A) An example of editing sites verified using Sanger sequencing in the squid protein piccolo. Arrowheads mark the locations of the editing sites. (B) Editing levels measured by Sanger sequencing for the 40 sites correlate with RNA sequencing results.
Figure 2—figure supplement 4
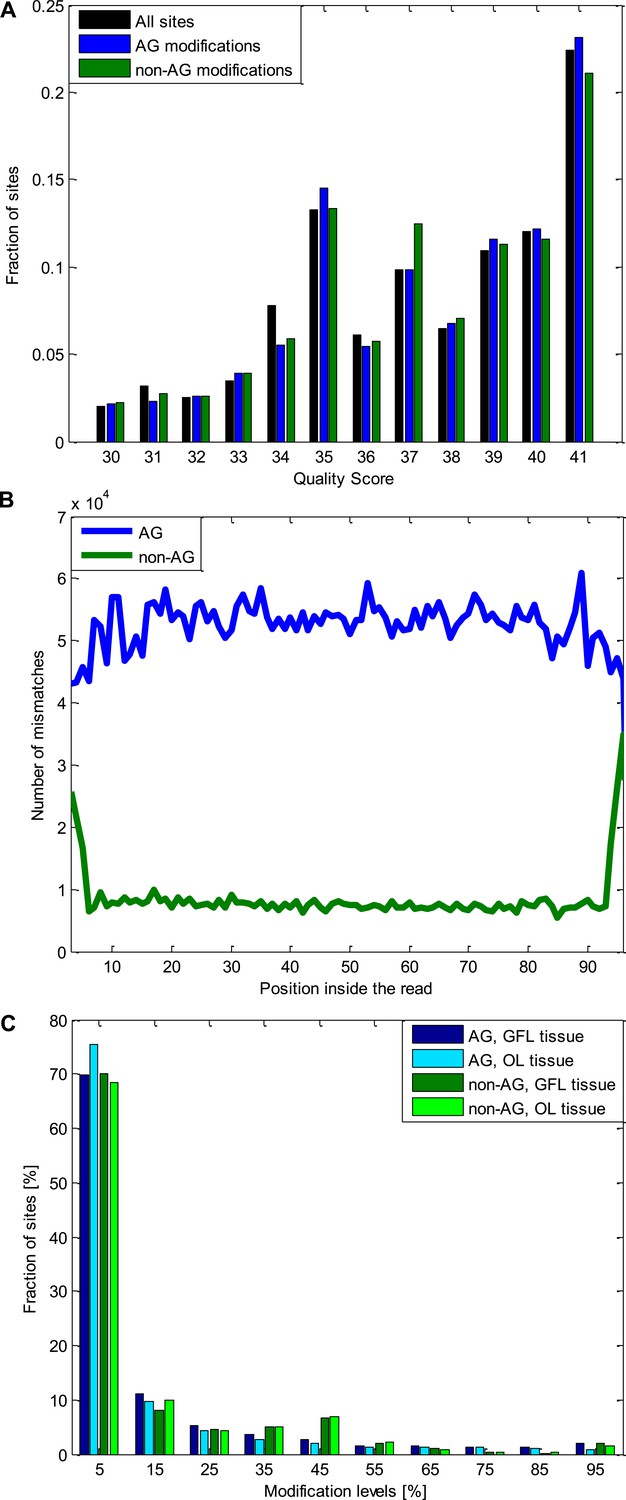
Quality controls for the A-to-G modifications and the non A-to-G modifications.
(A) The distribution of the quality scores for all the sites used (all the positions inside all the analyzed reads), A-to-G modifications, and non A-to-G modifications. No difference is observed between these three groups. Note that sites with Q < 30 were excluded. (B) The number of mismatches detected as a function of the position inside the read. Non A-to-G mismatches tend to occur at reads' ends, suggesting alignment artifacts (which tend to affect reads' ends) are responsible to some of these mismatches (Ramaswami et al., 2012). A-to-G mismatches do not show such tendency. (C) The distribution of modification levels for A-to-G and non A-to-G sites, for the GFL and OL tissues. The increased number of non A-to-G sites with ∼50% modification level hint at some genomic polymorphisms (SNPs), that were not represented in our DNA reads due to the limited coverage, are included among the non A-to-G mismatches. Consistently, 51% of the sites with non A-to-G modification levels between 40–60% recur in both tissues (coming from the same individual animal), compared to only 22% of the A-to-G modifications in the same range. Similarly, 50% of non A-to-G modification levels higher than 90% recur in both tissues (coming from the same individual animal), compared to only 21% for A-to-G modifications in the same range. These two ranges are the only ones in which such difference is observed. Abbreviations: Giant fiber lobe (GFL), Optic lobe (OL), quality score (Q).
Figure 2—figure supplement 5
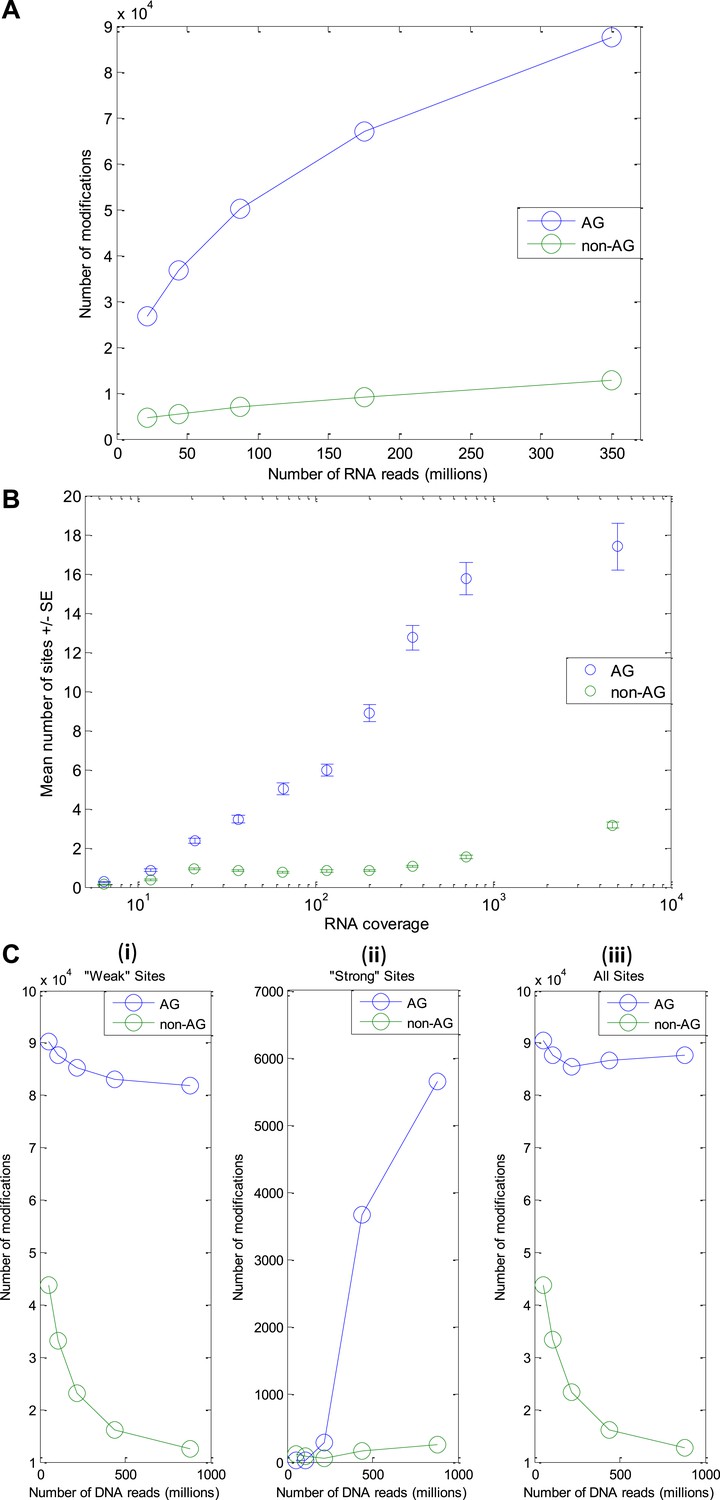
Number of modification sites detected as a function of the amount of DNA and RNA reads.
(RNA-seq from the GFL and OL tissues only, originating from the animal whose DNA was sequenced). (A) The number of A-to-G sites detected increases with the number of RNA reads, with no sign for saturation. Thus, we expect the number of editing sites to be much larger than the one reported here. (B) The number of A-to-G sites detected in each gene correlates with the gene's RNA coverage, demonstrating that with much larger RNA-seq data, the number of detected editing sites could be as high as ∼200,000 (expected number of 17 sites per protein, on average, for each of the ∼12K ORFs in our model transcriptome). (C) The number of modification sites detected as a function of the number of DNA reads. Detection of modification sites is based on mismatches between cDNA reads and the consensus. However, one of the main sources for such mismatches, which masks the signal due to RNA editing, is heterozygosity of the genome. The more DNA reads available, the better one can identify and exclude genomically heterozygous sites (SNPs) and improve signal-to-noise ratio. (i) ‘weak’ sites detection (ii) ‘strong’ sites detection - here exclusion of SNPs is part of the detection scheme itself (see Methods) and thus the number of detected sites (and not only the signal-to-noise ratio) increases with gDNA coverage (iii) ‘Weak’ and ‘strong’ sites, combined. Abbreviations: Giant fiber lobe (GFL), Optic lobe (OL), Standard Error (SE).
Figure 3 with 1 supplement

Editing often recodes multiple amino acids in the same protein.
(A) The fraction of the squid genes that harbor multiple recoding events. About a third of the squid proteins harbor three or more recoding sites and more than 10% harbor 10 or more recoding sites. (B) Homology-modelling of the α Spectrin protein in which 10% of the amino acids (247/2412) are recoded by editing. Amino acids 1602 to 1918 of the squid α Spectrin protein are included in the 3-D model. Recoding sites are highlighted in green. Recoding sites with tissue-dependent levels are highlighted in red and the corresponding editing levels are indicated in the table. Also see Figure 3—figure supplement 1.
Figure 3—figure supplement 1
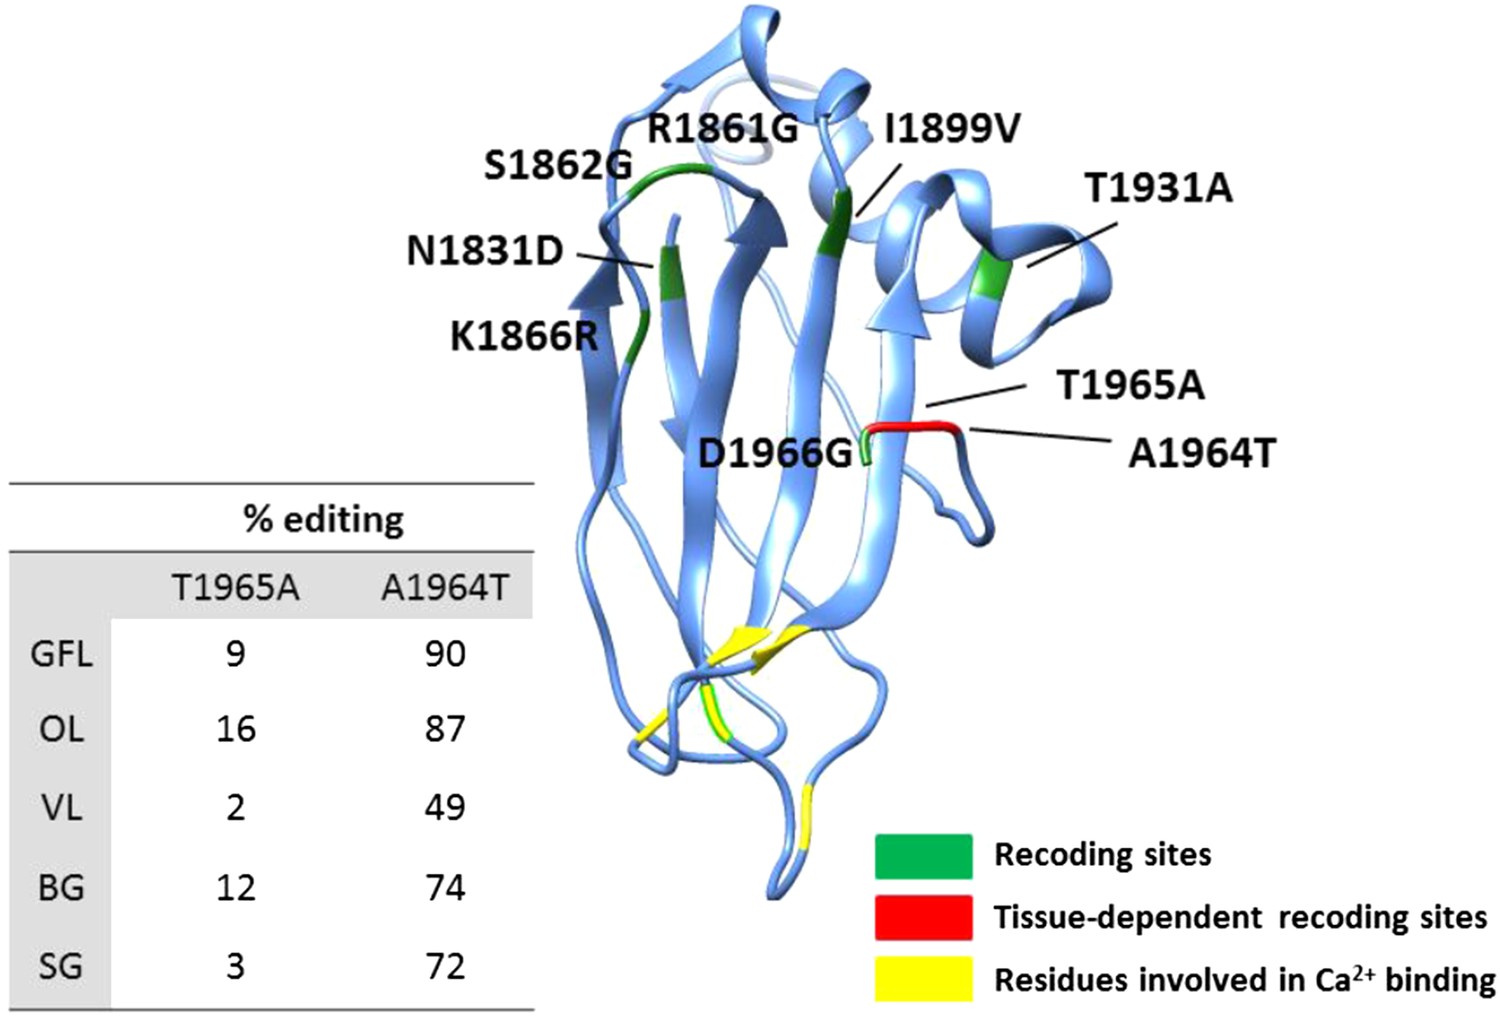
Homology-modelling of the squid Piccolo protein in which 9% of the amino acids (182/2098) are recoded by editing.
Amino acids 1830 to 1966 of the squid Piccolo protein are included in the 3-D model. Recoding sites with tissue-dependent and -independent editing levels are highlighted in red and green, respectively. Aspartate residues involved in Ca2+ binding are highlighted in yellow. Abbreviations: Giant fiber lobe (GFL), Optic lobe (OL), Vertical lobe (VL), Buccal ganglia (BG), and Stellate ganglion (SG).
Figure 4 with 3 supplements
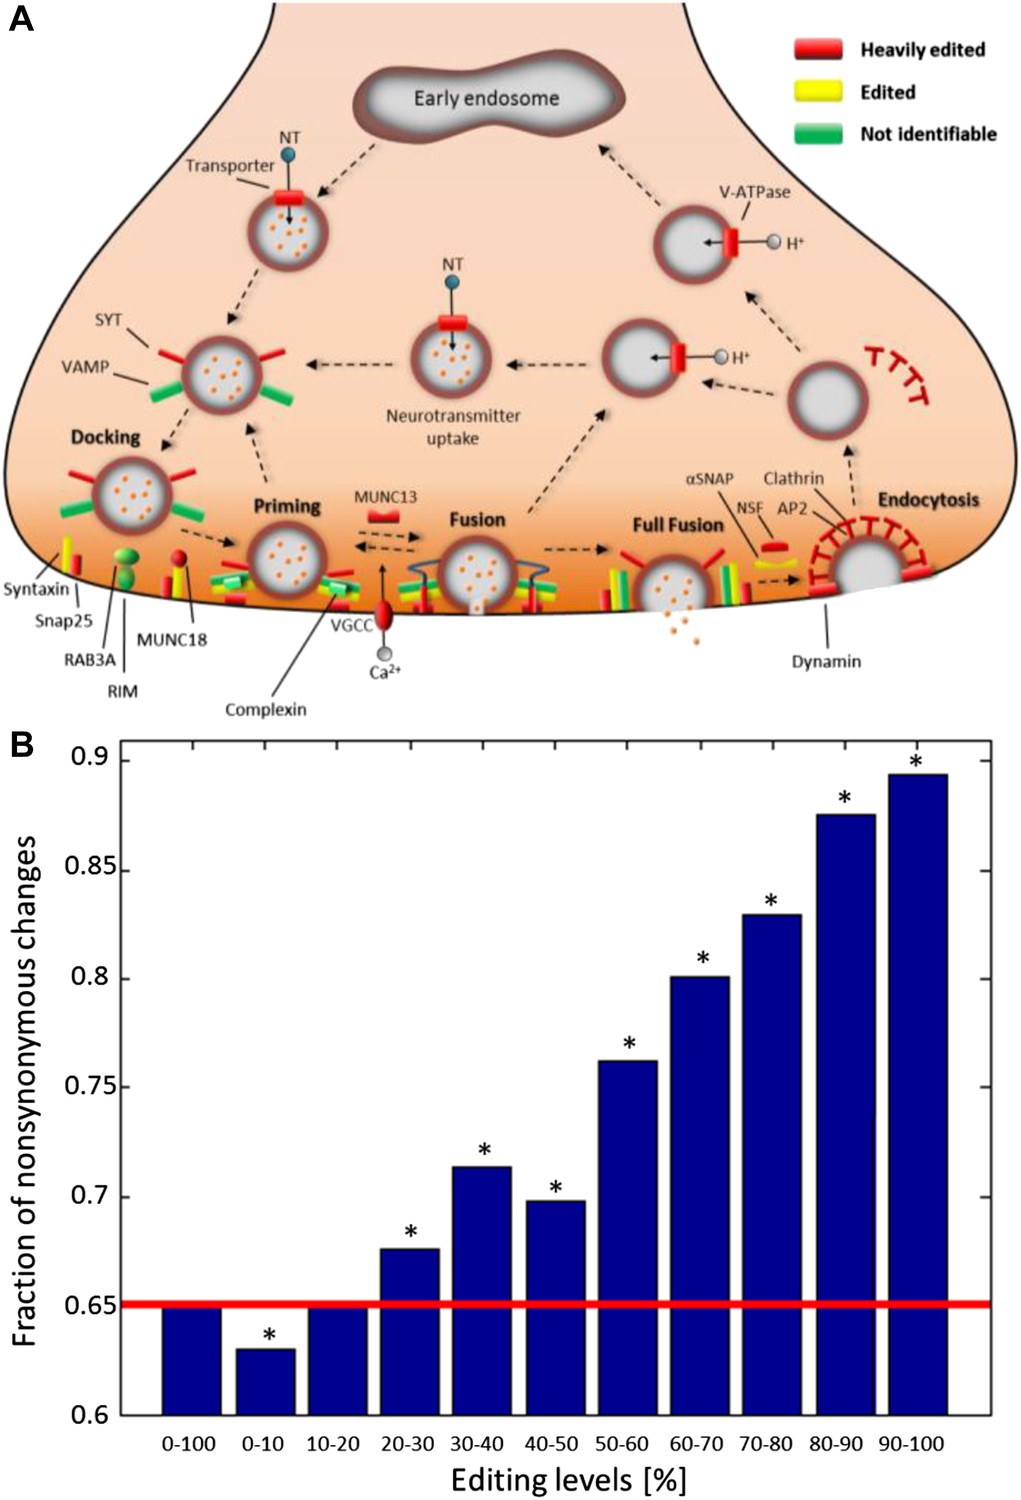
Recoding due to RNA editing affects complete molecular pathways and is likely to be more advantageous in sites with high editing levels.
(A) All the squid proteins present in the KEGG ‘Synaptic vesicle cycle’ pathway are edited, and most are heavily edited. We define ‘heavily edited proteins’ as those for which the cumulative recoding level, that is the editing level summed over all recoding sites, exceeds unity. These are marked red, other edited proteins yellow, and proteins not identifiable in the squid transcriptome are shown in green. Also see Figure 4—figure supplement 1. (B) The fraction of nonsynonymous codon changes as a function of the editing levels, using data from the GFL and OL tissues combined. The higher the editing level, the higher the fraction of nonsynonymous codon changes. The fraction expected by chance is shown in red. A similar relationship is also true for every tissue separately (Figure 4—figure supplement 2A). Asterisks mark p-value <0.001 estimated using 1000 bootstrap runs.
Figure 4—figure supplement 1
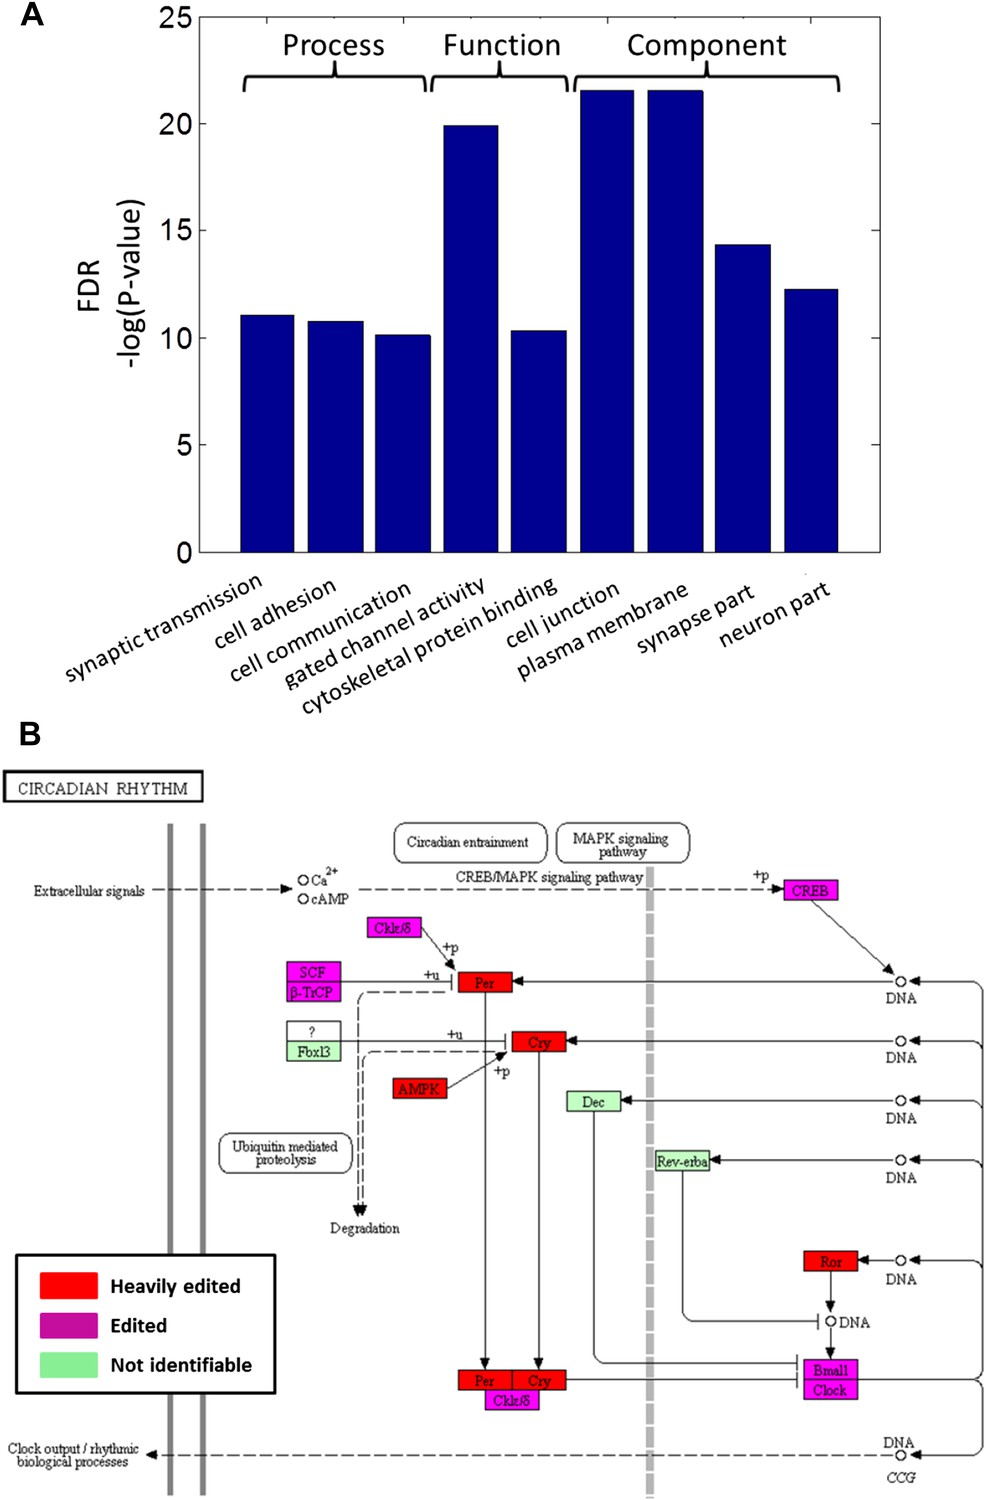
Recoding events are enriched in genes with neuronal and cytoskeletal functions and globally affect molecular pathways.
(A) The top-scoring Gene Ontology (GO) terms (rated by false discovery rate, FDR), enriched in a list of squid ORFs ranked by the cumulative recoding level, that is the editing level summed over all recoding sites (Eden et al., 2009). (B) All of the identifiable squid proteins present in the KEGG pathway ‘Circadian rhythm’ are edited, and many are heavily edited. We define ‘heavily edited proteins’ as those for which the cumulative recoding level exceeds unity (i.e., each copy of the protein is expected to have at least one modified amino acid, on average). These are marked red, other edited proteins in magenta, and proteins not identifiable in the squid transcriptome in green. This figure was created using the KEGG (Kanehisa and Goto, 2000) pathway database website (http://www.genome.jp/kegg/pathway.html). Editing levels were calculated using data from the Giant fiber lobe (GFL) and Optic lobe (OL) tissues combined.
Figure 4—figure supplement 2
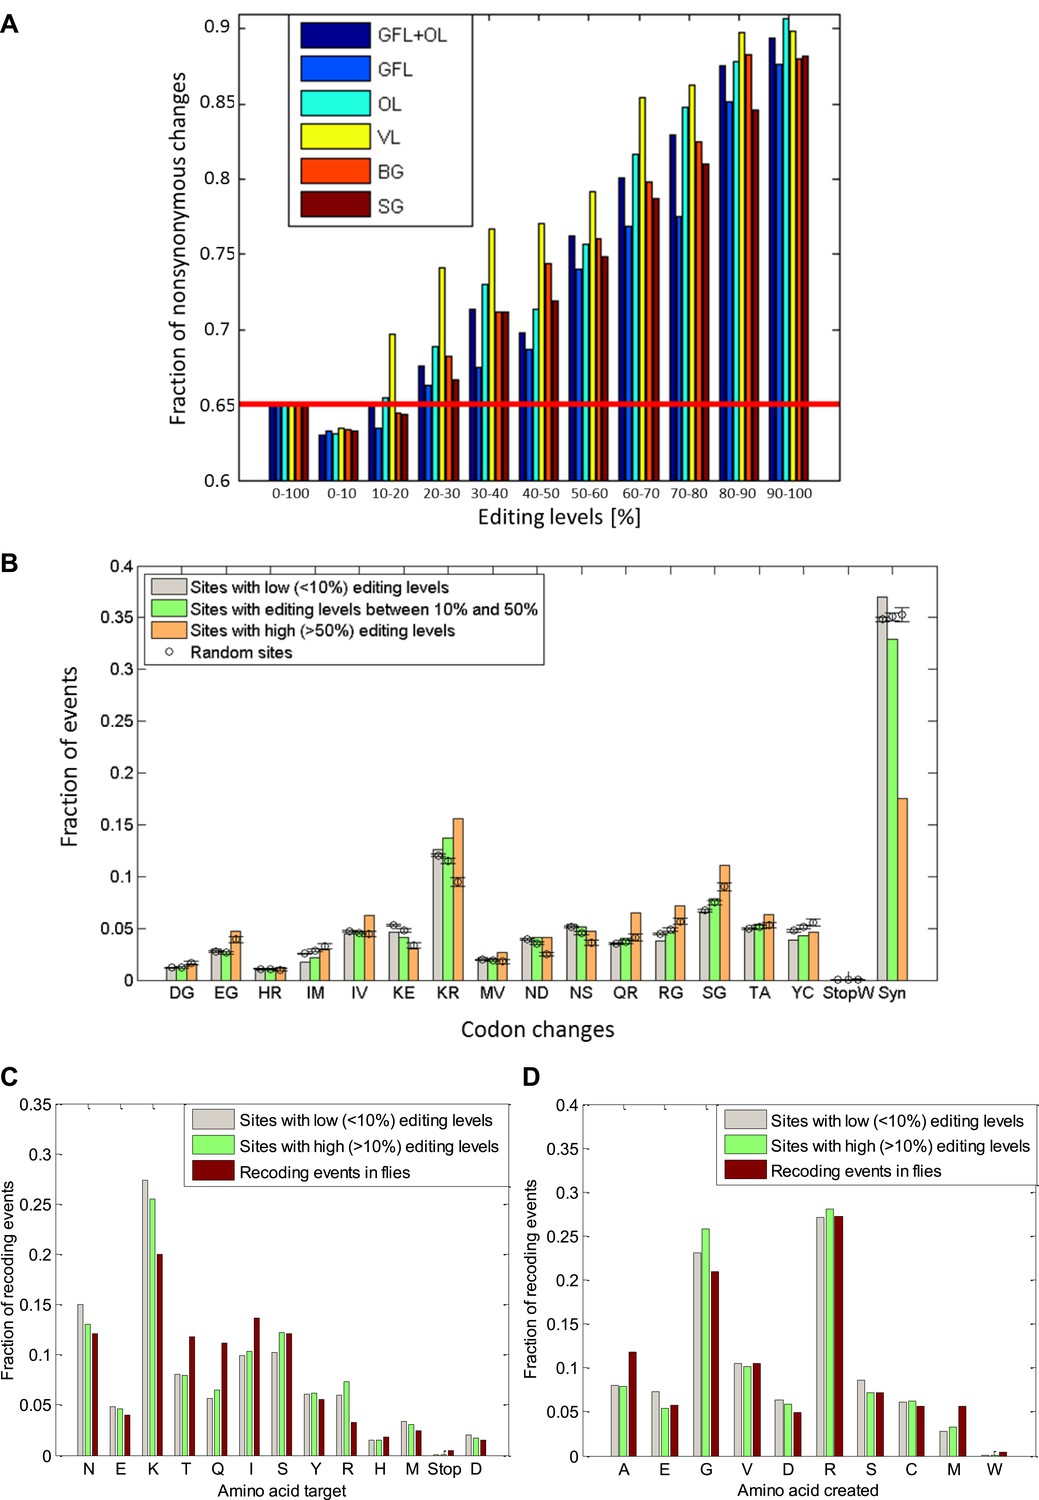
The fraction of nonsynonymous codon changes as a function of editing levels and the amino acid modifications due to editing.
(A) For high editing levels, the fraction of nonsynonymous codon changes is significantly different from the fraction expected by chance for all the neuronal tissues examined. The fraction expected by chance (see ‘Materials and methods’) is shown in red. (B), The observed distribution of recoding types for sites with editing levels lower than 10%, between 10–50%, and higher than 50%. Highly edited sites favor the creation of glycine and arginine, mainly at the expense of lysine, in a statistically significant manner. Expected values and error bars were calculated by using the mean values and standard deviation of 100 bootstrap runs, respectively, generated by randomly modifying adenosine in a way that preserves the editing sequence preference and the number of events. (C) and (D): Amino acid targeted by the editing and created by the editing in both squid and Drosophila (St Laurent et al., 2013). The most frequent target for removal is lysine, and glycine and arginine are frequently created due to editing. Editing levels were calculated using data from the GFL and OL tissues combined. Abbreviations: Giant fiber lobe (GFL), Optic lobe (OL), Vertical lobe (VL), Buccal ganglia (BG), and Stellate ganglion (SG).
Figure 4—figure supplement 3
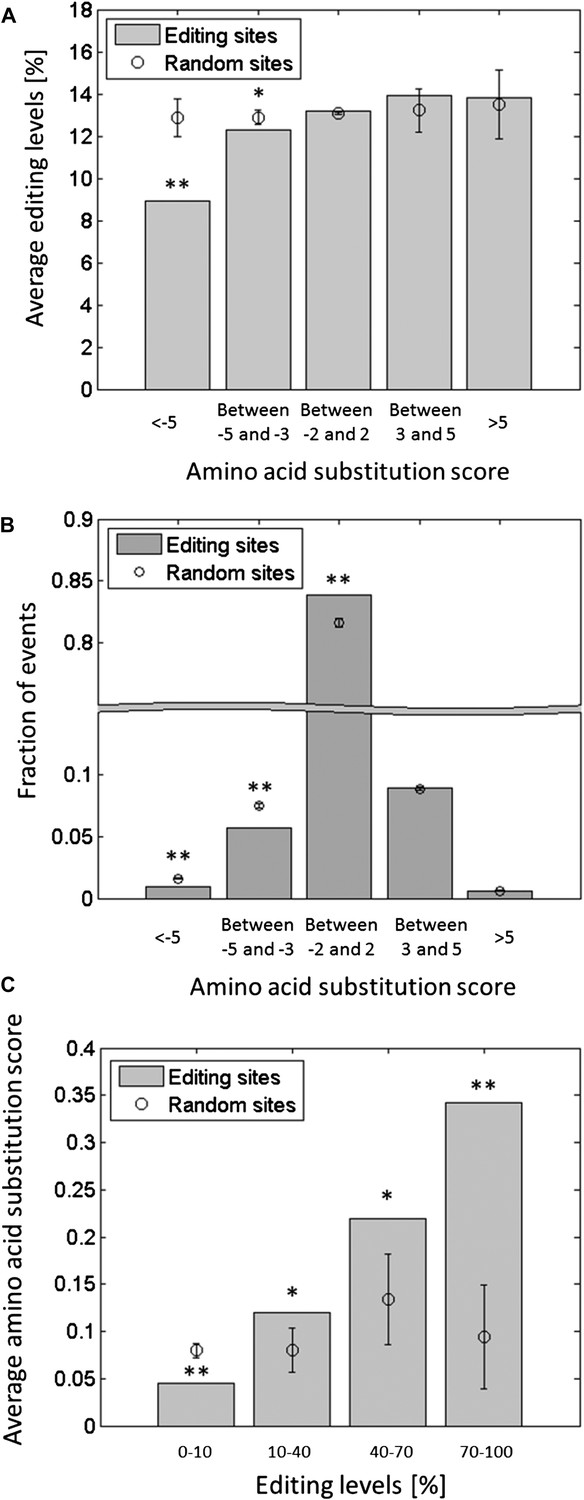
Editing tends to avoid potentially deleterious recoding events.
Each squid ORF was aligned against the conserved domains in the Conserved Domain Database (CDD) (Marchler-Bauer et al., 2013), and the score for substituting each amino acid by all other types of amino acids was calculated (Boratyn et al., 2012). The substitution score is a positive or negative integer, reflecting amino acid substitution which, compared to chance, occur frequently or infrequently in the alignment of the conserved domains, respectively. (A) The average editing levels, using data from the GFL and OL tissues combined, as a function of the amino acid substitution score. The average editing levels for negative substitution scores is significantly lower compared to what is expected by chance. (B) The distribution of the recoding sites as a function of the amino acid substitution score. Recoding sites tend to avoid large negative substitution scores compared with random changes. (C) The average substitution score as a function of the editing levels, using data from the GFL and OL tissues combined. The higher the editing levels, the higher the average substitution score, indicating that highly edited sites are more likely to recode to amino acids that occur frequently in other species. Expected values and error bars were calculated by using the mean values and standard deviation of 10,000 bootstrap runs, respectively. For A and C, the editing levels in all the sites with the same recoding type were randomly shuffled. For B, adenosines were randomly modified in a way that preserves the sequence preference and the total number of editing events. One asterisk mark p-value <0.05, two mark p-value<1e-4. Abbreviations: Giant fiber lobe (GFL), Optic lobe (OL).
Additional files
-
Supplementary file 1
Statistics, Primers and Data. (A) Statistics of the human and macaque datasets analyzed using our detection procedure. (B) About half (15/33) of the validated editing sites in human blood sample and Macaque brain sample were identified by our detection procedure. (C) Primers used for the Sanger validation experiments in 19 ORFs. (D) 40 editing sites validated using Sanger sequencing. (E) Primers used for the MiSeq validation experiments in 60 ORFs. (F) Summary of the MiSeq validation experiments. (G) 143 A-to-G modification sites detected using the HiSeq data and were either validated (120 sites) or not validated (23 sites) using the MiSeq data. (H) The Gene ontology (GO) terms enriched in a list of squid ORFs ranked by the cumulative recoding level, that is the editing level summed over all recoding sites. (I) Squid ORFs mapped to all human KEGG pathways. (J) Recoding in 87 squid ORFs that encode voltage and neurotransmitter gated ion channels, ion transporters, synaptic release machinery and molecular motors.
- https://doi.org/10.7554/eLife.05198.016
Download links
A two-part list of links to download the article, or parts of the article, in various formats.
Downloads (link to download the article as PDF)
Open citations (links to open the citations from this article in various online reference manager services)
Cite this article (links to download the citations from this article in formats compatible with various reference manager tools)
The majority of transcripts in the squid nervous system are extensively recoded by A-to-I RNA editing
eLife 4:e05198.
https://doi.org/10.7554/eLife.05198


