Dosage compensation can buffer copy-number variation in wild yeast
- University of Wisconsin-Madison, United States
Figures
Figure 1
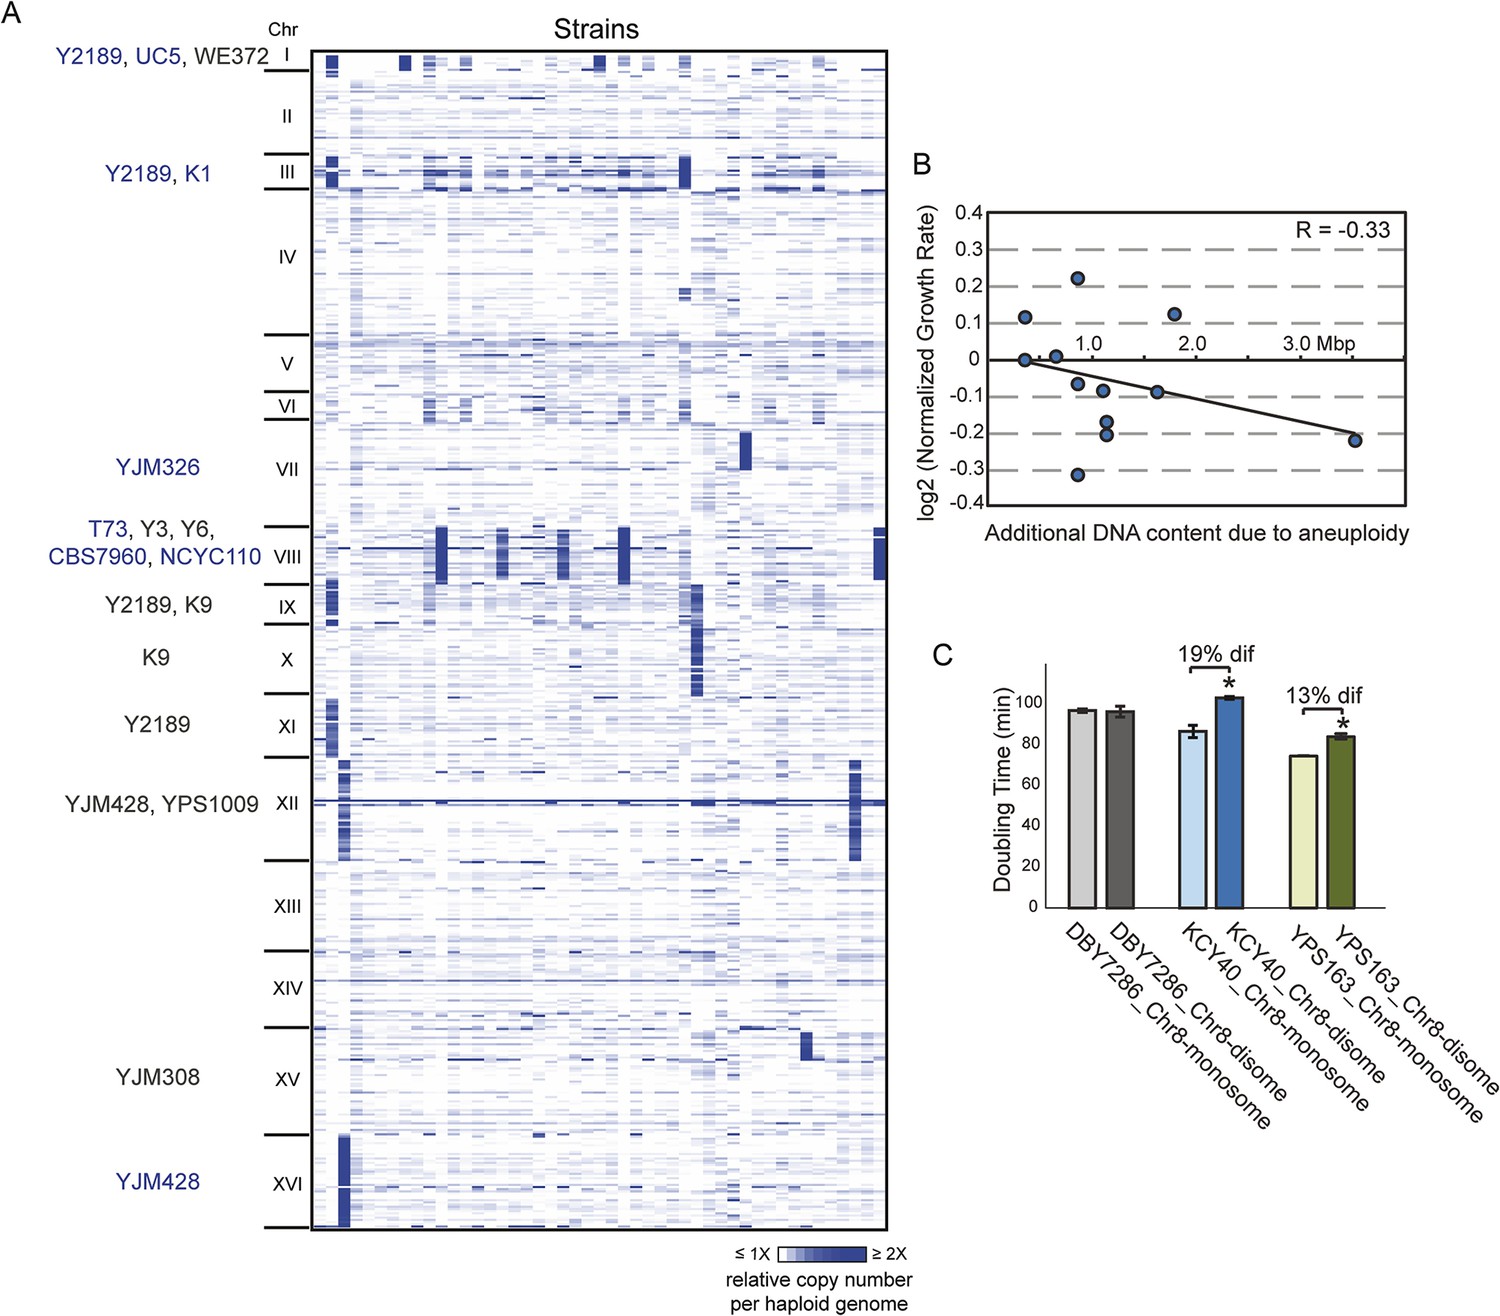
Aneuploidy is common in non-laboratory strains.
(A) Relative DNA copy (log2 (RPKM)) per gene (rows) across each of the 16 chromosomes for 47 sequenced strains (columns). Strains with 1.5× (gray text) or 2× (blue text) chromosomal copy per haploid genome are annotated by name. (B) Growth rates of aneuploid strains normalized to the niche-specific growth rate (see ‘Materials and methods’) plotted against the additional DNA content in each strain. (C) Haploid strains with a duplication of Chr 8 (labeled as ‘disome’) were selected from euploid parents (labeled as ‘monosome’) including the S288c-derived DBY7286, derived vineyard strain KCY40, and a haploid derivative of oak strain YPS163, see ‘Materials and methods’. Doubling times in YPD medium represent the average of four biological replicates; the average difference (‘dif’) in growth rate is indicated. An asterisk represents statistically significant differences in doubling time (p < 6e-4, T-test).
Figure 2
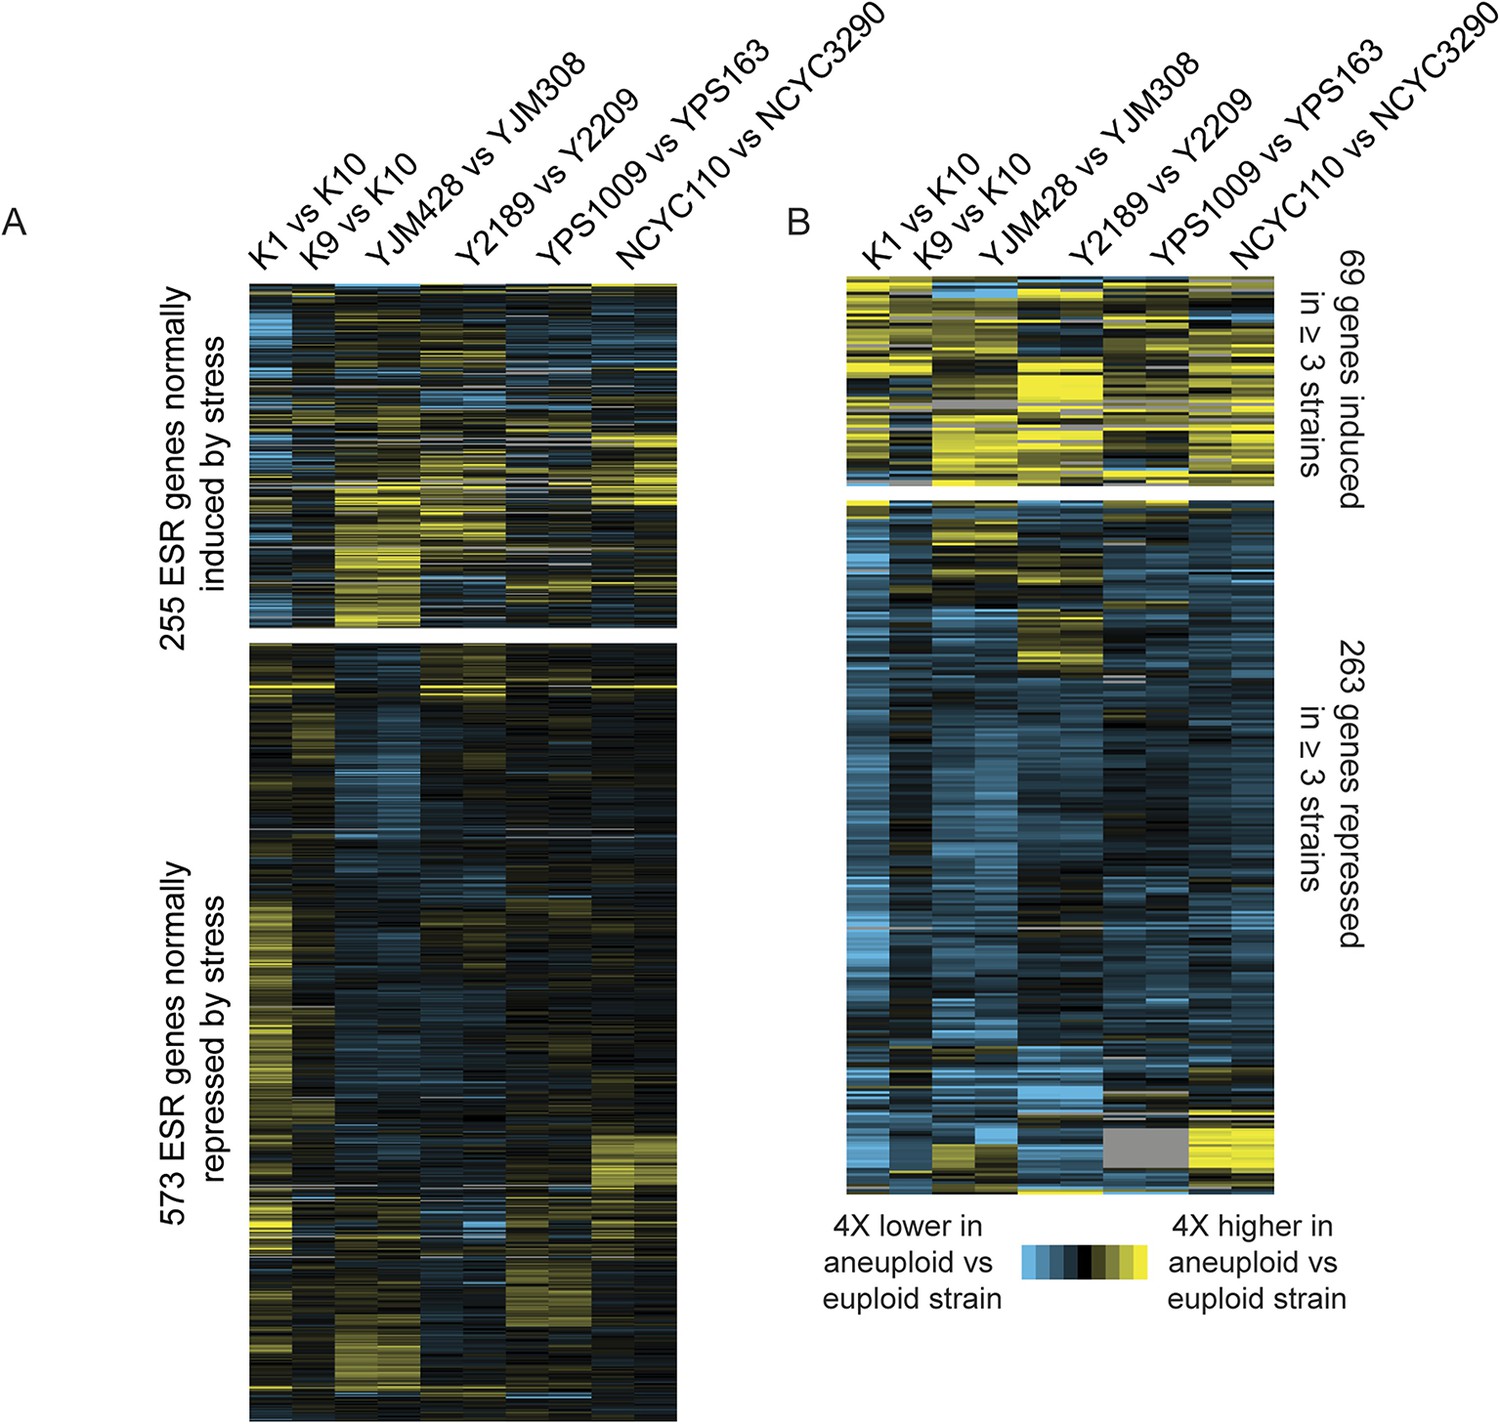
Naturally aneuploid strains show a weak common response to aneuploidy but no activation of the ESR.
A) Expression of genes in the yeast environmental stress response (ESR) in aneuploid vs genetically related euploid strains. Biological replicates are shown for YJM428, Y2189, YPS1009, and NCYC110. The magnitude of the expression difference (log2 fold change) is as indicated in the key. B) Expression of 69 genes with higher expression (top) and 263 genes with lower expression (bottom) in aneuploid strains vs their paired euploid control.
Figure 3
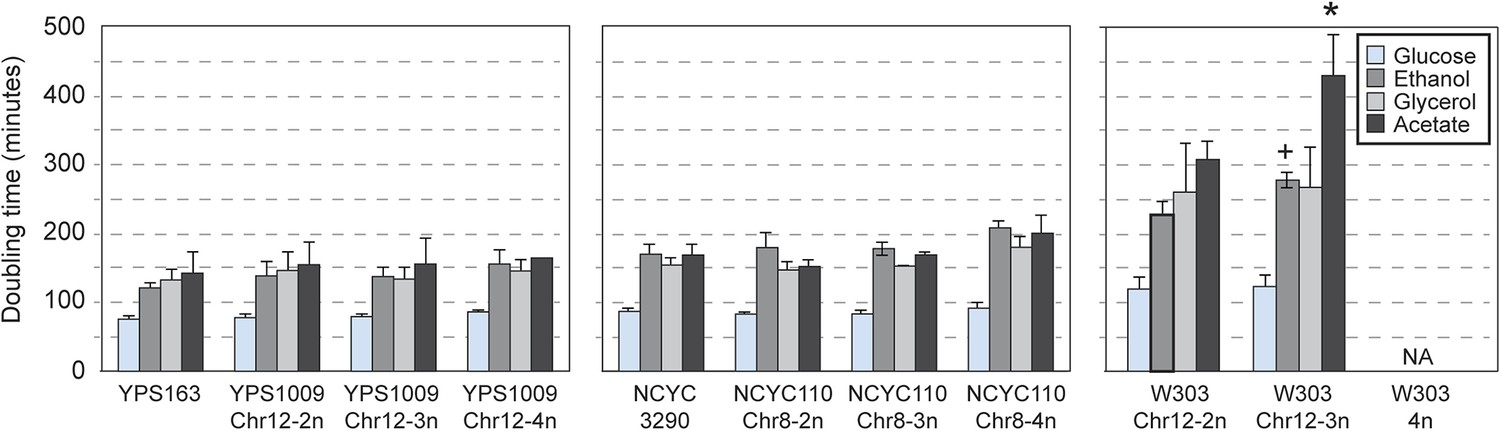
Naturally aneuploid strains have no respiratory defect.
The average and standard deviation of doubling times measured for strains growing in yeast extract-peptone medium supplemented with 2% glucose (fermentable), 2% ethanol, 3% glycerol, or 2% acetate (non-fermentable) is shown for indicated strains. Isogenic, diploid panels of YPS1009, NCYC110, and W303 carried variable copy of Chr 12 or Chr 8 (see text). The relative growth rate on non-fermentable carbon sources (normalized to each strain's growth rate on glucose) was not significantly different for most aneuploid strains, with the exception of the W303_Chr12-3n strain that showed a greater growth defect when grown on ethanol or acetate compared to glucose (+ = p < 0.07, * = p < 0.05, paired T-test). The W303_Chr12-4n did not grow on non-fermentable carbon sources.
Figure 4
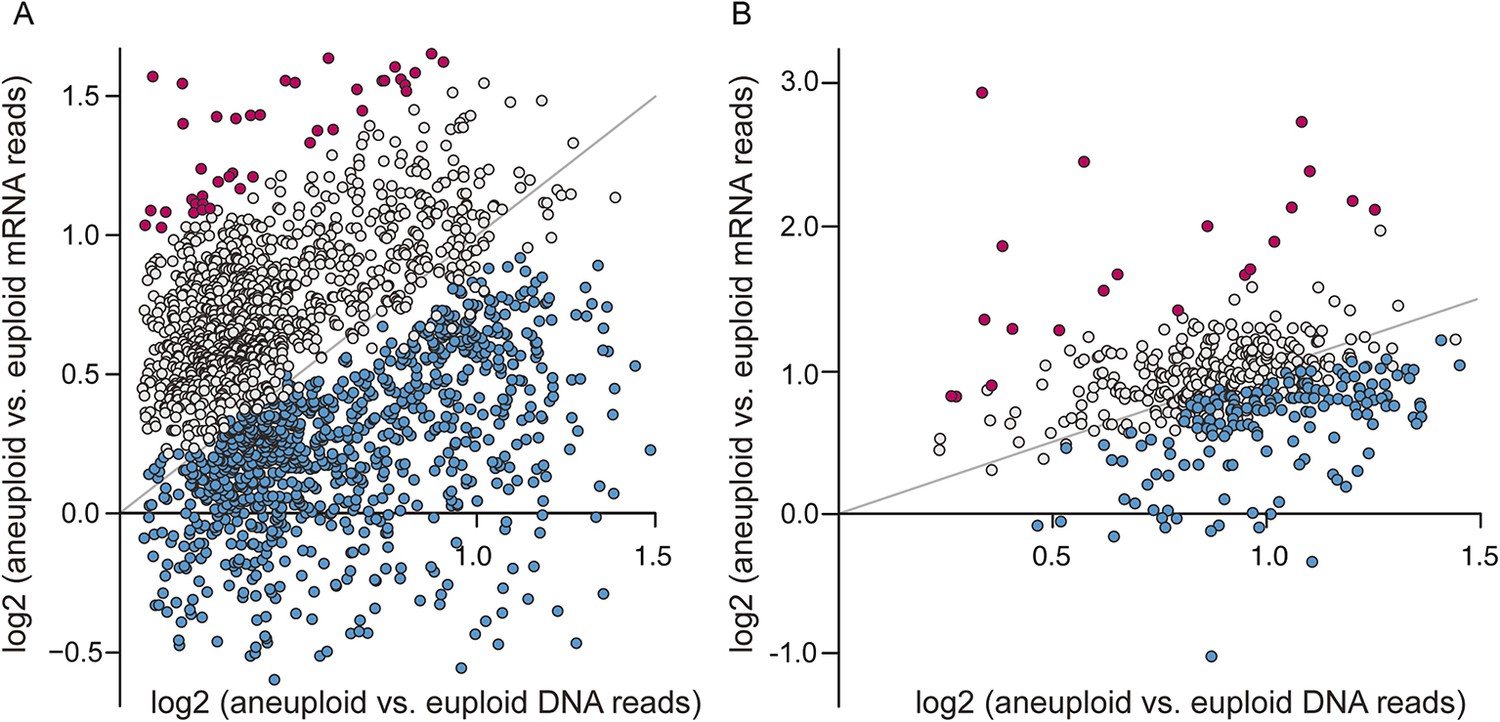
A large fraction of amplified genes are expressed lower than expected in aneuploid isolates.
The average log2(aneuploid vs euploid RNA-seq reads) per amplified gene was plotted against average log2(aneuploid vs euploid DNA seq reads) measured for that gene, in each of the interrogated aneuploid strains. (A) The combined set of amplified genes measured in each wild isolate normalized to a genetically related euploid reference strain, and (B) Amplified genes measured in two tetrasomic diploid strains and one disomic haploid strain normalized to isogenic euploids. Genes with lower-than-expected expression are plotted in blue and genes with higher-than-expected expression are plotted in magenta (see ‘Materials and methods’). The expected relationship representing proportionate increases in expression (slope of 1.0, intercept of 0) is shown in each panel.
Figure 5
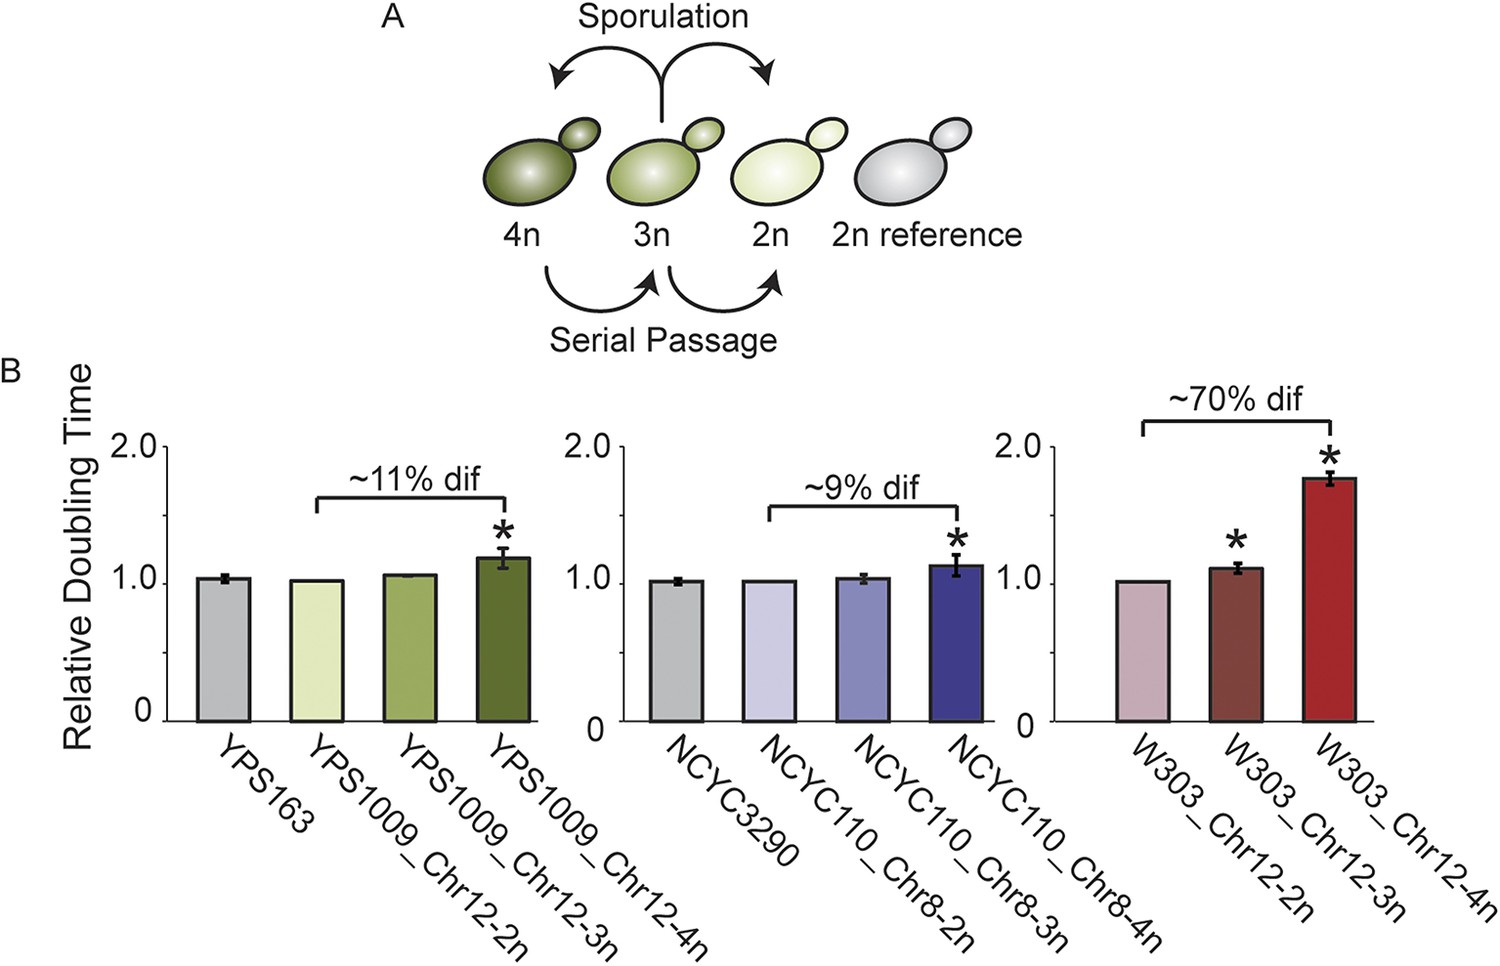
Aneuploid strain panels.
(A) Strain panels were generated by sporulating YPS1009 (naturally trisomic for Chr 12) or serial passaging of NCYC110 (naturally tetrasomic for Chr 8). (B) Average and standard deviation of doubling times for strains in each panel and euploid reference strains YPS163 or NCYC3290, normalized to the respective 2n strain in each panel. Asterisks represent significant differences (p < 0.01).
Figure 6

Classification of dosage-responsive genes.
The log2(aneuploid vs euploid RNA-seq reads) for each gene was plotted against the log2(aneuploid vs euploid DNA-seq reads) measured for that gene in the -2n, -3n, and -4n strains within the strain panel normalized to the closely related euploid reference. (A–E) Average and standard deviation of representative genes in the denoted classes, across three biological replicates. (F) All 173 Class 3a genes, normalized to the euploid strain from within the respective panel for clarity. The expected relationship representing proportionate increases in expression (slope of 1.0, intercept of 0) is shown in each panel.
Figure 7
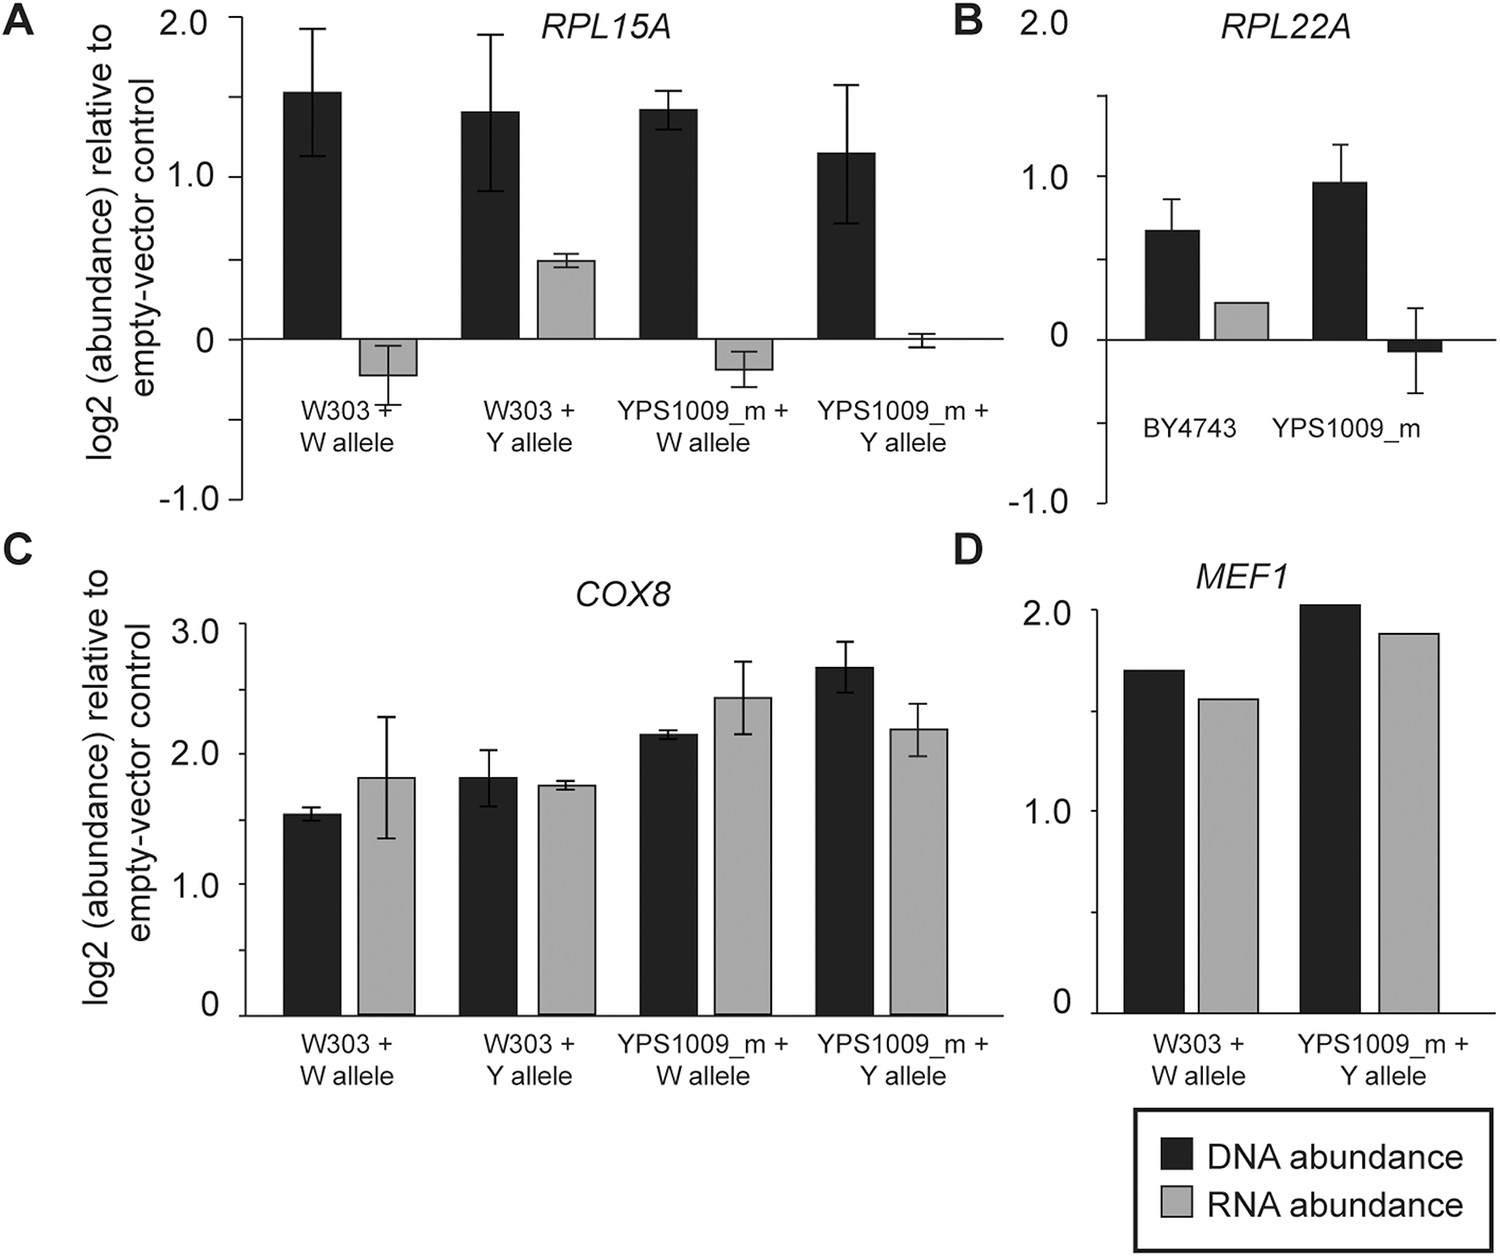
Expression response when genes are duplicated on a plasmid.
To measure the effects of gene duplication in the absence of aneuploidy, representative Class 3a genes were cloned onto a CEN plasmid and introduced into otherwise euploid strains. As a control, strains were also compared to an empty vector for normalization. mRNA and DNA abundance for the gene were quantified by qPCR as described in ‘Materials and methods’. Relative DNA (black) and RNA (gray) abundance for (A) RPL15A, (B) RPL22A, (C) COX8, or (D) MEF1 when introduced in extra copy into each strain. Panels A, C, D show abundance in haploid W303 or the haploid, monosomic (euploid) derivative of YPS1009 (‘YPS1009_m’), and panel B shows abundance in diploid laboratory strain BY4743 and diploid, euploid derivative YPS1009_Chr12-2n. In all cases, the average and standard deviation of biological triplicates is shown.
Figure 8

Relative mRNA abundance of amplified genes in the mini-4n strain and strain panels.
(A) Cartoon diagram of the four copies of Chr 12 in the tetraploid YPS1009_Chr12-4n strain and in the ‘mini_4n’ strain where two copies of the Chr 12-right arm are deleted (see ‘Materials and methods’ for details). (B) Expression was measured on tiled yeast-genome DNA microarrays. Shown are Class 3a genes that remain amplified in the mini-4n strain and could be quantified by arrays. Relative mRNA abundance was measured in biological triplicate in the YPS1009_Chr12-4n or YPS1009_mini-Chr12-4n strain vs the euploid YPS1009_Chr12-2n strain. Genes COX17, SPA2, and SDH2 showed an increase in expression in the mini_4n strain, however expression remained significantly lower than the expected two-fold difference proportionate to the gene amplification. FRE6 showed little dosage compensation when measured by DNA microarray analysis and correspondingly its expression did not change in the mini_4n strain. (C) Relative mRNA abundance of eleven genes that are dosage compensated across the YPS1009_Chr12 strain panel (left) but not the W303_Chr12 strain panel (right).
Figure 9

Natural variation in expression constraint and gene copy-number variation.
(A) log2(Vg/Vm) as described in the text, (B) fraction of genes with copy-number variation (CNV) in at least one of 103 strains, and (C) log2 of the buffering capacity score, Bv, are shown for the gene groups in the key (where number of genes is indicated in parentheses). Amplified genes with proportionately higher expression include Class 1 genes and genes with proportionate expression in strain pairs (Figure 4A, gray points). Amplified genes with heritably reduced expression correspond to genes in Class 2a, minus genes identified as dosage compensated in other strains, while amplified genes subject to dosage compensation represent genes in Class 3a plus genes with lower-than-expected expression as identified in Figure 4B. Statistical significance was scored by comparing each group to the total set of yeast genes.
Figure 10
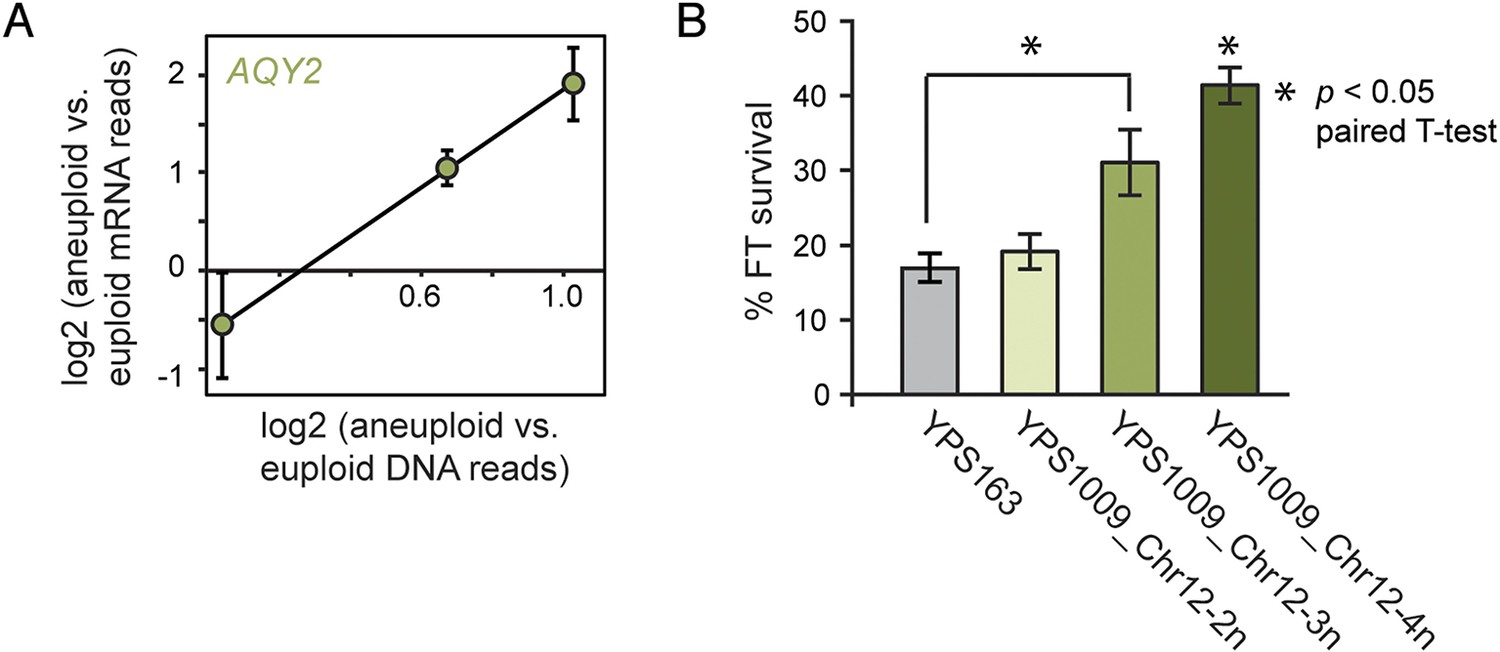
Amplified expression of AQY2 provides a fitness advantage.
(A) AQY2 expression as described in Figure 6. (B) Average and standard deviation of percent cell viability after freeze-thaw stress.
Appendix 1—Figure 1
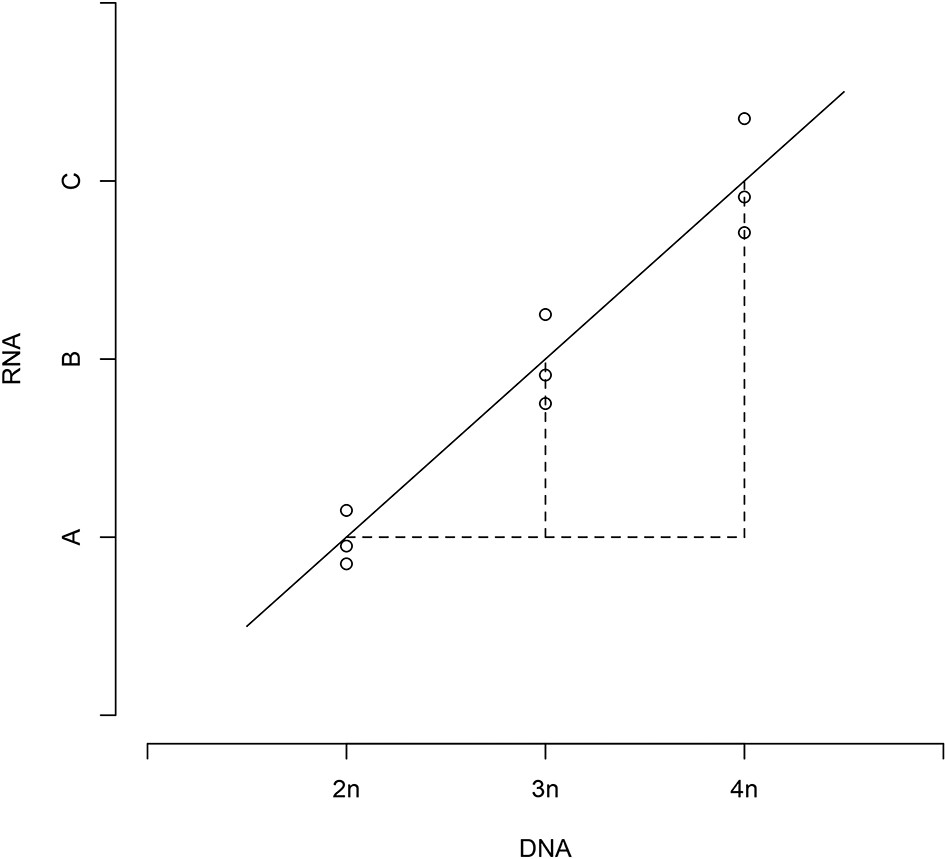
Relative DNA and RNA values follow a linear regression.
https://doi.org/10.7554/eLife.05462.017Tables
Table 1
MLR Gene classifications
| Gene class | NCYC110 (Chr 8) | YPS1009 (Chr 12) |
|---|---|---|
| Non-linear | 19 (7%) | 32 (7%) |
| Class 1 | 16 (6%) | 81 (16%) |
| Class 2a | 138 (49%) | 137 (28%) |
| Class 2b | 32 (11%) | 4 (1%) |
| Class 3a | 30 (11%) | 142 (29%) |
| Class 3b | 46 (16%) | 96 (20%) |
| TOTAL | 281 | 492 |
-
The number and percentage of genes classified in each group. Functional enrichments are listed in Supplementary file 2.
Additional files
-
Supplementary file 1
Strains used in this study.
- https://doi.org/10.7554/eLife.05462.014
-
Supplementary file 2
Functional enrichments and p-values for gene classes.
All enrichments with p < 2e-3 are shown; enrichments that meet the Bonferroni cutoff (2e-5) are highlighted in red. Enrichments are listed for (a) amplified genes with expression proportionate to gene copy (from Figure 4A), (b) pooled set of amplified genes with expression proportionate to gene copy (from Figure 9), (c) dosage compensated genes (from Figure 9). (d) Genes in Class 2a, (e) genes with higher-than-expected expression (from Figure 4A,B plus Class 3b genes).
- https://doi.org/10.7554/eLife.05462.015
-
Supplementary file 3
Genes in each class are listed on file tabs.
The first two columns list gene name and annotation, while the third column lists the strain and/or analysis that the gene was identified in. (a) Amplified genes with expression proportionate to gene copy. (b) Amplified genes with lower-than-expected expression. (c) Amplified genes with higher-than-expected expression. (d) Genes in each MLR classification group—intercept (‘alpha-hat’), slope (‘beta-hat’), and posterior probabilities for each class are shown. The mean DNA and mRNA sequencing reads for each gene are also shown. (e) Unamplified genes in the strain panels with linear increases in expression across the panel (FDR = 0.05). Pooled set of amplified genes with expression proportionate to gene copy (from Figure 9). (c) Dosage compensated genes (from Figure 9).
- https://doi.org/10.7554/eLife.05462.016
Download links
A two-part list of links to download the article, or parts of the article, in various formats.
Downloads (link to download the article as PDF)
Open citations (links to open the citations from this article in various online reference manager services)
Cite this article (links to download the citations from this article in formats compatible with various reference manager tools)
Dosage compensation can buffer copy-number variation in wild yeast
eLife 4:e05462.
https://doi.org/10.7554/eLife.05462


