The genetic architecture of NAFLD among inbred strains of mice
- University of California, Los Angeles, United States
- University of Oslo, Norway
- Harvard Medical School, United States
- Bristol-Myers Squibb, United States
Figures
Figure 1

Effects of genetic background on hepatic TG accumulation.
(A) Hepatic TG levels in male mice after 8 weeks of HF/HS feeding. Results are presented as mean + SD. (B–D) Correlation of hepatic TG with liver weight (B), hepatic total cholesterol (TC) (C), and hepatic phospholipid (D). r, biweight midcorrelation; p, p-value.
Figure 2
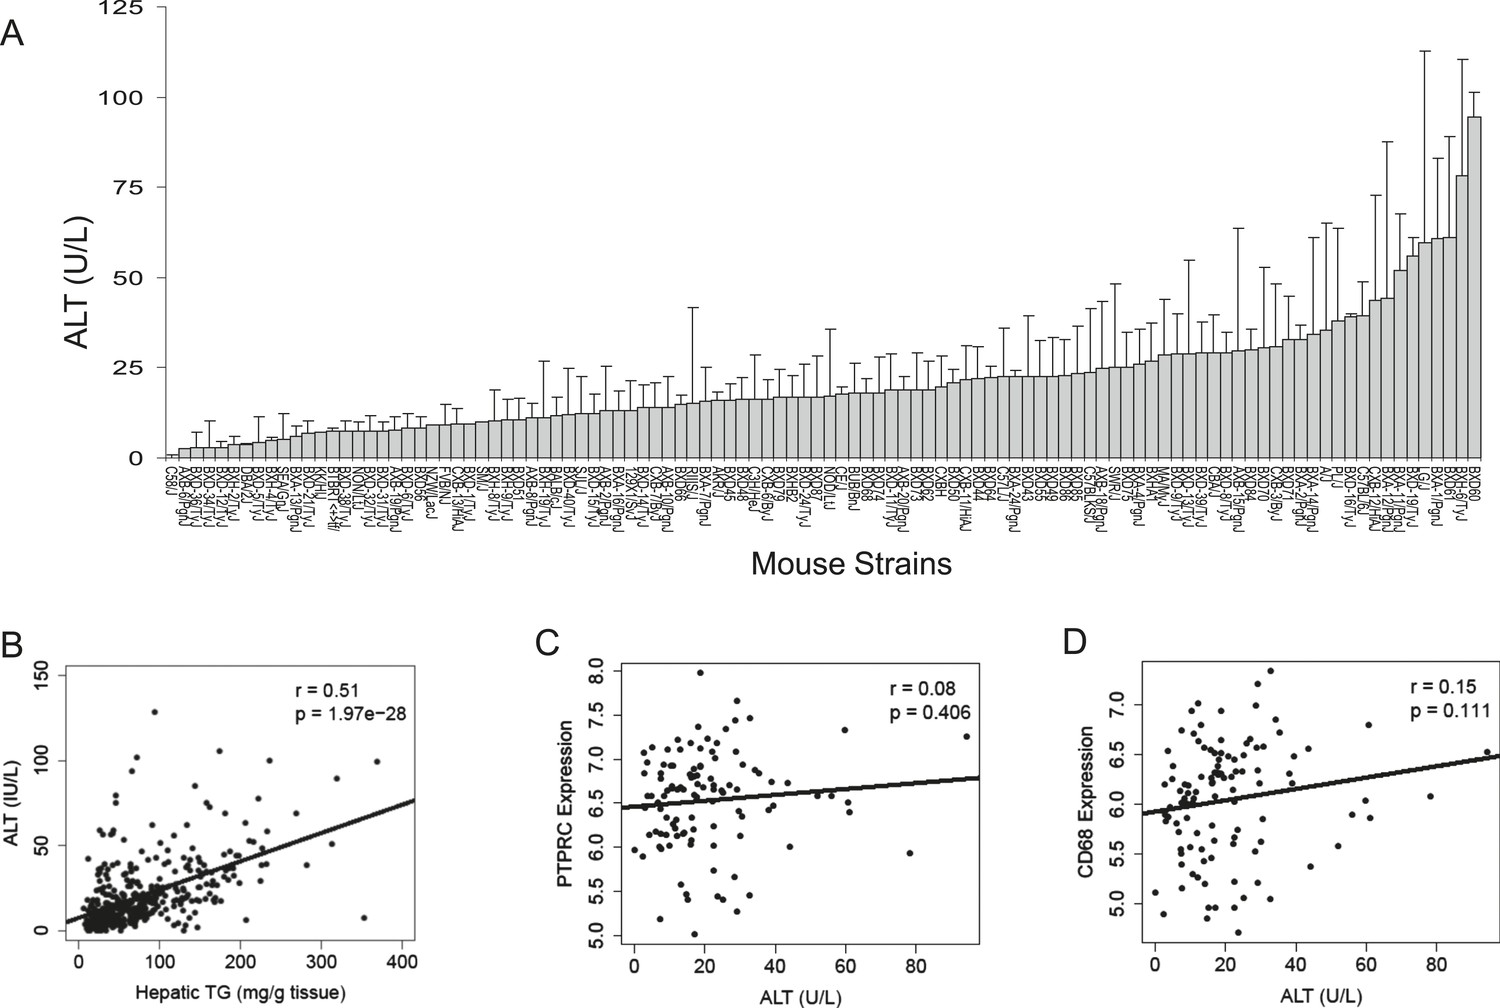
Plasma ALT activities and immune cell marker expression among inbred and recombinant inbred strains of mice.
(A) Plasma alanine aminotransferase (ALT) activities in male mice after 8 weeks of HF/HS feeding. Results are presented as mean + SD. (B–D) Correlation of plasma ALT activities with hepatic triglyceride (B), hepatic Ptprc (Cd45r) expression (C) and hepatic. Cd68 expression. r, biweight midcorrelation; p, p-value.
Figure 3
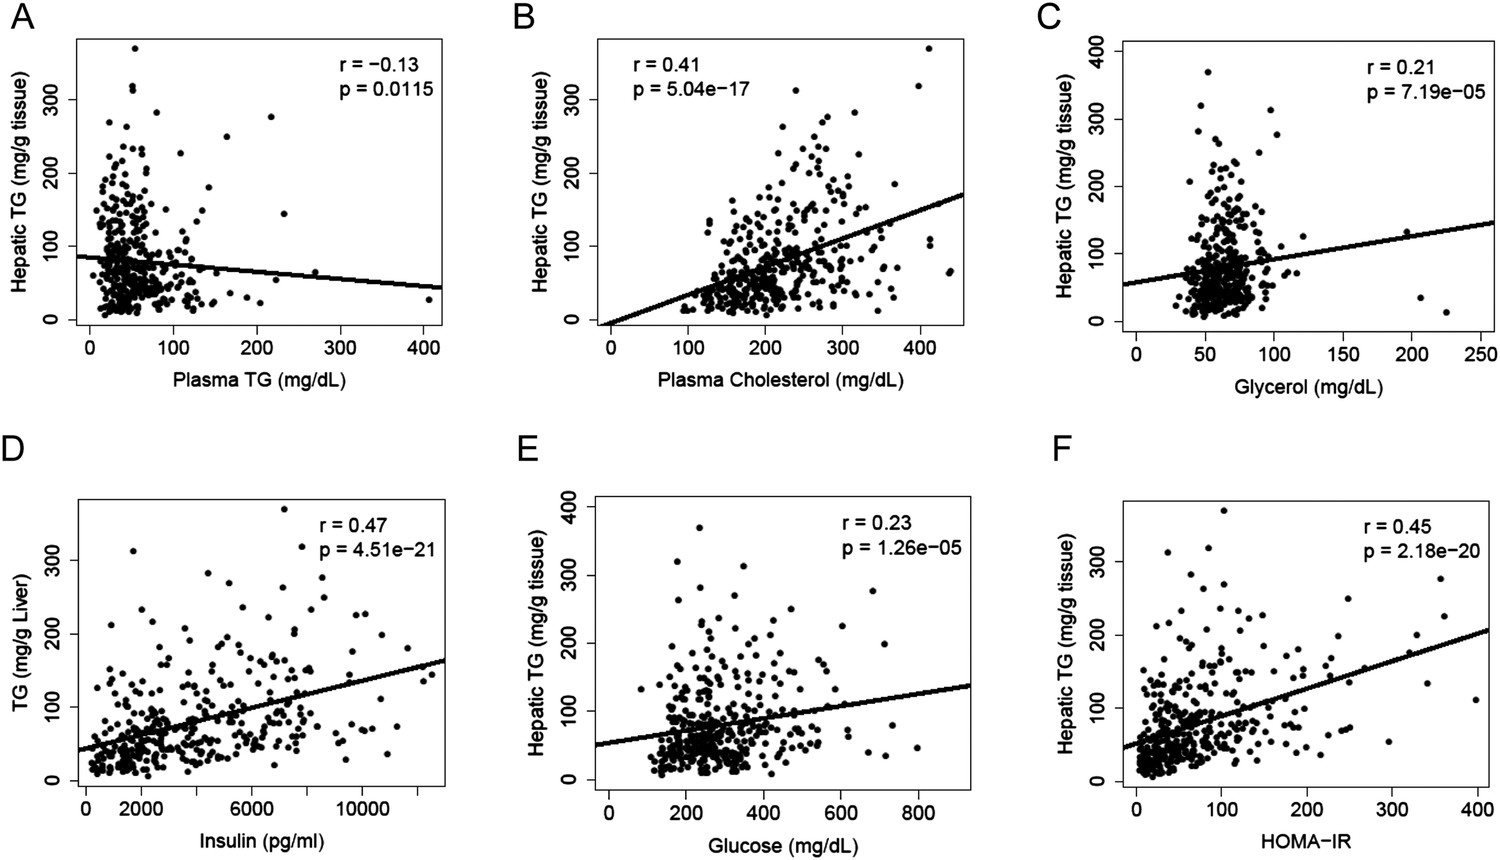
Correlation of hepatic TG content with plasma metabolites and HOMA-IR.
(A–F) Correlation of hepatic TG with plasma TG (A), plasma cholesterol (B), plasma glycerol (C), plasma insulin (D), plasma glucose (E), and HOMA-IR (F). r, biweight midcorrelation; p, p-value.
Figure 4
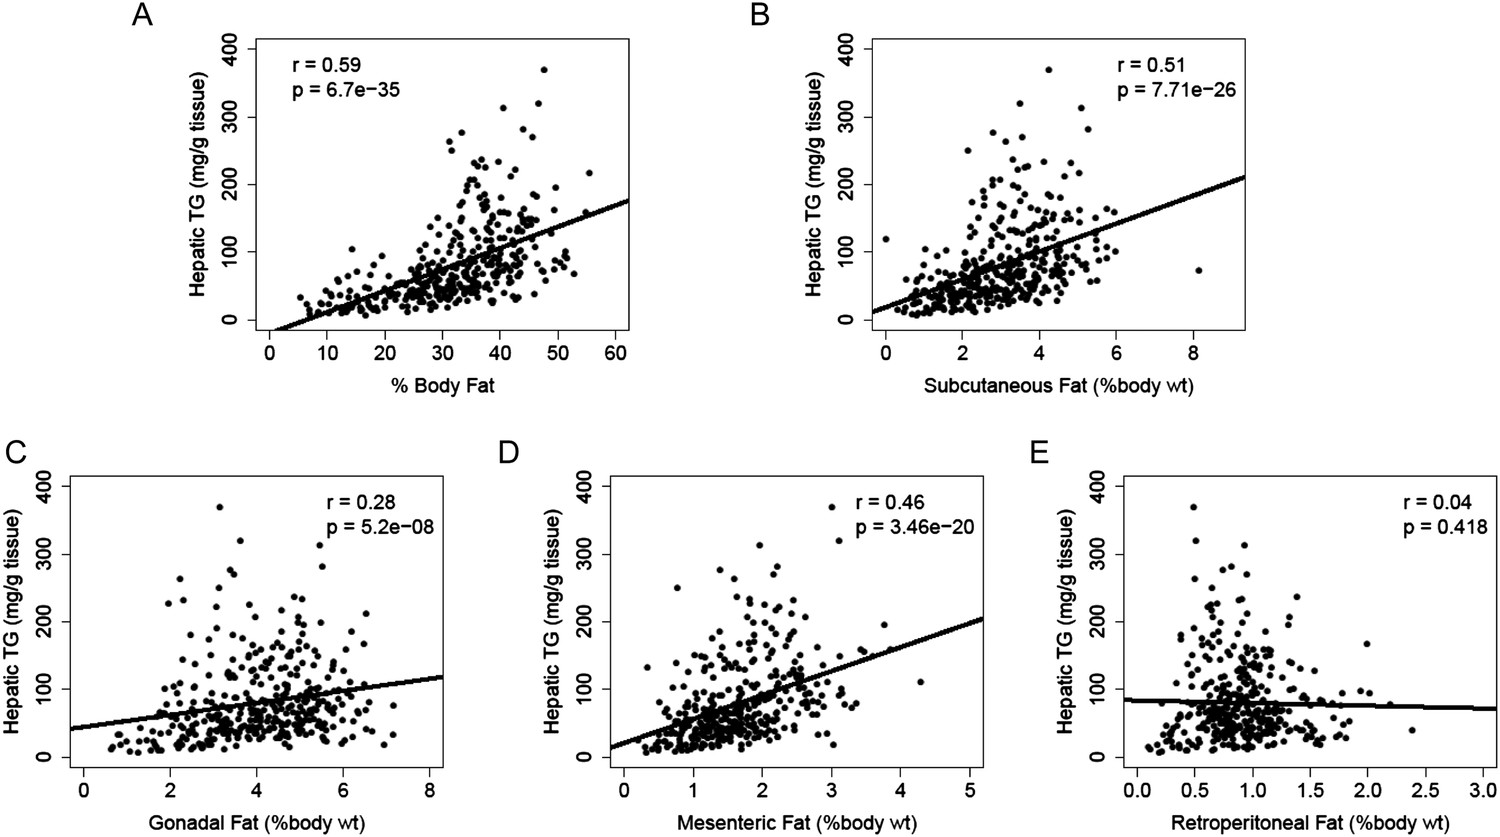
Correlation of hepatic TG content with adiposity and fat mass.
(A–E) Correlation of hepatic TG with adiposity (A), subcutaneous fat (B), gonadal fat (C), mesenteric fat (D), and retroperitoneal fat (E). r, biweight midcorrelation; p, p-value.
Figure 5
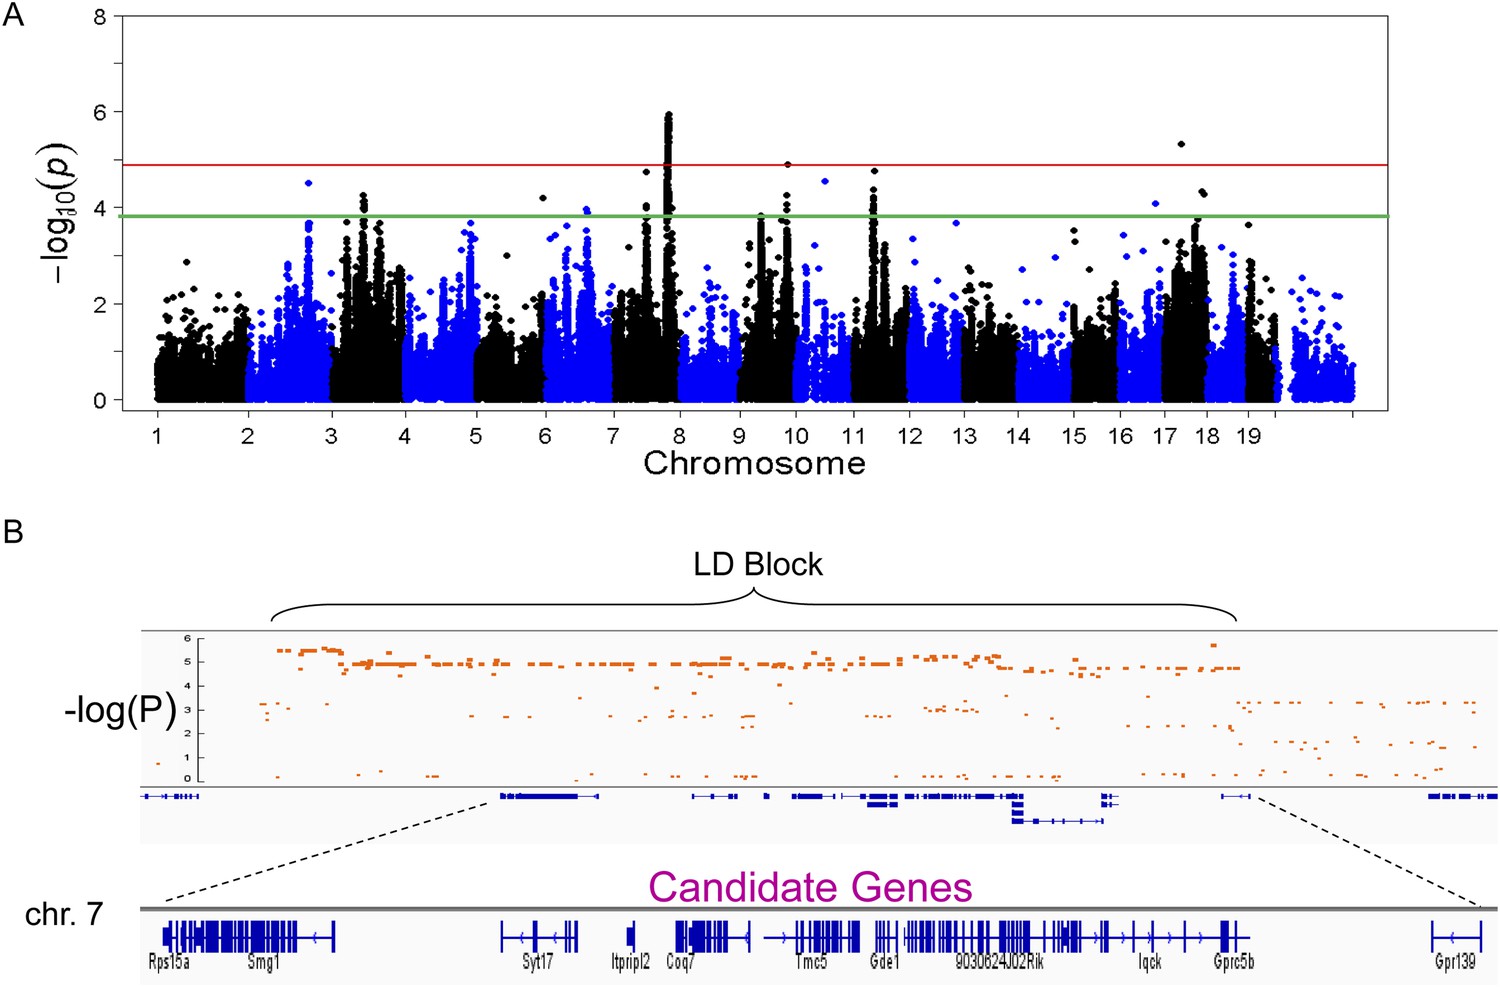
Association mapping of hepatic TG.
(A) Manhattan plot showing the significance (−log of p) of all SNPs and hepatic TG. Genome-wide significance cut-off at 1% false discovery rate (FDR) is shown by the red line and cut-off at 5% FDR is shown in green. (B) Locus plot for genome-wide significant locus on chromosome 7 with approximate linkage disequilibrium block and candidate genes.
Figure 6
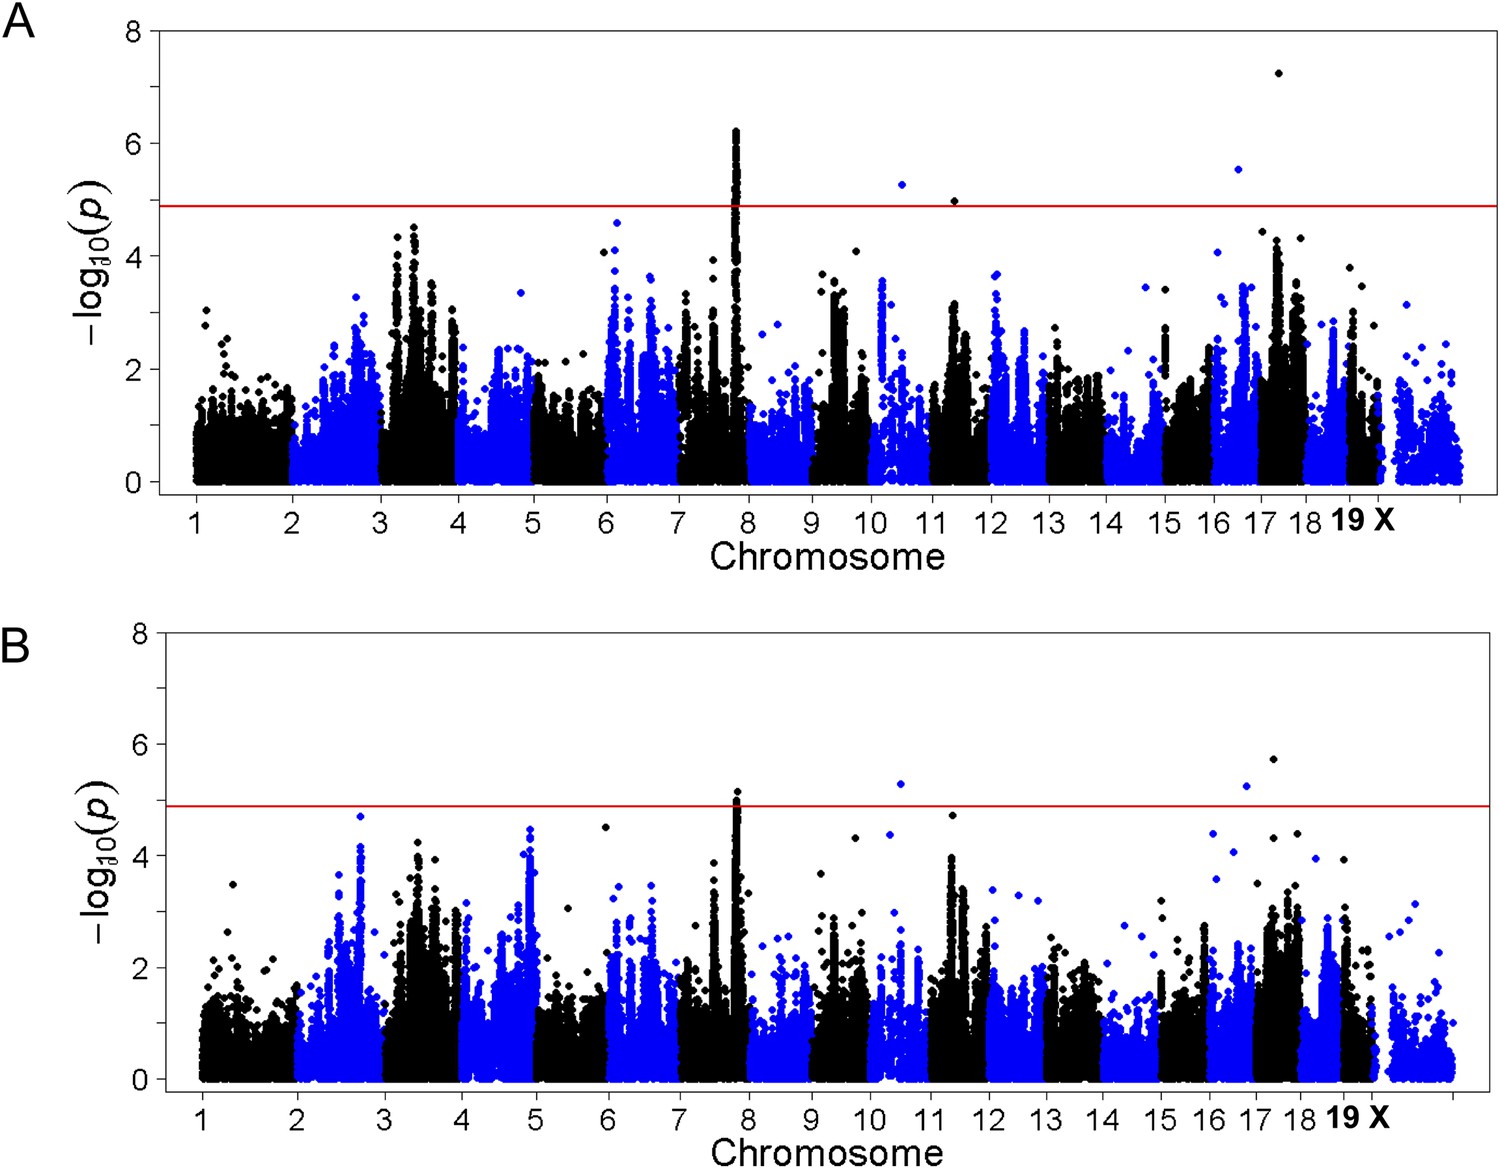
Association mapping of hepatic TG with adiposity or insulin resistance as covariates.
Manhattan plot showing the significance −log10 (p value) of all SNPs and hepatic TG conditioned for percentage body fat (A) or HOMA-IR (B) as covariates. Genome-wide significance cut-off at 1% FDR is shown by the red line.
Figure 7
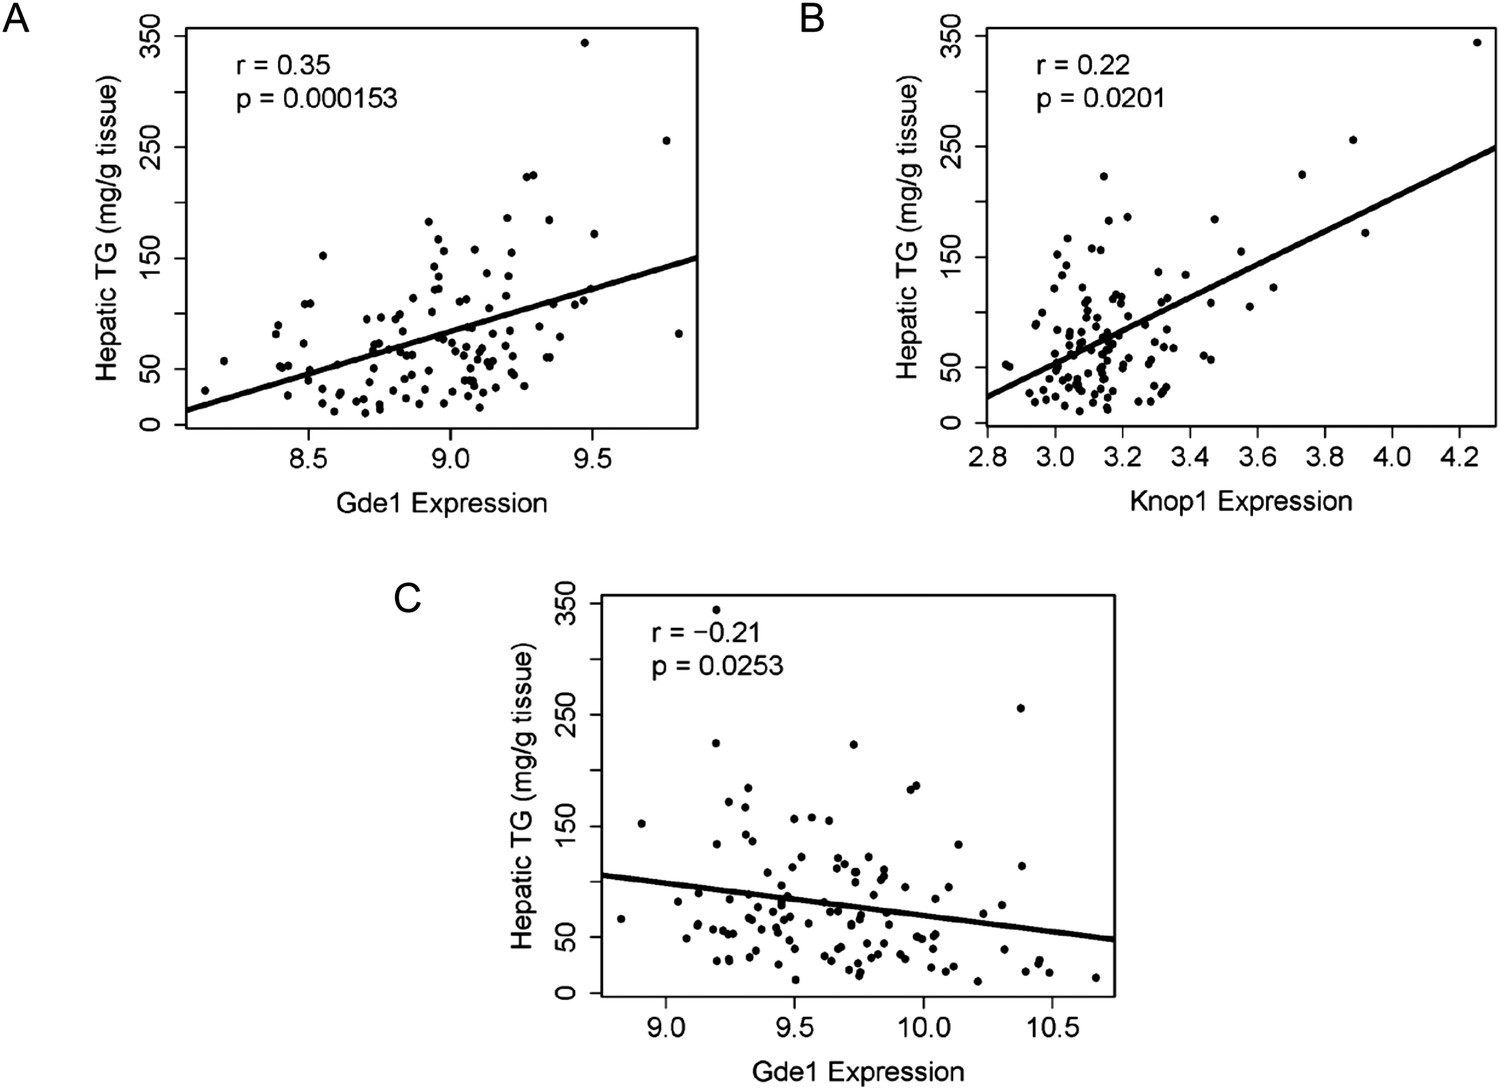
Correlation of candidate gene expression with hepatic TG content.
(A–B) Correlation of hepatic TG with expression levels of Gde1 (A) and Knop1 (B) in the liver. (C) Correlation of hepatic TG with expression levels of Gde1 in the white adipose tissue. r, biweight midcorrelation; p, p-value.
Figure 8

Effects of Gde1 overexpression in mice by adenoviral transduction.
C57BL/6 mice were injected with Ad-Gde1 (1 × 10⁹ pfu per mouse, i.v.) and fed with a HF/HS diet for 7 days. Control group received the same dose of Ad-LacZ. (A) Western-blot of liver homogenate using anti-GDE1 or anti-tubulin antibody. (B) Comparison of liver weight between Gde1-overexpressing mice and the control mice. (C) Differences in plasma triglyceride (TG), TC, and free fatty acids levels between Gde1-overexpressing mice (filled bars) and the control mice (empty bars). (D) Hepatic fat percentage in the two groups of mice was determined by MRI. (E–G) Liver lipids were extracted and quantified: triglyceride (TG), TC, and phospholipids (PL). (H) Expression of lipogenic genes was measured by qPCR and normalized to the level of the housekeeping gene 36B4. Ad-LacZ (empty bars) and Ad-Gde1 (filled bars) Results are presented as mean + SD (n = 7–8) * denotes p < 0.05 and ** denotes p < 0.01.
Figure 9
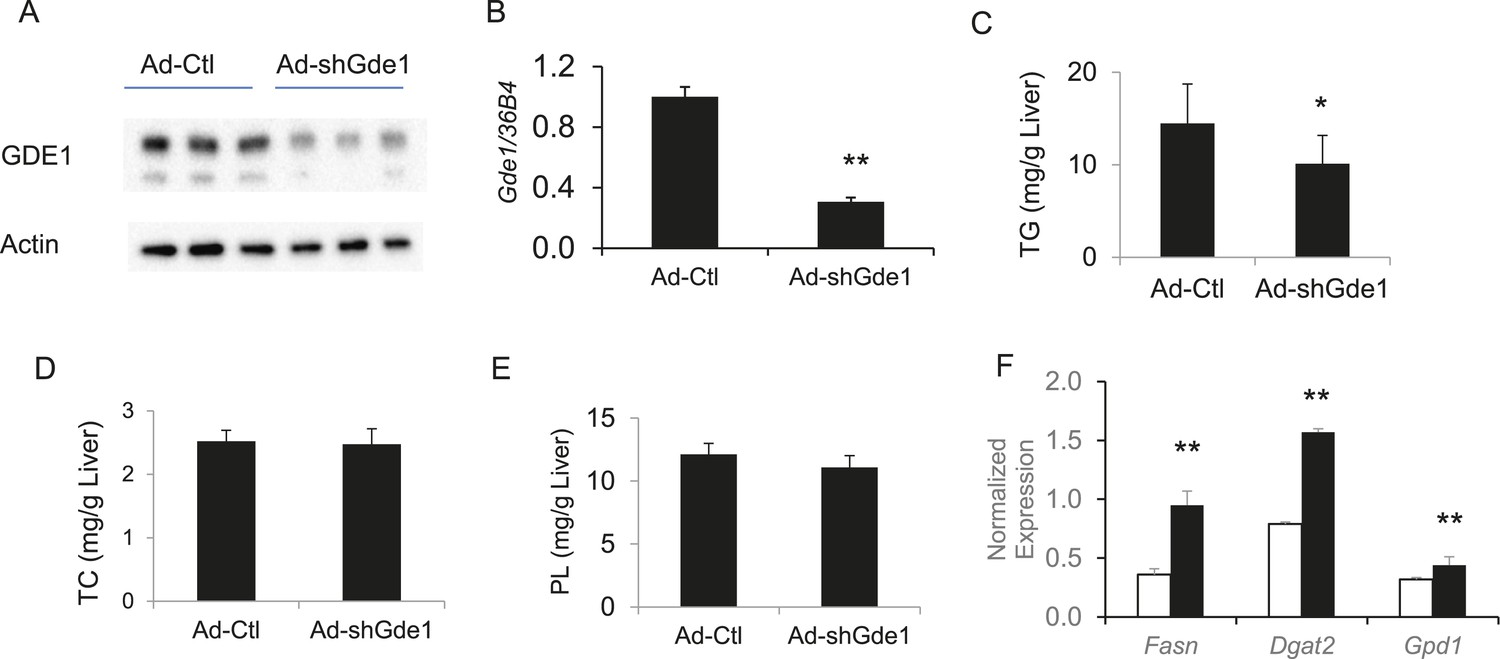
Effects of Gde1 knockdown in mice by adenoviral transduction.
C57BL/6 mice were injected with Ad-shGde1 (1 × 10⁹ pfu per mouse, i.v.) and fed with a HF/HS diet for 7 days. Control group received the same dose of Ad-Ctl. (A) Equal amounts of liver protein were loaded in each lane and Western-blotted using anti-GDE1 or anti-actin antibody. (B) Comparison of Gde1 mRNA levels between Gde1-knockdown mice and the control mice. (C–E) Liver lipids were extracted and quantified: triglyceride (TG), TC, and phospholipids (PL). (F) Expression of lipogenic genes was measured by qPCR and normalized to the level of the housekeeping gene 36B4. Results are presented as mean + SD (n = 11–12) * denotes p < 0.05 and ** denotes p < 0.01.
Figure 10
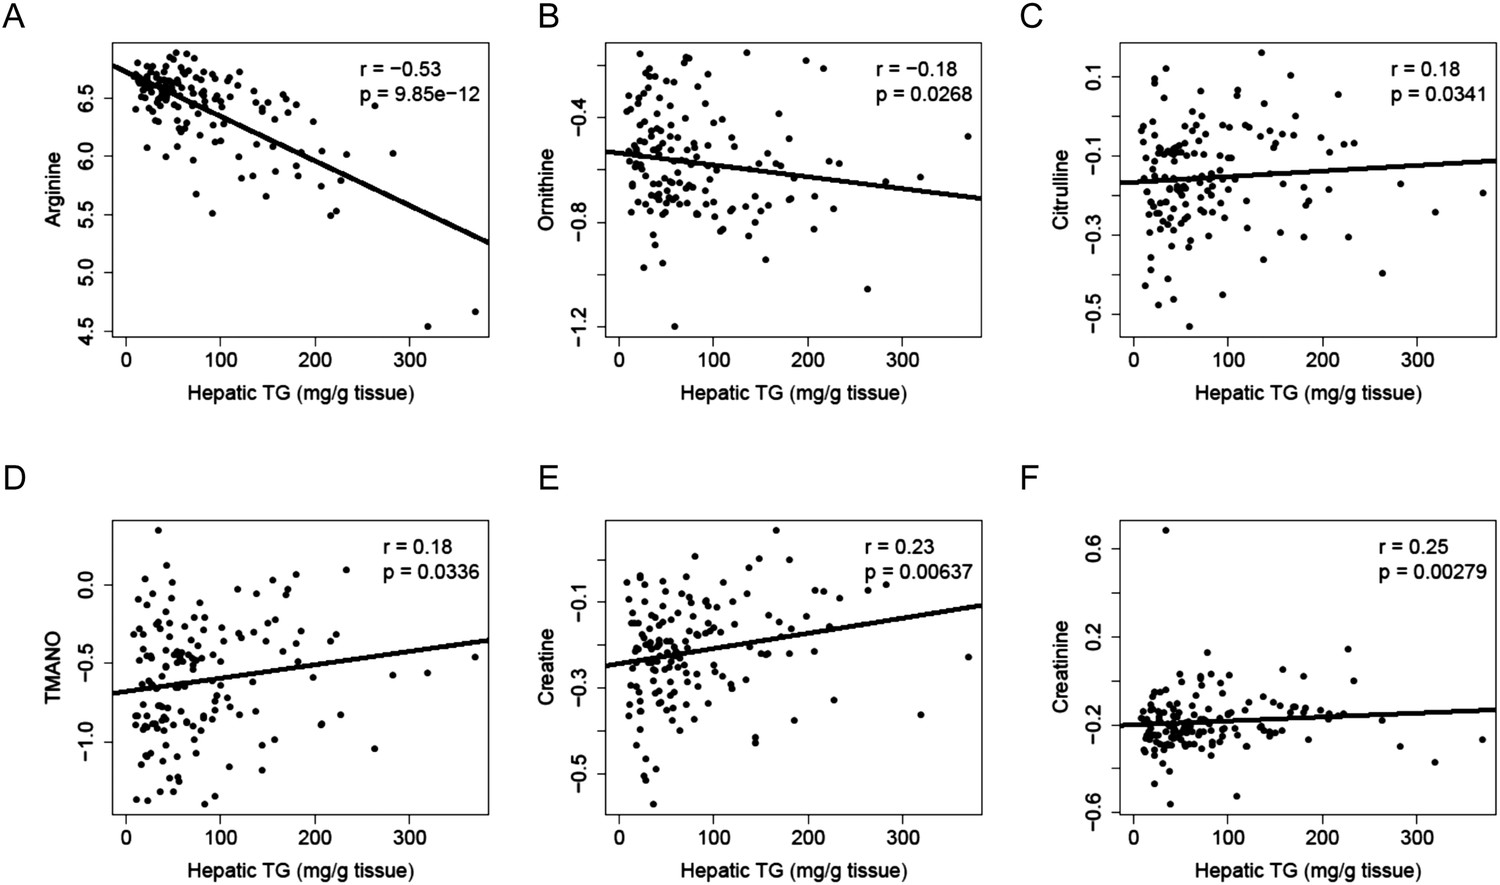
Correlation of hepatic TG and polar metabolites in the plasma.
Correlation of hepatic TG with plasma levels of arginine (A), ornithine (B), citrulline (C), TMANO (D), creatine (E), and creatinine (F). r, biweight midcorrelation; p, p-value.
Author response image 1
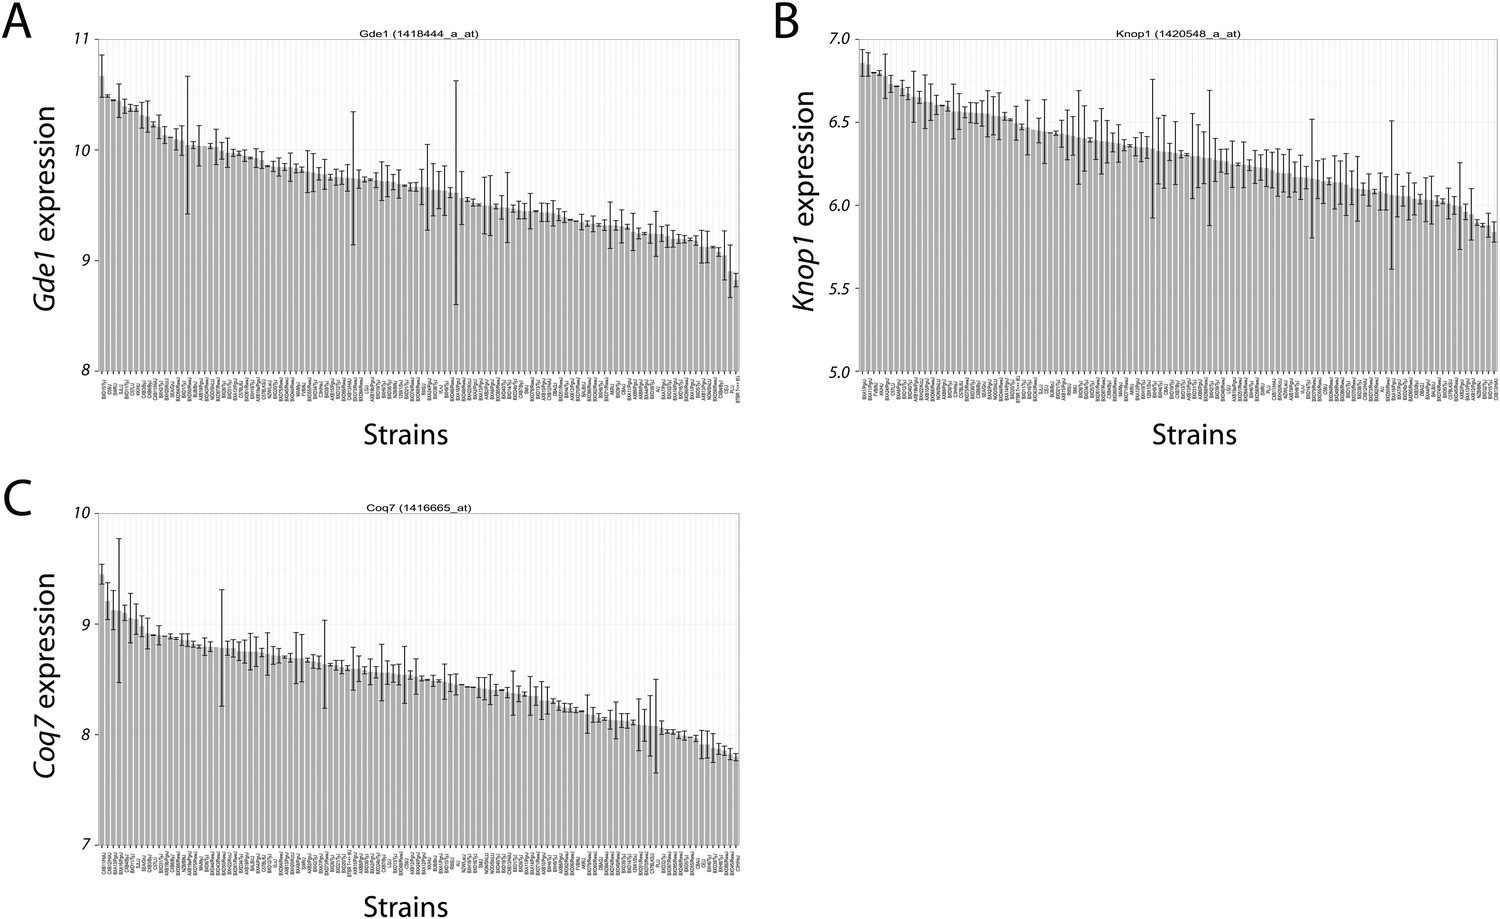
Variation in candidate gene expression among strains.
The expression level of Gde1 (A), Knop1 (B) and Coq7 (C) among HMDP strains are shown. Results are presented as mean ± SD in log2 scale.
Tables
Table 1
Top 50 liver genes correlated with hepatic TG levels
| Rank | Gene symbol | r | P |
|---|---|---|---|
| 1 | Cd36 | 0.695 | 1.85E-17 |
| 2 | Mrpl16 | 0.622 | 2.57E-13 |
| 3 | Enc1 | 0.611 | 8.12E-13 |
| 4 | 2010003K11Rik | 0.600 | 2.84E-12 |
| 5 | Tceal8 | 0.599 | 3.00E-12 |
| 6 | Cmpk1 | 0.598 | 3.32E-12 |
| 7 | Avpr1a | −0.595 | 4.45E-12 |
| 8 | Hmgcl | 0.590 | 7.60E-12 |
| 9 | Akap2 | 0.581 | 1.86E-11 |
| 10 | C1ra | −0.572 | 4.34E-11 |
| 11 | Reep3 | 0.562 | 1.16E-10 |
| 12 | Skp1a | 0.554 | 2.33E-10 |
| 13 | Esd | 0.551 | 3.11E-10 |
| 14 | Hadh | 0.550 | 3.48E-10 |
| 15 | Syap1 | 0.549 | 3.66E-10 |
| 16 | Ermp1 | 0.545 | 5.44E-10 |
| 17 | Ang | −0.544 | 5.53E-10 |
| 18 | Dak | 0.543 | 6.24E-10 |
| 19 | Matr3 | −0.541 | 7.12E-10 |
| 20 | Nudt9 | 0.538 | 9.35E-10 |
| 21 | Srsf5 | −0.538 | 9.89E-10 |
| 22 | Vps29 | 0.537 | 1.04E-09 |
| 23 | Ttc23 | 0.537 | 1.05E-09 |
| 24 | Entpd5 | 0.536 | 1.14E-09 |
| 25 | Chchd6 | 0.535 | 1.27E-09 |
| 26 | Plekha1 | 0.534 | 1.32E-09 |
| 27 | Mogat1 | 0.531 | 1.76E-09 |
| 28 | S100a10 | 0.528 | 2.11E-09 |
| 29 | Plin4 | 0.527 | 2.36E-09 |
| 30 | Anxa2 | 0.525 | 2.73E-09 |
| 31 | Srxn1 | 0.524 | 2.96E-09 |
| 32 | Cstb | 0.523 | 3.36E-09 |
| 33 | Cml1 | −0.522 | 3.70E-09 |
| 34 | Tpp1 | 0.521 | 4.00E-09 |
| 35 | Apoc2 | 0.518 | 5.06E-09 |
| 36 | F7 | −0.515 | 6.32E-09 |
| 37 | Wfdc2 | 0.514 | 6.72E-09 |
| 38 | Bche | 0.514 | 6.72E-09 |
| 39 | Mms19 | −0.514 | 6.74E-09 |
| 40 | Jun | 0.513 | 7.05E-09 |
| 41 | Lifr | −0.513 | 7.33E-09 |
| 42 | Gjb1 | −0.512 | 7.63E-09 |
| 43 | Fabp2 | 0.511 | 8.56E-09 |
| 44 | Morc4 | 0.510 | 9.22E-09 |
| 45 | Rnf11 | 0.510 | 9.33E-09 |
| 46 | Egfr | −0.509 | 1.03E-08 |
| 47 | Slc16a7 | 0.507 | 1.12E-08 |
| 48 | Gfm1 | 0.505 | 1.32E-08 |
| 49 | Chpt1 | 0.505 | 1.33E-08 |
| 50 | Rbbp4 | −0.505 | 1.33E-08 |
Table 2
Top 50 adipose genes correlated with hepatic TG levels
| Rank | Gene symbol | r | p |
|---|---|---|---|
| 1 | Nrbp2 | −0.624 | 2.42E-13 |
| 2 | Cp | −0.598 | 4.15E-12 |
| 3 | Hoxa7 | −0.591 | 8.42E-12 |
| 4 | Prkcb | 0.585 | 1.62E-11 |
| 5 | Cstb | 0.582 | 2.03E-11 |
| 6 | Cd53 | 0.582 | 2.06E-11 |
| 7 | Smap2 | 0.580 | 2.62E-11 |
| 8 | Sft2d1 | 0.578 | 3.04E-11 |
| 9 | Btk | 0.576 | 3.56E-11 |
| 10 | Was | 0.576 | 3.62E-11 |
| 11 | Il7r | 0.575 | 3.94E-11 |
| 12 | Tmem53 | −0.573 | 4.77E-11 |
| 13 | Rgs10 | 0.572 | 5.70E-11 |
| 14 | Srp19 | 0.571 | 6.27E-11 |
| 15 | Gpc3 | −0.570 | 6.53E-11 |
| 16 | Bcl10 | 0.570 | 6.72E-11 |
| 17 | Gpr65 | 0.570 | 6.82E-11 |
| 18 | Tlr7 | 0.569 | 7.18E-11 |
| 19 | Efhd2 | 0.569 | 7.26E-11 |
| 20 | Actr3 | 0.568 | 7.77E-11 |
| 21 | Cd72 | 0.568 | 8.02E-11 |
| 22 | Dera | 0.567 | 8.89E-11 |
| 23 | Pip4k2a | 0.566 | 9.63E-11 |
| 24 | Hcst | 0.566 | 9.64E-11 |
| 25 | Tyms | 0.566 | 9.78E-11 |
| 26 | Cenpv | −0.566 | 9.79E-11 |
| 27 | Plxnc1 | 0.565 | 1.05E-10 |
| 28 | Birc5 | 0.565 | 1.07E-10 |
| 29 | Ptpn18 | 0.563 | 1.27E-10 |
| 30 | Hoxa5 | −0.562 | 1.37E-10 |
| 31 | Fam105a | 0.562 | 1.43E-10 |
| 32 | Capza1 | 0.562 | 1.44E-10 |
| 33 | Nap1l3 | −0.561 | 1.50E-10 |
| 34 | Rgs18 | 0.561 | 1.51E-10 |
| 35 | Phtf2 | 0.560 | 1.59E-10 |
| 36 | Nckap1l | 0.560 | 1.65E-10 |
| 37 | Coro1c | 0.560 | 1.67E-10 |
| 38 | Coro1a | 0.559 | 1.78E-10 |
| 39 | Lrrfip1 | 0.559 | 1.89E-10 |
| 40 | C1qb | 0.557 | 2.13E-10 |
| 41 | Taok3 | 0.556 | 2.28E-10 |
| 42 | Ms4a6c | 0.556 | 2.29E-10 |
| 43 | Bco2 | −0.556 | 2.33E-10 |
| 44 | Adrb3 | −0.556 | 2.34E-10 |
| 45 | Arhgap9 | 0.556 | 2.37E-10 |
| 46 | Lrmp | 0.556 | 2.47E-10 |
| 47 | Fyb | 0.555 | 2.50E-10 |
| 48 | Lipa | 0.555 | 2.63E-10 |
| 49 | Cdt1 | 0.555 | 2.65E-10 |
| 50 | S100a4 | 0.554 | 2.80E-10 |
Table 3
Pathway-enrichment analysis of the top 1000 hepatic genes correlated with hepatic TG levels, assessed with the DAVID database, and presented as total genes meeting that criterion in each pathway (Count), along with Benjamini corrected p values (Adj. p)
| Category | Term | Count | Adj. p | Fold enrichment |
|---|---|---|---|---|
| GOTERM_CC_FAT | GO:0005739 ∼ mitochondrion | 127 | 1.99E-05 | 1.57 |
| KEGG_PATHWAY | mmu04610:Complement and coagulation cascades | 18 | 3.93E-03 | 3.03 |
| GOTERM_CC_FAT | GO:0044420 ∼ extracellular matrix part | 17 | 5.89E-03 | 2.91 |
Table 4
Pathway-enrichment analysis of the top 1000 adipose genes correlated with hepatic TG levels, assessed with the DAVID database, and presented as total genes meeting that criterion in each pathway (Count), along with Benjamini corrected p values (Adj. p)
| Category | Term | Count | Adj. p | Fold enrichment |
|---|---|---|---|---|
| GOTERM_BP_FAT | GO:0000087 ∼ M phase of mitotic cell cycle | 36 | 9.69E-06 | 2.87 |
| KEGG_PATHWAY | mmu04142:Lysosome | 25 | 1.73E-03 | 2.50 |
| GOTERM_BP_FAT | GO:0008064 ∼ regulation of actin polymerization or depolymerization | 19 | 5.97E-06 | 5.43 |
| GOTERM_BP_FAT | GO:0007010 ∼ cytoskeleton organization | 39 | 1.89E-02 | 1.87 |
| GOTERM_BP_FAT | GO:0006955 ∼ immune response | 50 | 1.80E-02 | 1.72 |
| GOTERM_BP_FAT | GO:0009611 ∼ response to wounding | 42 | 2.64E-02 | 1.78 |
| GOTERM_BP_FAT | GO:0045321 ∼ leukocyte activation | 34 | 7.64E-04 | 2.36 |
| KEGG_PATHWAY | mmu04662:B cell receptor signaling pathway | 20 | 8.62E-04 | 3.08 |
| GOTERM_BP_FAT | GO:0001819 ∼ positive regulation of cytokine production | 13 | 1.85E-02 | 3.56 |
Table 5
Correlation between human GWAS candidate gene expression in mouse liver and adipose tissue with hepatic TG level
Table 6
Association p-values of candidate genes on chromosome 7 with the peak SNP for hepatic triglyceride levels
| Gene | Liver p-value | Liver expression | Adipose p-value | Adipose expression |
|---|---|---|---|---|
| Rps15a | NA | Yes | NA | Yes |
| Arl6ip1 | 0.011 | Yes | 0.294 | Yes |
| Smg1 | NA | No | NA | Yes |
| 4930583K01Rik | NA | No | NA | Yes |
| Syt7 | 0.495 | No | 0.748 | Yes |
| Itpripl2 | NA | Yes | NA | Yes |
| Coq7 | 7.18E-13 | Yes | 7.96E-14 | Yes |
| Tmc7 | NA | Yes | NA | Yes |
| Tmc5 | NA | No | NA | Yes |
| Gde1 | 3.21E-05 | Yes | 3.98E-08 | Yes |
| Ccp110 | NA | No | NA | No |
| 9030624J02Rik | NA | Yes | NA | Yes |
| Knop1 | 3.85E-07 | Yes | 0.043 | Yes |
| Iqck | NA | No | NA | No |
| Gprc5b | 0.002 | No | 0.661 | Yes |
| Gpr139 | NA | Yes | NA | No |
| Gp2 | 0.910 | No | 0.209 | No |
Table 7
Candidate genes under the chromosomes 3, 9, and 11 loci
| Chromosome 3 | Chromosome 9 | Chromosome 11 |
|---|---|---|
| 1110032F04Rik | Nphp3 | Il12b |
| Ift80 | Uba5 | Ublcp1 |
| Smc4 | Acad11 | Rnf145 |
| Trim59 | Dnajc3 | Ebf1 |
| Kpna4 | Acpp | Gm12159 |
| Gm1647 | Cpne4 | F630206G17Rik |
| Arl14 | Mrpl3 | Clint1 |
| Ppm1l | Nudt16 | Lsm11 |
| B3galnt1 | 1700080E11Rik | Thg1l |
| Nmd3 | Nek11 | Sox30 |
| Sptssb | Aste1 | Adam19 |
| Otol1 | Atp2c1 | Nipal4 |
| Pik3r4 | Cyfip2 | |
| Itk | ||
| Fam71b |
Table 8
Significant cis-eQTL at chromosome 7 locus
| Gene | Gene start position | SNP ID | Position | Liver p-value |
|---|---|---|---|---|
| Arl6ip1 | 118118891 | rs30668041 | 118266969 | 2.79E-24 |
| Coq7 | 118509659 | rs32461510 | 118350009 | 5.01E-24 |
| Gde1 | 118688545 | rs32511419 | 119070521 | 1.32E-06 |
| Knop1 | 118842237 | rs32246745 | 119160823 | 1.18E-07 |
| Gene | Gene start position | SNP ID | Position | Adipose p-value |
|---|---|---|---|---|
| Arl6ip1 | 118118891 | rs30668041 | 118266969 | 1.14E-36 |
| Coq7 | 118509659 | rs32430851 | 117961092 | 1.65E-18 |
| Gde1 | 118688545 | rs31516425 | 118372786 | 2.53E-12 |
| Knop1 | 118842237 | rs32532370 | 119288974 | 3.47E-10 |
| Gprc5b | 118972040 | rs48647926 | 118918455 | 3.70E-09 |
-
eQTL, expression Quantitative Trait Locus.
Table 9
Missense variants of candidate genes on chromosome 7
| Gene | Missense variants |
|---|---|
| Rps15a | None |
| Arl6ip1 | None |
| Smg1 | None |
| 4930583K01Rik | None |
| Syt7 | |
| Itpripl2 | |
| Coq7 | |
| Tmc7 | |
| Tmc5 | |
| Gde1 | None |
| Ccp110 | |
| 9030624J02Rik | |
| Knop1 | |
| Iqck | |
| Gprc5b | None |
| Gpr139 | None |
| Gp2 |
-
The effect of missense mutation was assessed by PROVEAN software. Neutral amino acid substitutions, which do not affect protein stability and function are shown in blue whereas deleterious mutations are labeled in red.
Table 10
Correlation between hepatic lipids and gut microbiota
| TG | TC | UC | PL | |
|---|---|---|---|---|
| Family: | ||||
| Clostridiaceae | −0.133 | 0.035 | 0.116 | 0.052 |
| Erysipelotrichaceae | 0.138 | 0.005 | −0.057 | −0.016 |
| Lachnospiraceae | 0.066 | −0.112 | 0.000 | 0.045 |
| Mogibacteriaceae | 0.033 | −0.055 | −0.092 | −0.089 |
| Peptostreptococcaceae | 0.006 | −0.019 | −0.003 | 0.096 |
| Rikenellaceae | 0.002 | 0.142 | 0.125 | −0.047 |
| Ruminococcaceae | 0.138 | 0.176 | 0.169 | 0.030 |
| S24-7 | −0.092 | 0.003 | −0.111 | −0.166 |
| Genus: | ||||
| 02d06 | −0.146 | −0.062 | −0.05 | 0.012 |
| Adlercreutzia | 0.014 | 0.001 | 0.133 | 0.084 |
| Akkermansia | −0.031 | 0.029 | 0.080 | 0.074 |
| Allobaculum | −0.083 | −0.205* | −0.178 | −0.009 |
| Anaeroplasma | −0.019 | −0.047 | 0.001 | 0.018 |
| Bifidobacterium | −0.014 | −0.082 | −0.131 | −0.084 |
| Blautia | 0.003 | −0.217* | −0.244† | −0.183 |
| Clostridium | −0.108 | −0.063 | −0.044 | −0.008 |
| Clostridium.1 | 0.081 | 0.044 | −0.023 | 0.015 |
| Coprobacillus | −0.008 | −0.075 | −0.138 | −0.130 |
| Coprococcus | −0.016 | 0.174 | 0.261† | 0.212* |
| Dehalobacterium | 0.086 | 0.070 | 0.066 | 0.070 |
| Dorea | 0.078 | 0.070 | 0.056 | 0.081 |
| Lactobacillus | 0.005 | 0.021 | −0.012 | −0.073 |
| Lactococcus | 0.085 | 0.001 | 0.048 | 0.065 |
| Oscillospira | 0.140 | 0.127 | 0.261† | 0.206* |
| R.Gnavus | 0.103 | −0.024 | −0.037 | −0.016 |
| Roseburia | 0.063 | −0.090 | −0.132 | −0.151 |
| Ruminococcus | 0.099 | −0.131 | −0.160 | −0.218* |
| Sarcina | −0.109 | 0.035 | 0.067 | 0.014 |
| SMB53 | −0.012 | −0.069 | −0.029 | 0.052 |
| Turicibacter | −0.035 | 0.016 | 0.019 | 0.013 |
-
TG: triglyceride; TC: total cholesterol; UC: unesterified cholesterol; PL: phospholipids.
-
*
Denotes FDR < 0.05.
-
†
Denotes FDR <0.01.
Table 11
Inbred and recombinant inbred strains used in this study
| Inbred strains | Recombinant inbred strains | ||||
|---|---|---|---|---|---|
| Strain | n | Strain | n | Strain | n |
| 129X1/SvJ | 4 | AXB10/PgnJ | 3 | BXD1/TyJ | 3 |
| A/J | 4 | AXB12/PgnJ | 5 | BXD11/TyJ | 2 |
| AKR/J | 5 | AXB13/PgnJ | 5 | BXD12/TyJ | 5 |
| BALB/cJ | 5 | AXB15/PgnJ | 4 | BXD13/TyJ | 2 |
| BTBR T<+> tf/J | 4 | AXB19/PgnJ | 5 | BXD14/TyJ | 4 |
| BUB/BnJ | 5 | AXB19a/PgJ | 4 | BXD15/TyJ | 5 |
| C3H/HeJ | 4 | AXB19b/PgJ | 5 | BXD16/TyJ | 3 |
| C57BL/6J | 4 | AXB2/PgnJ | 3 | BXD19/TyJ | 4 |
| C57BLKS/J | 4 | AXB5/PgnJ | 4 | BXD20/TyJ | 7 |
| C57L/J | 5 | AXB6/PgnJ | 3 | BXD21/TyJ | 5 |
| C58/J | 4 | AXB8/PgnJ | 5 | BXD24/TyJ | 4 |
| CBA/J | 4 | BXA1/PgnJ | 3 | BXD31/TyJ | 2 |
| CE/J | 4 | BXA11/PgnJ | 4 | BXD32/TyJ | 5 |
| DBA/2J | 4 | BXA12/PgnJ | 4 | BXD34/TyJ | 4 |
| FVB/NJ | 5 | BXA13/PgnJ | 3 | BXD36/TyJ | 4 |
| I/LnJ | 5 | BXA14/PgnJ | 4 | BXD38/TyJ | 4 |
| KK/HlJ | 5 | BXA16/PgnJ | 3 | BXD39/TyJ | 4 |
| LG/J | 4 | BXA2/PgnJ | 5 | BXD40/TyJ | 7 |
| MA/MyJ | 4 | BXA24/PgnJ | 4 | BXD43/RwwJ | 5 |
| NOD/ShiLtJ | 2 | BXA4/PgnJ | 4 | BXD44/RwwJ | 4 |
| NON/ShiLtJ | 5 | BXA7/PgnJ | 6 | BXD45/RwwJ | 5 |
| NZB/BlNJ | 4 | BXA8/PgnJ | 4 | BXD48/RwwJ | 4 |
| NZW/LacJ | 1 | BXH19/TyJ | 6 | BXD49/RwwJ | 4 |
| PL/J | 6 | BXH2/TyJ | 3 | BXD5/TyJ | 5 |
| RIIIS/J | 4 | BXH20/KccJ | 3 | BXD50/RwwJ | 4 |
| SEA/GnJ | 4 | BXH22/KccJ | 4 | BXD51/RwwJ | 4 |
| SJL/J | 5 | BXH4/TyJ | 4 | BXD55/RwwJ | 4 |
| SM/J | 4 | BXH6/TyJ | 5 | BXD56/RwwJ | 6 |
| SWR/J | 4 | BXH8/TyJ | 3 | BXD6/TyJ | 5 |
| BXH9/TyJ | 6 | BXD60/RwwJ | 2 | ||
| CXB11/HiAJ | 5 | BXD61/RwwJ | 4 | ||
| CXB12/HiAJ | 5 | BXD62/RwwJ | 6 | ||
| CXB13/HiAJ | 5 | BXD64/RwwJ | 4 | ||
| CXB3/ByJ | 5 | BXD66/RwwJ | 5 | ||
| CXB4/ByJ | 5 | BXD68/RwwJ | 4 | ||
| CXB6/ByJ | 6 | BXD70/RwwJ | 4 | ||
| CXB7/ByJ | 6 | BXD71/RwwJ | 4 | ||
| BXD73/RwwJ | 4 | ||||
| BXD74/RwwJ | 4 | ||||
| BXD75/RwwJ | 4 | ||||
| BXD79/RwwJ | 4 | ||||
| BXD8/TyJ | 2 | ||||
| BXD84/RwwJ | 4 | ||||
| BXD85/RwwJ | 4 | ||||
| BXD86/RwwJ | 5 | ||||
| BXD87/RwwJ | 3 | ||||
| BXD9/TyJ | 4 | ||||
Additional files
-
Supplementary file 1
Strain average of hepatic lipids.
- https://doi.org/10.7554/eLife.05607.024
-
Supplementary file 2
Correlation of hepatic TG and plasma metabolites.
- https://doi.org/10.7554/eLife.05607.025
Download links
A two-part list of links to download the article, or parts of the article, in various formats.
Downloads (link to download the article as PDF)
Open citations (links to open the citations from this article in various online reference manager services)
Cite this article (links to download the citations from this article in formats compatible with various reference manager tools)
The genetic architecture of NAFLD among inbred strains of mice
eLife 4:e05607.
https://doi.org/10.7554/eLife.05607


