Stimulus-selective crosstalk via the NF-κB signaling system reinforces innate immune response to alleviate gut infection
- National Institute of Immunology, India
Figures
Figure 1 with 3 supplements
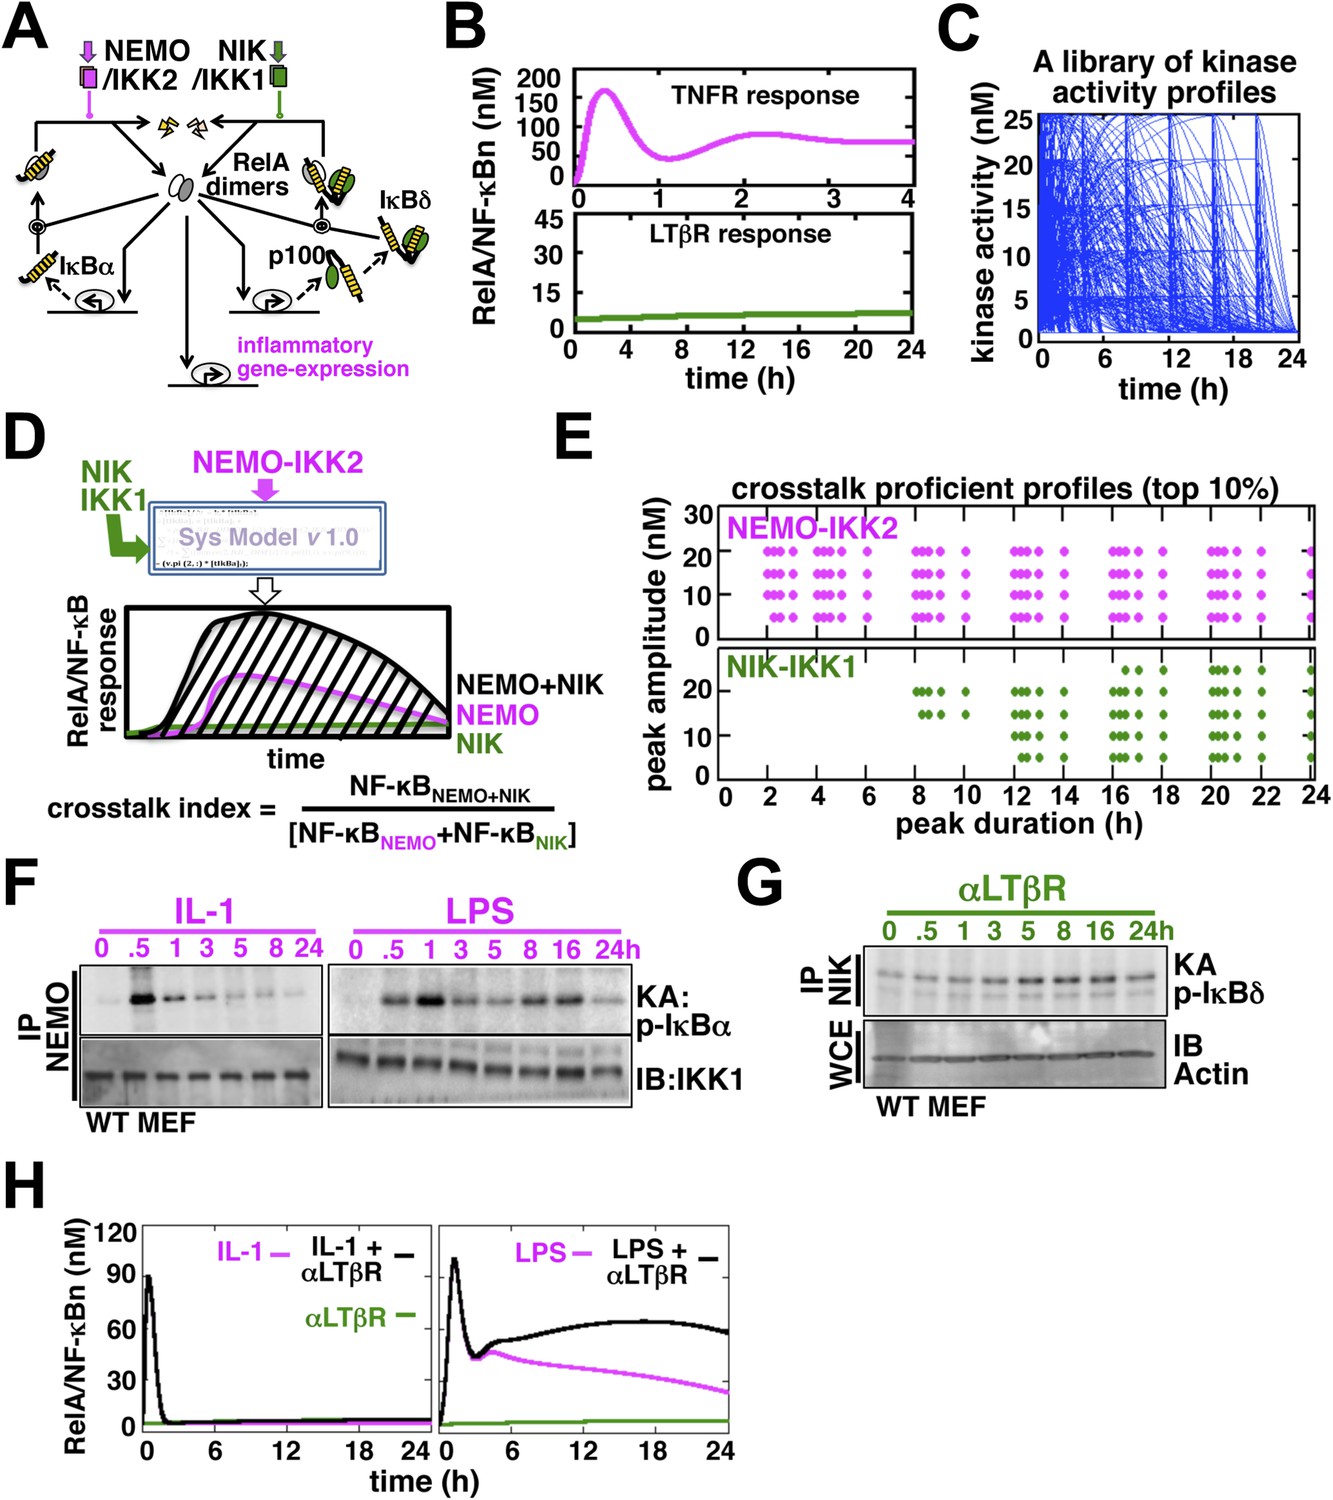
Computational simulations predicting a duration code underlying crosstalk control.
(A) A current model for RelA NF-κB activation via the canonical (IKK2) or the non-canonical (NIK-IKK1) pathways, respectively. RelA dimers represent both RelA:p50 and RelA:p52. Regulation of RelA NF-κB activities through crosstalk between these two pathways has not been addressed. (B) Computational simulations of nuclear RelA NF-κB induction by TNFR-induced IKK2 (top, magenta) or LTβR-induced NIK-IKK1 signals (bottom, green). (C) A theoretical library of 356 distinct kinase activity profiles. (D) A schematic describing in silico crosstalk studies. The kinase inputs were fed into the model through the IKK2 or NIK-IKK1 or both the arms. The RelA NF-κB responses, quantified as baseline corrected total area under the respective activity curves, were used for computing crosstalk indexes. (E) Based on their respective crosstalk indexes, top 10% combinations of theoretical IKK2 and NIK1 activity profiles were identified and duration as well as amplitude of the associated crosstalk-proficient IKK2 (top) or NIK-IKK1 (bottom) profiles were plotted. (F and G) The IKK2 (F) or NIK-IKK1 (G) activities were monitored by incubating GST-IκBα or GST-IκBδ with NEMO or NIK co-immunoprecipitates derived from MEFs treated with IL-1β, LPS (F, left and right panels), or αLTβR (G), respectively. For IKK2 assay, co immunoprecipitated IKK1 and for NIK-IKK1 assay, actin present in the cell extracts was used as loading controls. (H) Computational simulations predicting augmented RelA activity in LPS+αLTβR (right panel) and a lack of crosstalk in IL-1+αLTβR (left) co-treatment regimes.
Figure 1—figure supplement 1
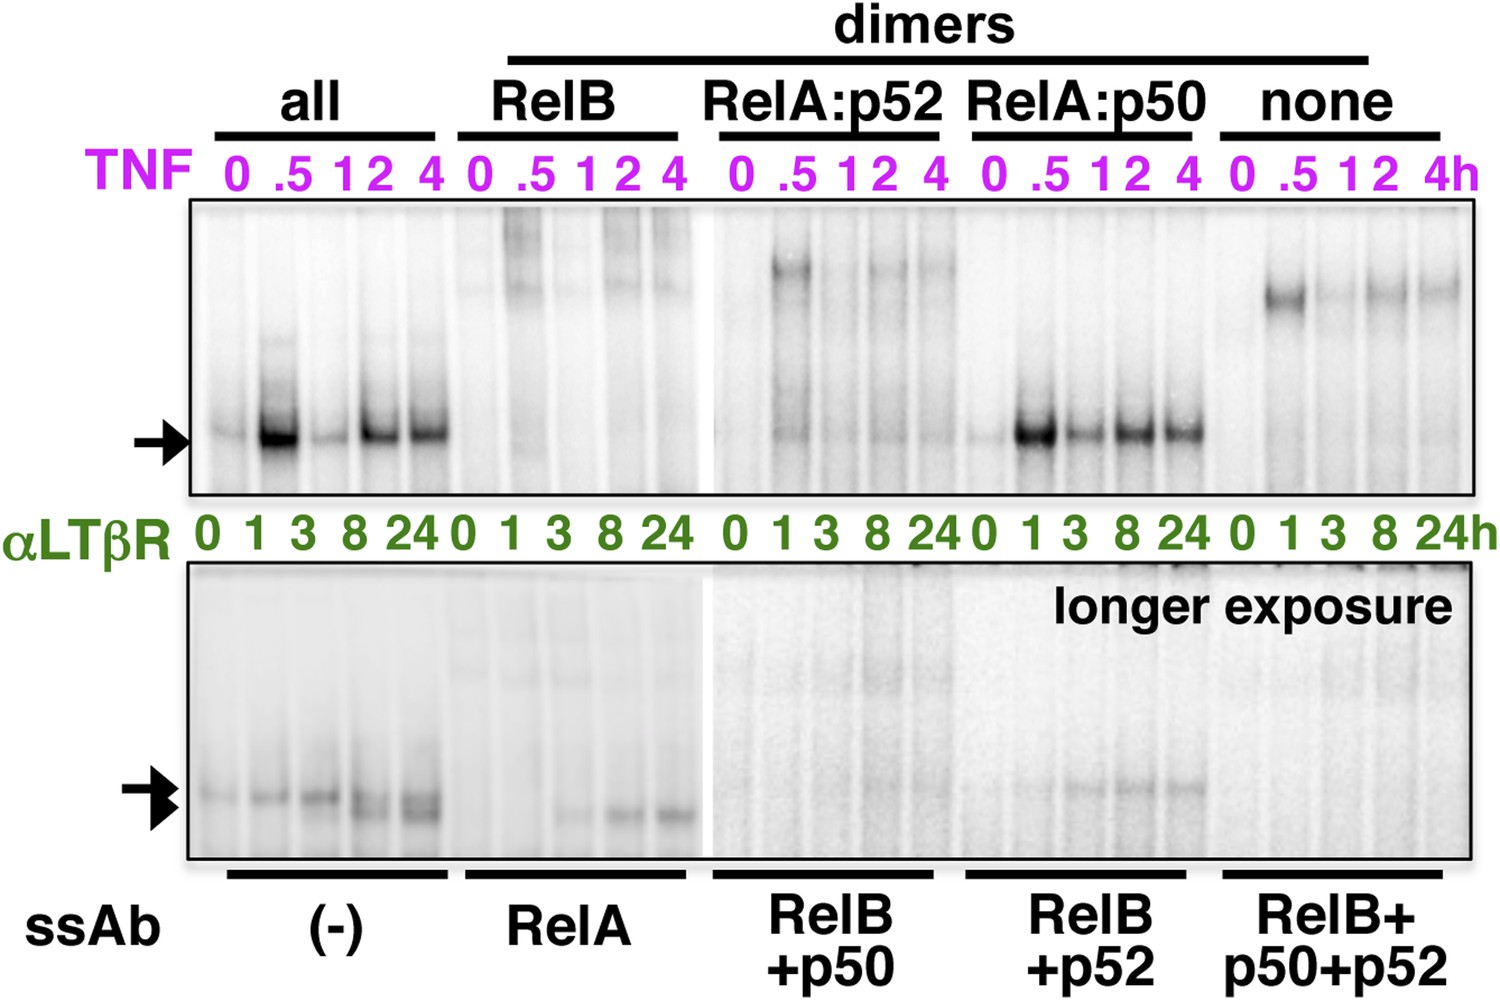
Analyzing the composition of signal-induced NF-κB dimers.
The dynamic profiles, and the composition of the nuclear RelA NF-κB DNA binding activities induced upon TNFR (top panel) or LTβR (bottom) engagement were analyzed in EMSA and supershift assay using the indicated antibodies. A longer exposure of EMSA gel was used in the bottom panel to reveal otherwise weak LTβR induced DNA binding activities.
Figure 1—figure supplement 2
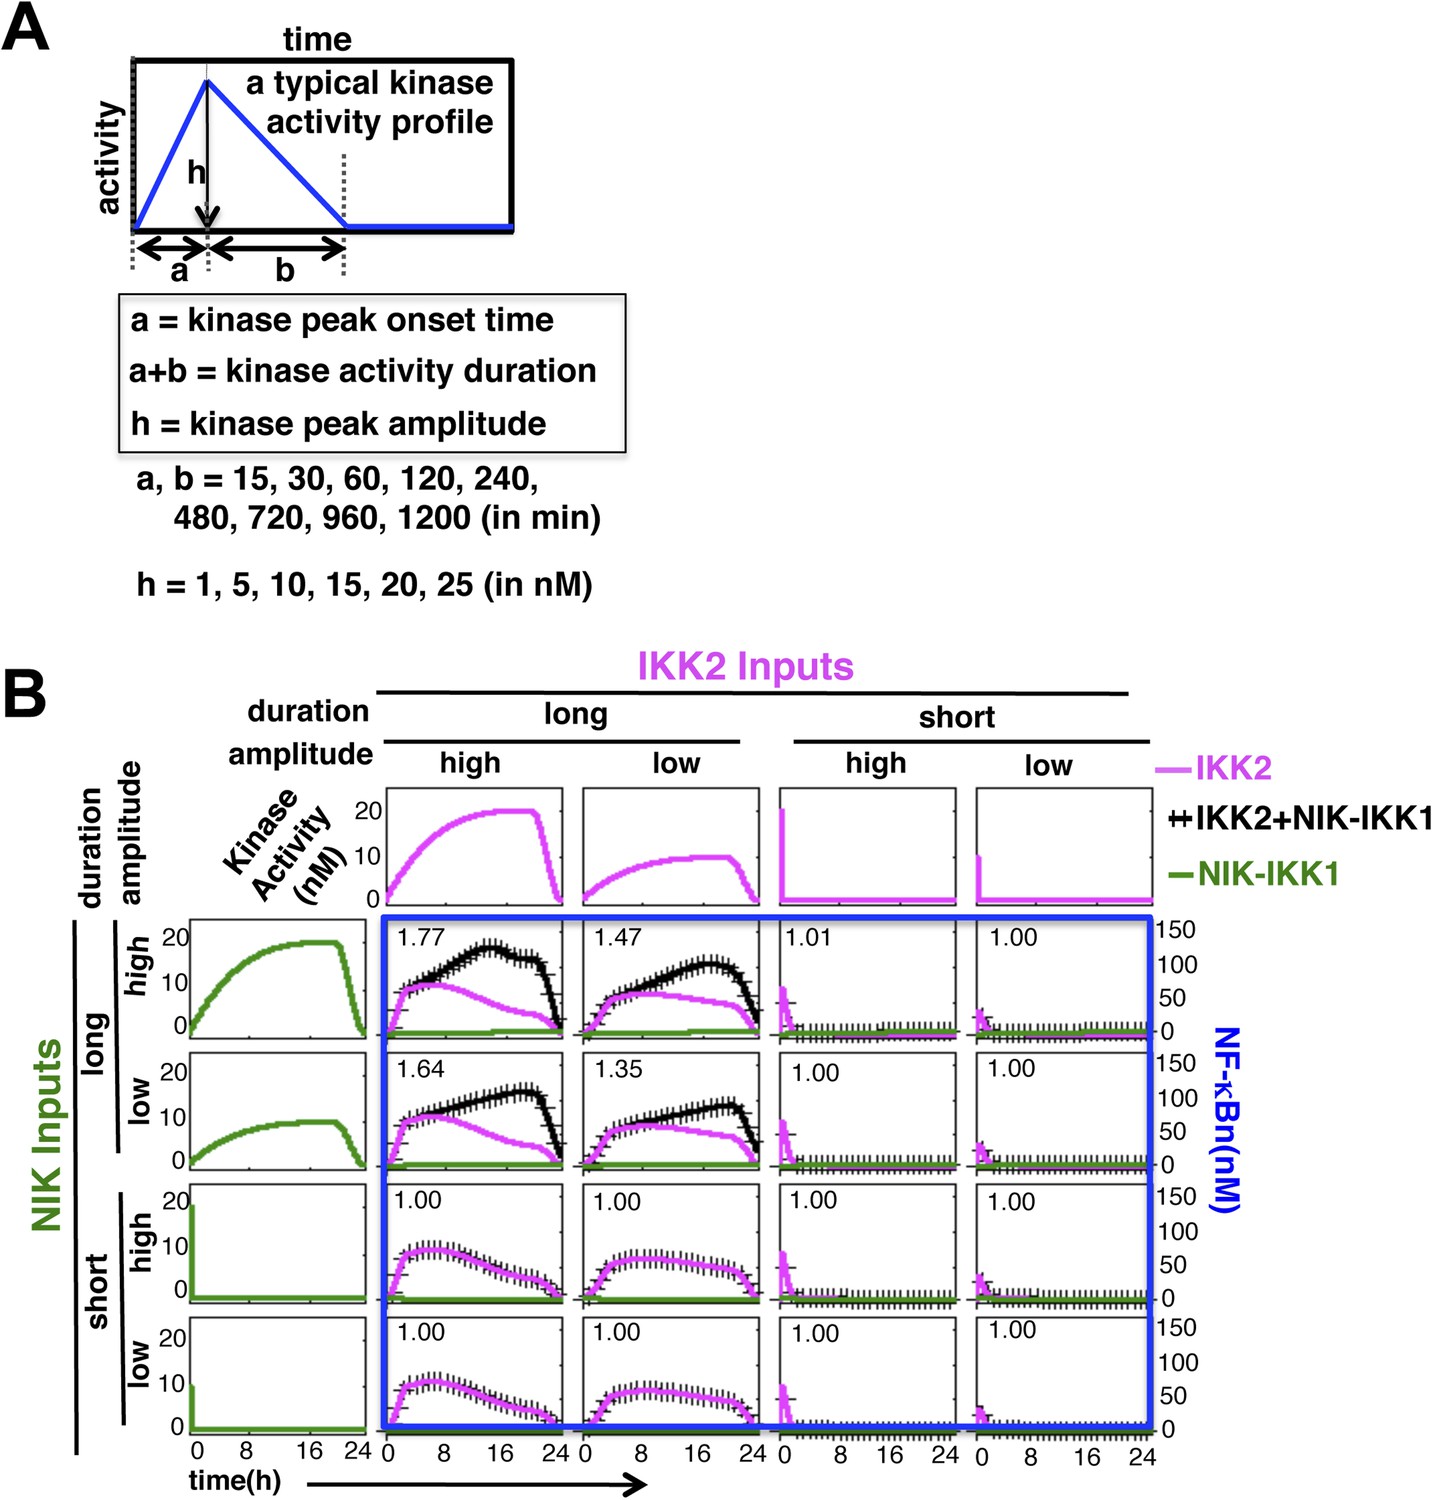
Mathematical modeling revealing a duration code underlying signaling crosstalk.
(A) A schematic of a typical kinase activity profile. For the indicated values of ‘a’, ‘b’, and ‘h’, a theoretical library of activity profiles, as presented in Figure 1C, was generated. (B) Representative long or short duration as well as low or high amplitude kinase profiles were selected from the library to simulate RelA activity in response to singular IKK2 or NIK-IKK1 inputs or co-treatment regimes. All 16 NF-κB activity plots were enclosed together in a blue rectangle. Crosstalk index for different IKK2 and NIK-IKK1 combinations have been indicated in the respective NF-κB plots which indicates a dominant role of duration of the activating kinases in crosstalk.
Figure 1—figure supplement 3
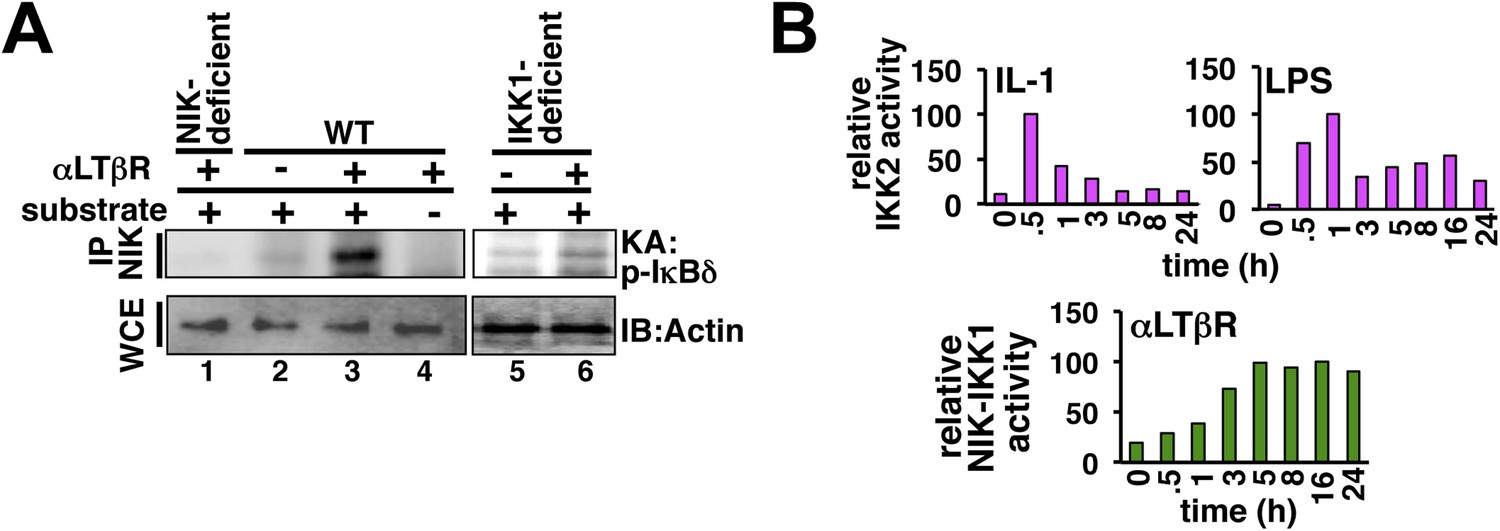
Kinase assays probing cellular activation of NEMO-IKK2 and NIK-IKK1.
(A) NIK associates with and stimulates an NEMO-independent pool of IKK1, which participates in non-canonical signaling. By immunoprecipitating NIK, we could reveal LTβR induced kinase activity in the immunopellet at 8 hr post-stimulation (lane 2 and 3) that specifically phosphorylated GST-IκBδ (lane 3 and 4). The specificity of the NIK-IKK1 kinase assay was further confirmed using αLTβR treated Nik−/− (lane 1) or Ikk1−/− (lane 5, 6) MEFs. (B) Quantification of the data presented in Figure 1F revealing IKK2 activation in response to IL-1 or LPS (top) and Figure 1G revealing NIK-IKK1 activation in response to αLTβR (bottom) in WT MEFs.
Figure 2 with 1 supplement
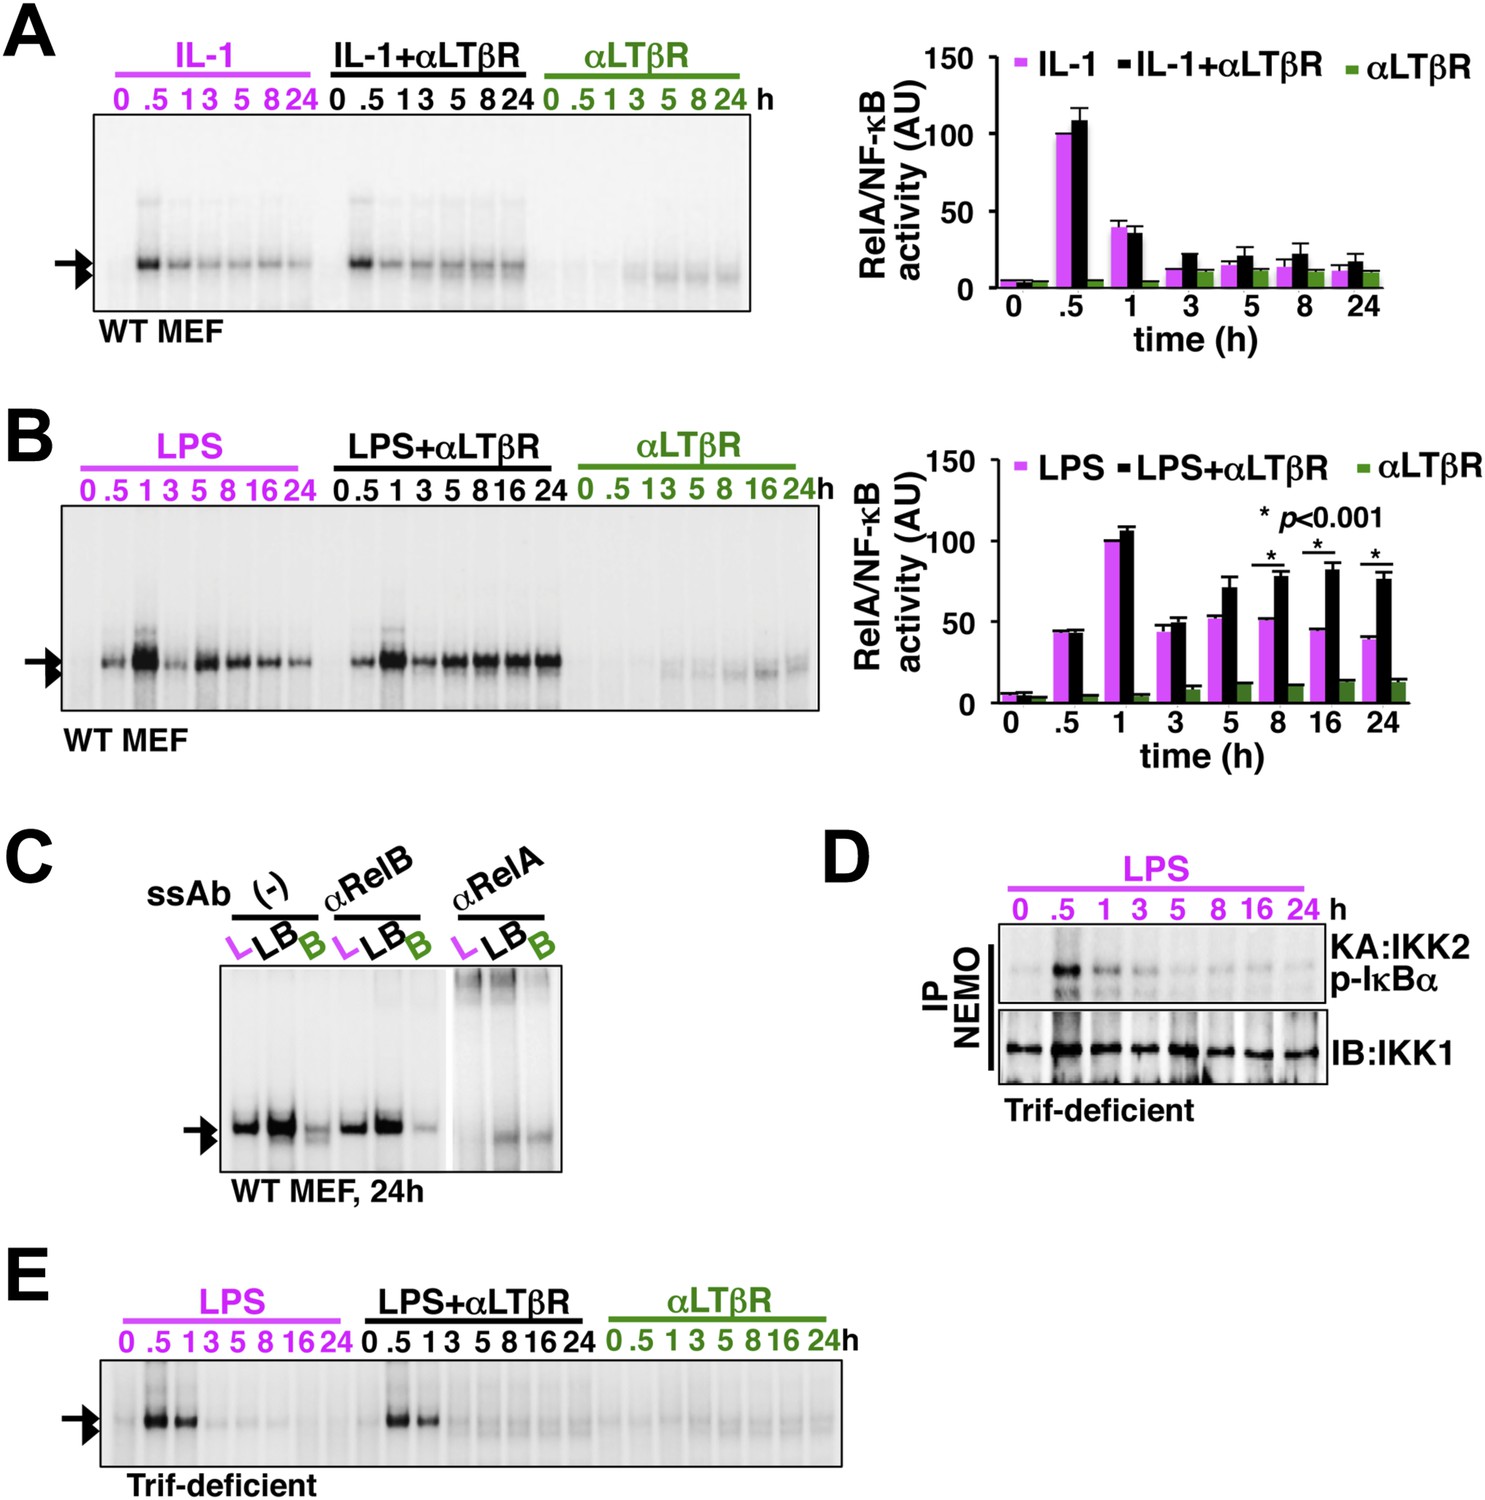
LTβR signal sustains TLR4, but not IL-1R, induced RelA NF-κB response.
(A) Nuclear NF-κB activities induced in MEFs by IL-1β or αLTβR or co-treatment were resolved in EMSA using a κB site containing DNA probe. The faster migrating complex, indicated with an arrowhead, consists of RelB and the slower migrating complex activated by both canonical or non-canonical signaling, denoted with an arrow, consists of RelA dimers. The compositions of the DNA binding complexes were ascertained in Figure 2C. Right, signal corresponding to RelA NF-κB activities were quantified and graphed relative to the respective IL-1 induced peak value. Data were expressed as mean of 3 quantified biological replicates ± SEM. (B) EMSA result, representative of three independent biological replicates, revealing augmented late NF-κB activities in the co-treatment regime as compared to cell treatment with LPS or αLTβR alone. Right, signal corresponding to RelA NF-κB activities were similarly quantified and graphed relative to LPS induced peak value. Note, late RelA activities in the LPS+αLTβR co-treatment regime were significantly augmented from of the LPS induced activities. (C) Supershift analysis distinguishing RelA and RelB dimers induced in MEFs treated with LPS (L) or αLTβR (B) or both (LB) for 24 hr. (D) Kinase assay revealing transient IKK2 activities in response to LPS in Trif-deficient MEFs. (E) EMSA data, representative of three independent experiments, revealing a lack of NF-κB crosstalk between TLR4 and LTβR in Trif-deficient MEFs.
Figure 2—figure supplement 1
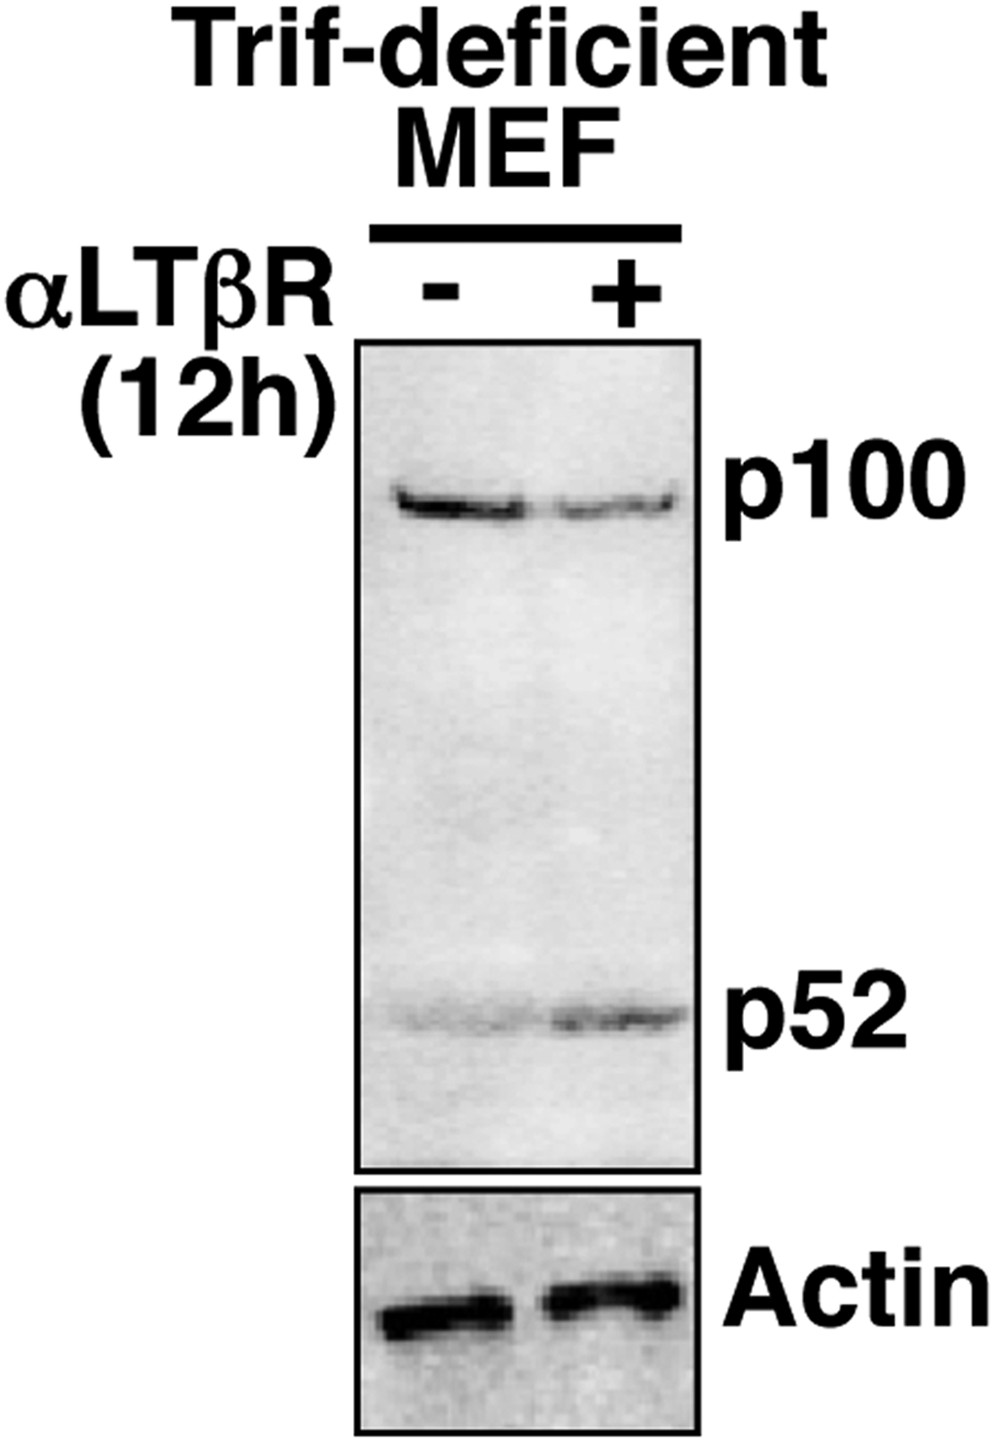
Analyzing crosstalk control in Trif-deficient MEFs.
Immunoblot revealing p100 processing into p52 upon LTβR engagement in Trif-deficient MEFs to confirm a functional non-canonical pathway in these cells.
Figure 3
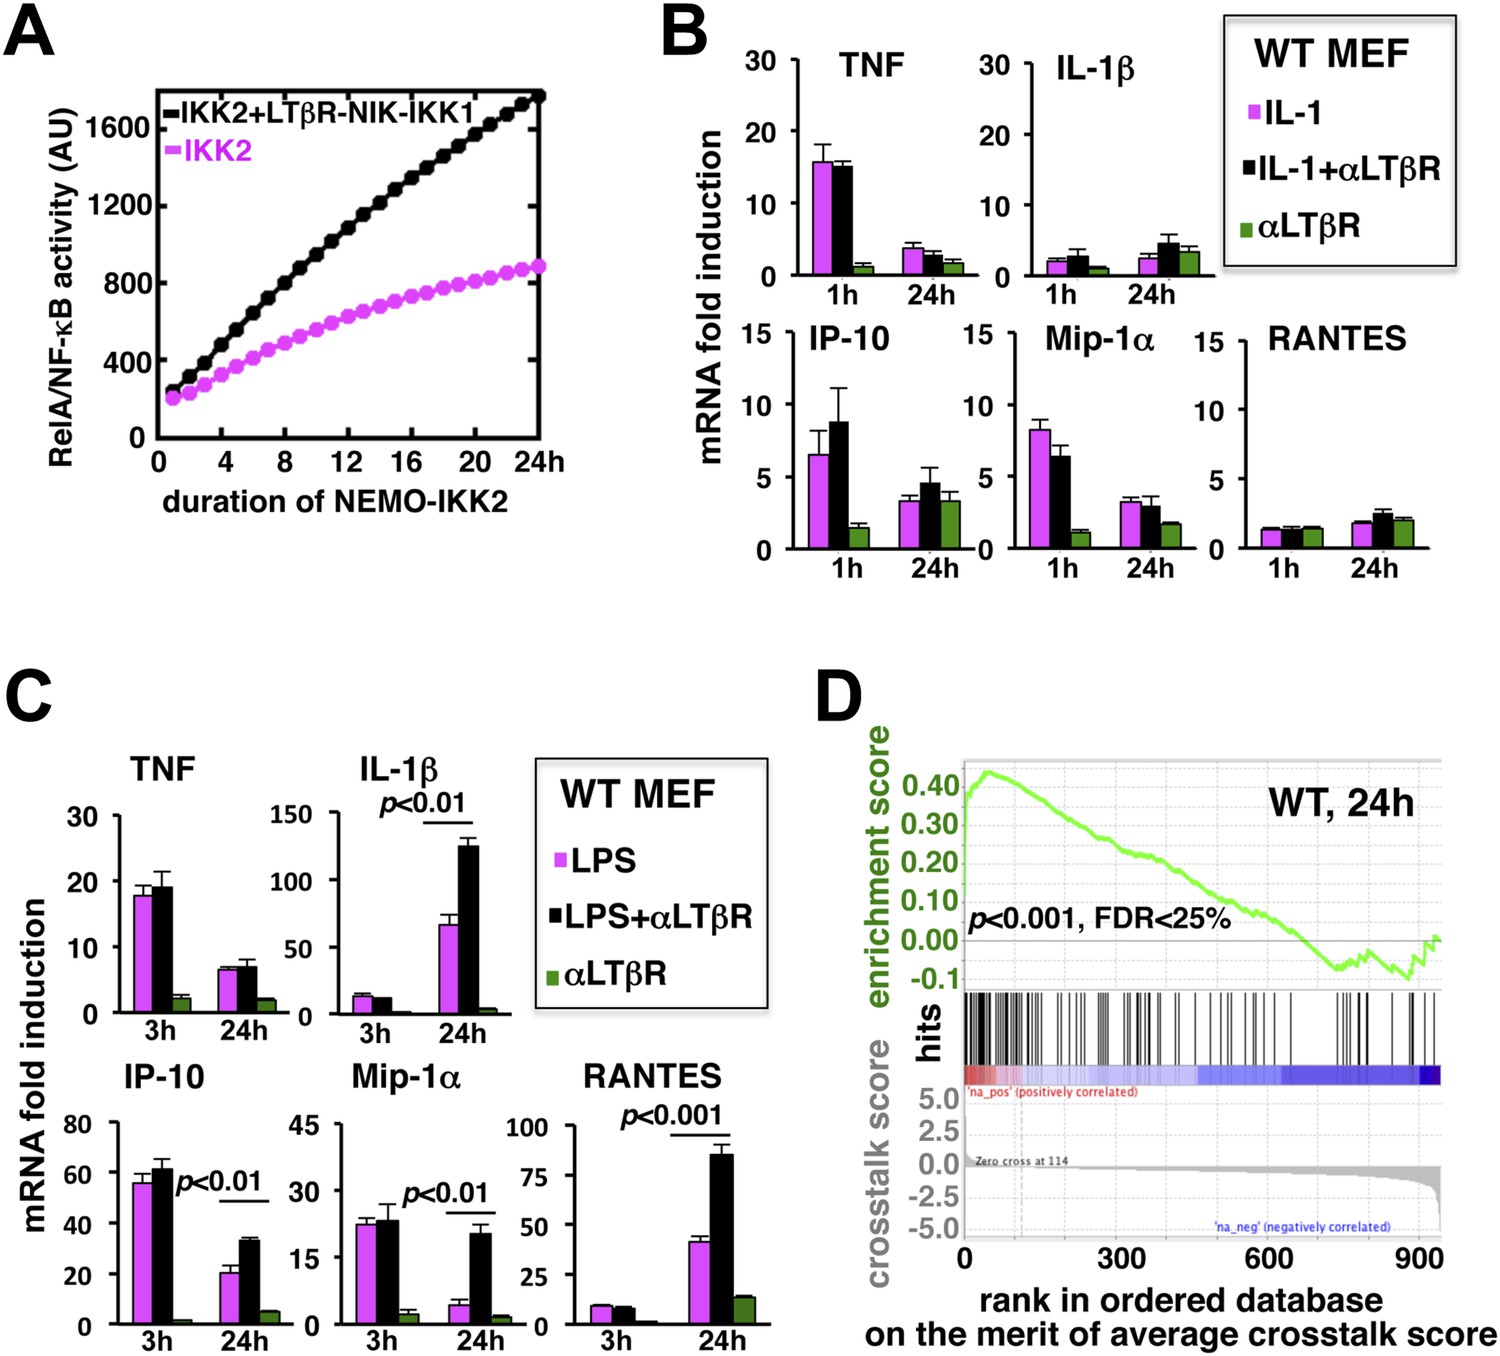
LTβR signal augments the late expressions of TLR4-induced NF-κB target genes.
(A) Computational simulation revealing total RelA activities induced by IKK2 inputs of various durations, in the absence or presence of LTβR induced NIK-IKK1. (B) Quantitative RT-PCR measuring early (1 hr) and late (24 hr) expressions of chemokine and cytokine genes in WT MEFs by IL-1R or LTβR or costimulation. (C) Gene-expression analyses similarly revealing early (3 hr) and late (24 hr) expressions of chemokine and cytokine genes in WT MEFs by TLR4 or LTβR or costimulation. In (B) and (C), data are expressed as mean of 3 quantified biological replicates ± SEM. The statistical significance was determined using two-tailed Student's t-test. (D) LPS-induced genes, identified in representative microarray experiments at 24 hr post-stimulation, were ranked based on their normalized crosstalk score (bottom panels), which reflects synergistic gene activation in the co-treatment regime as compared to individual cell treatments for a positive value. GSEA demonstrated statistically significant enrichment of NF-κB targets (top), with enrichment score of 0.44 for WT MEFs, among genes positively controlled through crosstalk. Hits (middle) indicate NF-κB response genes.
-
Figure 3—source data 1
List of LPS target genes positively regulated through crosstalk.
- https://doi.org/10.7554/eLife.05648.010
-
Figure 3—source data 2
A pre-determined list of 290 NF-κB response genes used in GSEA.
- https://doi.org/10.7554/eLife.05648.011
Figure 4 with 1 supplement
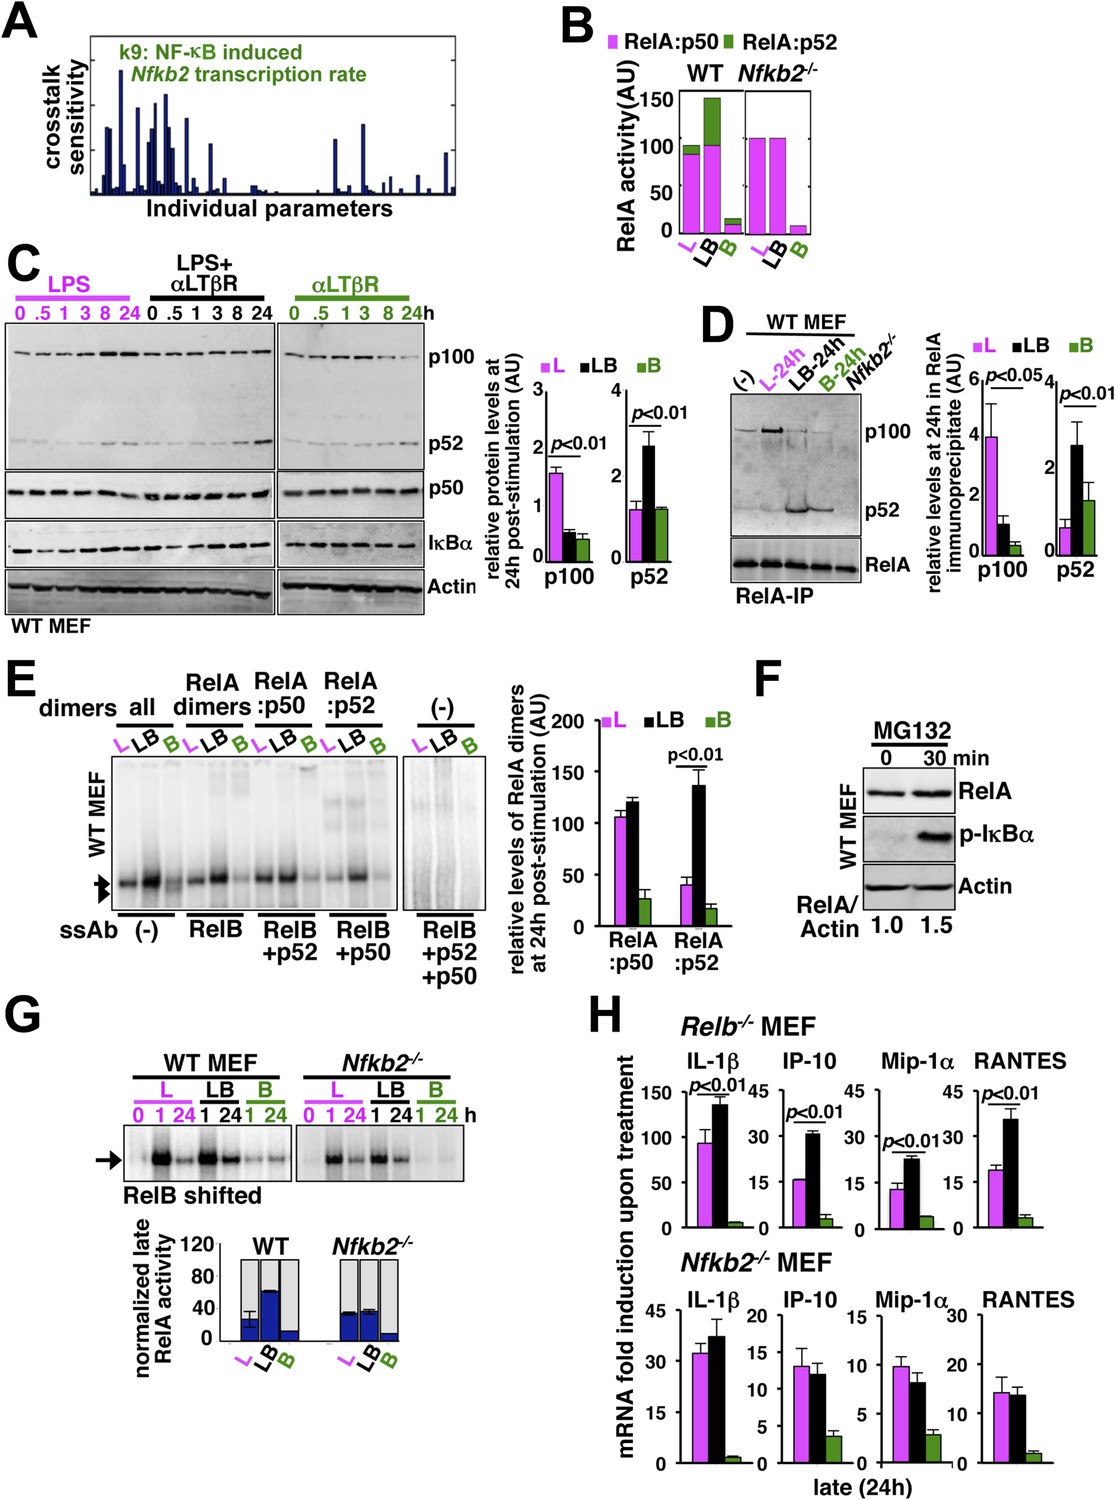
Signal generation of RelA:p52 NF-κB dimer underlies a pro-synergistic function of Nfkb2.
(A) Local sensitivity analysis revealing the effect of perturbation of the individual biochemical parameters on crosstalk between TLR4 and LTβR. (B) Computational simulations of total RelA:p50 and RelA:p52 activities between 8 and 24 hr in response to LPS, αLTβR, or both in WT or Nfkb2 deficient systems. (C) Immunoblot charting cellular abundance of NF-κB/IκB proteins during signaling. Right, signal corresponding to p100 and p52 levels at 24 hr post-stimulation were quantified and graphed. (D) Immunoblot of RelA co-immunoprecipitates, normalized for the RelA content, obtained using whole cells extracts derived from MEFs treated with LPS (L) or αLTβR (B) or both (LB) for 24 hr. The quantified data demonstrates the level of RelA-p100 or RelA-p52 complexes at 24 hr post-stimulation. (E) Supershift analysis revealing the composition of the RelA dimers induced upon indicated cell treatments for 24 hr. Right, signal corresponding to RelA:p50 or RelA:p52 NF-κB activities were quantified and graphed. (F) Representative immunoblot demonstrating an increase in the RelA protein level in MEFs, in parallel to phospho-IκBα accumulation, upon proteasome inhibition using MG-132. (G) EMSA revealing RelA activities induced in WT or Nfkb2−/− MEFs upon indicated cell-stimulations by supershifting RelB. Below, quantified late (24 hr) RelA activities were plotted for different genotypes subsequent to normalizing against the respective LPS induced early 1 hr peak. (H) mRNA analyses comparing late (24 hr) expressions of chemokines/cytokines in Relb−/− (top) and Nfkb2−/− (bottom) MEFs upon indicated cell stimulations. Quantified data for both biochemical and gene-expression analyses presented in this figure are expressed as mean of 3 biological replicates ± SEM.
Figure 4—figure supplement 1
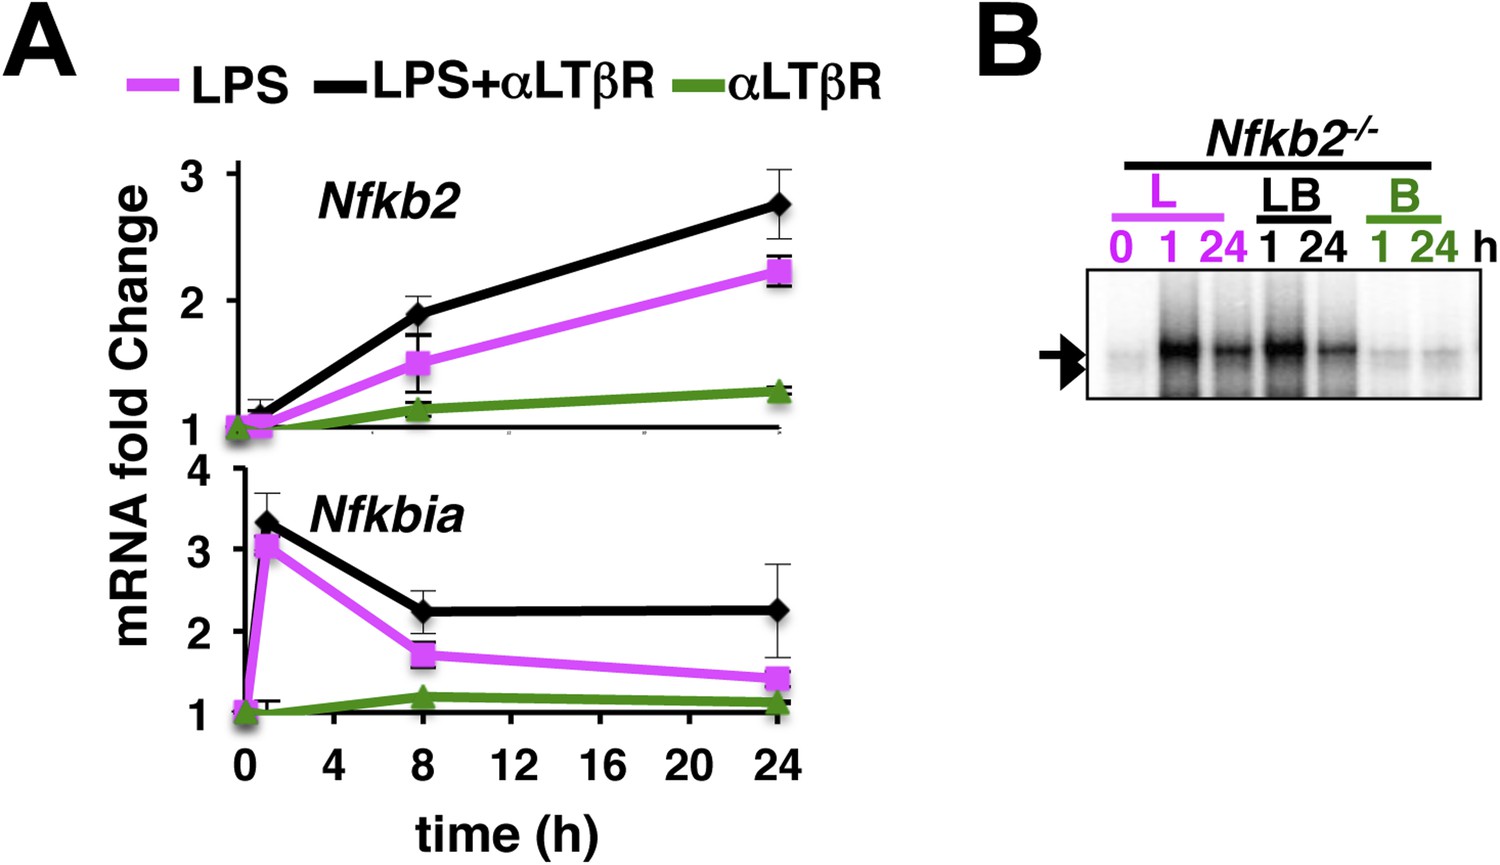
An important role of the non-canonical signal transducer Nfkb2 in crosstalk.
(A) The level of Nfkb2 mRNA (top) and Nfkbia mRNA, which encodes IκBα (bottom), was monitored in a time course during TLR4 or LTβR signaling or in the co-stimulation regime. Strong RelA activity, observed in EMSA, led to potent induction of both the NF-κB targets in response to LPS treatment or in the co-treatment regime. LTβR that only weakly activated RelA, only subtly altered the levels of these two mRNAs. Data are expressed as mean of 3 quantified biological replicates ± SEM. (B) EMSA revealing NF-κB DNA binding activities in Nfkb2−/− MEFs upon cell-treatment with indicated stimuli. Note constitutive RelB DNA binding activity that largely substituted LTβR induction of RelB dimers.
Figure 5 with 1 supplement
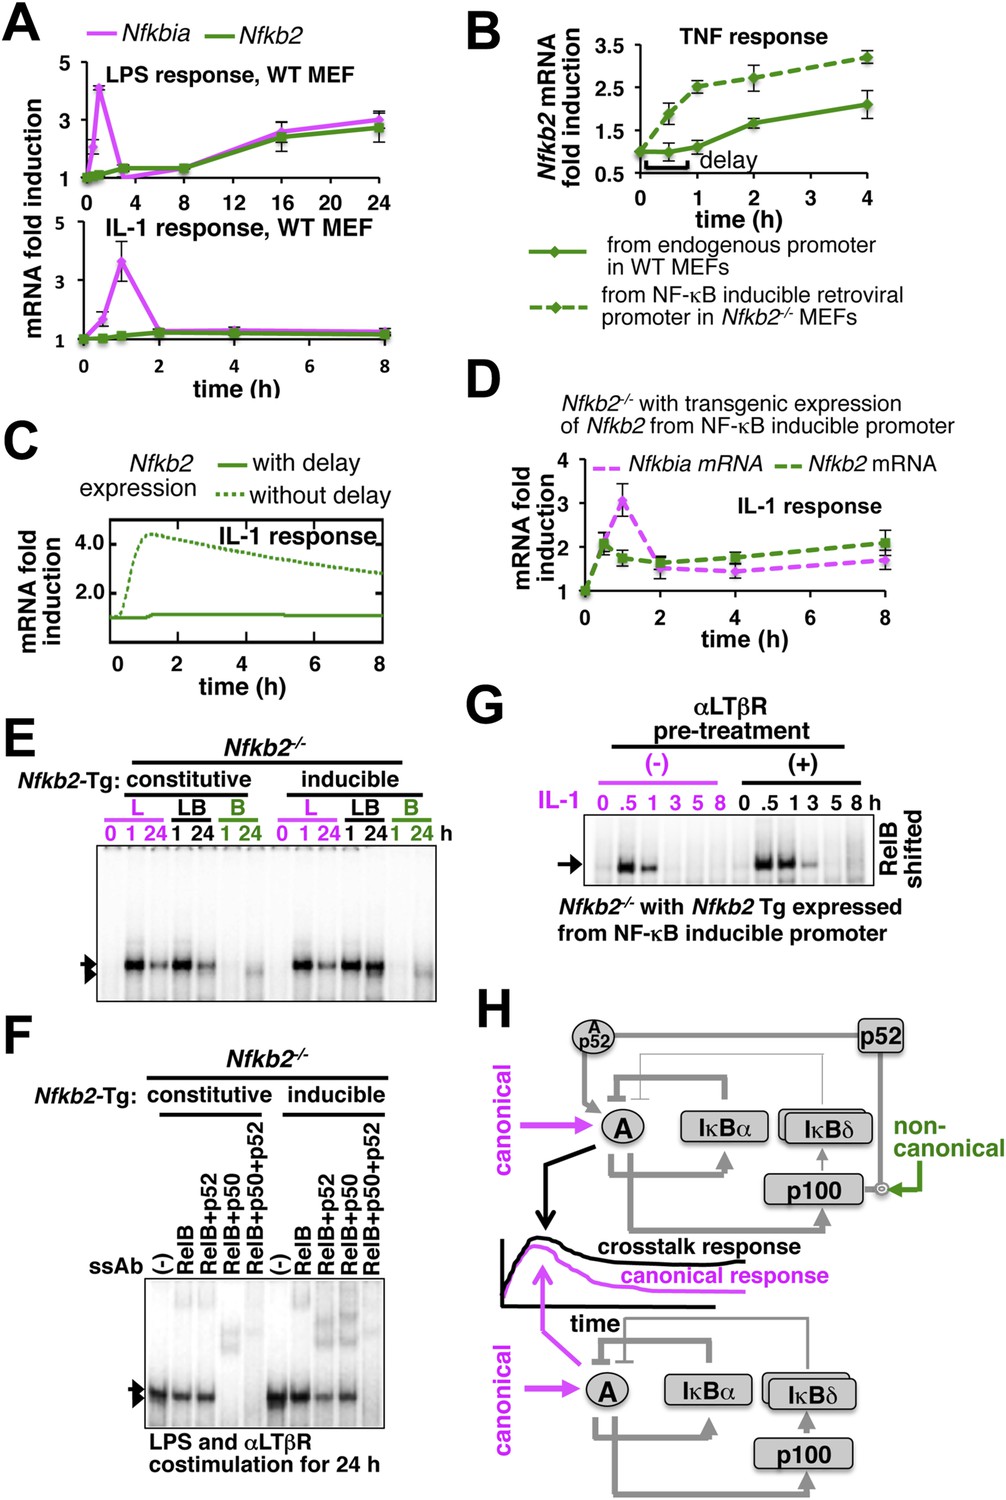
Induction of Nfkb2 expressions by canonical signal is required for crosstalk.
(A) Relative levels of Nfkb2 mRNA and Nfkbia mRNA, which encodes IκBα, in WT MEFs during LPS or IL-1 signaling. (B) TNF induced delayed expression of Nfkb2 mRNA in WT MEFs and rapid production in an engineered Nfkb2−/− cell-line from an exogenous NF-κB dependent promoter. Data presented in (A) and (B) are expressed as mean of 3 quantified biological replicates ± SEM. (C) Simulations comparing IL-1-induced Nfkb2 mRNA expressions in the presence or absence of transcriptional delay. (D) Quantitative RT-PCR revealing IL-1 induced expression of Nfkb2 and Nfkbia mRNAs in the engineered Nfkb2−/− cell line with transgenic expressions of Nfkb2 from the NF-κB inducible promoter. Data are expressed as mean of 3 quantified biological replicates ± SEM. (E) EMSA comparing NF-κB activities induced in Nfkb2−/− MEFs expressing Nfkb2 from either a constitutive (lane 1–7) or an NF-κB responsive (lane 2–14) transgenic (Tg) promoter. (F) Supershift analyses comparing nuclear abundance of different NF-κB dimers activated upon costimulation with LPS+αLTβR for 24 hr in these two engineered Nfkb2−/− cell lines. (G) The engineered Nfkb2−/− cell line, which expresses Nfkb2 from the NF-κB-inducible promoter, was pretreated for 8 hr with αLTβR and subsequently treated with IL-1. Supershifting RelB, representative RelA activities were captured in EMSA. (H) A graphical depiction of the proposed crosstalk control; two negative feedback loops coordinately attenuate TLR4 responses. However, one of these negative feedback loops is converted into a positive feedback loop by non-canonical signals to generate crosstalk at the level of RelA NF-κB activation. Magenta and green arrows indicate canonical IKK2 and non-canonical NIK-IKK1 inputs, respectively, and line thickness signifies relative strength of feedbacks.
Figure 5—figure supplement 1
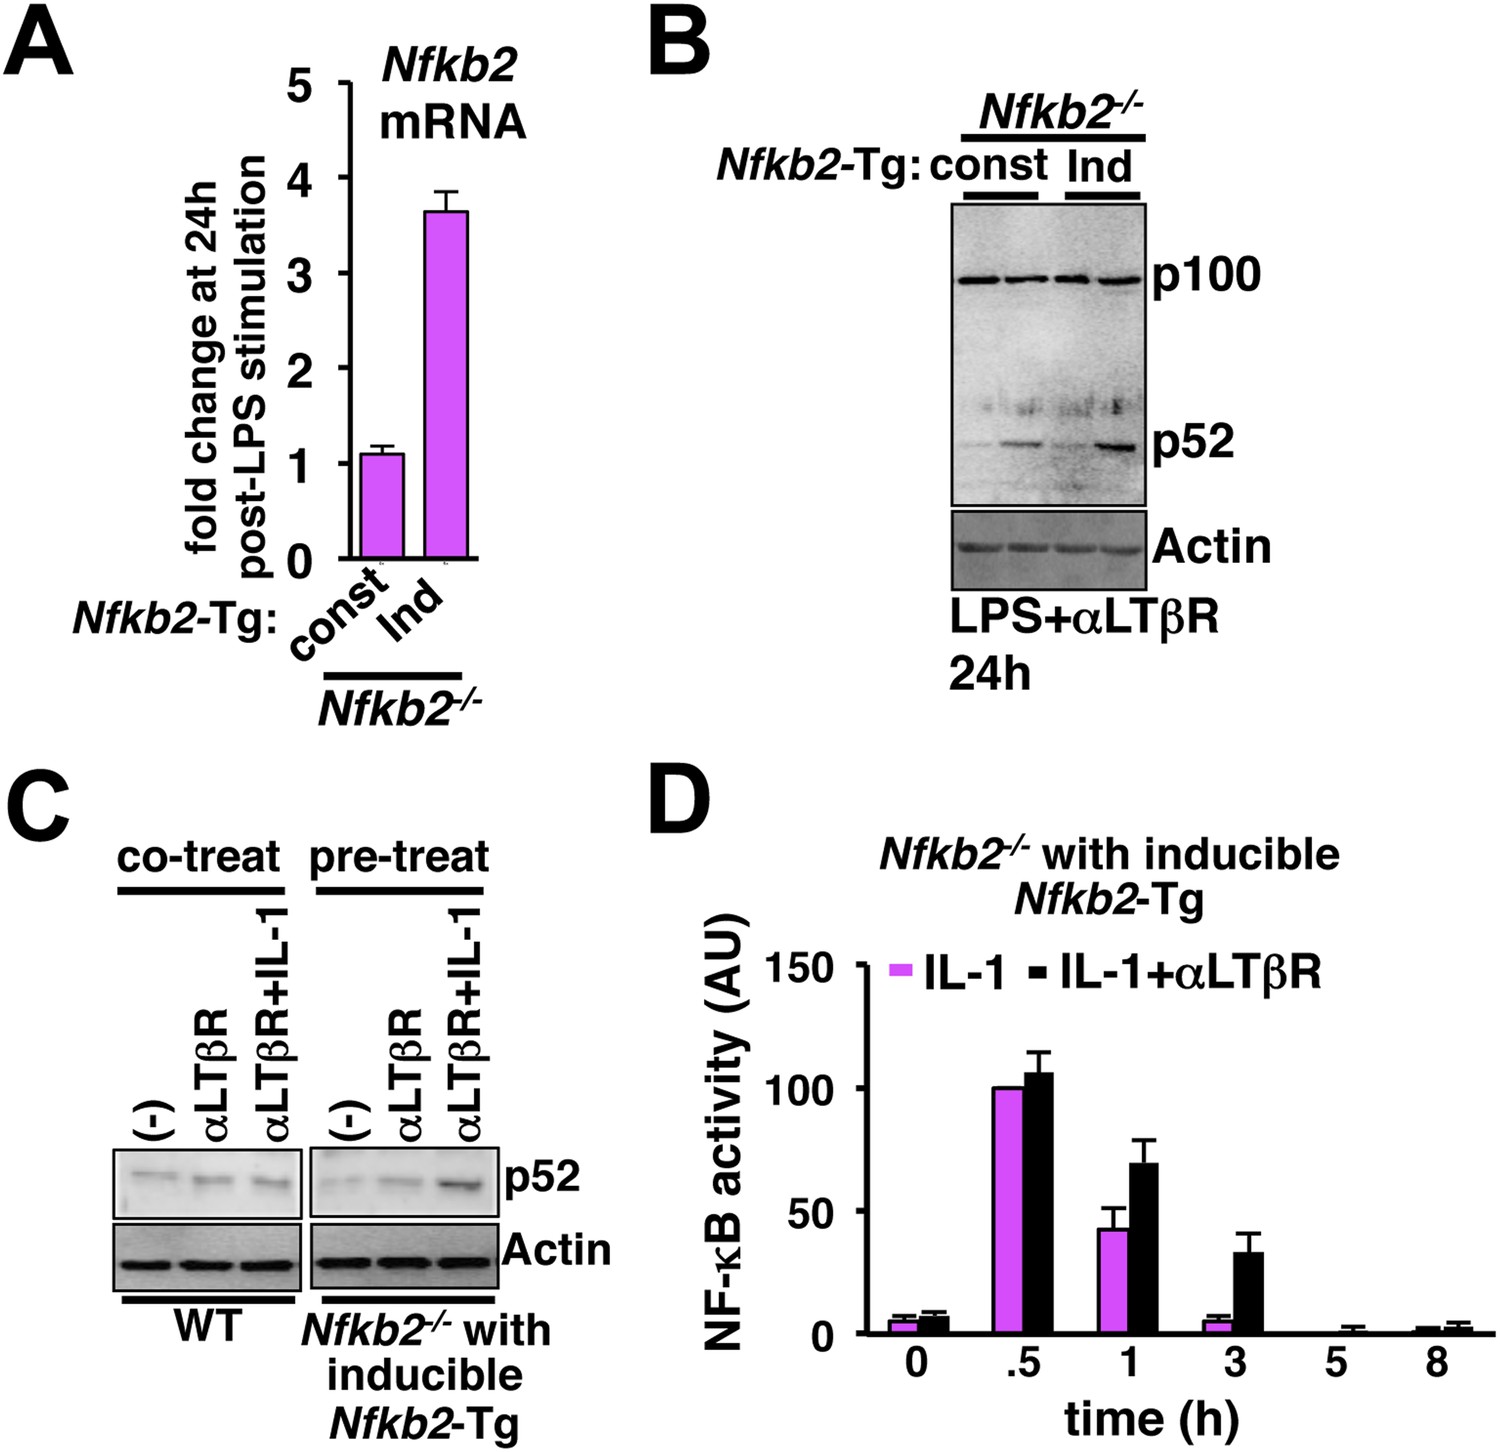
Induction of Nfkb2 expression by canonical signal is important for crosstalk.
(A) Comparing LPS induced changes in Nfkb2 mRNA levels in two engineered Nfkb2−/− cell lines expressing Nfkb2-Tg from either a constitutive or an NF-κB responsive promoter. Our analyses confirmed a lack of LPS-inducible expression of Nfkb2 from the constitutive promoter, but 3.5 fold induced expression from the inducible promoter. (B) Immunoblot comparing p52 generation upon LPS+LTβR costimulation in these two engineered Nfkb2−/− cell lines. (C) Left panel, immunoblot comparing p52 production in WT cells upon 8 hr of αLTβR treatment with or without subsequent 3 hr IL-1 stimulation. Similarly, the engineered Nfkb2−/− cell line, which expresses Nfkb2 from the NF-κB responsive promoter, was subjected to IL-1 treatment subsequent to 8 hr of LTβR pre-treatment (right panel). (D) Quantification of the data presented in Figure 5G and two more experimental replicates. Data are expressed as mean of 3 quantified biological replicates ± SEM.
Figure 6 with 1 supplement
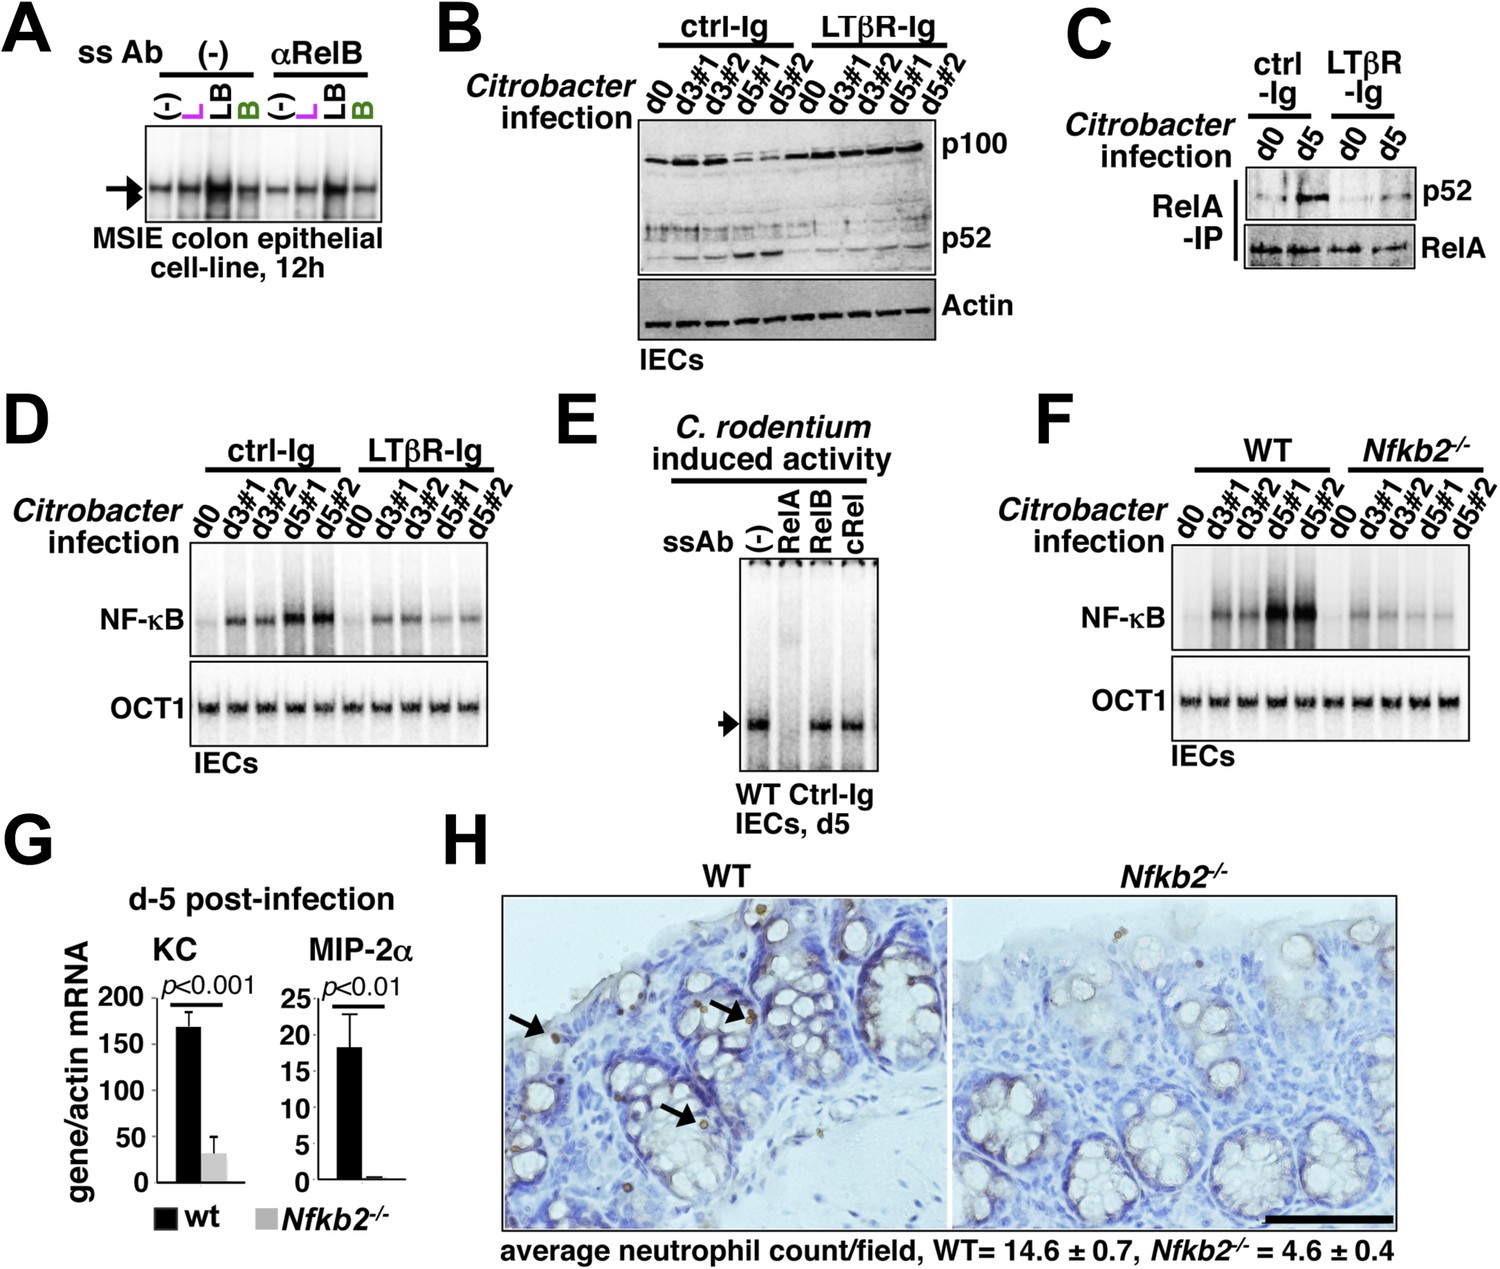
Nfkb2 dependent LTβR crosstalk prolongs RelA NF-κB response in the colon of Citrobacter rodentium-infected mice.
(A) EMSA data, representing two independent experiments, revealing LPS-induced total RelA NF-κB activities induced in MSIE colon epithelial cell line at 12 hr in the absence or presence of 1 μg/ml of αLTβR. (B), (C), and (D) WT mice were injected with control-Ig or LTβR-Ig (n = 2) 1 day prior to infection with C. rodentium. IECs were isolated at day3 and day5 post-infection and analyzed for p52 and p100 levels by immunoblotting (B), RelA:p52 complex formation by immunoprecipitation-based assay (C) or NF-κB DNA binding activities in EMSA (D). OCT1 DNA binding activity served as loading control. (E) Supershift analyses revealing that exclusively RelA/NF-κB dimer are activated in IECs derived from mice infected with C. rodentium. (F) NF-κB activities induced in IECs derived from infected WT and Nfkb2−/− mice (n = 2) were similarly measured. (G) Epithelial expressions of KC and MIP-2a mRNA derived from WT and Nfkb2−/− mice (n = 5) at day5 post-infection. Data are expressed as mean of 3 quantified biological replicates ± SEM. The statistical significance was determined using two-tailed Student's t-test. (H) Representative data showing antimyeloperoxidase staining of neutrophils in colons of WT and Nfkb2−/− mice at day4 post-infection. Colon sections from three animals per set and five fields/section were used for quantification and presented as mean ± SEM. The panels with 40× magnification have been presented using scale bars that represent 200 μm.
Figure 6—figure supplement 1
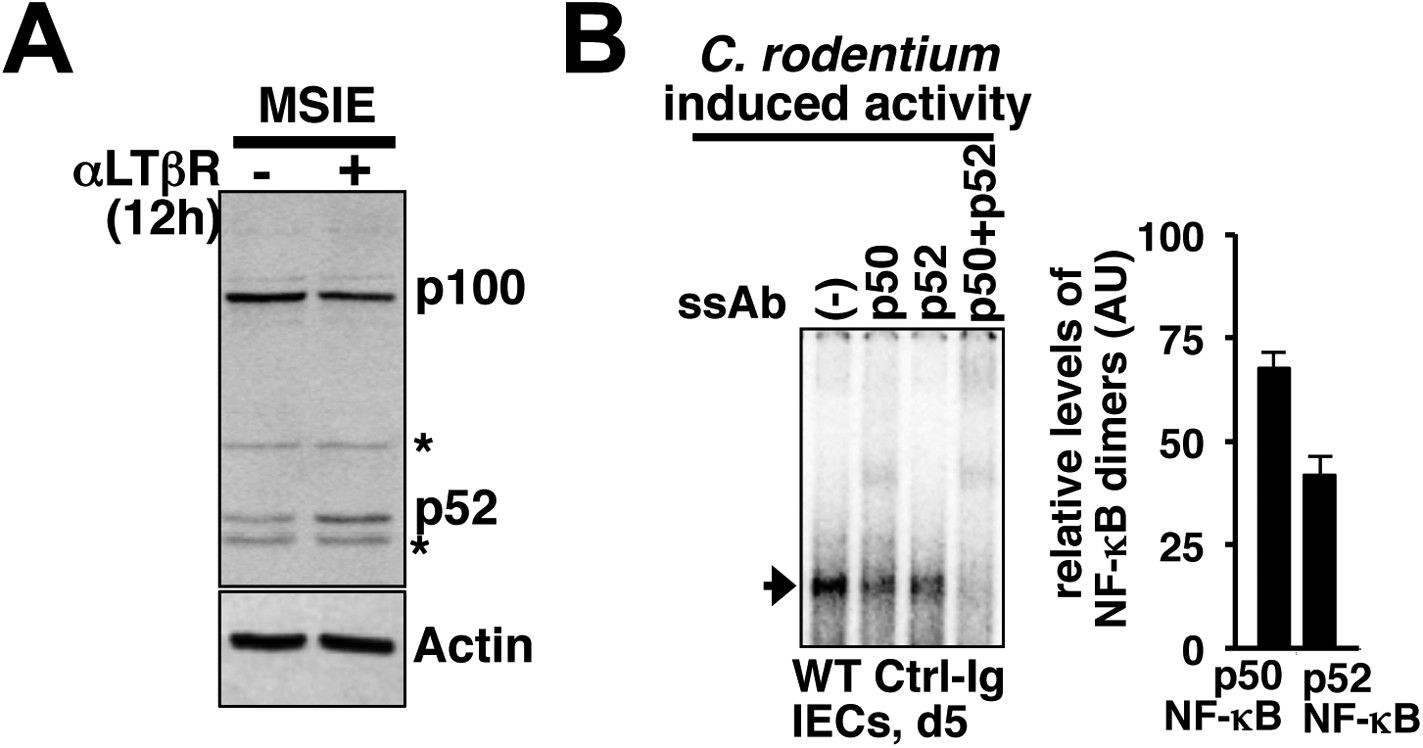
Control of epithelial RelA NF-κB activation through signaling crosstalk.
(A) Immunoblot showing functional non-canonical LTβR pathway generating p52 in MSIE colon epithelial cell line. ‘*’ indicates a non-specific protein band. (B) Supershift analyses to confirm the induction of both p50 as well as p52 containing RelA/NF-κB dimers in IECs derived from mice infected with C. rodentium. Right, quantified data representing the relative abundance of individual RelA/NF-κB complexes.
Figure 7 with 1 supplement
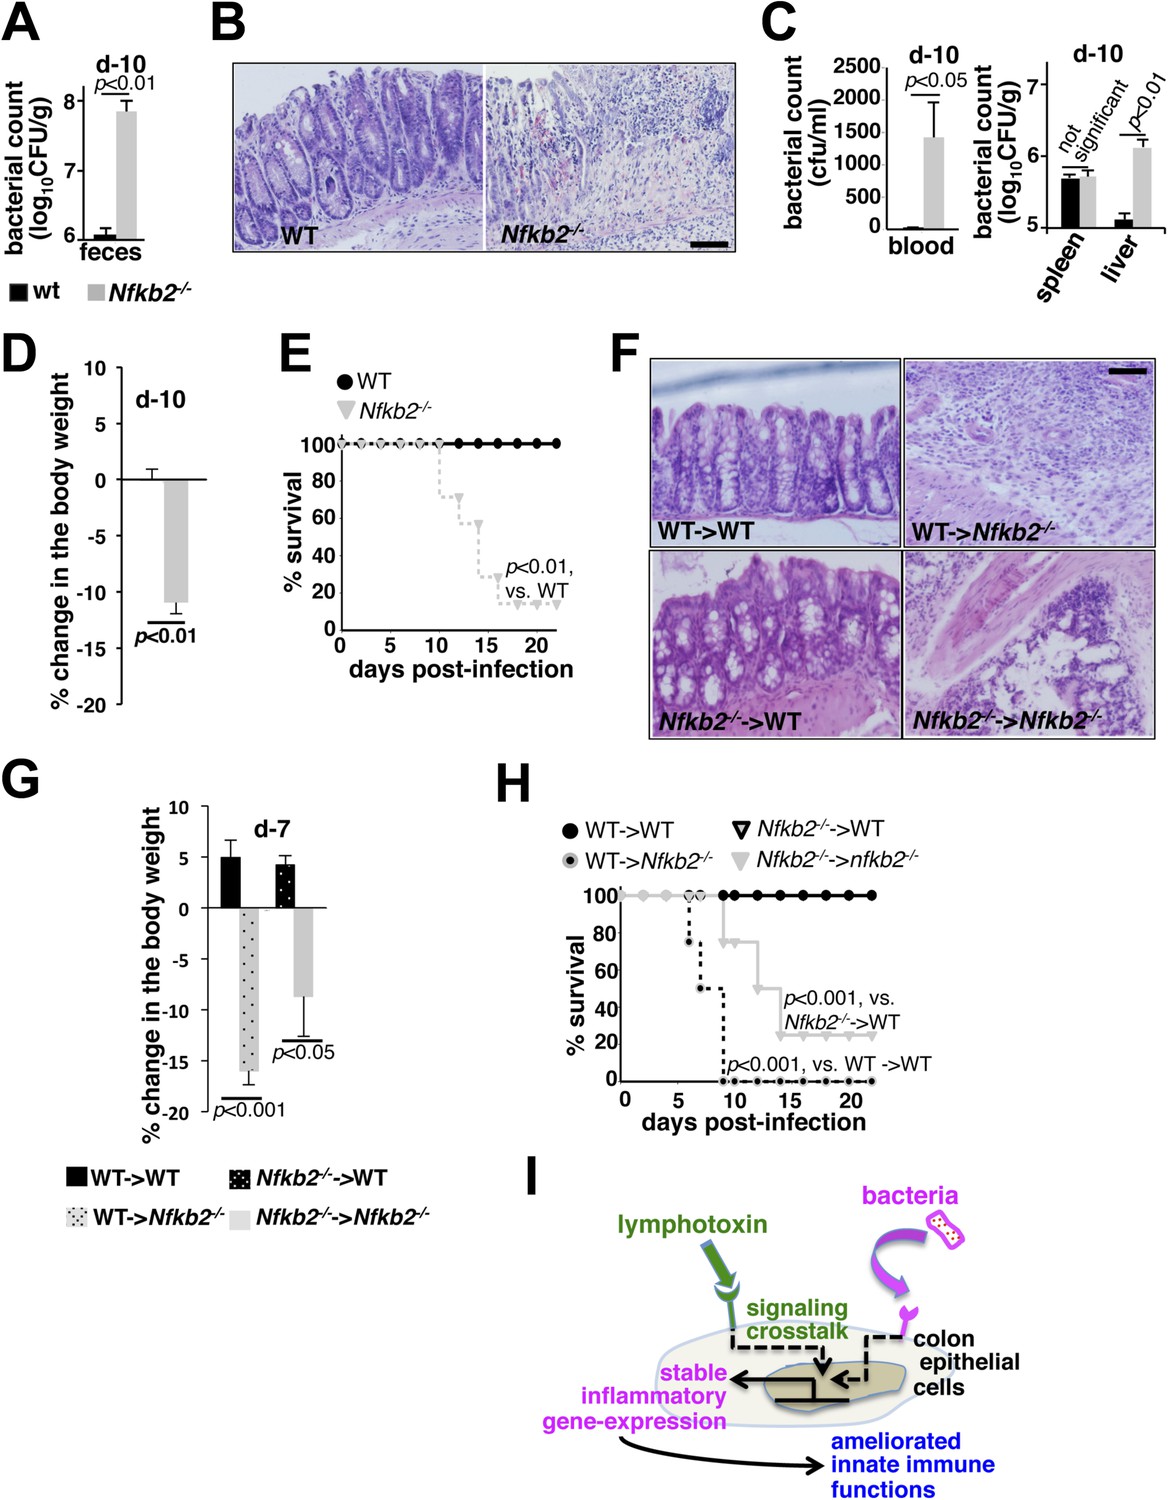
A protective role of pro-synergistic Nfkb2 in the non-hematopoietic compartment to Citrobacter infection.
(A) and (C) Bacterial titers in the fecal homogenate (A), blood (C, left panel) or spleen and liver homogenate (C, right) derived from WT and Nfkb2−/− mice (n = 4) at day10 post-infection. Data are expressed as mean ± SEM. The statistical significance was determined using two-tailed Student's t-test. (B) and (F) H&E staining of the representative colon sections derived from WT and Nfkb2−/− mice at day10 (n = 4, five fields/section) (B) or indicated bone marrow chimeras at day7 (n = 2, five fields/section) (F) after inoculation. The panel shows 20× magnification with scale bars representing 200 μm. (D) and (G) Average change in the body weight of WT and Nfkb2−/− mice (n = 7) (D) or indicated bone marrow chimeras (n = 4) (G) upon infection. Data are expressed as mean ± SEM. The statistical significance was determined using two-tailed Student's t-test. (E) and (H) Survival rates of WT and Nfkb2−/− mice (n = 7) (E) or indicated bone marrow chimeras (n = 4) (H) infected with C. rodentium. The statistical significance was determined using log rank (Mantel–Cox) test. (I) A model depicting the proposed regulatory role of crosstalk in sustaining colonic inflammatory immune responses.
Figure 7—figure supplement 1
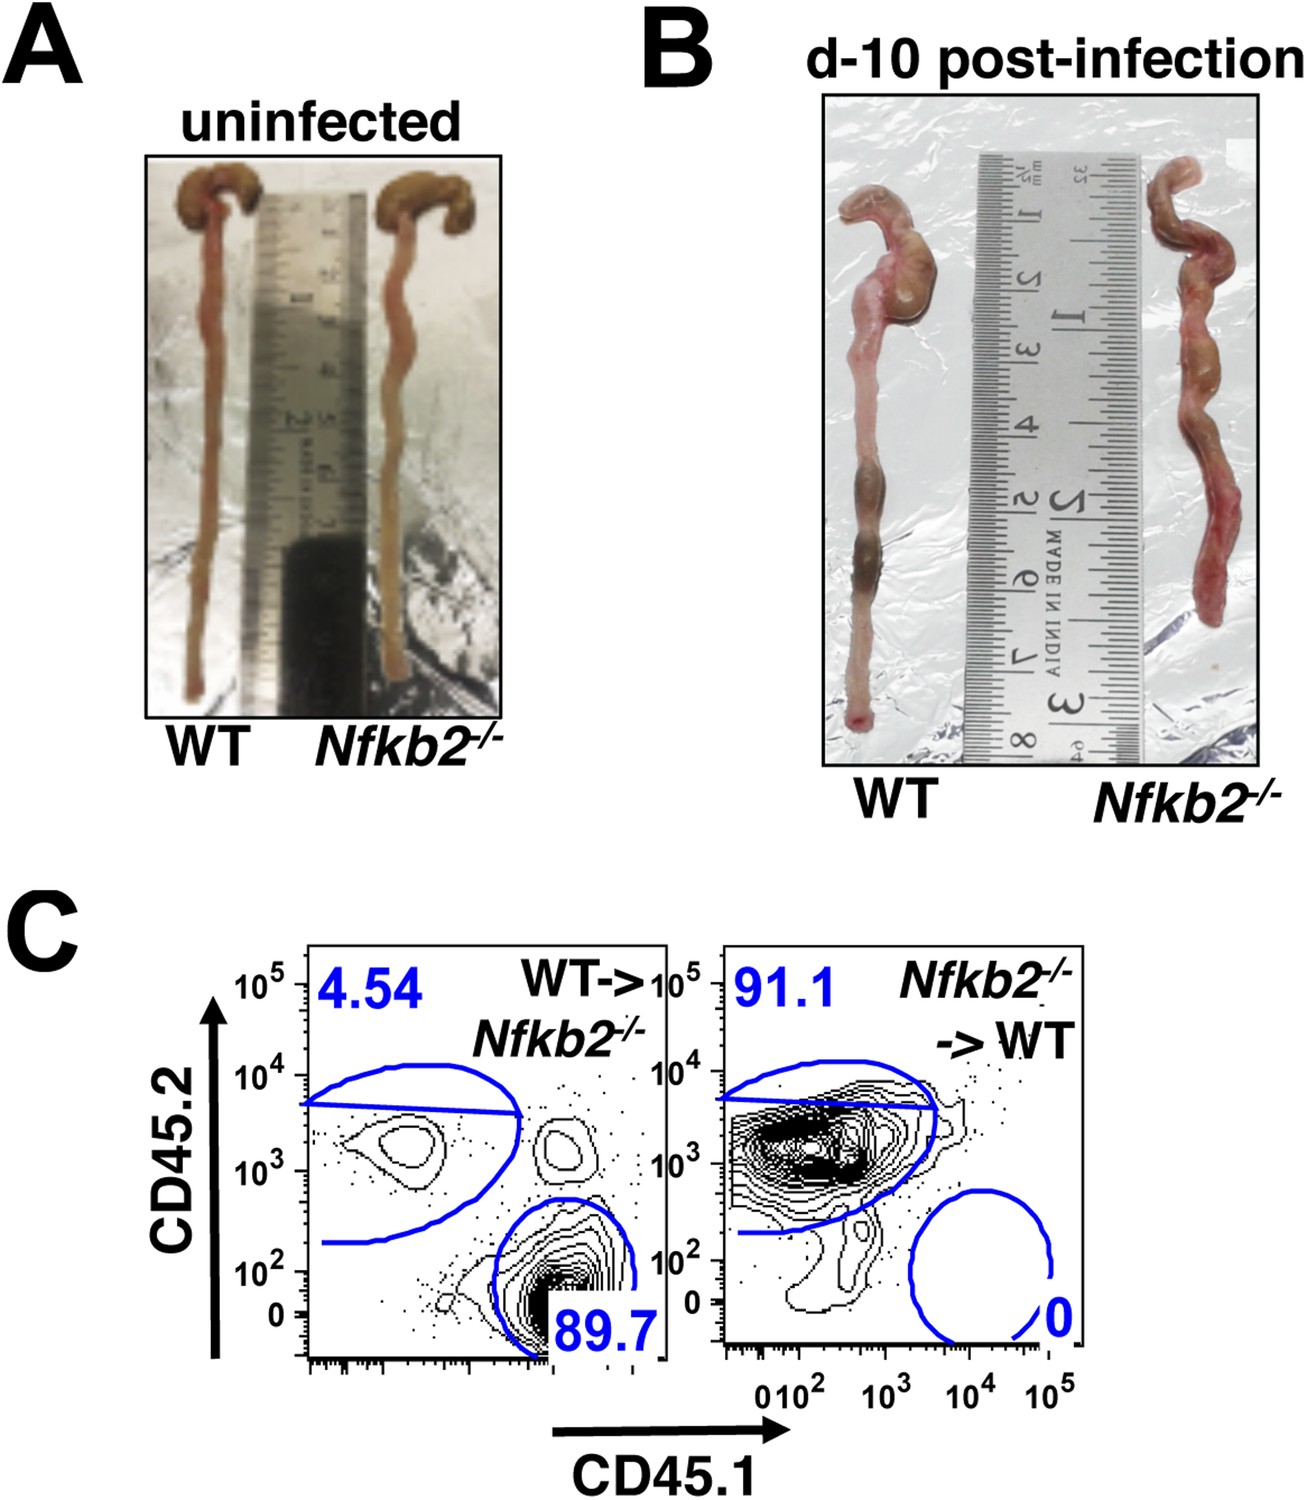
Nfkb2 controls gut immune response to Citrobacter infection.
(A and B) Comparison of colons from WT and Nfkb2−/− mice infected (B) with C. rodentium revealing shrinkage with signatures of hyperplasia in the absence of Nfkb2. Colon from uninfected mice had no discernible differences (A). (C) Representative FACS plots confirming repopulation of CD45.1 hematopoietic cells (∼90%) from WT donor into Nfkb2−/− mice with CD45.2 congenic background and vice versa after 5 weeks of bone marrow transplant.
Appendix figure 1
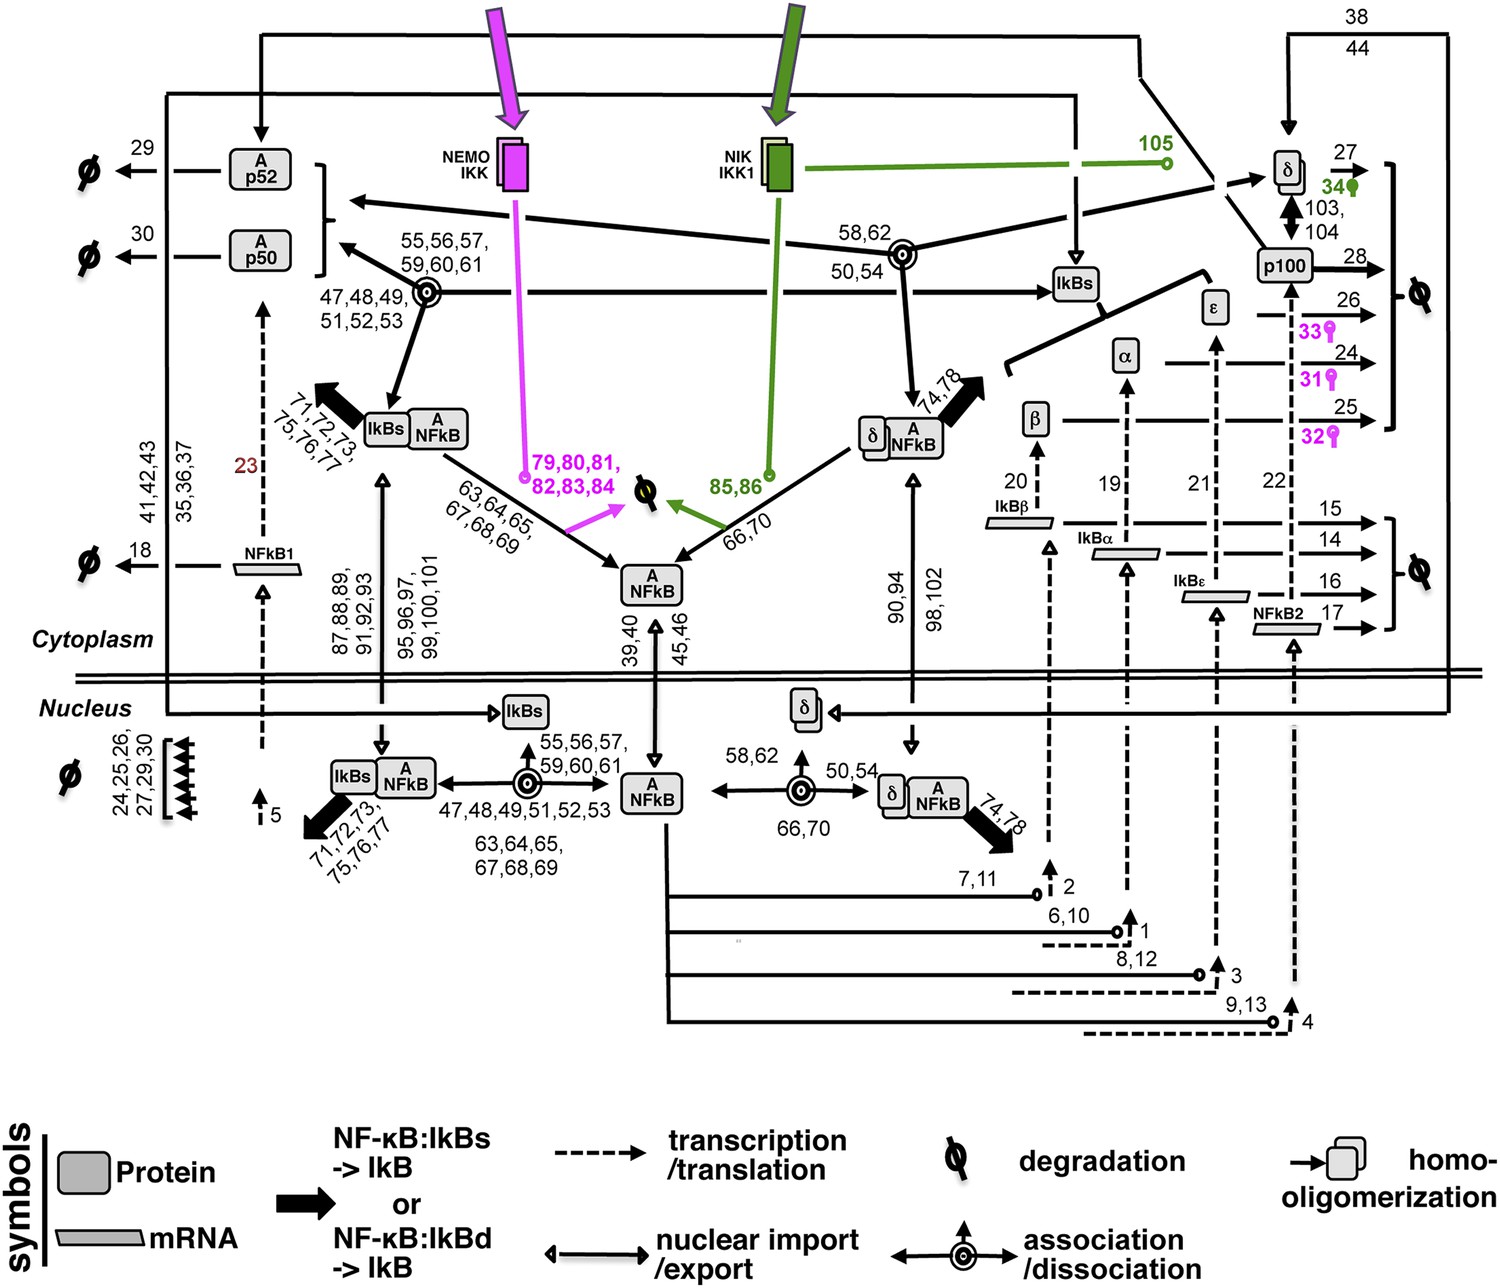
A detailed wiring diagram.
A wiring diagram depicting the biochemical connectivities between the molecular species included in the NF-κB Systems Model v1.0 to capture signal responsive activation of RelA:p50 (Ap50) and RelA:p52 (Ap52) dimers. The number adjacent to each reaction arrow is the corresponding parameter number, as described in the associated Supplementary files 1, 2. For the ease of presentation, three classical IκBs, IκBα, -β and -ε, were presented as IκBs on certain occasions. Similarly, RelA:p50 and RelA:p52 dimers were collectively depicted as A:NFκB.
Appendix figure 2
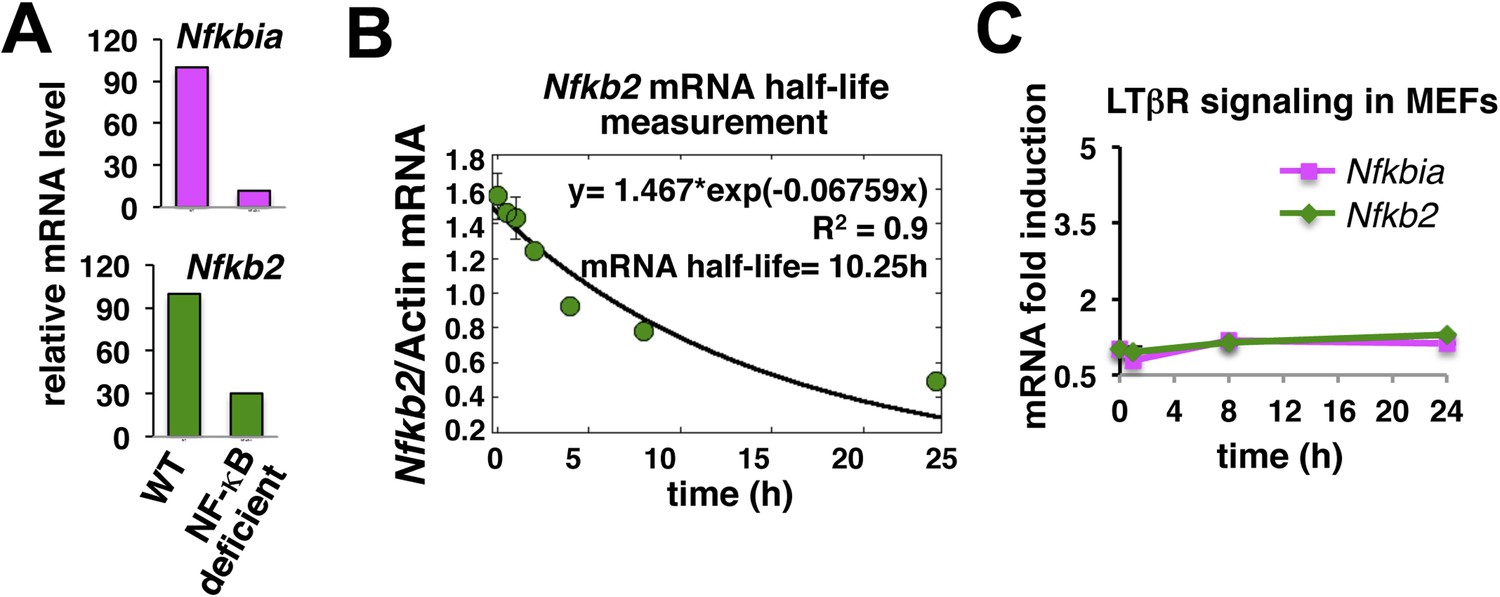
Nfkb2 mRNA analyses in unstimulated cells and during signaling.
(A) The NF-kB independent constitutive transcription of Nfkbia mRNA, which encodes IκBα, and Nfkb2 mRNA in the late passage MEFs was measured using quantitative RT-PCR. The mRNA levels of Nfkbia and Nfkb2 were reduced to 10% and 25% in NF-κB deficient (Rela−/−Rel−/−Relb−/−) cells as compared to WT cells. Transcript level of b-actin was used for normalization. (B) Quantitative RT-PCR to measure half-life of Nfkb2 mRNA. WT cells were treated with 5 mg/ml of transcription inhibitor actinomycin-D in a time-course, harvested, absolute mRNA levels of Nfkb2 and b-actin were determined and presented as Nfkb2 mRNA copy numbers per thousand copies of b-actin mRNA. The curve fitting was done assuming first-order decay of Nfkb2 mRNA to arrive onto a half-life of ∼10.5 hr. (C) LTβR induced expression of Nfkbia and Nfkb2 mRNAs was analyzed in a time course. Due to weak NF-κB activation, LTβR activation using 0.3 mg/ml agonist antibody only subtly altered the levels of these two NF-κB target genes in MEFs.
Appendix figure 3
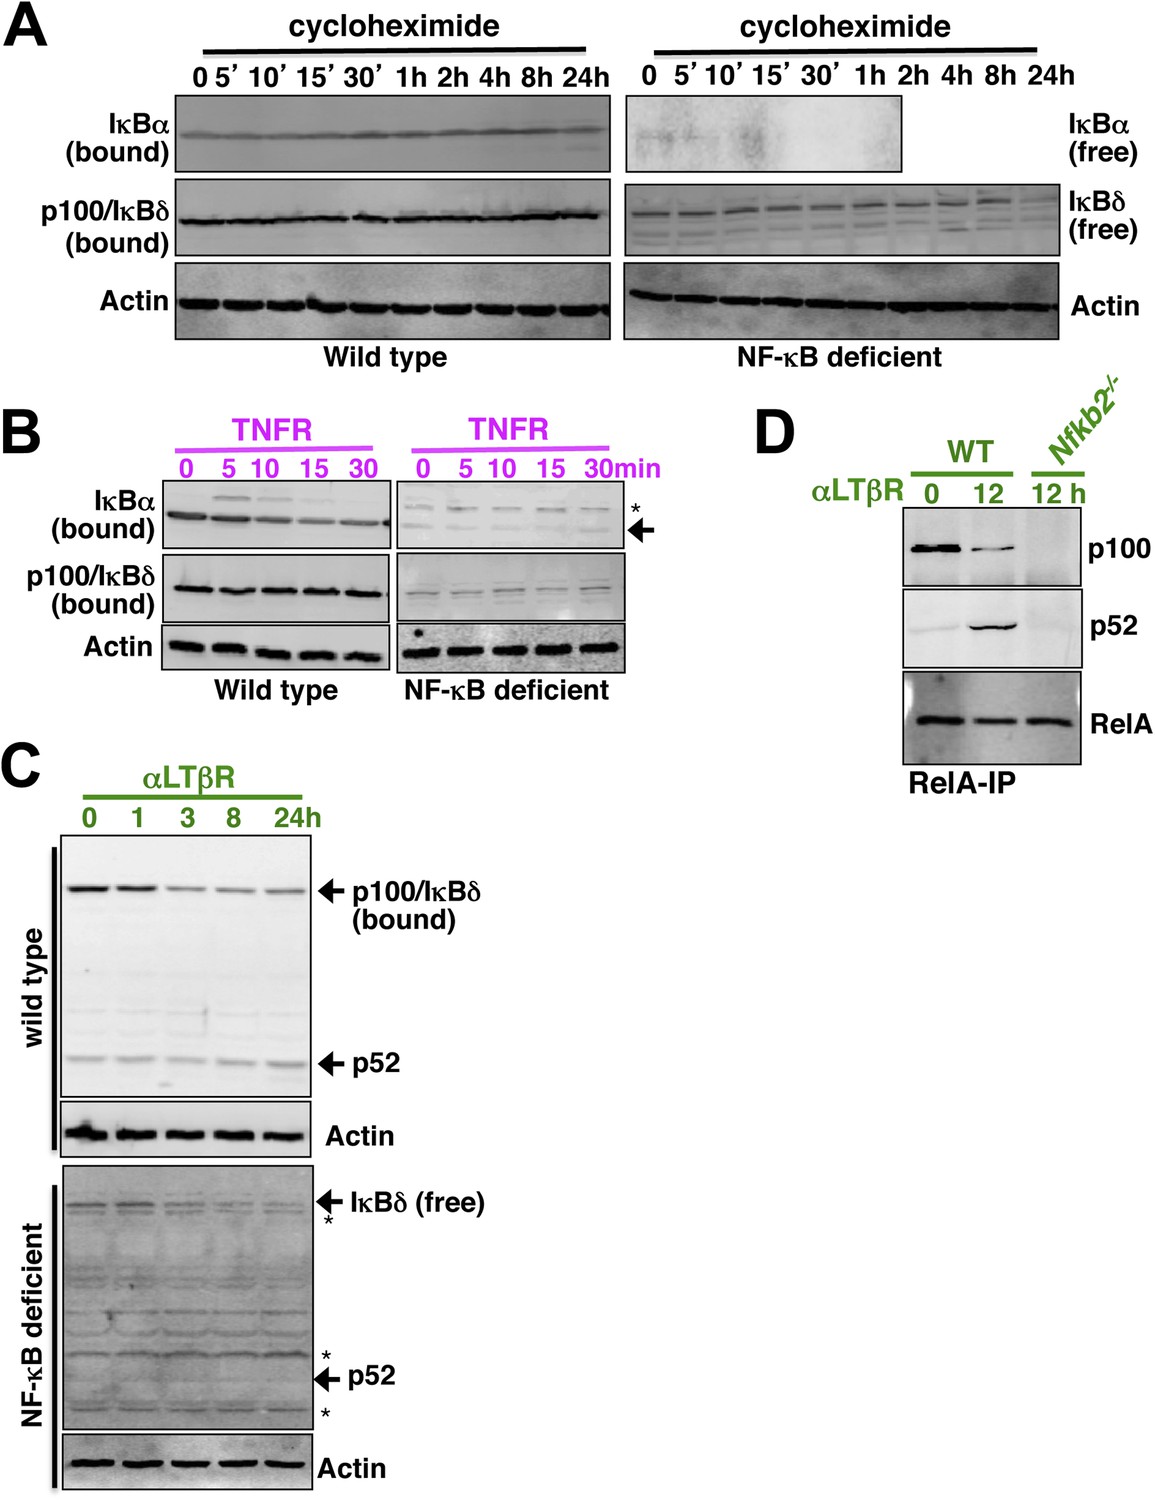
Analyzing p52 and p100 protein encoded by Nfkb2 in unstimulated cells and during signaling.
(A) Constitutive degradation of NF-κB bound (left panel) or free (right) IκBα (top panel) and p100/IκBδ (middle) were evaluated by immunoblotting respective extracts derived from WT (left) or NF-κB deficient (right) cells treated with 10 mg/ml of protein synthesis inhibitor cycloheximide. As compared to the stable NF-κB bound form, free IκBα degraded rapidly with a half-life ∼5 min. In contrast, both NF-κB bound p100/IκBδ present in WT cells (top) and free p100/IκBδ in NF-κB-deficient cells (bottom) were stable with a half-life > 12 hr. Actin (bottom panel) was used as loading control. The data represents two biological replicates. (B) Immunoblot revealing TNFR-induced IKK2 mediated degradation of NF-κB bound IκBα in WT (left panel, top) or free IκBα in NF-κB-deficient cells (right, top). Based on these data, IKK2-mediated degradation rates of the free and NF-κB bound classical IκBs were assigned comparable values in the model. Both in its bound (left, middle) or free (right, middle) form, p100/IκBδ were insensitive to IKK2 signals. (C) Immunoblot showing LTβR-induced NIK-IKK1 mediated degradation of NF-κB bound (top panel) and free (bottom) p100/IκBδ in WT and NF-κB deficient cells, respectively. Importantly, signal induced p52 accumulation was evident at 24 hr in WT, but not in NF-κB deficient, cells suggesting that newly generated p52 requires other NF-κB monomers for mutual stabilization. (D) Immunoblot of RelA co-immunoprecipitates revealing liberation of RelA from inhibitory p100/IκBδ (top panel) and generation of RelA:p52 complexes (middle) during LTβR signaling. Nfkb2−/− cell extracts were used as control (bottom).
Appendix figure 4
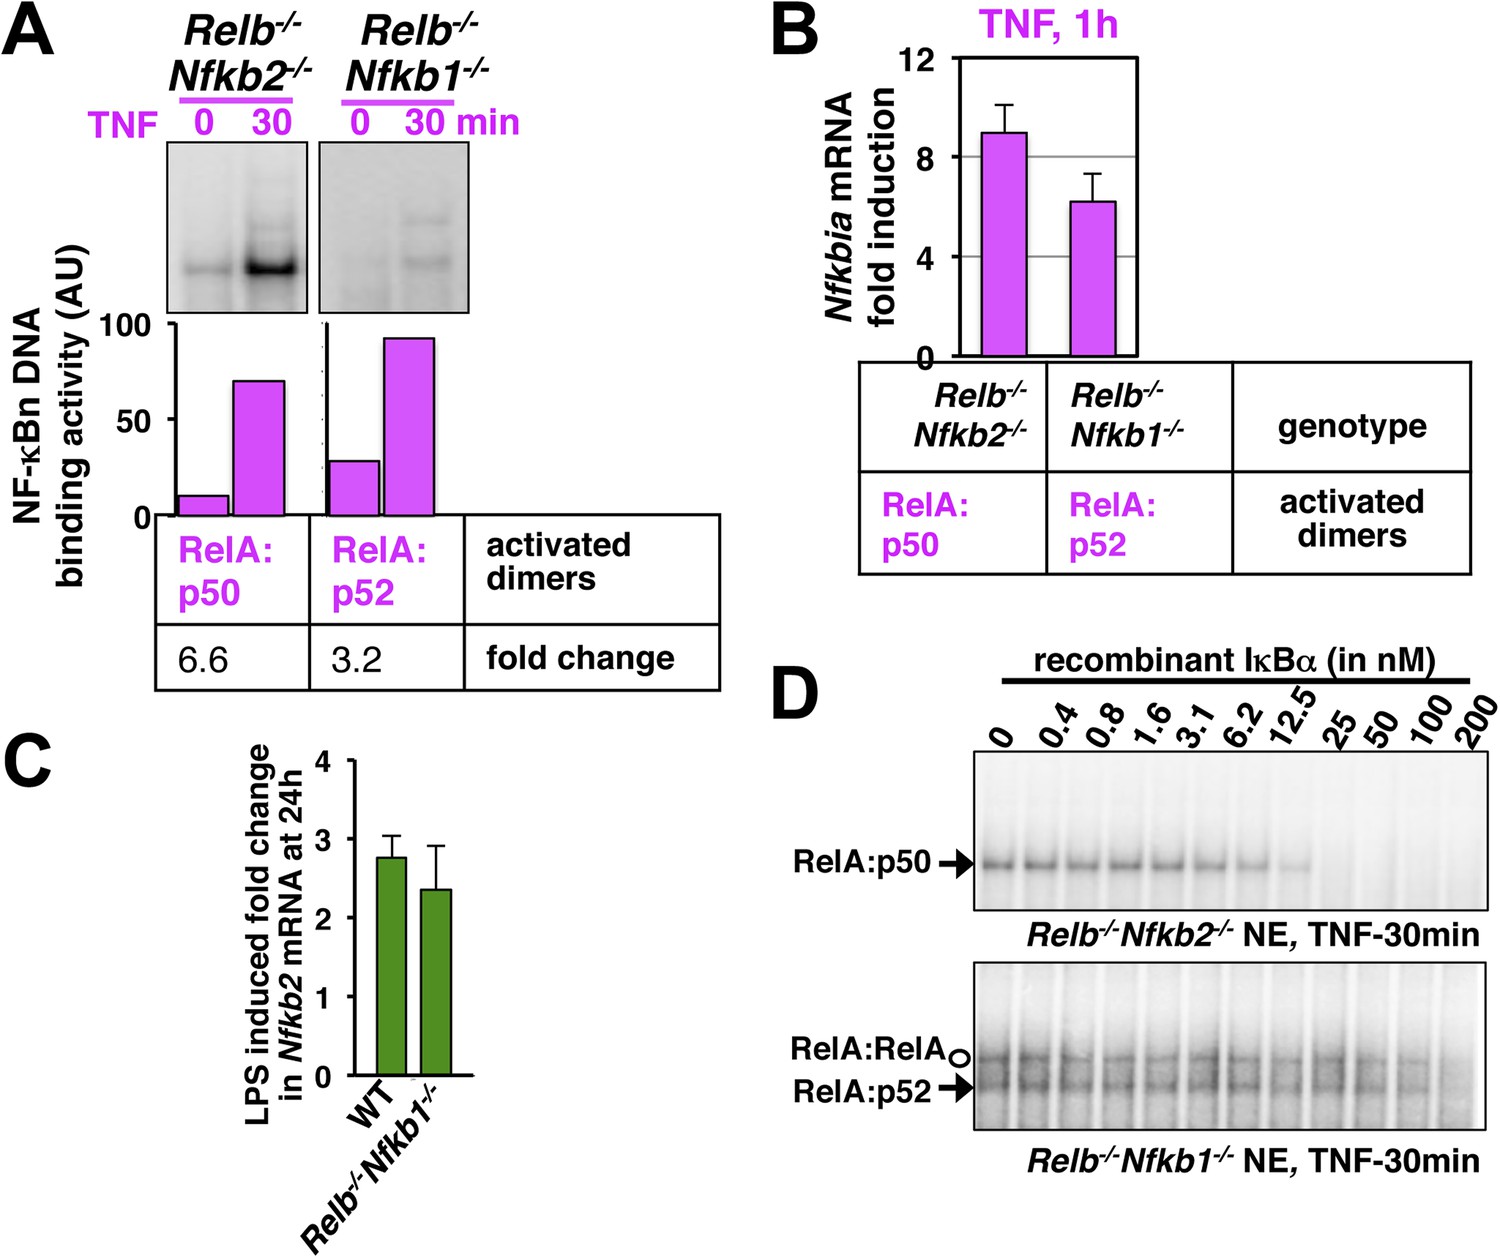
Comparing RelA:p50 and RelA:p52 NF-κB dimers.
(A) EMSA revealing TNF activation of RelA:p50 (left panel) or RelA:p52 (right) dimers in Relb−/−Nfkb2−/− or Relb−/−Nfkb1−/− cells, respectively. Quantification of the band intensities (bottom panel) revealed that basal and TNF induced RelA:p52 activities in Relb−/−Nfkb1−/− are ∼10% of the corresponding RelA:p50 activities in Relb−/−Nfkb2−/−. These values were used as constrains to describe constitutive RelA:p52 dimer generation in WT cells in the model. Both RelA:p50 and RelA:p52 dimers were induced within 30 min of TNF treatment indicating that NEMO-IKK mediated degradation rates of IκBs bound these RelA heterodimers are comparable. Of note, TNF induced fold changes in the activity of the respective RelA dimers were comparable in Relb−/−Nfkb2−/− and Relb−/−Nfkb1−/− cells. The result represents three biological replicates. (B) NF-κB responsive expression of Nfkbia mRNA, encoding IκBα, induced by either RelA:p50 or RelA:p52 dimers in Relb−/−Nfkb2−/− or Relb−/−Nfkb1−/− cells upon TNF treatment, respectively. Comparable mRNA fold induction along with our EMSA data suggested similar DNA binding and transcriptional proficiency of RelA:p50 and RelA:p52. Data are expressed as mean of 3 quantified biological replicates ± SEM. (C) Gene-expression analyses revealing comparable induction of Nfkb2 mRNA upon LPS treatment in WT MEFs, those mostly activate RelA:p50 dimer and Relb−/−Nfkb1−/− MEFs, which exclusively activates RelA:p52 dimer. Our results confirm that RelA:p52 dimer is capable of inducing the expressions of Nfkb2 mRNA as effectively as RelA:p50 dimers. (D) Biochemical analyses indicating weaker IκBα binding to the RelA:p52 dimer. Briefly, nuclear extracts derived from Relb−/−Nfkb2−/− or Relb−/−Nfkb1−/− cells treated with TNF was used as a source of free RelA:p50 or RelA:p52, respectively, and normalized to obtain comparable DNA binding activities. Nuclear RelA dimers were incubated with a gradient of recombinant IκBα for 30 min to facilitate the formation of IκB:NF-κB complex, which does not bind DNA in EMSA. The abundance of unbound NF-κB dimers was then scored using EMSA. Incubation with 25 nM IκBα was sufficient to completely inhibit RelA:p50 DNA binding. While, more than 200 nM of IκBα was required to inhibit RelA:p52 and RelA:RelA DNA binding, owing to weaker IκBα binding by these dimers. The data represents three experimental replicates.
Appendix figure 5
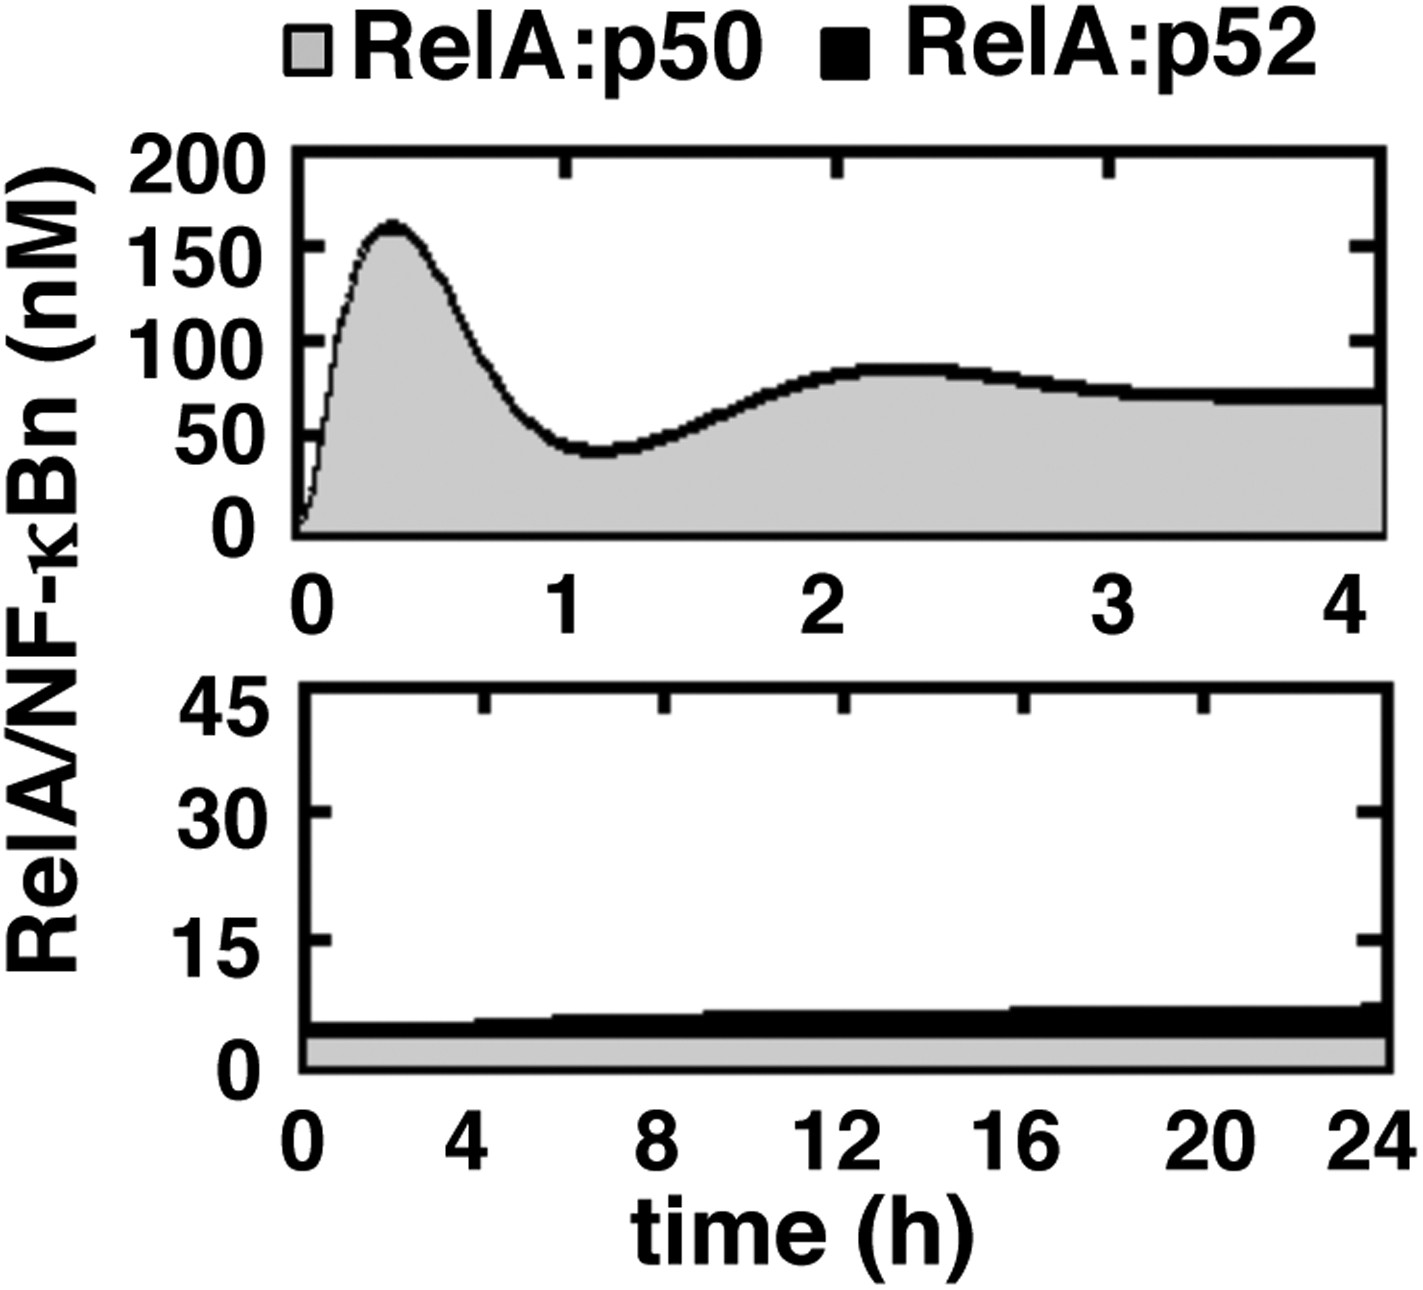
Simulating RelA:p50 and RelA:p52 activation in response to canonical and non-canonical signals.
Computational simulations of nuclear RelA:p50 (grey) and RelA:p52 (black) induction by TNFR-induced IKK2 (top) or LTβR-induced NIK-IKK1 signals (bottom). Our computational data effectively recapitulate relative abundance of these two RelA dimers during canonical and non-canonical signaling, as experimentally observed and demonstrated in Figure 1—figure supplement 1.
Author response image 1
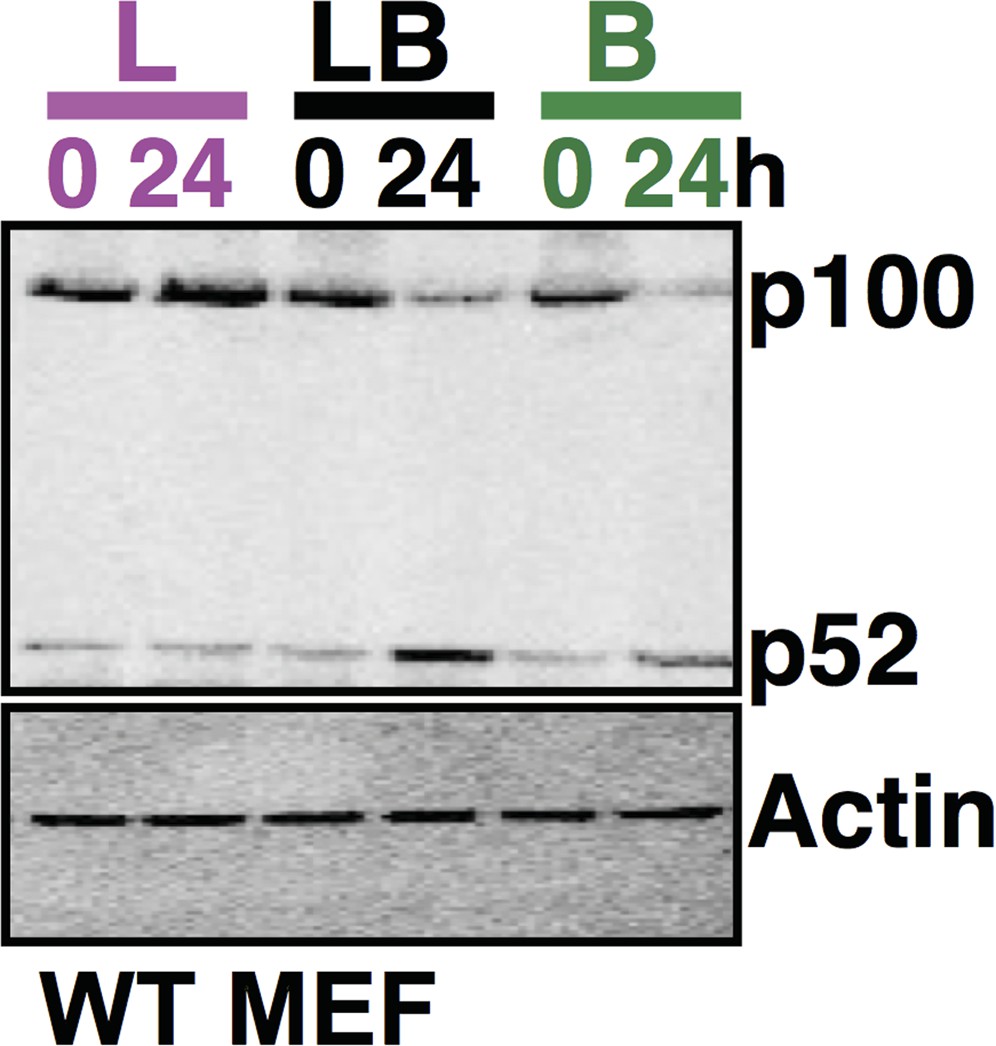
Comparing p100 and p52 levels in the same gel using immunoblot analysis. The data, representative of three biological replicates, consistently reflects augmented accumulation of p52 protein in the costimulation regime as compared to cell treatment with LPS or αLTβR alone for 24h.
Author response image 2
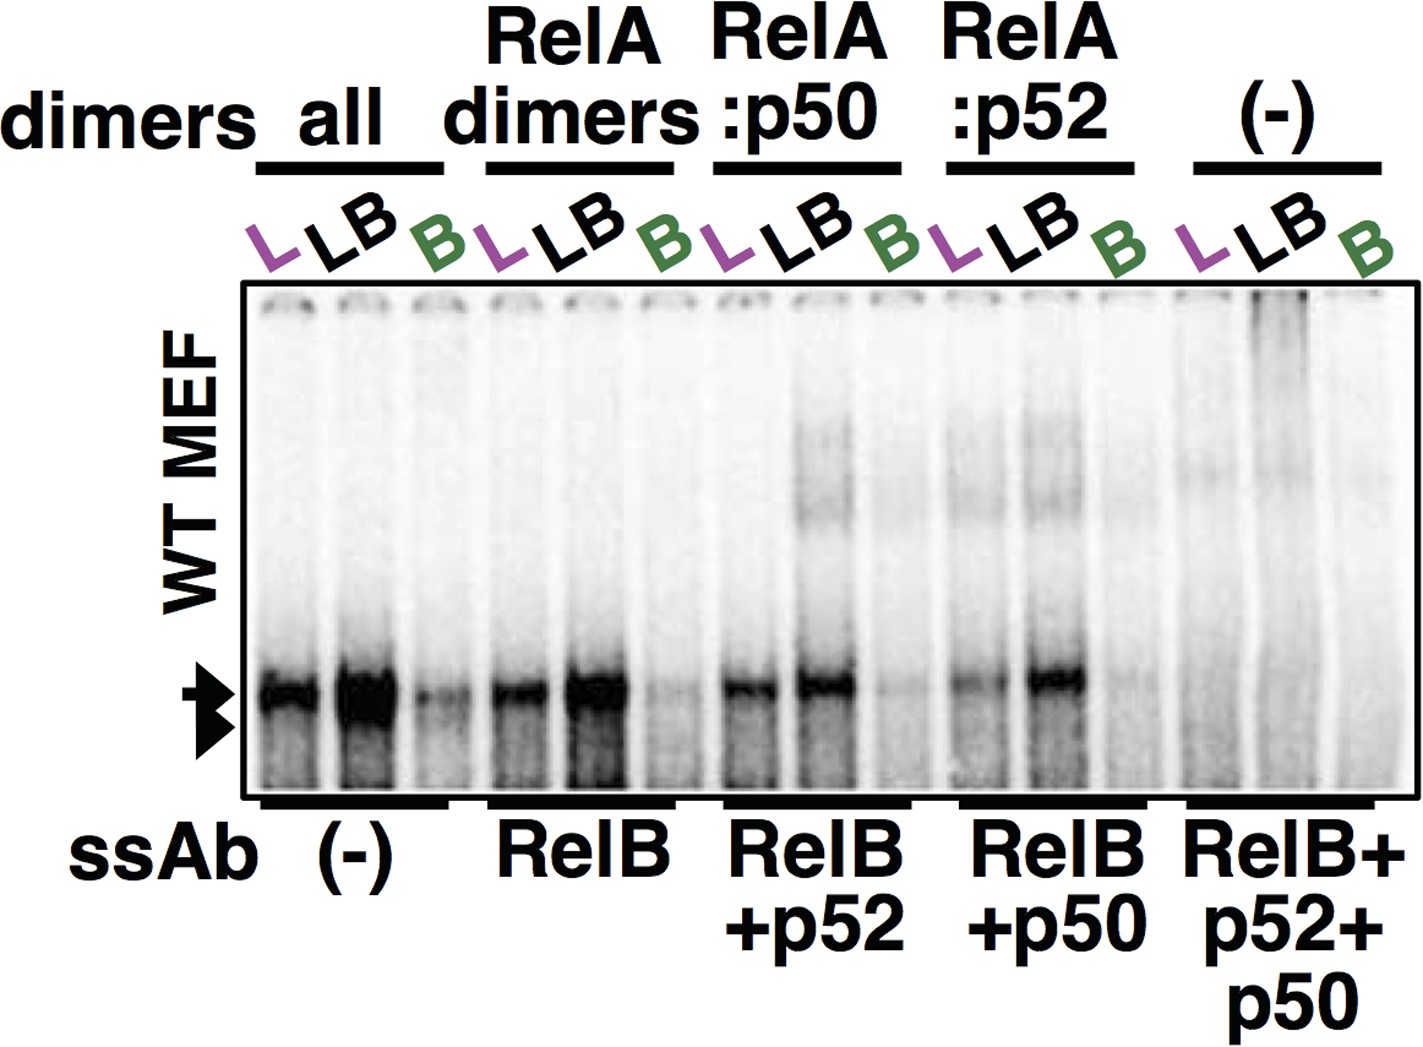
Using both p50 and p52 antibodies along with RelB antibody, complete ablation of RelA NF-κB DNA binding activity was achieved in our supershift analyses. The last three lane was used as a panel within Figure 4E.
Additional files
-
Supplementary file 1
List of biochemical species and their initial concentrations in the model.
- https://doi.org/10.7554/eLife.05648.020
-
Supplementary file 2
List of biochemical reactions and rate constants in the model.
- https://doi.org/10.7554/eLife.05648.021
-
Supplementary file 3
List of newly described biochemical parameters in the Systems Model v1.0.
- https://doi.org/10.7554/eLife.05648.022
Download links
A two-part list of links to download the article, or parts of the article, in various formats.
Downloads (link to download the article as PDF)
Open citations (links to open the citations from this article in various online reference manager services)
Cite this article (links to download the citations from this article in formats compatible with various reference manager tools)
Stimulus-selective crosstalk via the NF-κB signaling system reinforces innate immune response to alleviate gut infection
eLife 4:e05648.
https://doi.org/10.7554/eLife.05648


