Auxin regulates SNARE-dependent vacuolar morphology restricting cell size
- University of Natural Resources and Life Sciences, Austria
Figures
Figure 1 with 2 supplements
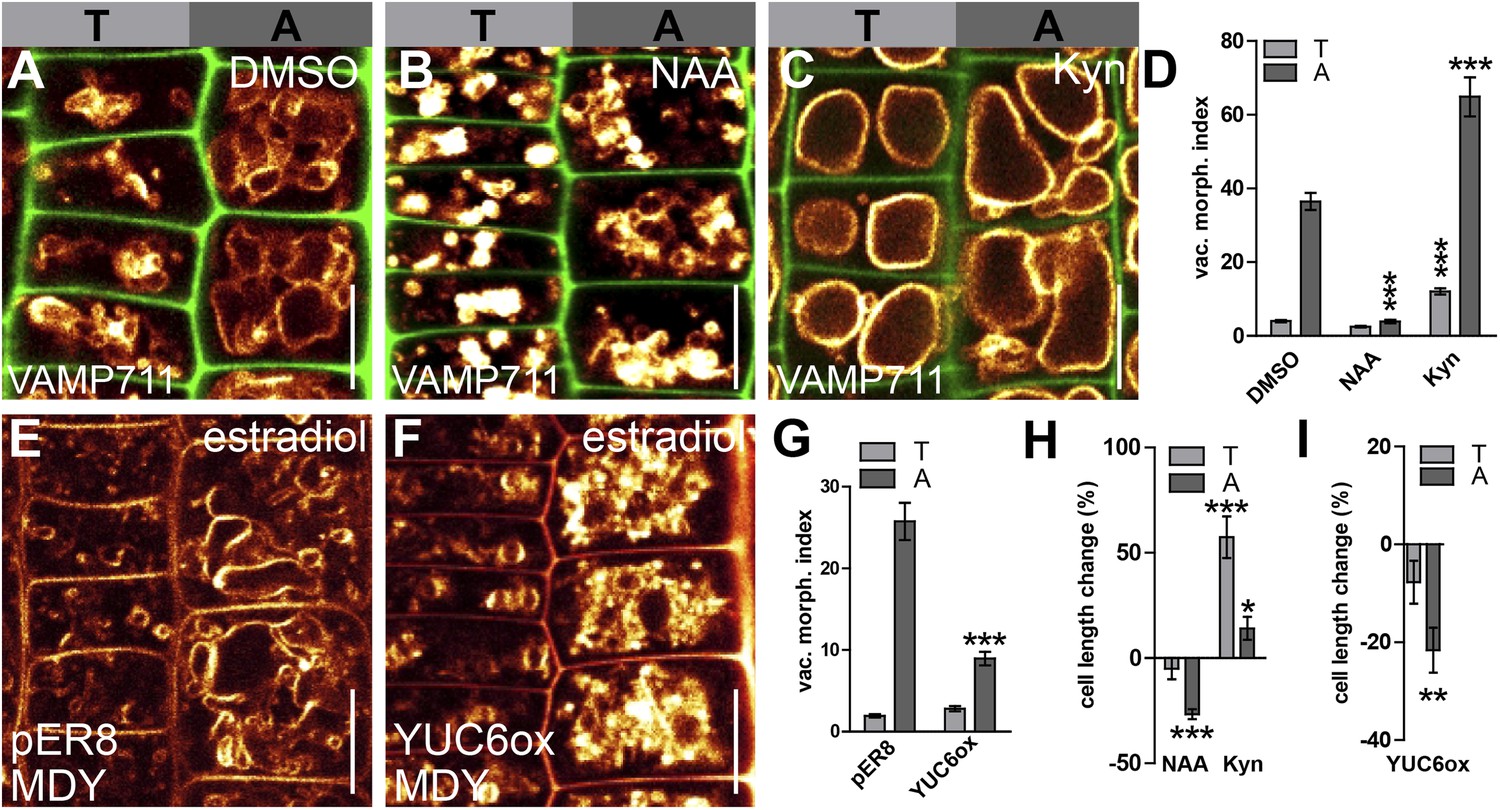
Auxin triggered changes in vacuolar morphology correlate with its effect on cell size.
(A–C) Seedlings treated with the solvent DMSO (A), auxin (B) (NAA 250 nM; 20 hr) or auxin biosynthesis inhibitor kynurenin (C) (Kyn) (2 µM; 20 hr). Tonoplast localised VAMP711-YFP (orange) as vacuolar marker and propidium iodide stain (green) for decorating the cell wall were used for confocal imaging of tricho-/atrichoblast (T/A) cells (A–C). (D) Vacuolar morphology (vac. morph. [µm2]) index of tricho/atrichoblast cells after pharmacological manipulation of auxin levels. (E–G) Vacuolar morphology of estradiol (10 µM; 20 hr) induced YUCCA6 overexpression (YUC6ox) (F) and the respective empty vector control (pER8) (E). Tonoplast membrane stain MDY-64 (orange) was used for confocal imaging. (G) Vacuolar morphology (vac. morph. [µm2]) index after genetic manipulation of auxin levels. (H and I) Quantification of cell length change in tricho-/atrichoblast (T/A) cells following pharmacological (H) or genetic manipulation of auxin levels (I). For statistical analysis, treated cells were compared to untreated tricho-/atrichoblast. n = 40 cells in 10 individual seedlings for cell length measurement and n = 40 cells in eight individual seedlings for vacuolar morphology index quantification. Error bars represent s.e.m. Student's t-test p-values: *p < 0.05, **p < 0.01, ***p < 0.001. Scale bar: 15 µm (A–C, F, G).
Figure 1—figure supplement 1

Quantification of epidermal cell length and vacuolar morphology.
(A) From the onset of pronounced elongation (atrichoblast cell which is 2.5 times longer than wide), eight atrichoblast cells (depicted in yellow numbers) were counted towards the root tip. At this position, the length of four tricho-/atrichoblast cells (depicted in white numbers) were measured and averaged. Propidium-iodide-stained cell walls (orange). (B) The same positional information was used for quantifying the vacuolar morphology. Longest and widest distance was measured in the largest depicted vacuolar structure in four tricho-/atrichoblast cells per root. Vacuolar morphology was depicted by multiplying the distances (C) or by dividing the cell length by width (D). In this manuscript we mainly used (C) as vacuolar morphology index (vac. morph. index). (E) Three dimensional representation (orthogonal sectioning) of VAMP711-YFP expressing root epidermis; cross-hair depicts the region of optical sections used for all figures. T refers to trichoblast and A to atrichoblast cell file. Scale bar in (A) 50 µm; in (B) 10 µm; in (E) 20 µm.
Figure 1—figure supplement 2
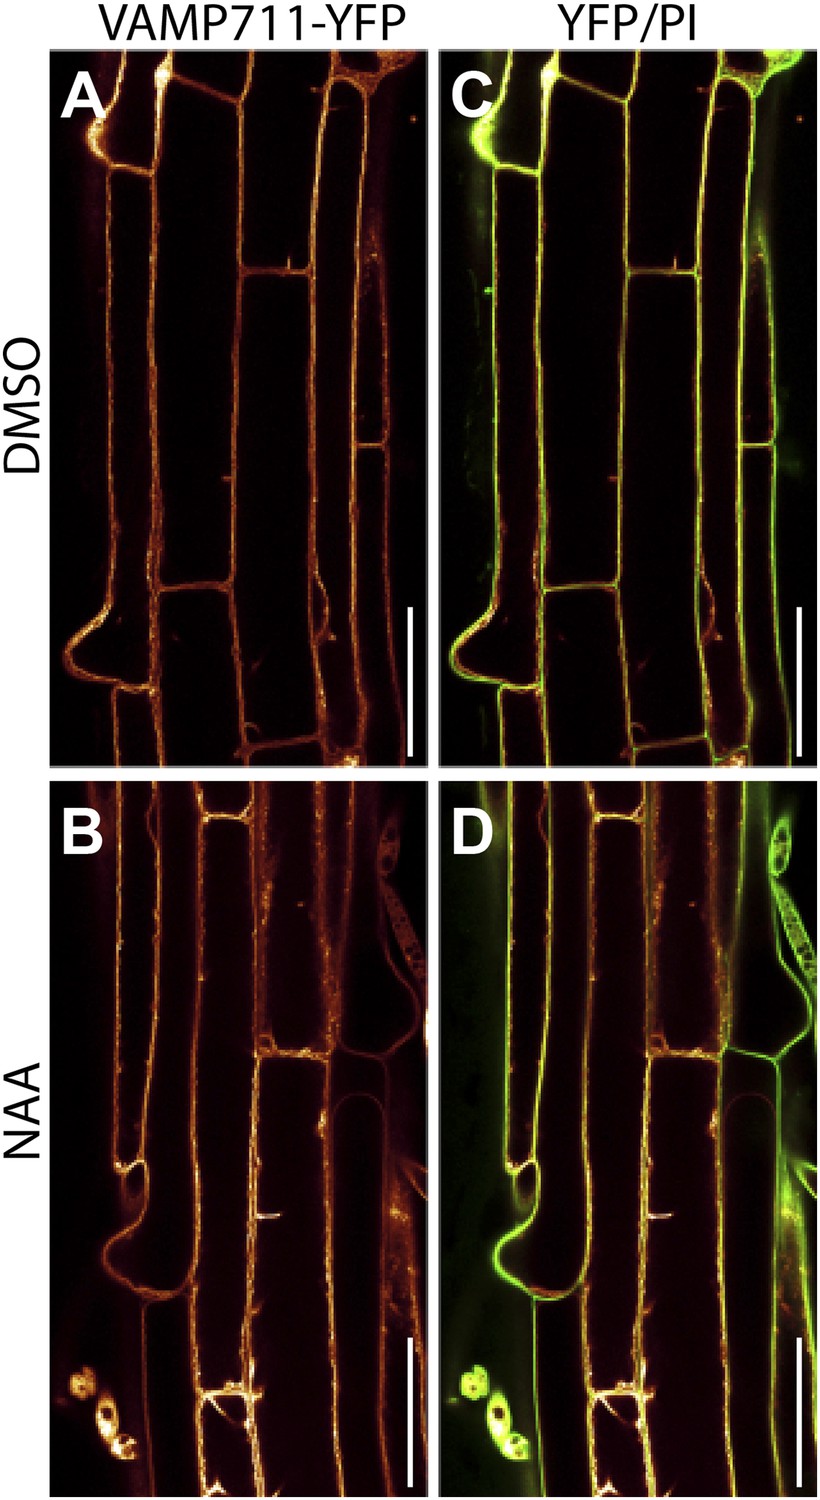
Auxin does not affect vacuolar morphology of epidermal root cells in the differentiation zone.
DMSO (A and C) or NAA (B and D) (250 nM, 20 hr) -treated pUBQ10::VAMP711-YFP (orange) expressing seedlings imaged at the onset of root hair bulging (differentiation zone). Propidium-iodide (PI)-stained cell walls (green). (C and D) Overlay of YFP and PI. Scale bar: 50 µm.
Figure 2 with 1 supplement
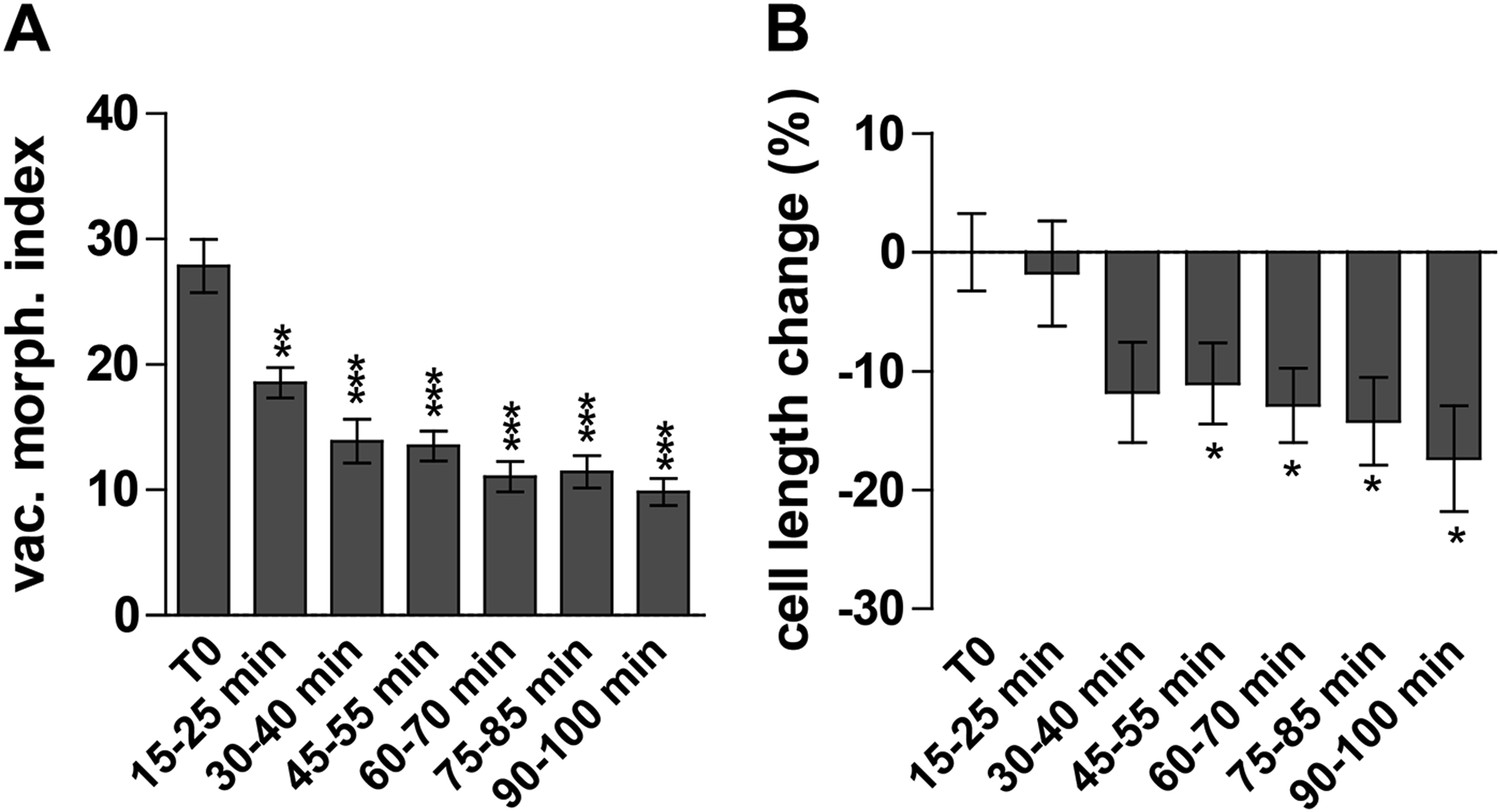
Auxin effect on vacuoles precedes cell size regulation.
(A and B) Time course imaging of 250 nM NAA treated seedlings were performed every 15 min. Image acquisition took 10 min per time point. Graphs depict vacuolar morphology index (A) and cell length of atrichoblasts (B). Untreated seedlings were imaged before and after recording the auxin treated samples and resulting average was defined as T0. Error bars represent s.e.m. For statistical analysis DMSO and NAA treatments were compared. n = 50 cells in 10 individual seedlings for each time point. Student's t-test p-values: *p < 0.05 **p < 0.01, ***p < 0.001.
Figure 2—figure supplement 1
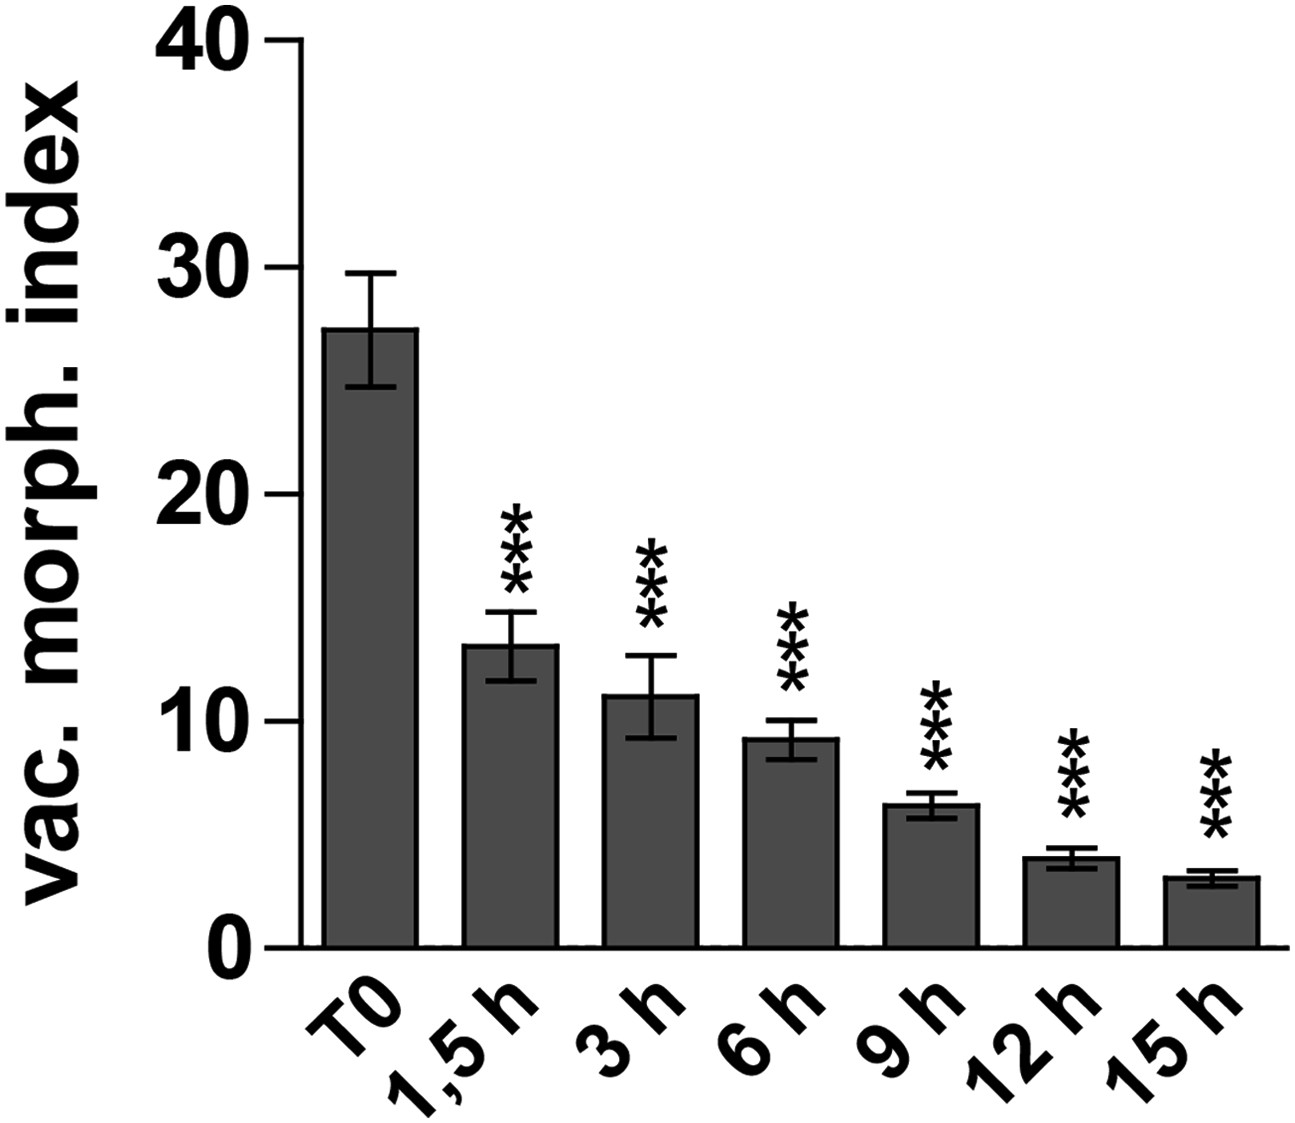
Auxin effect on vacuolar morphology increases in time.
Auxin (250 nM NAA) induced changes in vacuolar morphology over time. Error bars represent s.e.m. For statistical analysis DMSO and NAA treatments were compared. n = 50 cells in 10 individual seedlings for each time point. Student´s t-test p-values: ***p < 0.001.
Figure 3
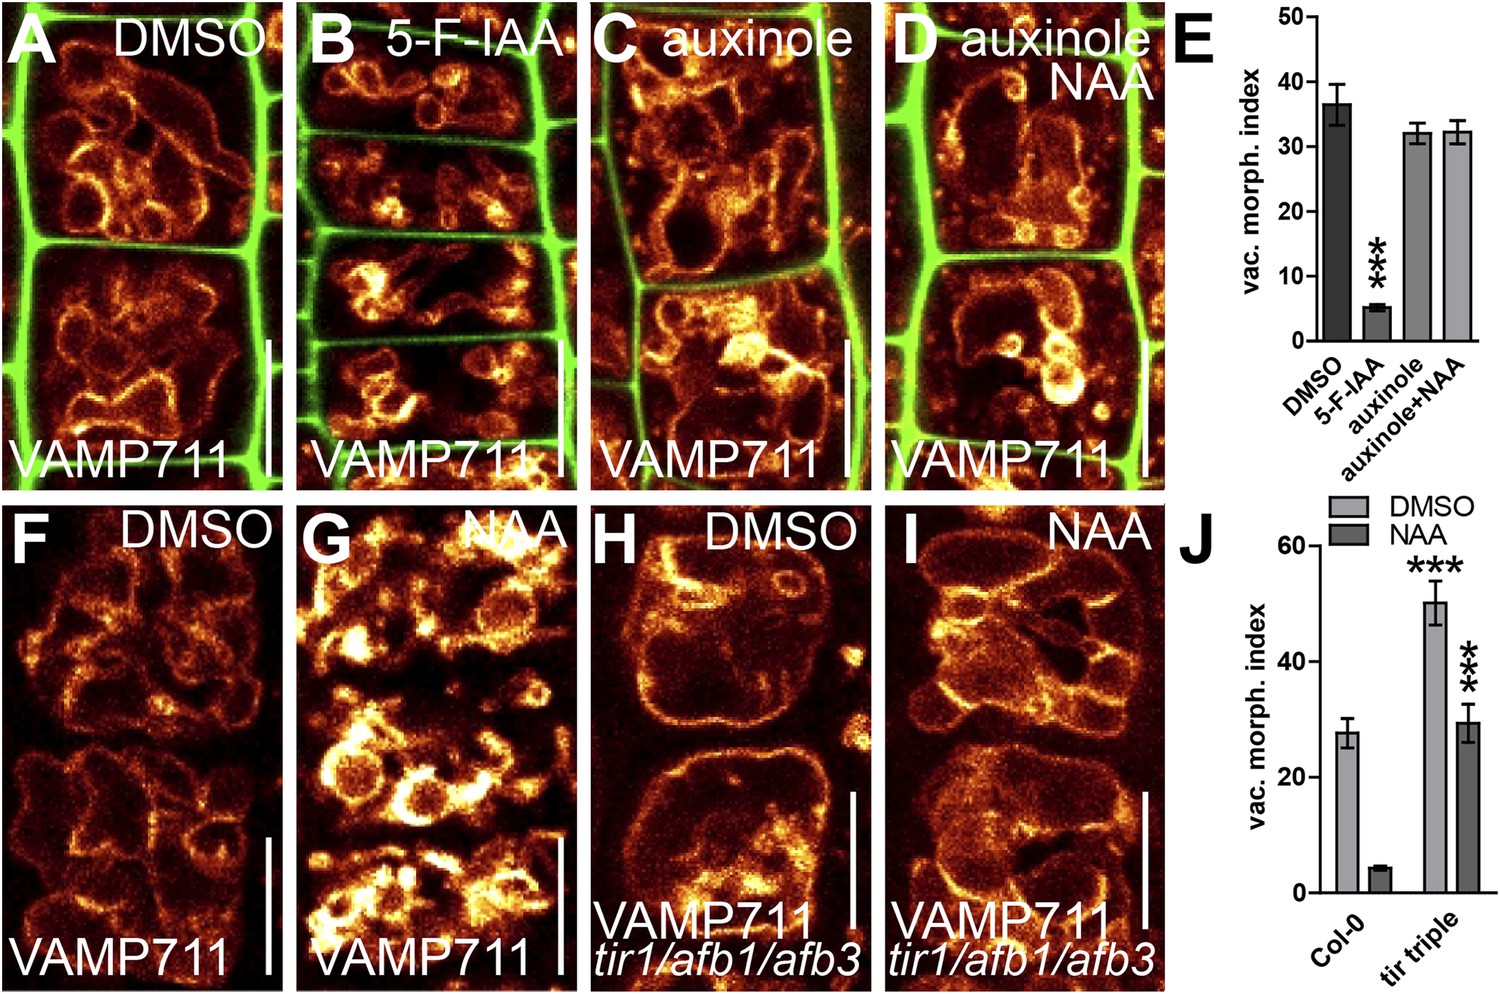
Auxin affects vacuolar morphology in a TIR1/AFBs-dependent manner.
(A–D) Seedlings treated with DMSO (A), auxin analogue 5-F-IAA (B) (250 nM; 20 hr), TIR1/AFBs antagonist auxinole (C) (20 µM; 20 hr) and concomitant with NAA and auxinole (D). Tonoplast localised VAMP711-YFP (orange) as vacuolar marker and propidium iodide (green) for decorating the cell wall was used for confocal imaging (A–D). (E) Vacuolar morphology (vac. morph. [µm2]) index of treatments used in A–D. For statistical analysis DMSO and treatments were compared. (F–I) DMSO (F) or NAA (G) (250 nM; 20 hr) treated control seedlings compared to tir/afb1/afb3 triple mutants treated with DMSO (H) or NAA (I) (250 nM; 20 hr). Tonoplast localised VAMP711-RFP (orange) as vacuolar marker was used for confocal imaging in F–I. (J) Vacuolar morphology (vac. morph. [µm2]) index of treatments shown in F–I. For statistical analysis either DMSO or NAA treatments were compared between control and indicated mutant. n= 40 cells in eight individual seedlings. Error bars represent s.e.m. Student's t-test P-values: ***p < 0.001. Scale bar: 15 µm.
Figure 4 with 3 supplements
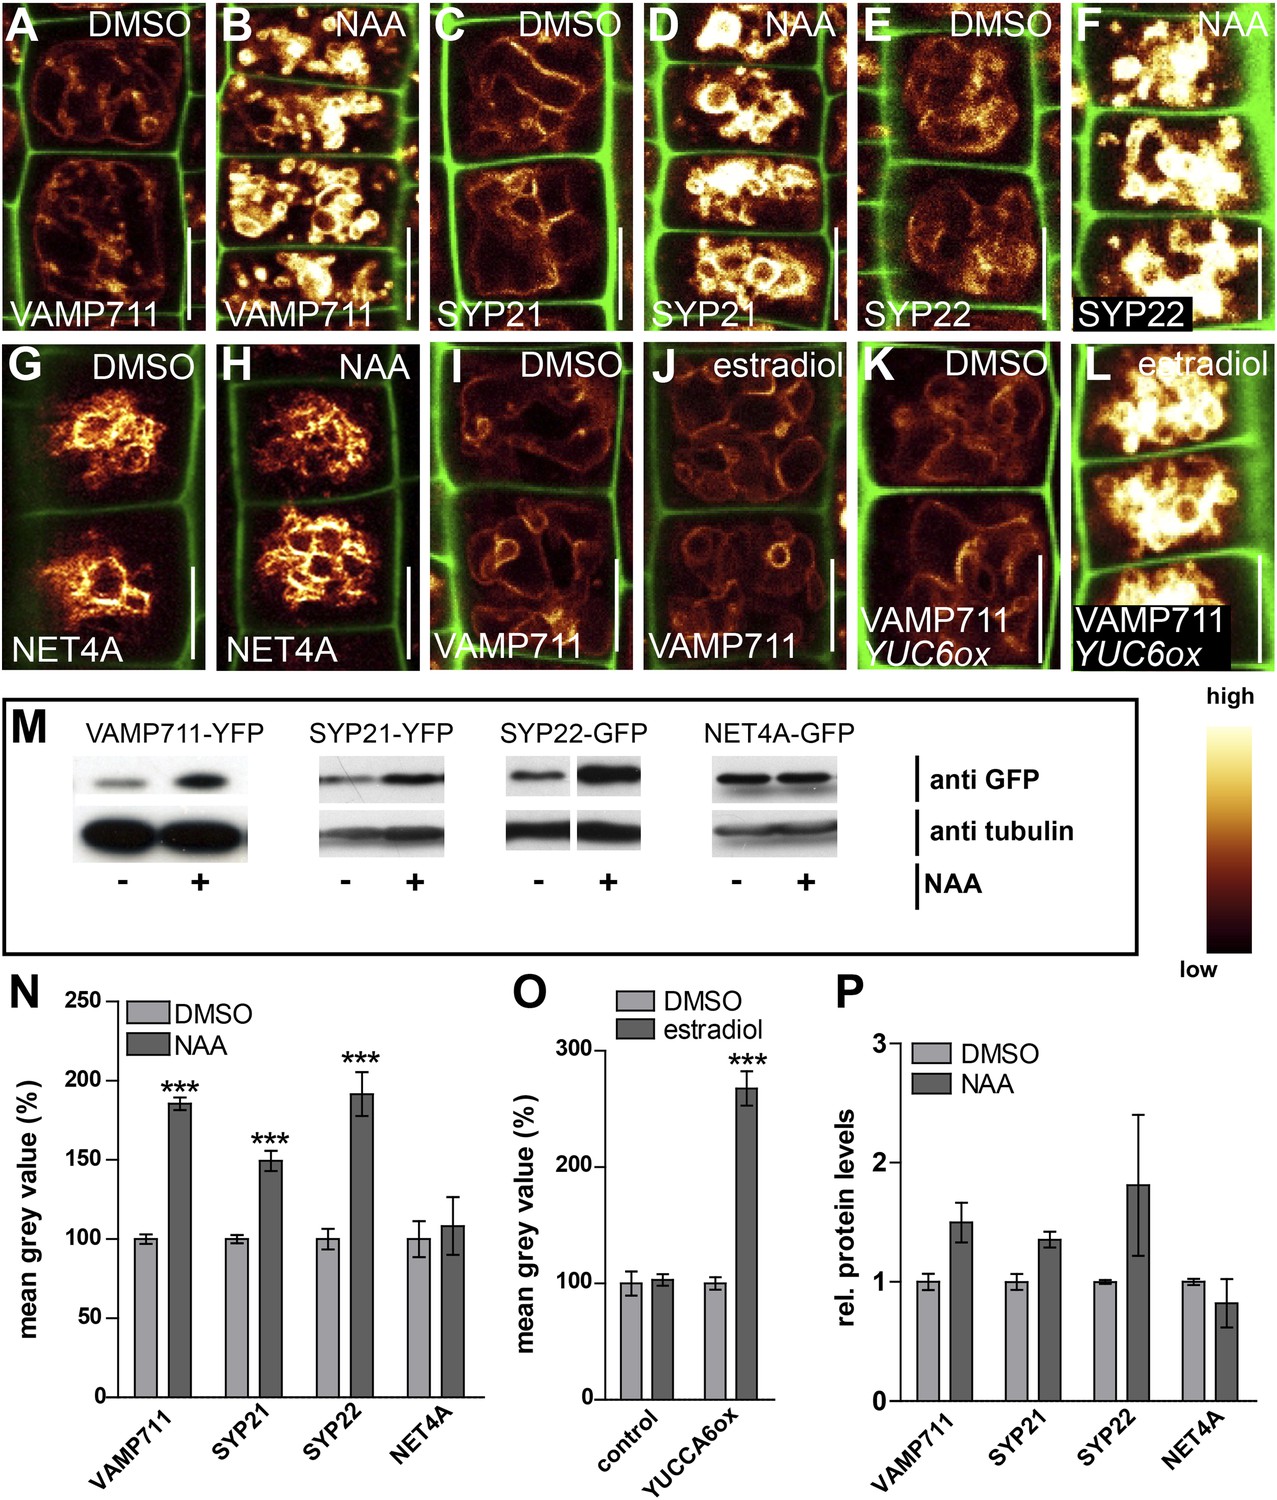
Auxin posttranslationally stabilises tonoplast localised SNAREs.
(A–L) Tonoplast localised SNAREs and marker protein NET4A under high auxin conditions. pUBQ10::VAMP711-YFP (A and B), 35S::SYP21-YFP (C and D), SYP22::SYP22-GFP (in syp22) (E and F) and NET4A::NET4A-GFP (G and H) expressing seedlings treated with DMSO (A, C, E, G) or NAA (B, D, F, H) (500 nM; 20 hr). (I and J) Estradiol does not affect VAMP711-YFP abundance. pUBQ10::VAMP711-YFP expressing seedlings treated with DMSO (I) or estradiol (J) (10 µM estradiol; 20 hr). YUCCA6 expression under control of an estradiol inducible promoter in pUBQ10::VAMP711-YFP expressing seedlings after DMSO (K) or estradiol (L) (10 µM; 20 hr) treatment. Propidium iodide (green) for decorating the cell wall was used for confocal imaging of atrichoblast cells. (M) Western-blot (anti-GFP) representing VAMP711-YFP, SYP21-YFP, SYP22-GFP and NET4A-GFP protein abundance after NAA (500 nM; 20 hr) and control treatment as well as corresponding alpha-tubulin abundance for normalization. (N) Mean grey value of vacuolar localised SNAREs and marker protein NET4A after auxin treatments (500 nM; 20 hr) compared to DMSO treatments. (O) Mean grey value of VAMP711-YFP after YUCCA6 induction (10 µM; 20 hr). (P) Western-blot quantification (mean grey values). n = 3 biological replicates each consisting of a pool of 40–50 roots. Error bars represent s.e.m. For statistical analysis DMSO and NAA treatments were compared. For confocal analysis (N-O): n = 32 cells in eight individual seedlings. Student's t-test p-values: ***p < 0.001. Scale bar: 15 µm.
Figure 4—figure supplement 1
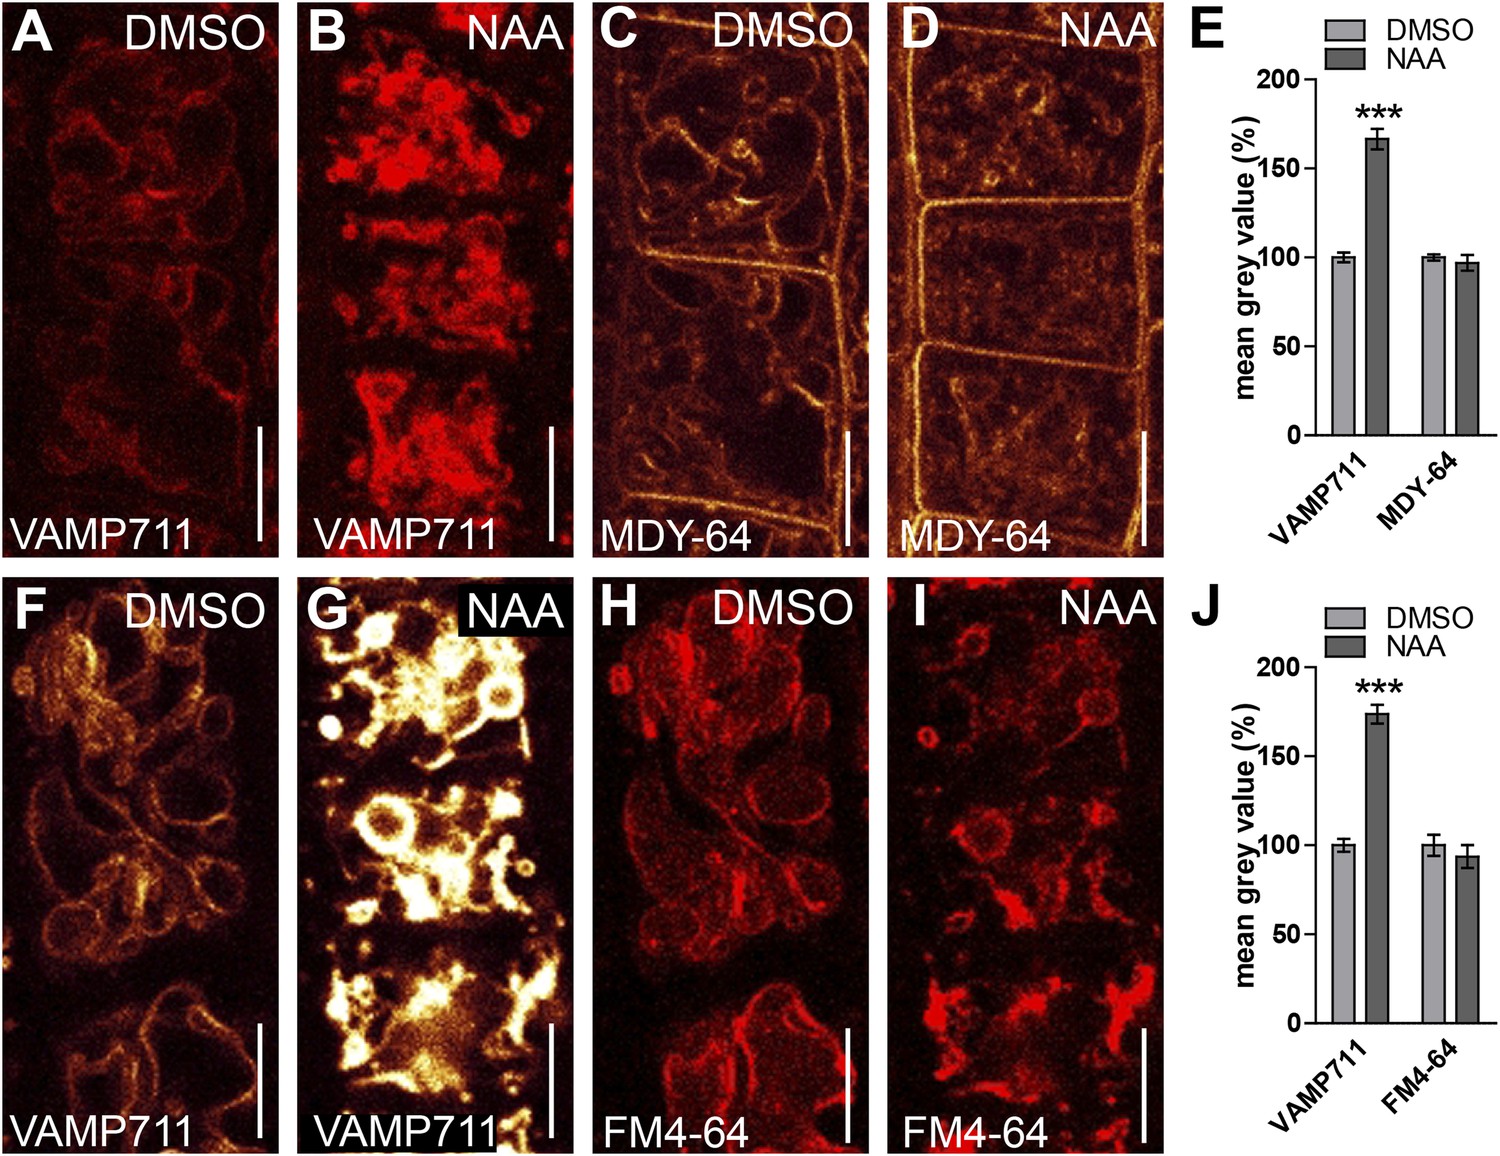
Increase in SNARE intensity is independent of membrane crowding.
(A–J) Simultaneous imaging of VAMP711-RFP/YFP and tonoplast staining dyes under untreated and high auxin conditions. pUBQ10::VAMP711-RFP (A and B) and pUBQ10::VAMP711-YFP (F and G) expressing seedlings were counterstained either with MDY-64 (C and D) or FM4-64 (H and I) and treated with DMSO (A and C) or NAA (B and D) (500 nM; 20 hr). (E) Quantification of mean grey value of VAMP711-RFP and MDY-64 after NAA treatments (500 nM) compared to DMSO control. (J) Quantification of mean grey value of VAMP711-YFP and FM4-64 after NAA treatments (500 nM) compared to DMSO control. Error bars represent s.e.m. For statistical analysis DMSO and NAA treatments were compared. n = 40 cells in 10 individual seedlings. Student's t-test p-values: ***p < 0.001. Scale bar: 15 µm.
Figure 4—figure supplement 2

Auxin affects cellular abundance of vacuolar SNAREs.
(A–H) Maximum projection of tonoplast localised SNAREs and marker protein NET4A under high auxin conditions. pUBQ10::VAMP711-YFP expressing seedlings treated with DMSO (A) or NAA (B) (500 nM; 20 hr). 35S::SYP21-YFP expressing seedlings treated with DMSO (C) or NAA (D) (500 nM; 20 hr). SYP22::SYP22-GFP (in syp22) expressing seedlings treated with DMSO (E) or NAA (F) (500 nM; 20 hr). NET4A::NET4A-GFP expressing seedlings treated with DMSO (G) or NAA (H) (500 nM; 20 hr). 17–20 steps of 1 µm size were used for image acquisition. (I) Mean grey value of vacuolar SNAREs and tonoplast marker NET4A in DMSO control and auxin treatments (500 nM; 20 hr). Error bars represent s.e.m. For statistical analysis DMSO and NAA treatments were compared. Student's t-test p-values: **p < 0.01, ***p < 0.001. Scale bar: 15 µm.
Figure 4—figure supplement 3
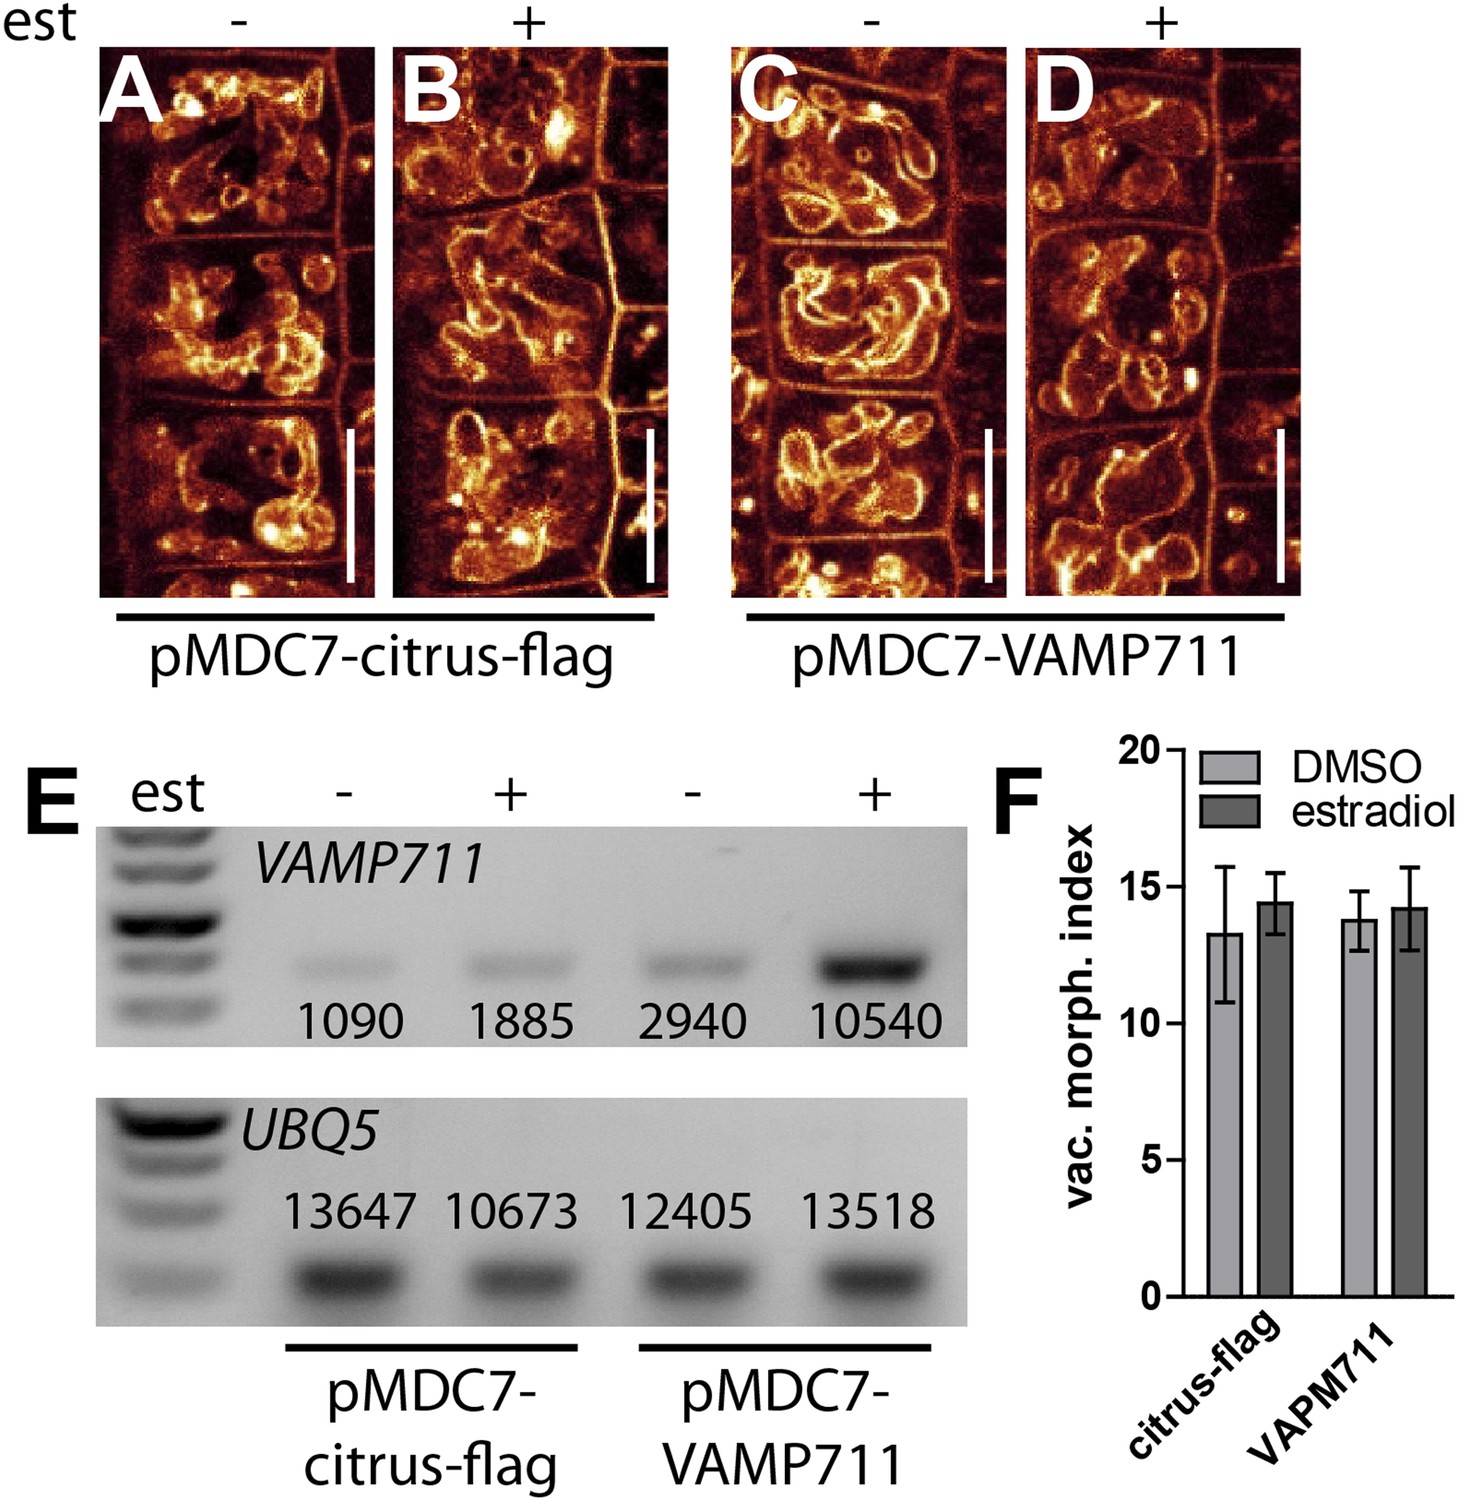
Induction of a single SNARE component is not sufficient to affect vacuolar morphology.
(A–D) Estradiol induction of VAMP711. pMDC7::citrus-flag (control) after DMSO (A) or estradiol (B) (2 µM) treatment. VAMP711 expression under control of an estradiol inducible promoter after DMSO (C) or estradiol (D) (2 µM) incubation. Vacuoles were decorated with FM4-64 (orange). (E) Semi-quantitative RT-PCR of VAMP711 in pMDC7::citrus-flag and pMDC7::VAMP711 expressing plants with (+) and without (−) estradiol induction (2 µM; 20 hr). UBQ-5 expression was used for normalisation. Depicted values represent quantification of mean grey values of corresponding bands. (F) Vacuolar morphology (vac. morph. [µm2]) index of estradiol induced pMDC7::citrus-flag and pMDC7::VAMP711 expressing seedlings compared to the uninduced control. Scale bar, 15 µm.
Figure 5
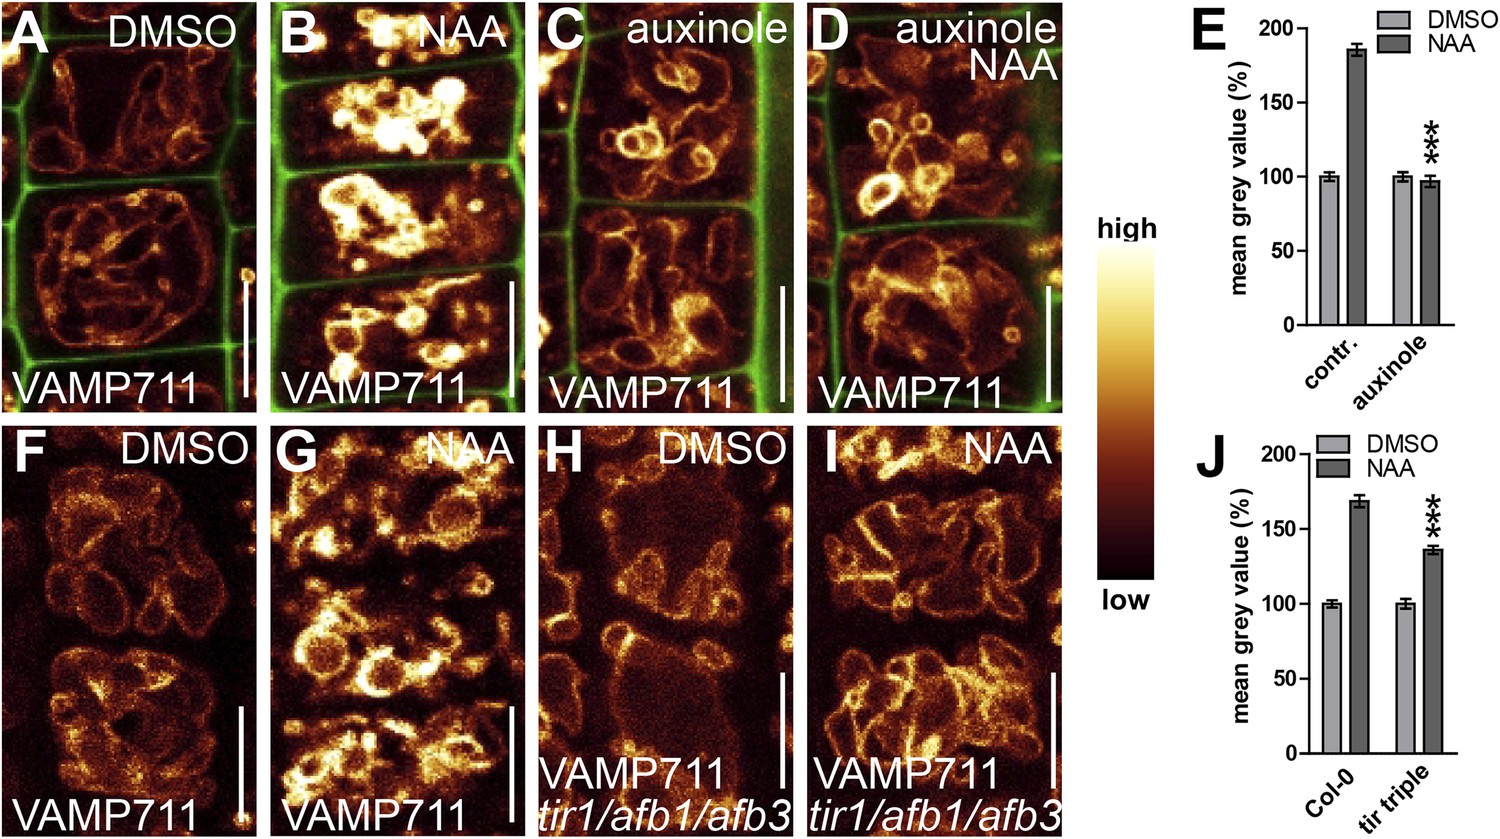
TIR1/AFBs-dependent auxin perception is required for posttranslational VAMP711 stabilisation.
(A–D) Pharmacological inhibition of TIR1/AFBs dependent signalling. pUBQ10::VAMP711-YFP expressing seedlings treated with DMSO (A), NAA (B) (500 nM; 20 hr), auxinole (C) (20 µM; 20 hr) or auxinole/NAA co-treatment (D). (E) Mean grey value of VAMP711-YFP abundance after NAA or NAA/auxinole co-treatments. (F–I) Genetic inhibition of TIR1/AFBs signalling. VAMP711-RFP expressing control seedlings (for H and I) treated with DMSO (F) and NAA (G) (500 nM; 20 hr). VAMP711-RFP abundance in tir1-1/afb1-3/afb3-4 mutant background after DMSO (H) or NAA (I) (500 nM; 20 hr) treatment. (J) Mean grey value of treatments in F–I. VAMP711-YFP/RFP (orange) as a vacuolar marker and propidium iodide (green) for decorating the cell wall were used for confocal imaging of atrichoblast cells. n = 32 cells in eight individual seedlings. Error bars represent s.e.m. For statistical analysis either DMSO or NAA treatments were compared between control and indicated mutant/treated seedlings. Student's t-test p-values: ***p < 0.001. Scale bar: 15 µm.
Figure 6 with 3 supplements
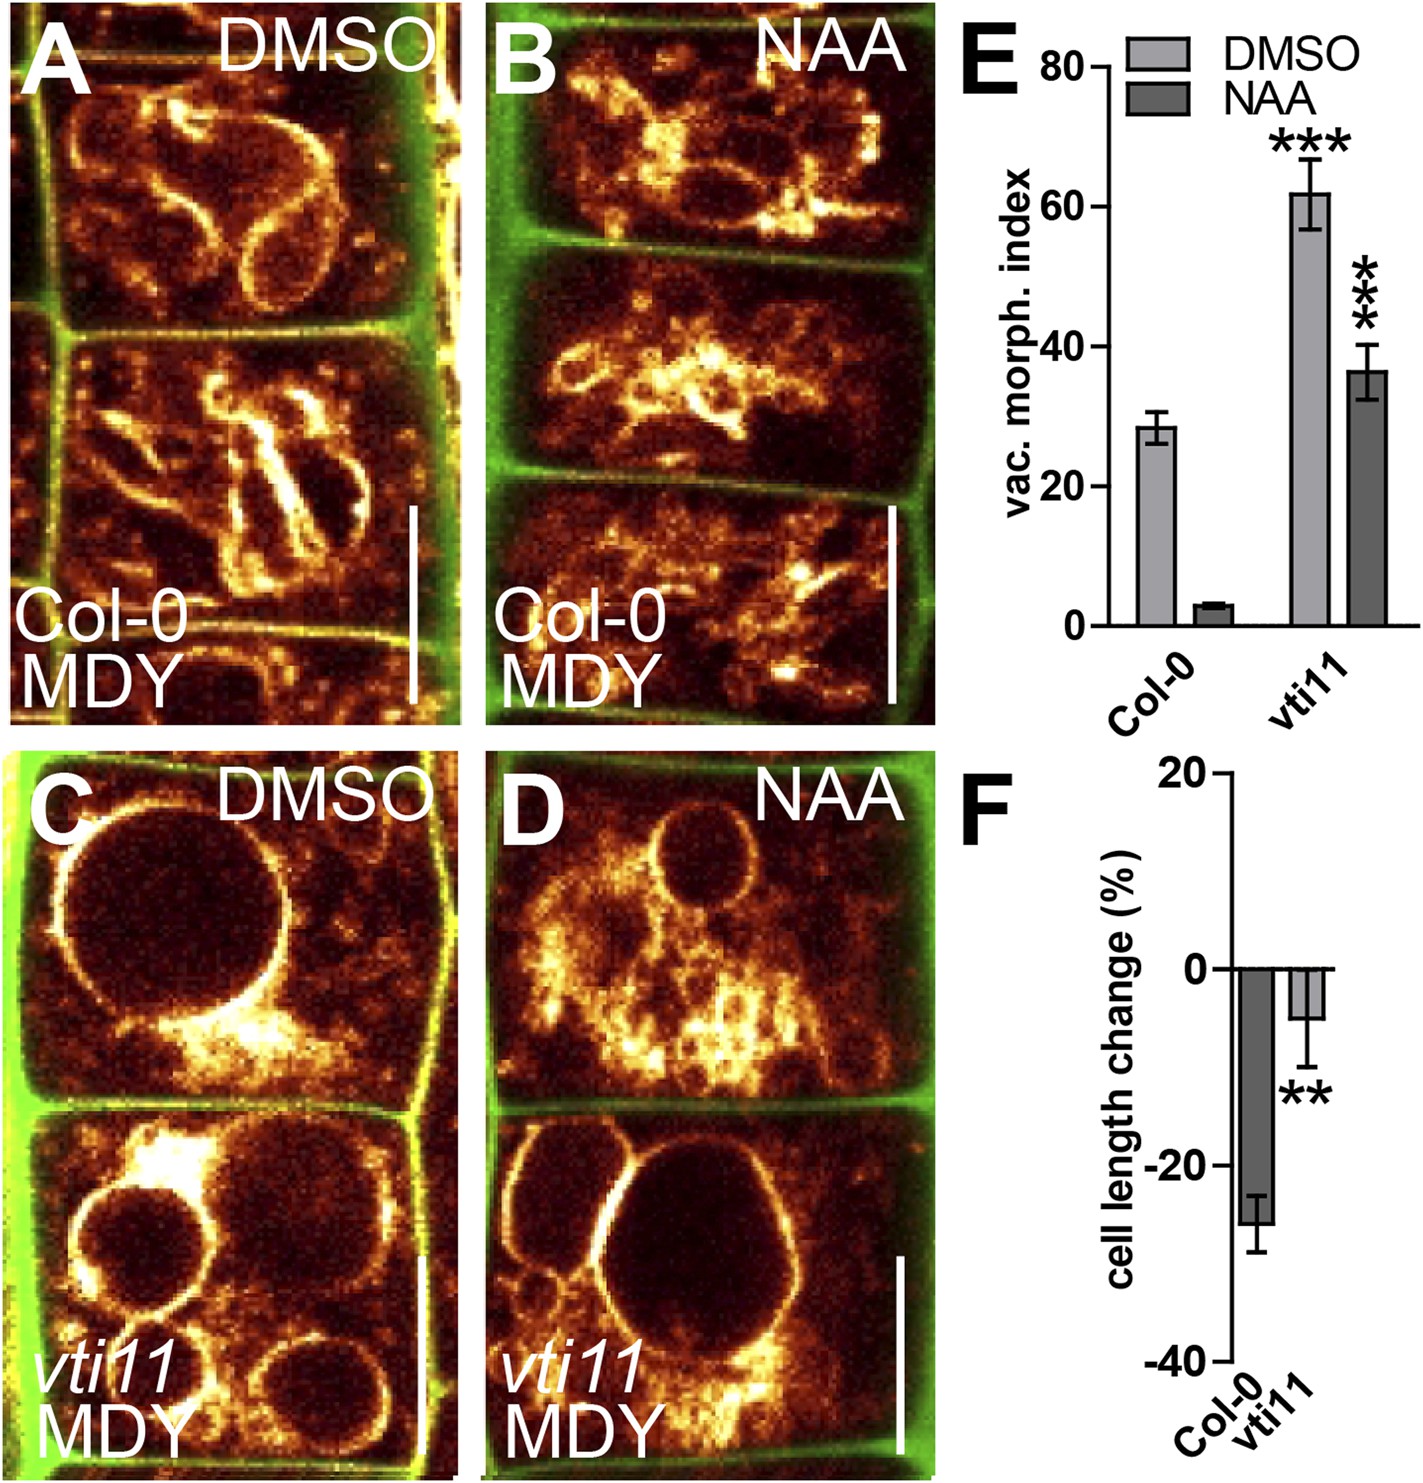
SNARE-dependent vacuolar morphogenesis is required for auxin regulated cell size determination.
(A–F) Vacuolar morphology and cell size determination in the vti11 mutant. Control treatment of Col-0 with DMSO (A) or NAA (B) (250 nM; 20 hr). vti11 mutants were treated with DMSO (C) or NAA (D) (250 nM; 20 hr). MDY-64 (orange) and propidium iodide (green) were used for confocal imaging of atrichoblast cells (A–D). (E) Vacuolar morphology (vac. morph. [µm2]) index of prior treatments in Col-0 and vti11 mutant. (F) Cell length change of Col-0 and vti11 atrichoblast cells after NAA (250 nM; 20 hr) treatment compared to DMSO control. n = 40 cells in eight individual seedlings for vacuolar morphology index quantification and n = 40 cells in 10 individual seedlings for cell size measurements. Error bars represent s.e.m. For statistical analysis either DMSO or NAA treatments were compared between control and indicated mutant/treated seedlings. Student's t-test p-values: **p < 0.01, ***p < 0.001. Scale bar: 15 µm.
Figure 6—figure supplement 1
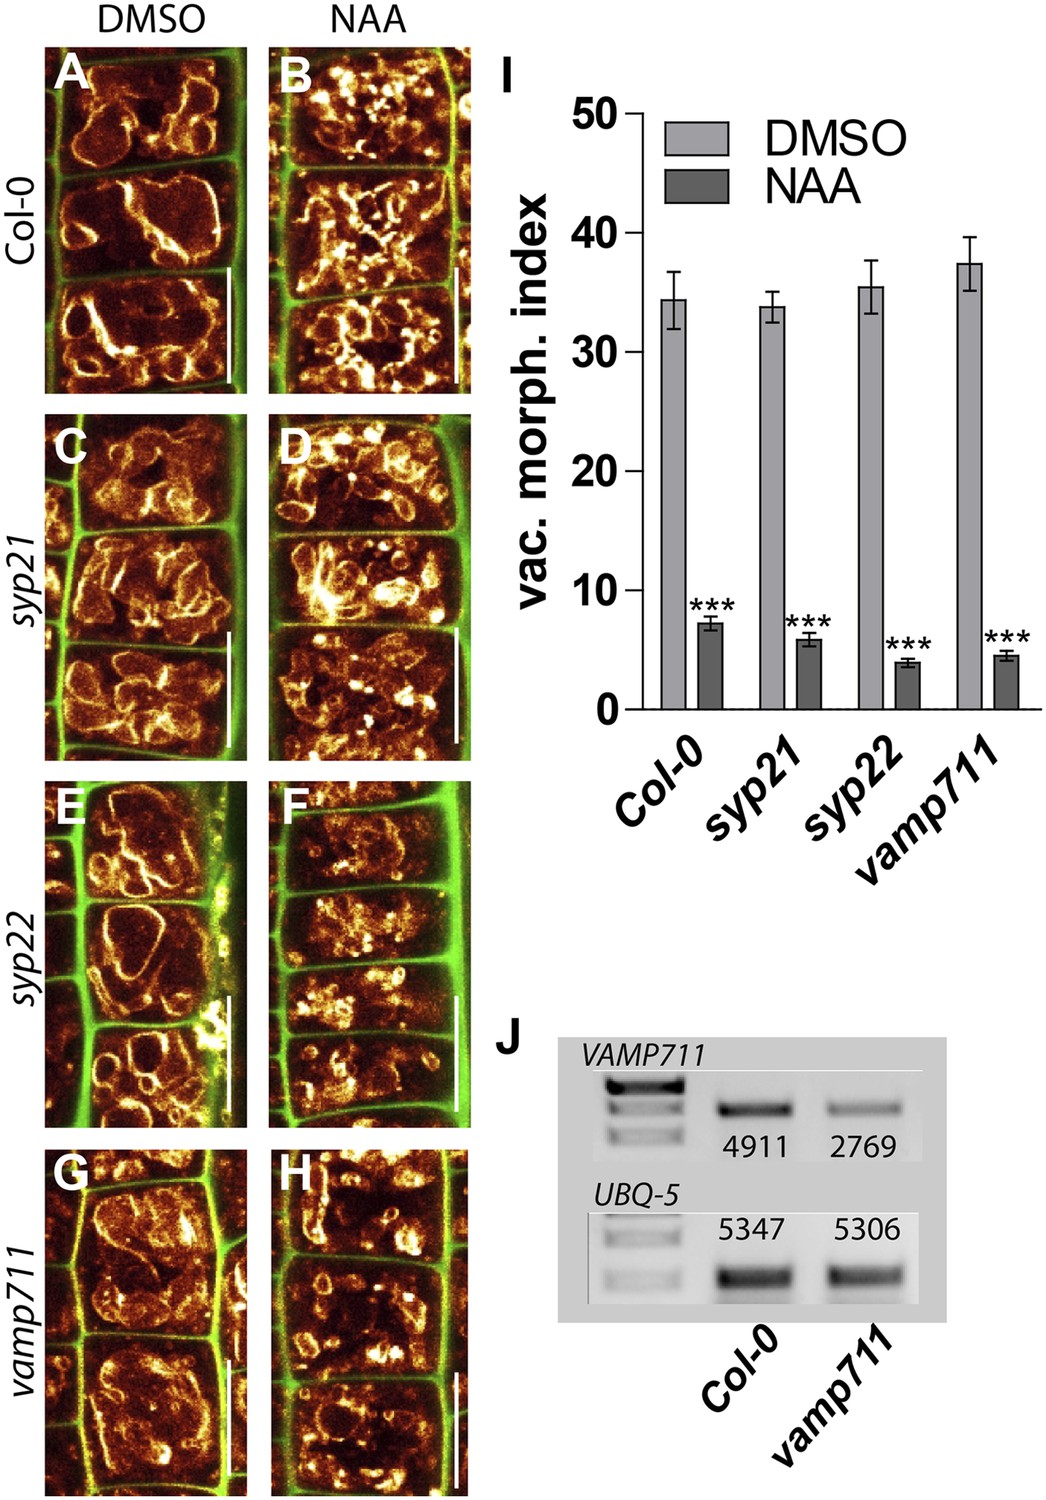
Auxin affects vacuolar morphology in several vacuolar snare single mutants.
(A–H) Overview of the vacuolar morphology in single snare mutants after auxin treatment. Control treatment of Col-0 with DMSO (A) or NAA (B) (250 nM; 20 hr). syp21 treated with DMSO (C) or NAA (D) (250 nM; 20 hr). syp22 treated with DMSO (E) or NAA (F) (250 nM; 20 hr) and vamp711 treated with DMSO (G) or NAA (H) (250 nM; 20 hr). Vacuoles were decorated with MDY-64 (orange) and propidium iodide (PI) was used for counterstaining the cell walls (green). (I) Vacuolar morphology (vac. morph. [µm2]) index of DMSO (control) and NAA (250 nM; 20 hr) treated Col-0 and mutant atrichoblast cells. (J) Semi-quantitative RT-PCR of VAMP711 in Col-0 and vamp711 mutant line showing knock down of VAMP711 transcripts. UBQ-5 expression was used for normalisation. Depicted values represent quantification of mean grey values of corresponding bands. n = 40 atrichoblast cells in eight individual roots for vacuolar morphology index determination. Error bars represent s.e.m. Student's t-test p-value: ***p < 0.001. Scale bar: 15 µm.
Figure 6—figure supplement 2
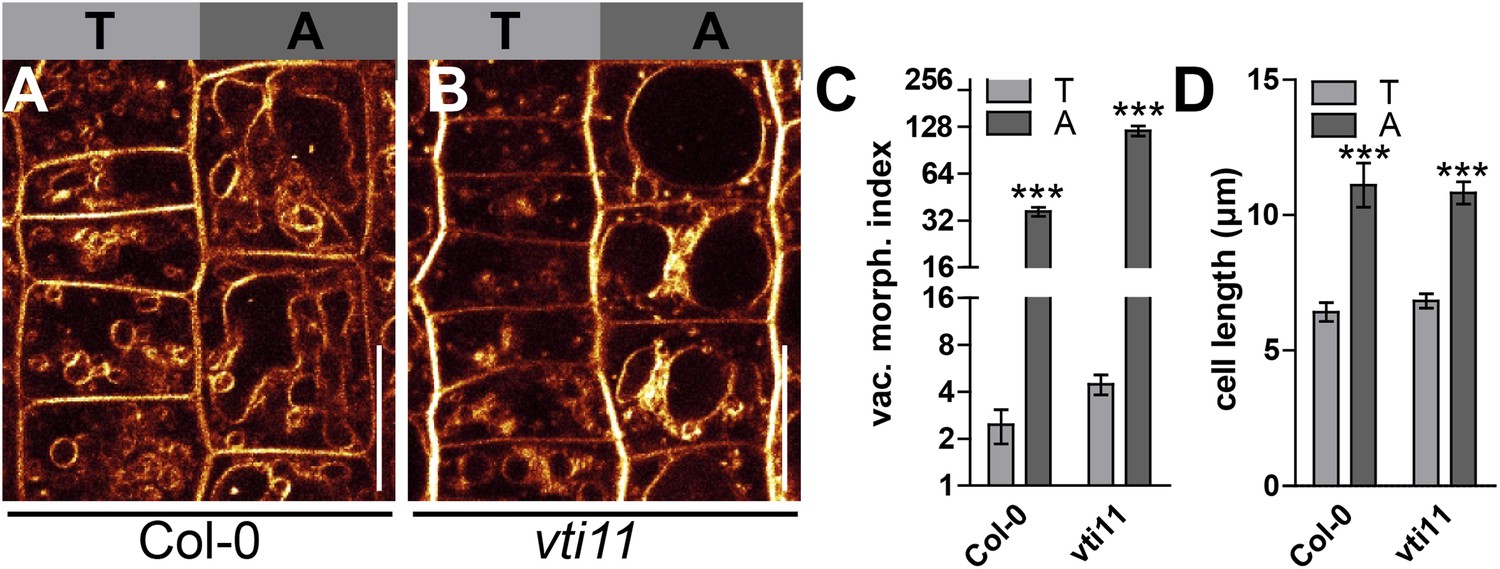
The vacuolar morphology in the vti11 mutant remained differentially controlled in tricho-/atrichoblast root epidermal cells.
(A and B) Root epidermal tricho- and atrichoblast cells of Col-0 (A) or vti11 mutant (B) were decorated with MDY-64. (C) Vacuolar morphology (vac. morph. [µm2]) index of Col-0 and vti11 tricho- and atrichoblast cells. (D) Mean cell length of Col-0 and vti11 tricho- and atrichoblast cells. For statistical analysis vti11 tricho- and atrichoblast cells were compared to wild-type tricho- and atrichoblast cells. T refers to trichoblast and A to atrichoblast cell files. n = 40 quantified cells in eight seedlings for vacuolar morphology index measurements and n = 40 quantified cells in 10 seedlings for cell length quantification. Error bars represent s.e.m. Student's t-test p-value: ***p < 0.001. Scale bar: 15 µm.
Figure 6—figure supplement 3
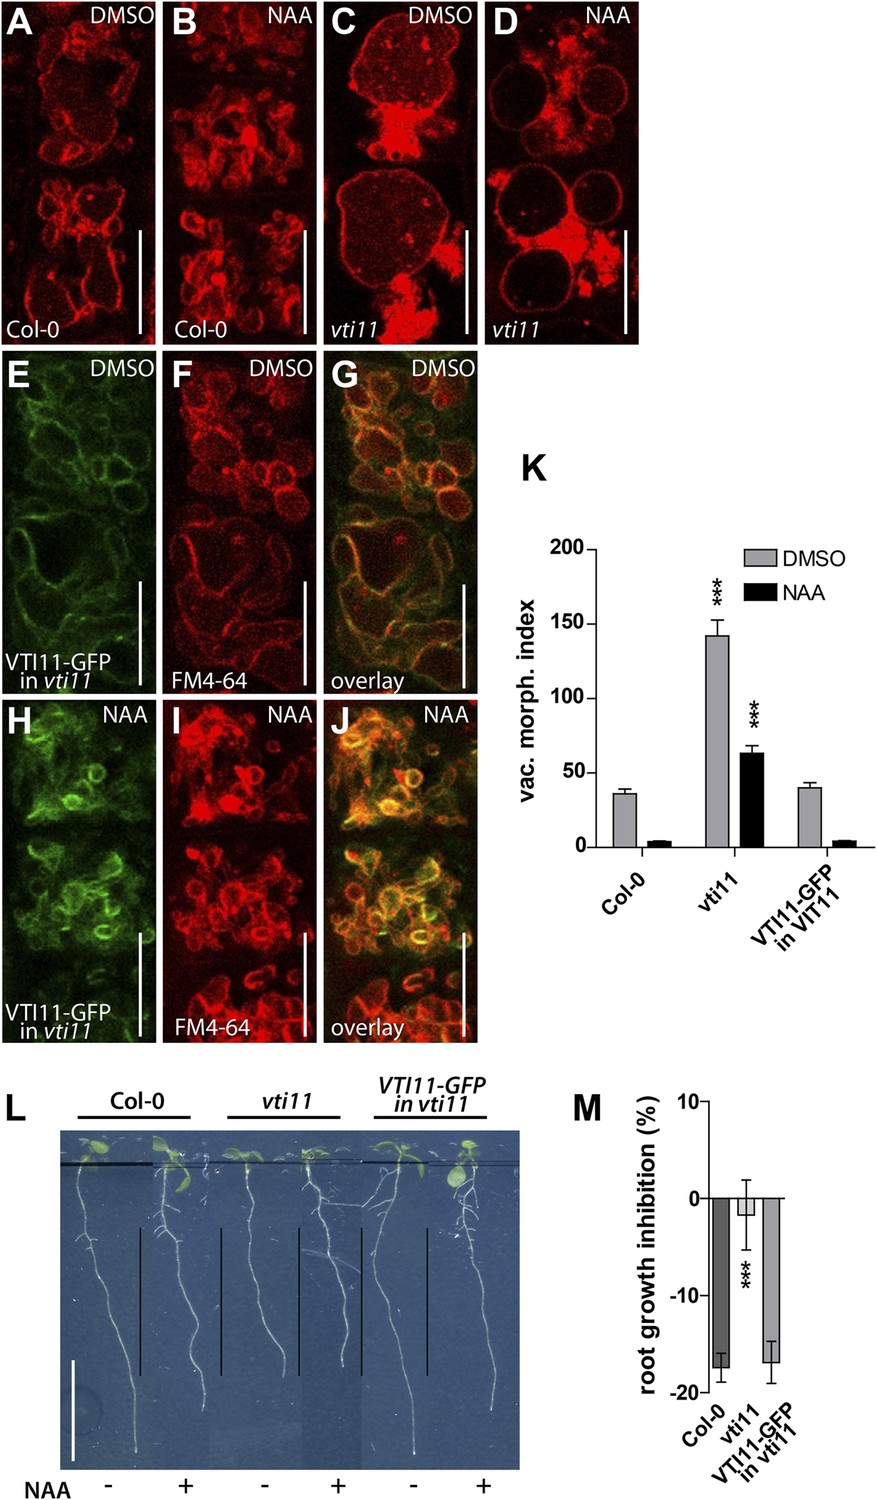
The pVTI11:VTI11-GFP complements auxin phenotypes in vti11 mutant.
Control treatment of Col-0 (A and B) and vti11 (C and D) with DMSO (A and C) or NAA (B and D) (250 nM; 20 hr). (E–J) VTI11::GFP-VTI11 expressing vti11 seedlings under control and high auxin conditions. (E) DMSO control treatment of VTI11-GFP expressing vti11 cells. (H) NAA treatment (250 nM; 20 hr) of VTI11-GFP expressing vti11 cells. Samples were counterstained with FM4-64 (F and I) and respective overlay (G and J) is shown. (K) Vacuolar morphology index of DMSO control and NAA (250 nM; 20 hr) treated Col-0 and mutant atrichoblast cells. (L and M) Complementation of vti11. (L) Root growth of Col-0, vti11 and VTI11::GFP-VTI11 in vti11 after control and NAA (125 nM) treatment. (M) Quantification of root growth inhibition in Col-0, vti11 and VTI11::GFP-VTI11 in vti11 after NAA (125 nM) treatment. n = 40 atrichoblast cells in eight individual roots for vacuolar morphology index determination and n = 20–25 roots for root growth inhibition. For statistical analysis Col-0 were compared with mutant seedlings. Error bars represent s.e.m. Student's t-test p-value: ***p < 0.001. Scale bar, in A–J: 15 µm; in L: 1 cm.
Figure 7 with 2 supplements
PI4-kinase function is required for auxin dependent vacuolar morphology, cell size determination and control of posttranslational VAMP711 abundance.
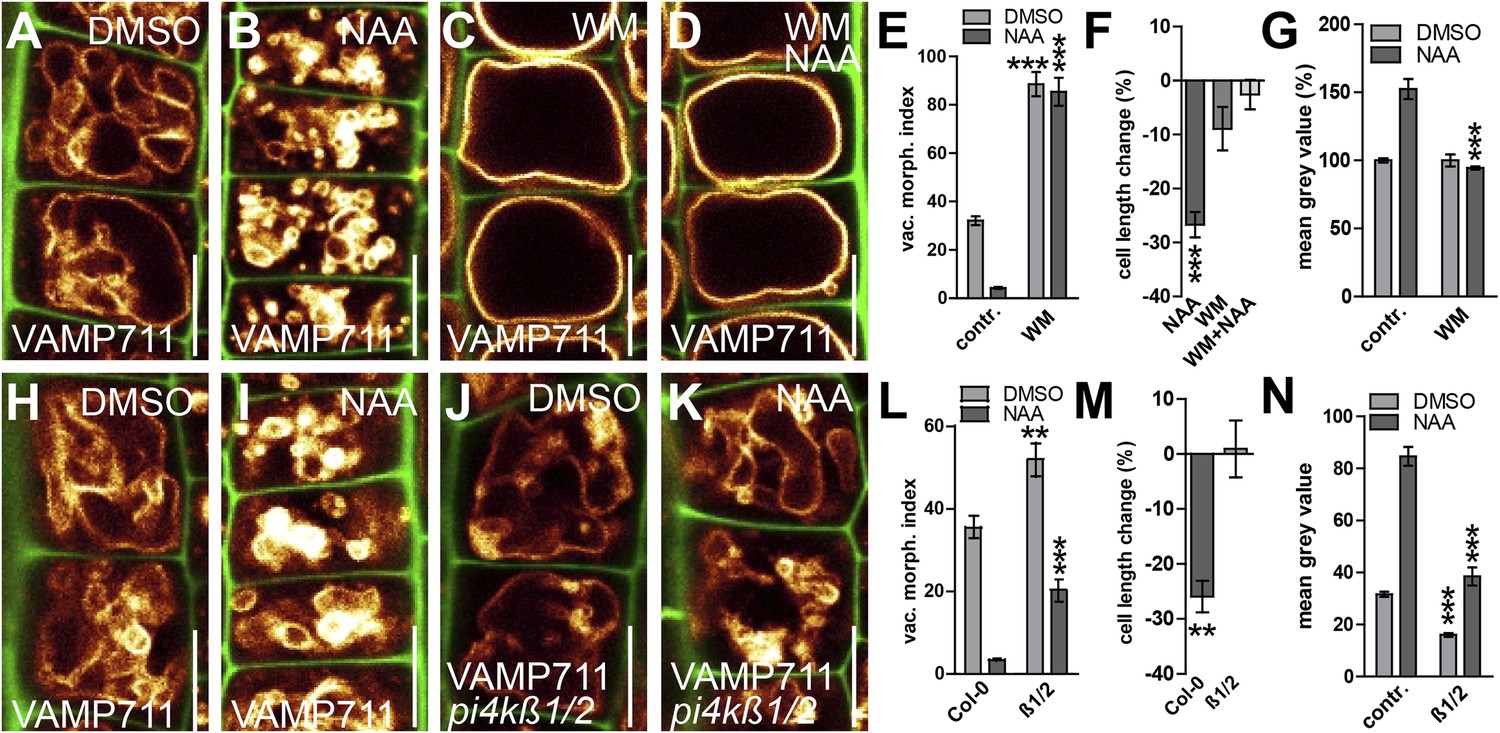
(A–G) Effect of wortmannin (WM) on auxin regulated vacuolar morphology, cell growth inhibition and VAMP711 abundance. Control treatment of VAMP711-YFP atrichoblasts with DMSO (A) or NAA (B) (250 nM; 20 hr). VAMP711-YFP expressing seedlings after WM (C) (10 µM; 20 hr) or NAA/WM co-treatment (D). Quantification of vacuolar morphology (vac. morph. [µm2]) index (E) and cell length change (F). (G) Relative mean grey value of VAMP711-YFP abundance after NAA (500 nM; 20 hr) and/or WM (10 µM; 20 hr) treatment. Corresponding images are shown in Figure 7—figure supplement 1. (H–M) Effect on auxin regulated vacuolar morphology, cell growth inhibition and VAMP711 abundance in pi4kß1/2 plants. Control treatment of VAMP711-YFP atrichoblasts with DMSO (H) or NAA (I) (100 nM; 20 hr) for comparability. VAMP711-YFP expression in pi4kß1/2 mutant background after DMSO (J) or NAA (K) (100 nM; 20 hr) treatment. Quantification of vacuolar morphology (vac. morph. [µm2]) index (L) and cell length change (M). (N) Absolute mean grey value of VAMP711-YFP abundance after NAA (500 nM; 20 hr) treatment in the pi4kß1/2 mutant background. Corresponding images are shown in Figure 7—figure supplement 1. VAMP711-YFP (orange) as a vacuolar marker and propidium iodide (green) for decorating the cell wall were used for confocal imaging of atrichoblast cells. n = 32 cells in eight individual seedlings for cell length measurements and n = 40 cells in eight individual seedlings for vacuolar morphology index quantification. Error bars represent s.e.m. For statistical analysis either DMSO or NAA treatments were compared between control and indicated mutant/treated seedlings. Student's t-test p-values: **p < 0.01, ***p < 0.001. Scale bar: 15 µm.
Figure 7—figure supplement 1
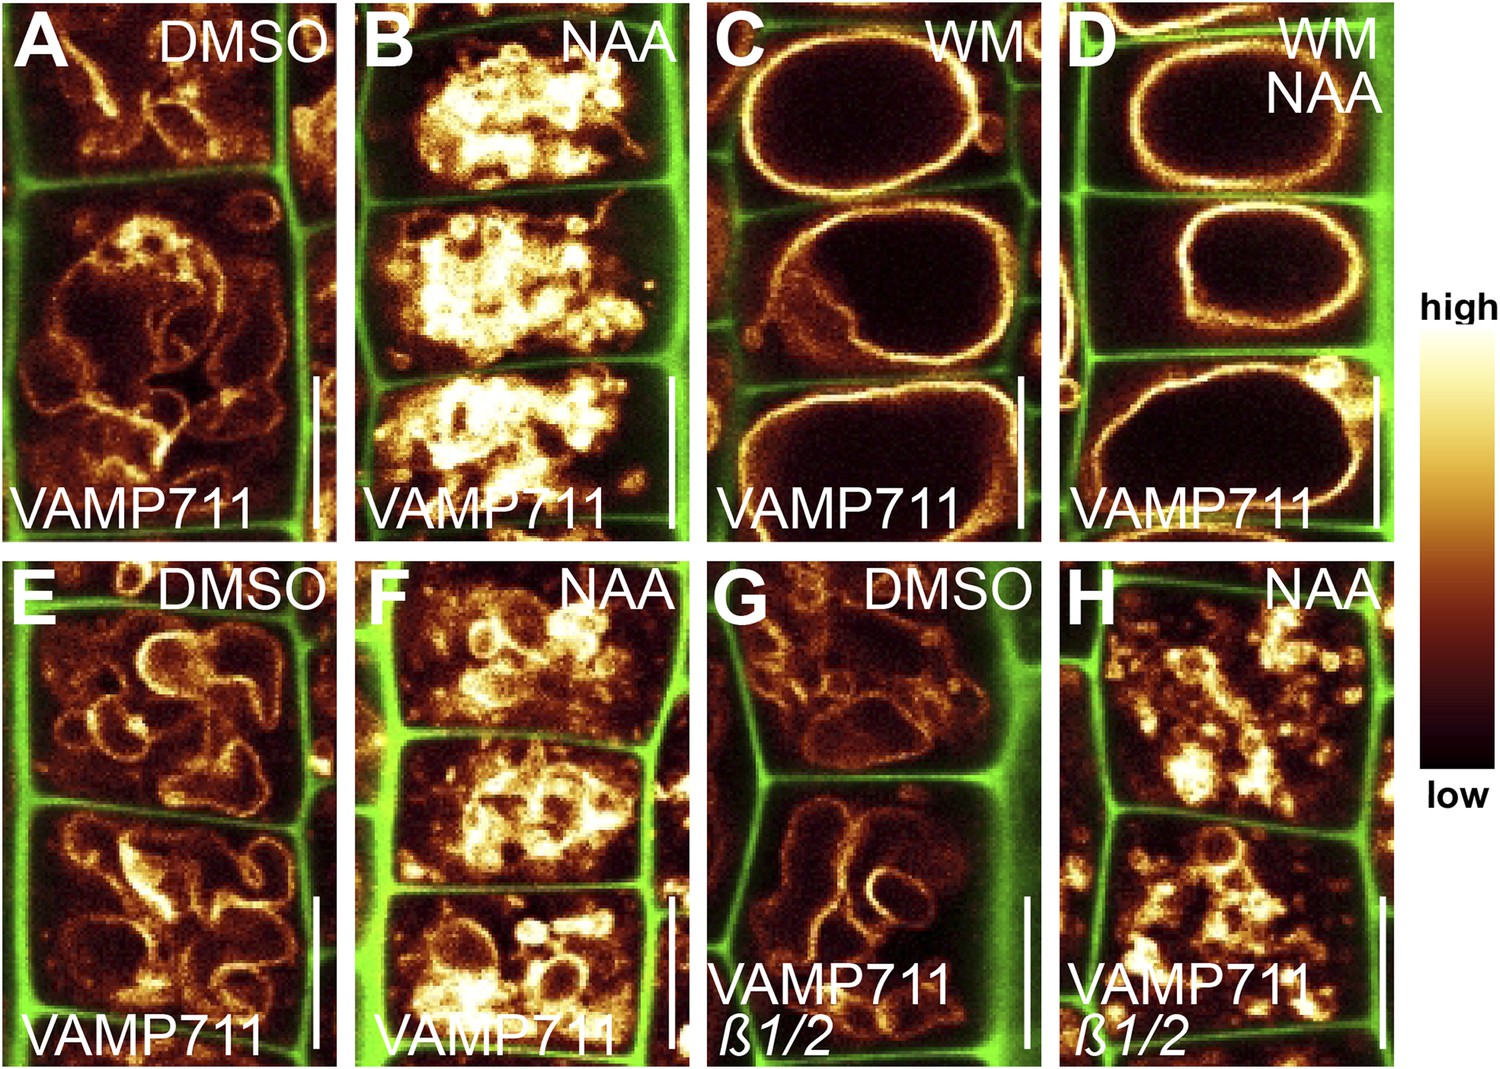
PI4 kinases posttranslationally control VAMP711 abundance.
(A–D) Wortmannin inhibits the auxin effect on VAMP711 stabilisation. VAMP711-YFP signal after DMSO (A) or NAA (B) (500 nM; 20 hr) (control for C and D) treatment. VAMP711-YFP seedlings treated with wortmannin (WM) (C) (10 µM; 20 hr) or WM and NAA (D) (500 nM; 20 hr). (E–H) Reduced VAMP711 abundance in pi4kß1/2 mutants. Control treatment of VAMP711-YFP with DMSO (E) or NAA (F) (500 nM; 20 hr). pi4kß1/2 seedlings expressing pUBQ10::VAMP711-YFP treated with DMSO (G) or NAA (H) (500 nM; 20 hr). VAMP711-YFP (orange) as a vacuolar marker and propidium iodide (green) for decorating the cell wall were used for confocal imaging of atrichoblast cells. n = 32 cells in eight individual seedlings. Error bars represent s.e.m. For statistical analysis either DMSO or NAA treatments were compared between control and indicated mutant/treated seedlings. Student's t-test p-values: ***p < 0.001. Scale bar: 15 µm.
Figure 7—figure supplement 2
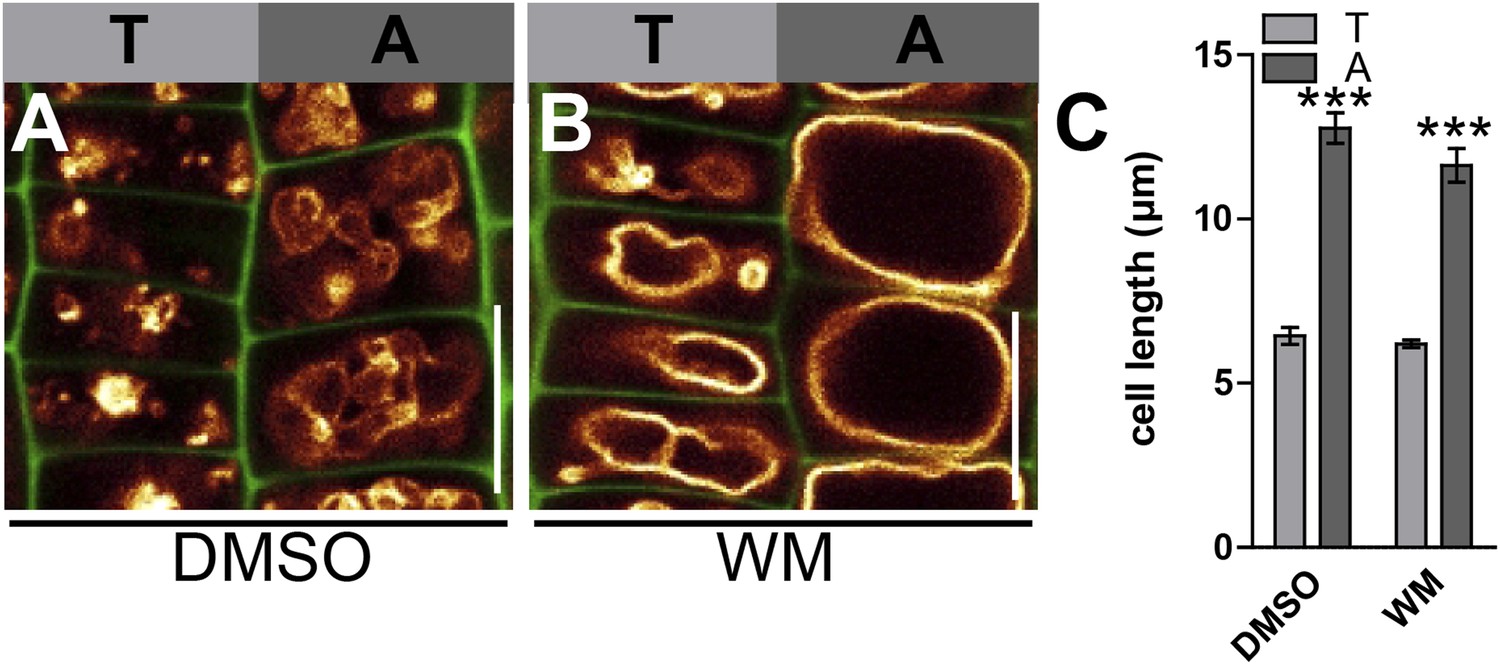
Tricho-/atrichoblast cell length in wortmannin treated samples.
(A and B) Root epidermal tricho-/atrichoblast cells of VAMP711-YFP expressing seedlings after DMSO (A) or WM (B) (10 µM; 20 hr) treatment. (C) Mean epidermal cell length in the root meristem of DMSO or WM (2 µM; 20 hr) treated seedlings. n = 40 quantified cells in eight seedlings. Error bars represent s.e.m. Student's t-test p-value: ***p < 0.001. Scale bar: 15 µm.
Figure 8 with 1 supplement
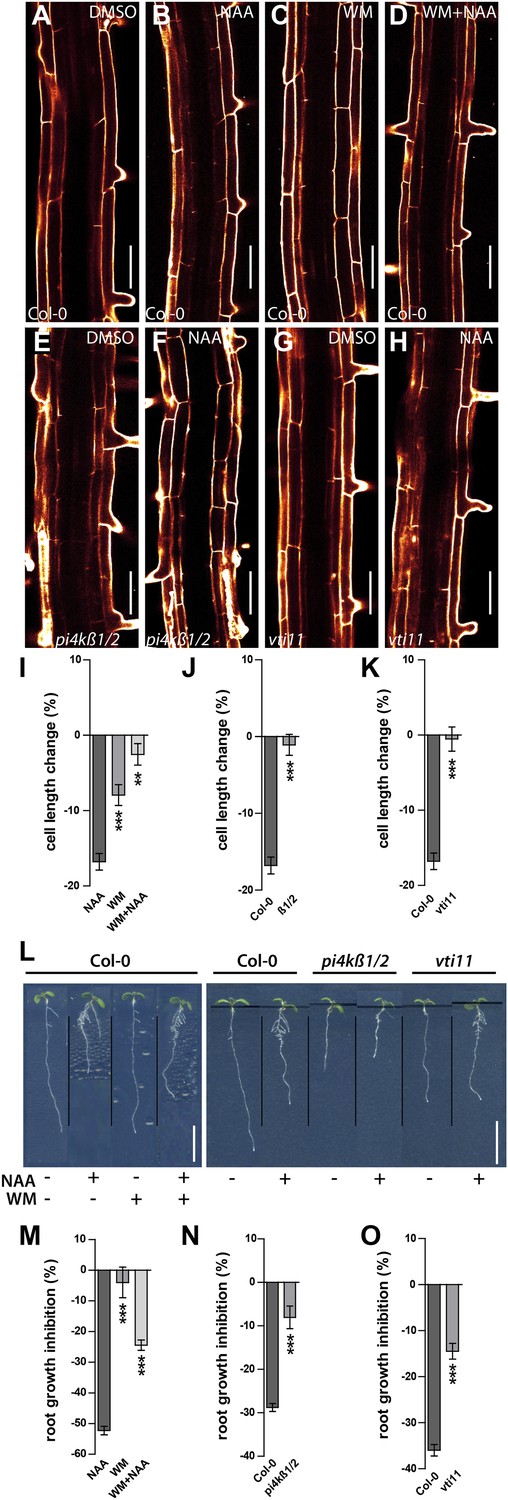
Auxin dependent vacuolar morphogenesis links auxin dependent growth inhibition.
(A–H) Fully elongated root cells in the differentiation zone of Col-0 after DMSO (A), NAA (B) (250 nM), WM (C) (2 µM), WM+NAA (D) and pi4kß1/2 after DMSO (E) or NAA (F) (250 nM), as well as vti11 after DMSO (G) or NAA (H) (250 nM) treatments. (I) Cell length change of Col-0 trichoblast cells after NAA (250 nM; 20 hr) and/or WM (2 µM; 20 hr) treatment. (J) Cell length change of Col-0 and pi4kß1/2 trichoblast cells after NAA (250 nM; 20 hr) treatment. (K) Cell length change of Col-0 and vti11 trichoblast cells after NAA (250 nM; 20 hr) treatment. (L) NAA mediated root growth inhibition of Col-0, pi4kß1/2 and vti11 after NAA (125 nM) and/or WM (2 µM) treatment. (M) Quantification of root growth inhibition in Col-0 after NAA (125 nM) and/or WM (2 µM) treatment (germinated; 12 DAG). (N) Quantification of root growth inhibition Col-0 and pi4kß1/2 after NAA (125 nM) treatment (germinated; 8 DAG). (O) Quantification of root growth inhibition in Col-0 and vti11 after NAA (125 nM) treatment (germinated; 8 DAG). Propidium iodide (red) for decorating the cell wall was used for confocal imaging of epidermal cells. For cell length change n = 30 seedlings out of three independent experiments with approximately 90–120 quantified cells in total; and n = 20–25 roots for root growth inhibition. Error bars represent s.e.m. For statistical analysis either NAA or WM treatments were compared between control and/or indicated mutant/treated seedlings. Student's t-test p-values: *p < 0.05, ***p < 0.001. Scale bar: 50 µm (A–H); 1 cm (L).
Figure 8—figure supplement 1
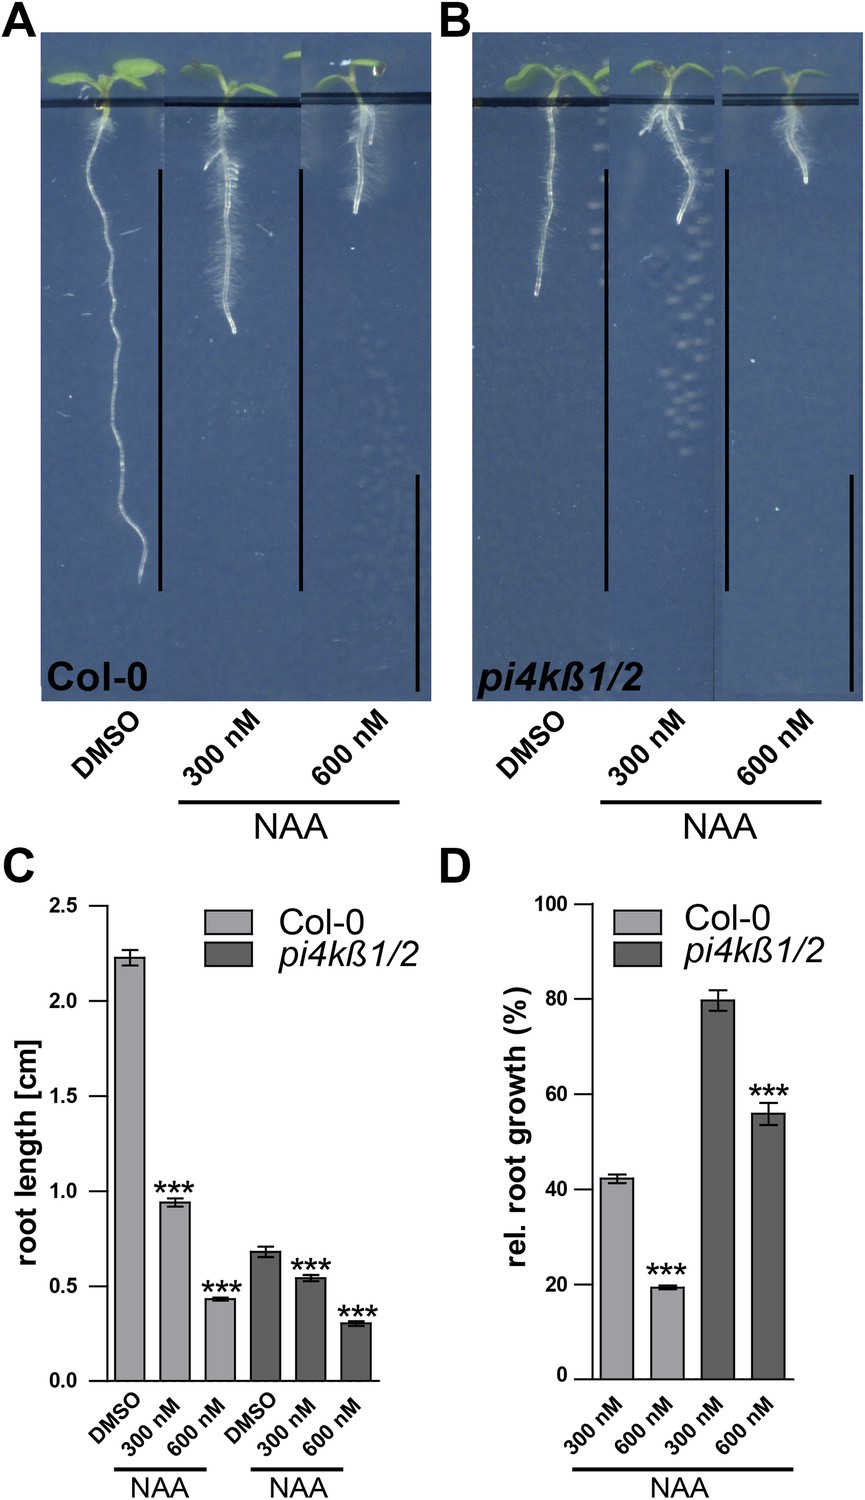
Root growth of pi4kß1/2 mutants reacts to auxin in a dose dependent manner.
(A–D) Root growth and length quantification of Col-0 and pi4kß1/2 seedlings under high auxin conditions. (A) Root growth of Col-0 seedling according to different NAA concentrations (300 nM and 600 nM NAA). (B) Root growth of pi4kß1/2 seedling according to different NAA concentrations (300 nM and 600 nM NAA). (C) Mean root growth inhibition of Col-0 and pi4kß1/2 in responce to different auxin concentrations (300 nM and 600 nM NAA). (D) Relative root growth inhibition of Col-0 and pi4kß1/2 in response to different auxin concentrations (300 nM and 600 nM NAA). n = 20–25 roots per treatment. Error bars represent s.e.m. Student's t-test p-value: ***p < 0.001. Scale bar: 1 cm.
Author response image 1
Download links
A two-part list of links to download the article, or parts of the article, in various formats.
Downloads (link to download the article as PDF)
Open citations (links to open the citations from this article in various online reference manager services)
Cite this article (links to download the citations from this article in formats compatible with various reference manager tools)
Auxin regulates SNARE-dependent vacuolar morphology restricting cell size
eLife 4:e05868.
https://doi.org/10.7554/eLife.05868


