The Rho-guanine nucleotide exchange factor PDZ-RhoGEF governs susceptibility to diet-induced obesity and type 2 diabetes
- University Health Network, Canada
- University of Toronto, Canada
- The Hospital for Sick Children, Canada
Figures
Figure 1 with 3 supplements
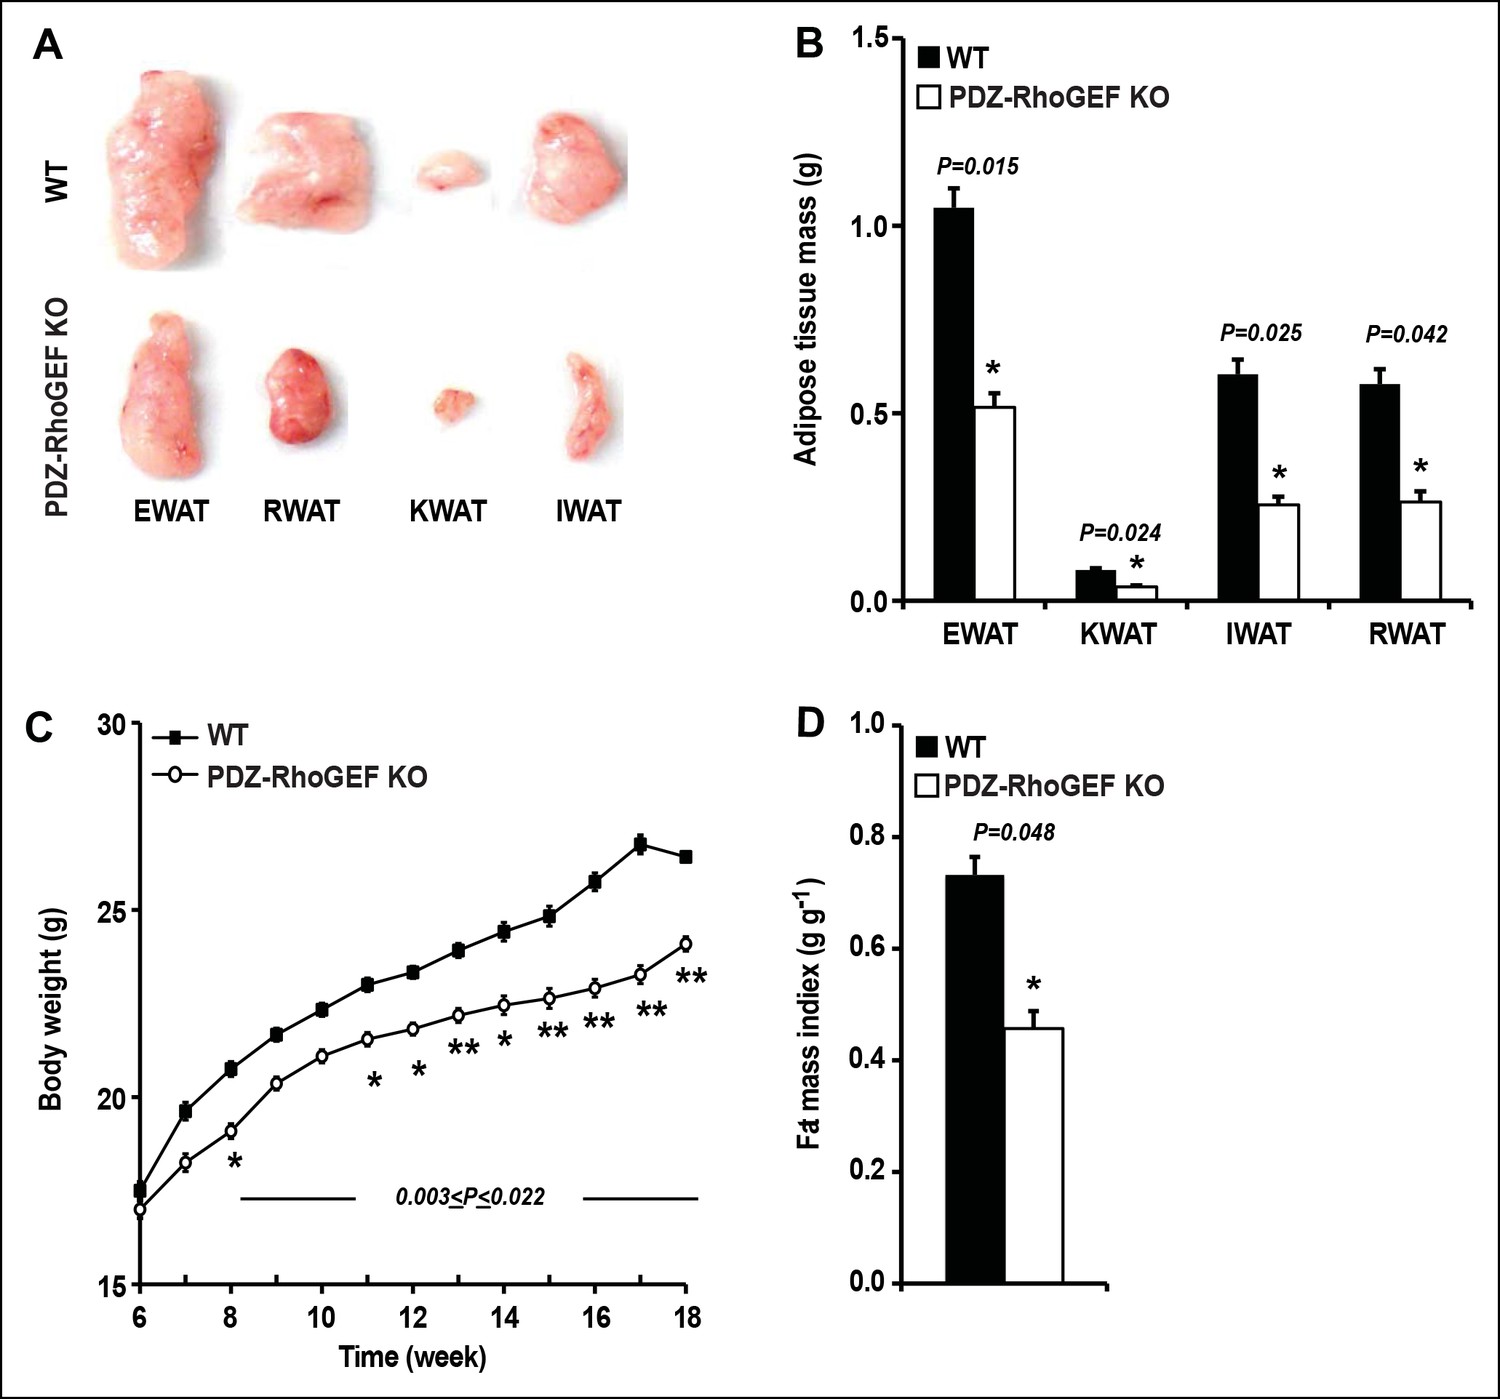
PDZ-RhoGEF controls body weight and adipose tissue mass.
(A) Representative EWAT, RWAT, IWAT, and KWAT from NCD-fed 7-month old WT and PDZ-RhoGEF KO male mice. (B) Fat weight from 7-month old male mice on NCD (n = 7–10). (C)Body weight of mice on NCD (n = 12–13). (D)Body fat index determined by MRI analysis of wild type and PDZ-RhoGEF KO mice (n = 7–9) maintained on a NCD for 16 weeks. Statistical significance was calculated by a Student’s t test using Excel software (*p<0.05, **p<0.01, ***p<0.001).
Figure 1—figure supplement 1
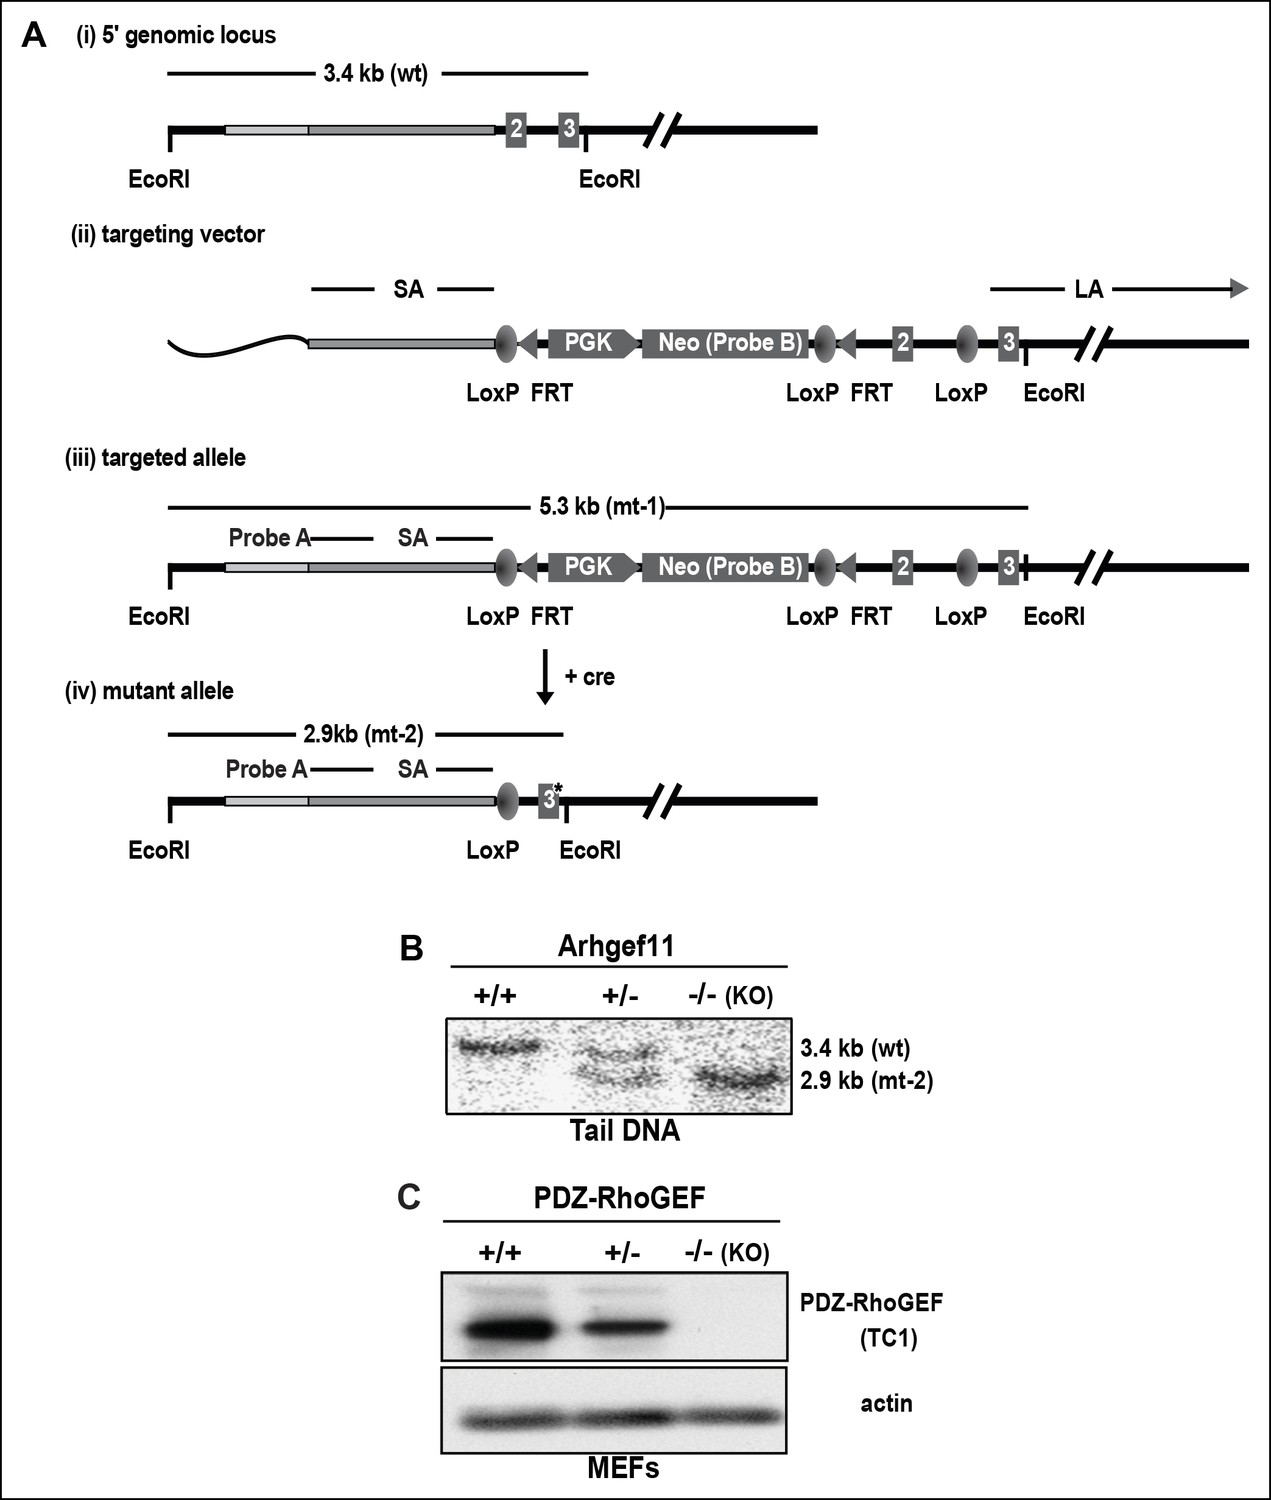
PDZ-RhoGEF gene targeting in the mouse.
(A) PDZ-RhoGEF targeting strategy (i) The 5’ genomic region of PDZ-RhoGEF (wild-type, WT), (ii) the gene targeting vector, (iii) the targeted allele and (iv) the mutated allele (mt). Short arm (SA), long arm (LA), flanking probe (FP), neomycin (Neo), phosphoglycerol kinase promoter (PGK), cyclization recombinase (cre), flipase recognition target (FRT), and locus X over P1 (loxP), are indicated. (B) Southern blot analysis of gene deletion following genetic introduction of Cre recombinase. (C) Confirmation of PDZ-RhoGEF deletion by immunoblotting with anti-PDZ-RhoGEF antibody (TC1).
Figure 1—figure supplement 2
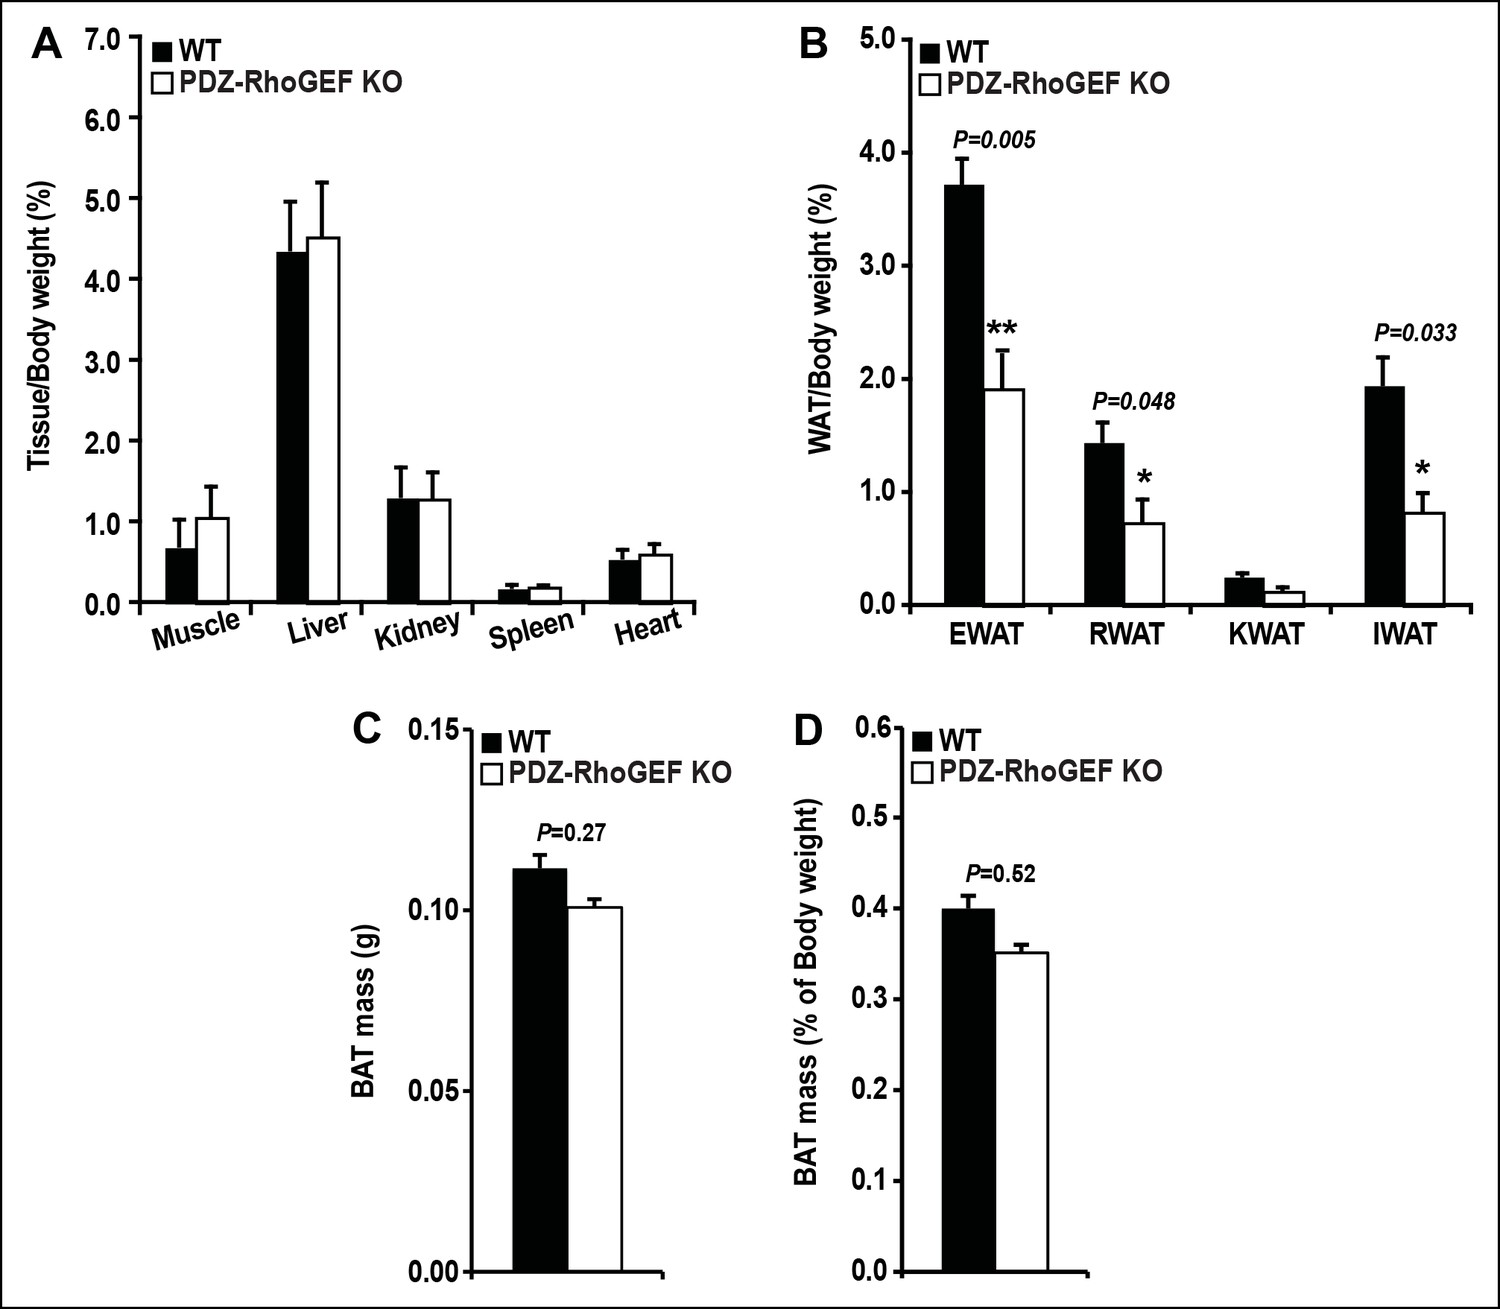
Tissue mass of WT and PDZ-RhoGEF KO mice.
(A) Tissue mass from NCD-fed WT and PDZ-RhoGEF KO mice after being normalized by body weight (n = 8). (B) WAT mass from NCD-fed WT and PDZ-RhoGEF KO mice normalized by body weight (n = 8). (C) Total BAT mass from NCD-fed WT and PDZ-RhoGEF KO mice (n = 15–2015–20). (D) BAT mass from WT and PDZ-RhoGEF KO mice normalized by body weight as percent of body weight (n = 15–20). Statistical significance was calculated by a Student’s t test using Excel software (*p<0.05, **p<0.01, ***p<0.001).
Figure 1—figure supplement 3
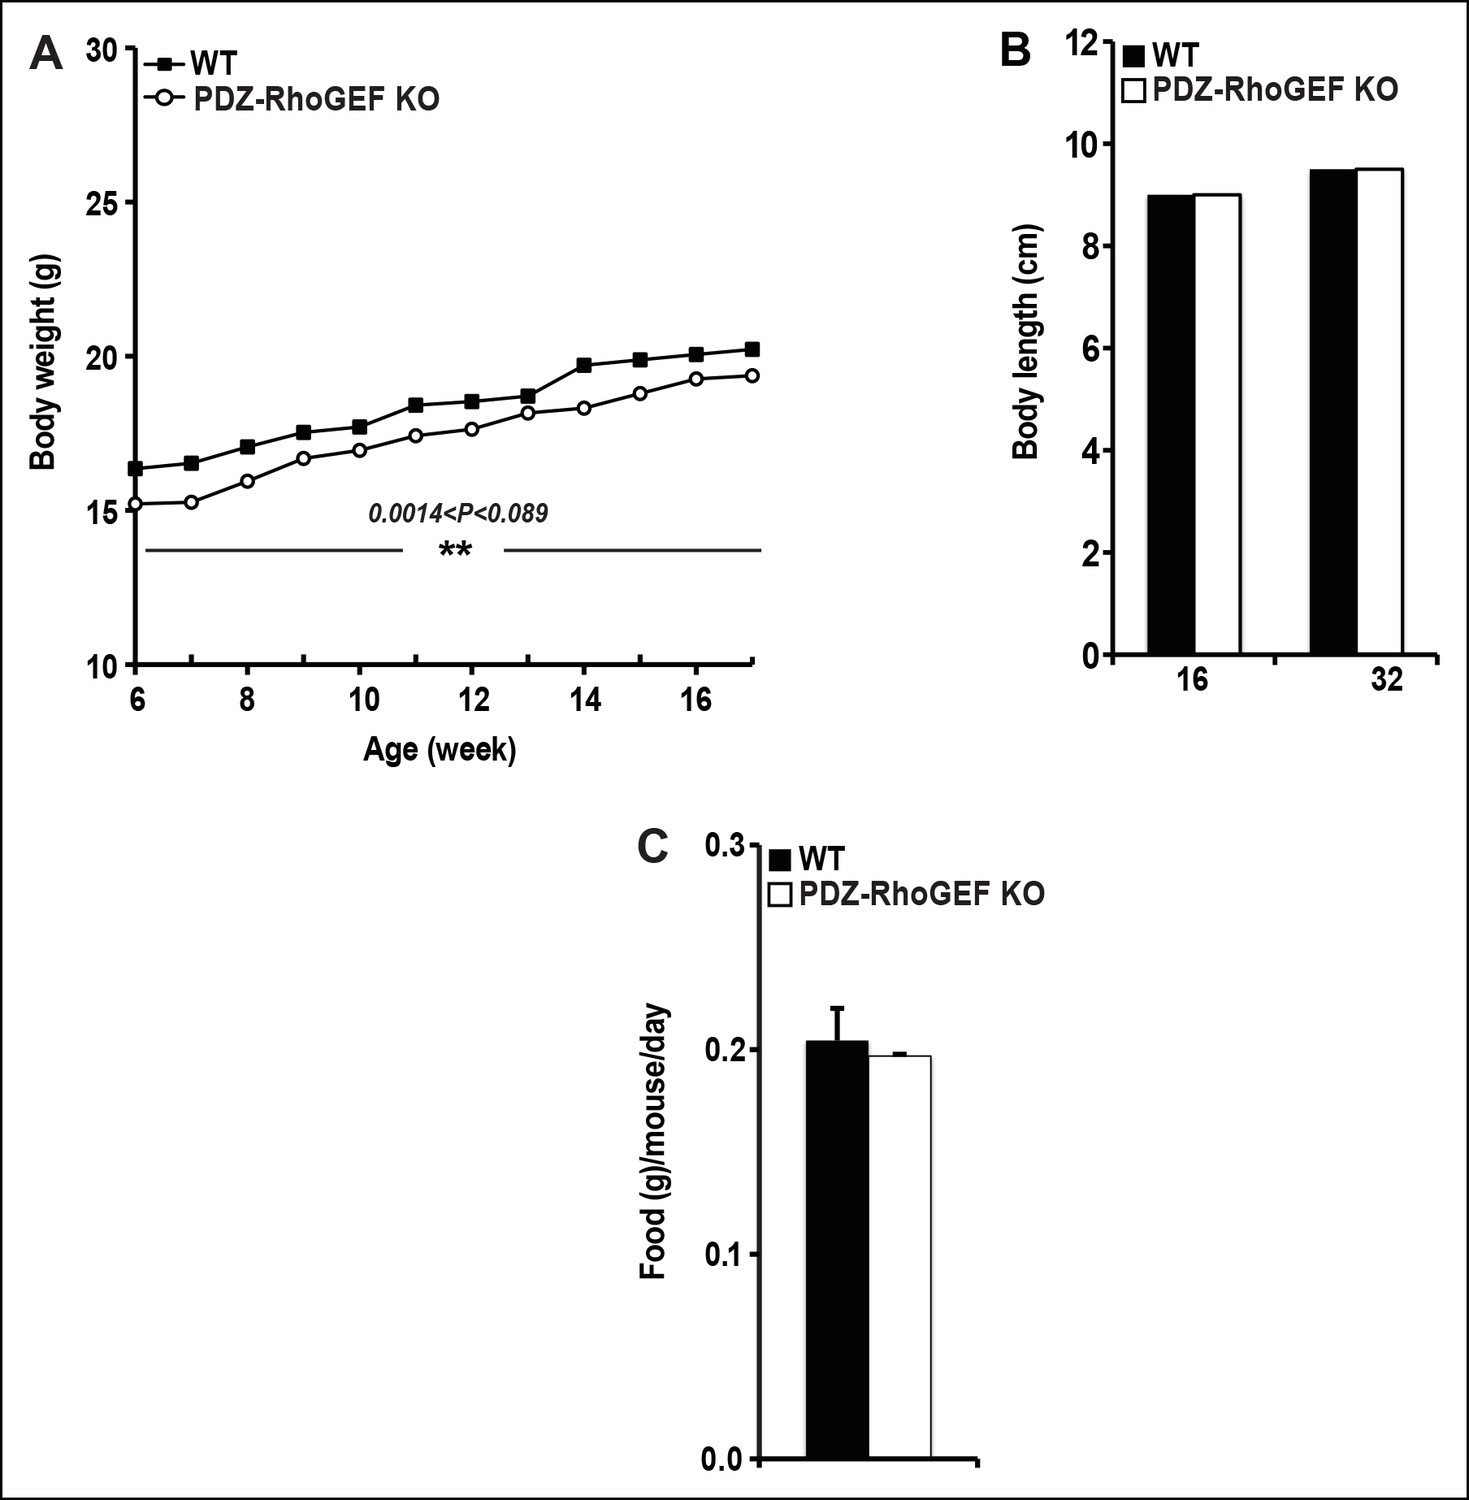
The body weight, body size, and food intake of WT and PDZ-RhoGEF KO mice.
( A) Body weight of female mice on NCD (n = 12–13). (B) The size of WT and PDZ-RhoGEF KO male mice determined by measuring the length from tip of nose to anus at 16 weeks (n = 6–7) and 32 weeks of age (n = 7–11). (C) Food intake in WT and PDZ-RhoGEF KOmalemice (n = 5). Food intake per mouse was measured every two days over 15-day period. Statistical significance was calculated by a Student’s t test using Excel software (*p<0.05, **p<0.01, ***p<0.001).
Figure 2 with 2 supplements
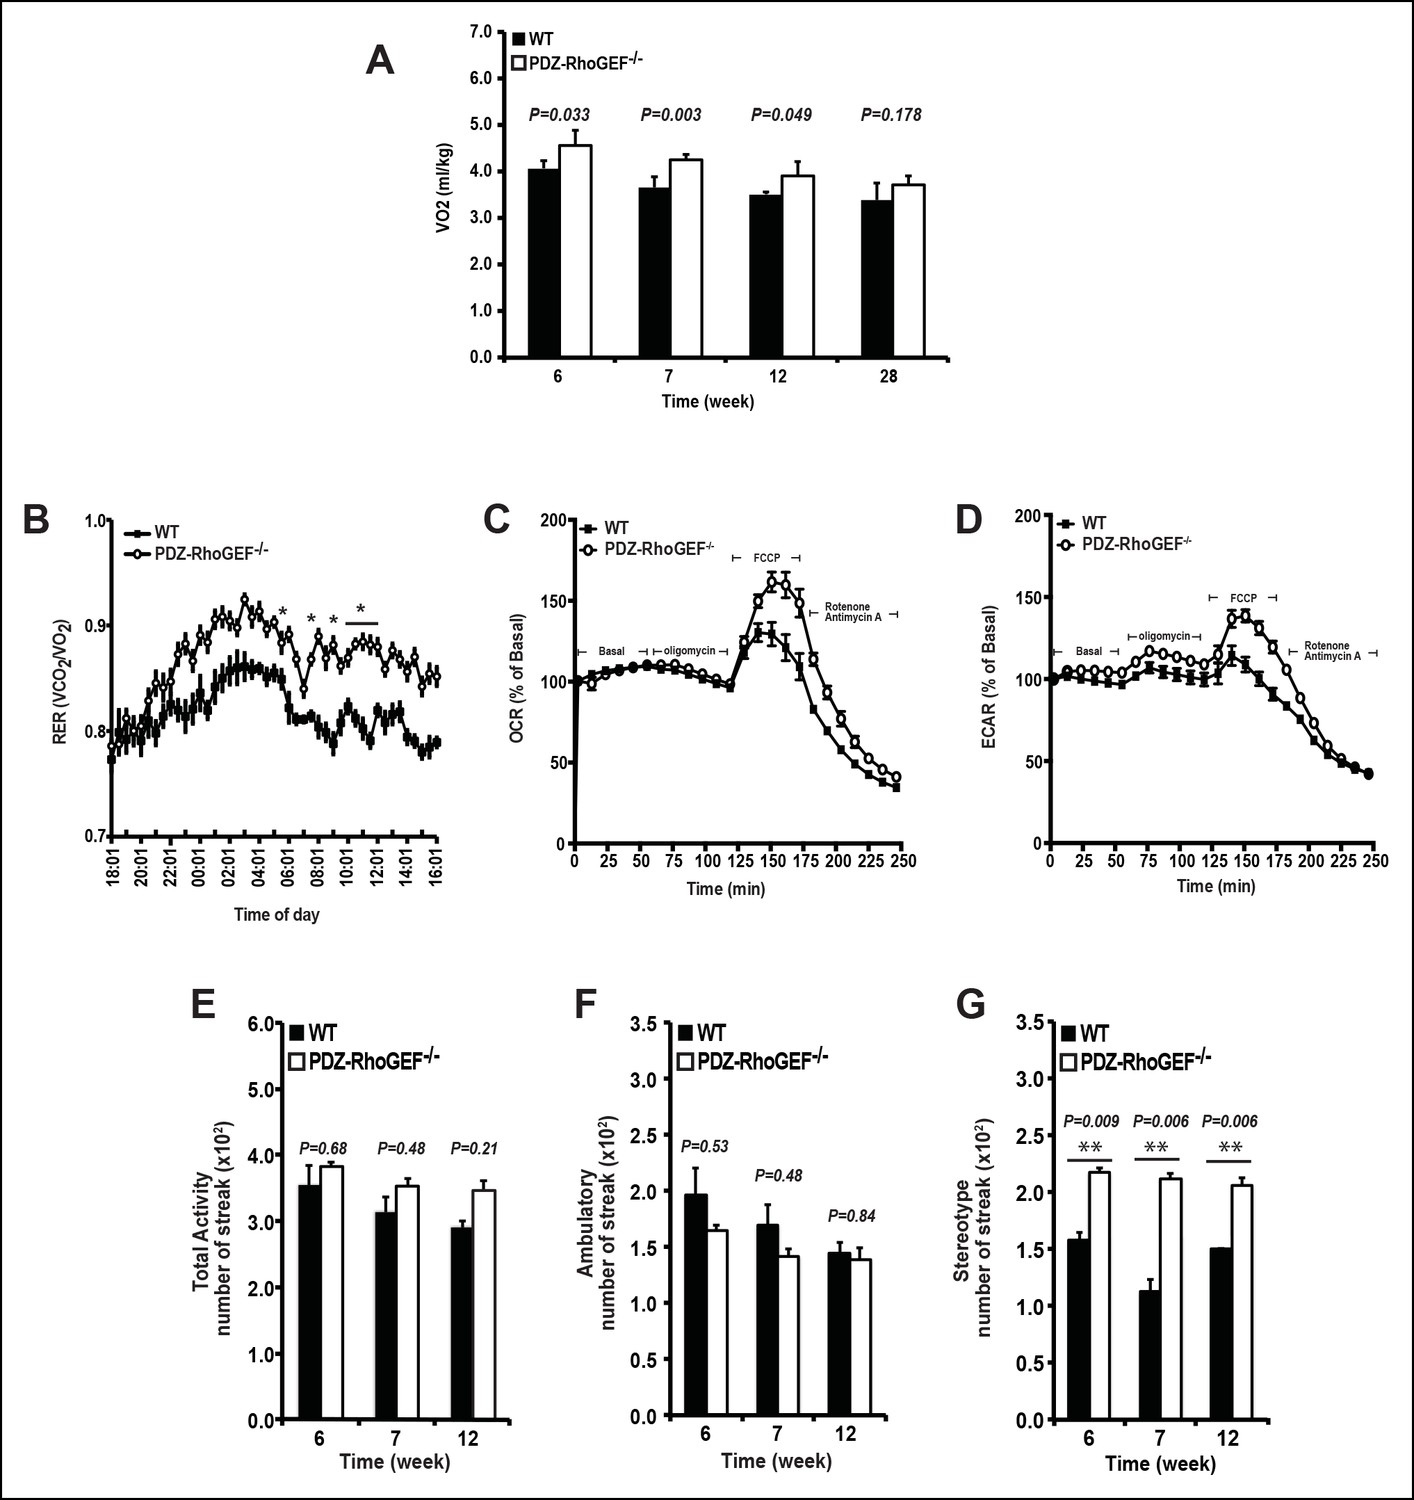
The effect of PDZ-RhoGEF on energy expenditure.
(A) PDZ-RhoGEF KO mice consumed more oxygen than the wild type mice (n = 4). (B) PDZ-RhoGEF KO mice have higher RER than wild type mice (n = 4–6). (C) Oxygen consumption rate (OCR) of EWAT determined in the presence of mitochondrial effectors, oligomycin A (10 μM), FCCP (10 μM), and rotenone (3 μM)/antimycin A (12 μM). The values are presented as percent of the basal OCR measured at time 0 (n = 3). (D) Glycolysis was assessed by ECAR normalized to basal ECAR and measured at time 0 (n = 3). (E-–G) Analysis of physical activity, including total activity (E), ambulatory (F), and stereotype activity (G). Statistical significance was calculated by a Student’s t test using Excel software (*p<0.05, **p<0.01, ***p<0.001).
Figure 2—figure supplement 1
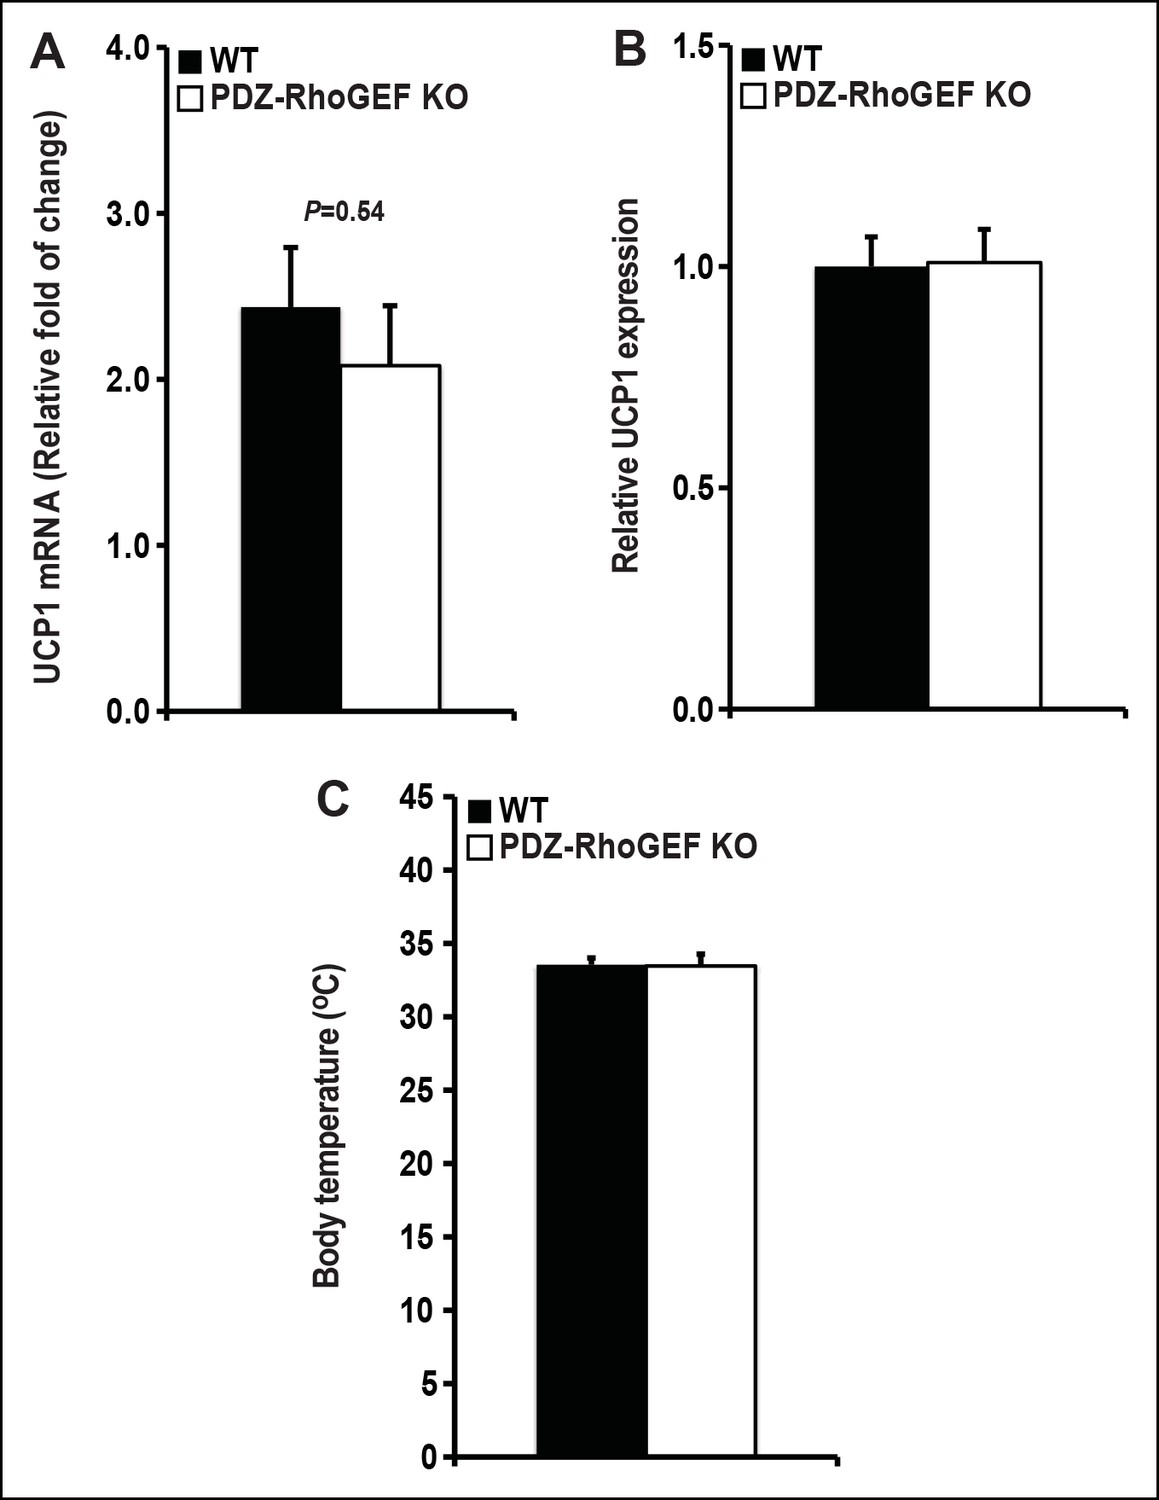
UCP 1 expression in BAT and core body temperature.
(A) UCP1 expression in brown fat was determined by qPCR normalized to internal control GAPDH (n = 4). (B) UCP1 expression in IWAT was determined by qPCR normalized to internal control GAPDH (n = 4–5). (C)The core body temperature determined by rectal thermometer (n = 5–6). Statistical significance was calculated by a Student’s t test using Excel software (*p<0.05, **p<0.01, ***p<0.001).
Figure 2—figure supplement 2
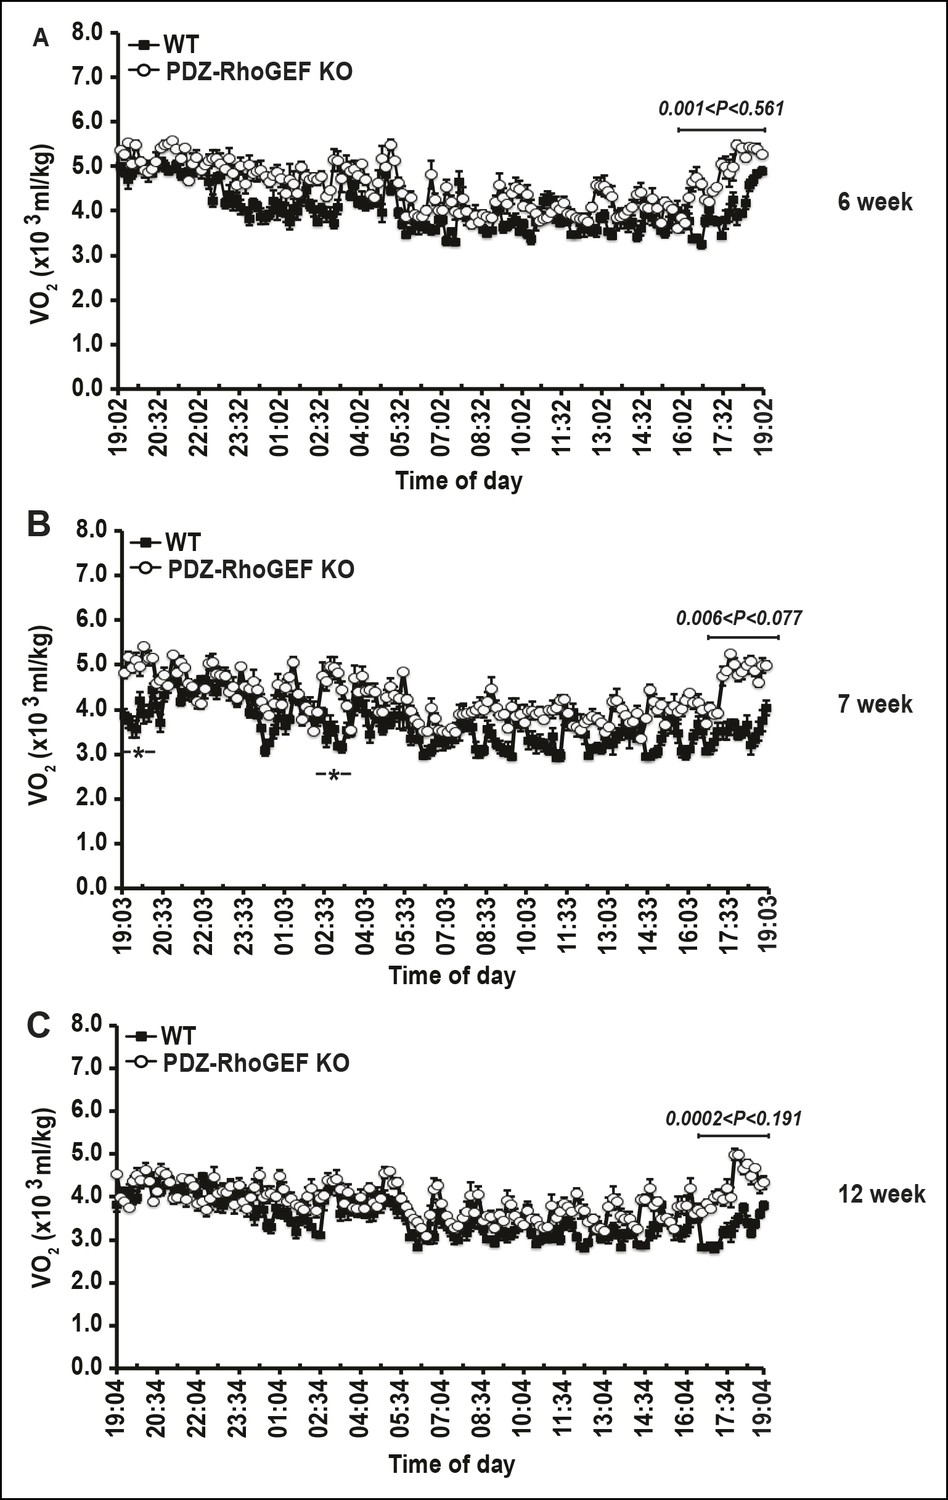
Energy homeostasis of male wild type and PDZ-RhoGEF KO mice at different ages.
(A–C) The time course of oxygen consumption rate (VO2) measured during light and dark periods under normal food (n = 4).
Figure 3 with 5 supplements
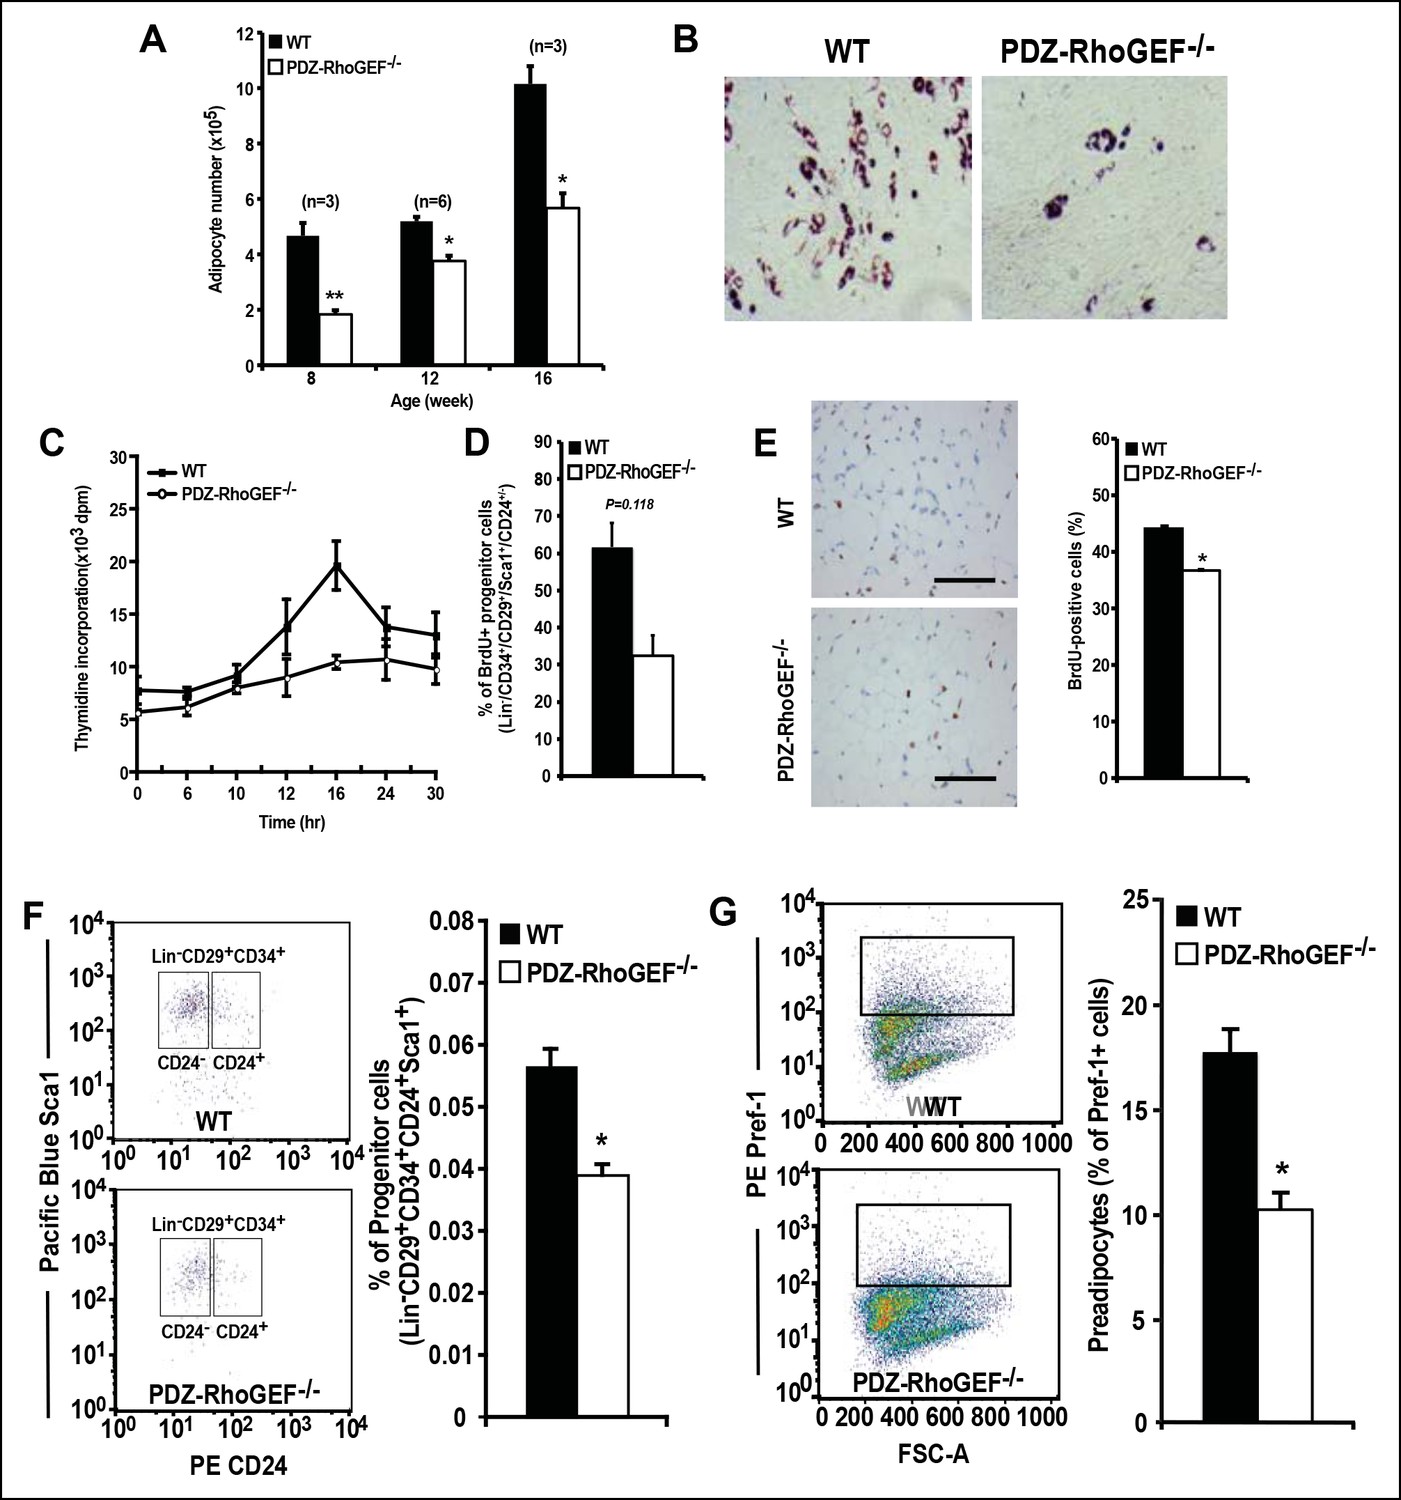
Reduced adipocytes and progenitors in PDZ-RhoGEF KO mice.
(A) Adipocyte numbers from 8-, 12-, 16-week old WT and PDZ-RhoGEF KO EWATs, (B) In vitro adipogenesis of EWAT ADSCs prepared from 16 week-old WT and PDZ-RhoGEF KO animals assessed by Oil Red-O staining. (C) DNA synthesis of EWAT-derived ADSCs upon insulin stimulation during MCE. (D) Adipogenitc progenitor cell proliferation presented as percent of BrdU + cells by FACS analysis under normal culture condition (n = 3). (E) Image and ImageJ quantification of BrdU-labeled EWATs from one-month old mice (n = 6–9). Bar scale = 100 μm (200X). Statistical significance was calculated by a Student’s t test using Excel software (*p<0.05, **p<0.01, ***p<0.001). (F) Stromal-vascular fraction from adult WT and PDZ-RhoGEF KO EWATs. EWAT was stained with adipogenic progenitor cells (CD29+/CD34+/CD24+/Sca1+) (n = 4). (G) Preadipocytes in WT and PDZ-RhoGEF KO EWAT stromal-vascular fraction were stained with preadipocyte marker, pref-1 (n = 3). Statistical significance was calculated by a Student’s t test using Excel software (*p<0.05, **p<0.01, ***p<0.001).
Figure 3—figure supplement 1
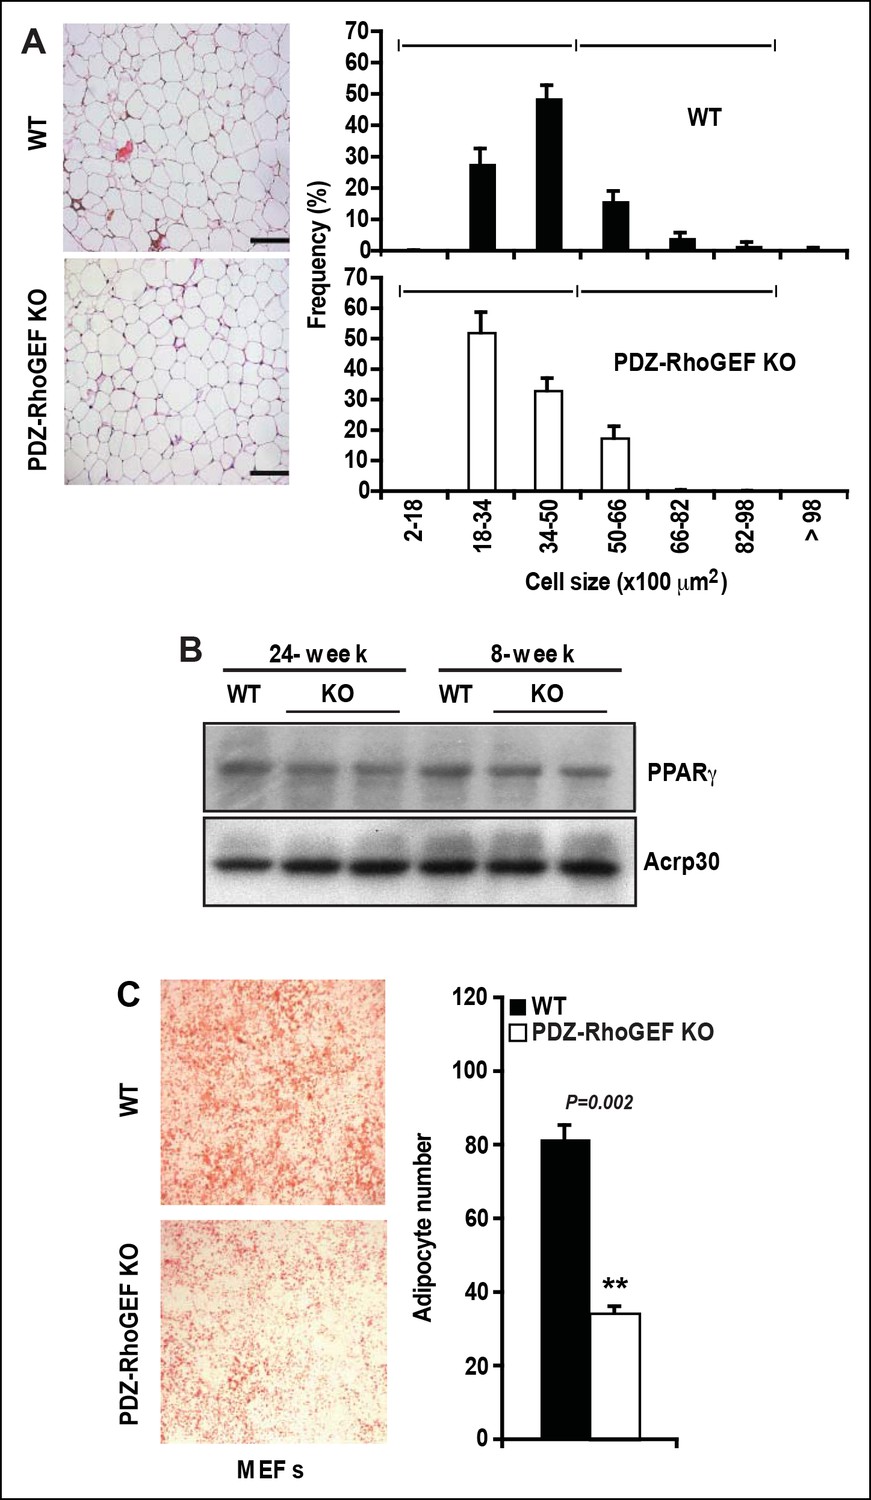
Cell size, adipogenic potential, and in vitro adipogenesis.
(A) Morphometric analysis of epididymal adipocyte cell size of WT and PDZ-RhoGEF KO mice (n = 5–7). Scale bar = 100 μm (100X). (B) The protein levels of PPARγ and adiponectin (Acrp30) in EWAT from 24- and 8-week old WT and PDZ-RhoGEF KO mice. Statistical significance was calculated by a Student’s t test using Excel software (*p<0.05, **p<0.01, ***p<0.001). (C) In vitro adipogenesis of MEFs (E14.5) from WT and PDZ-RhoGEF KO assessed by Oil Red-O staining (n = 3). Statistical significance was calculated by a Student’s t test using Excel software (*p<0.05, **p<0.01, ***p<0.001).
Figure 3—figure supplement 2
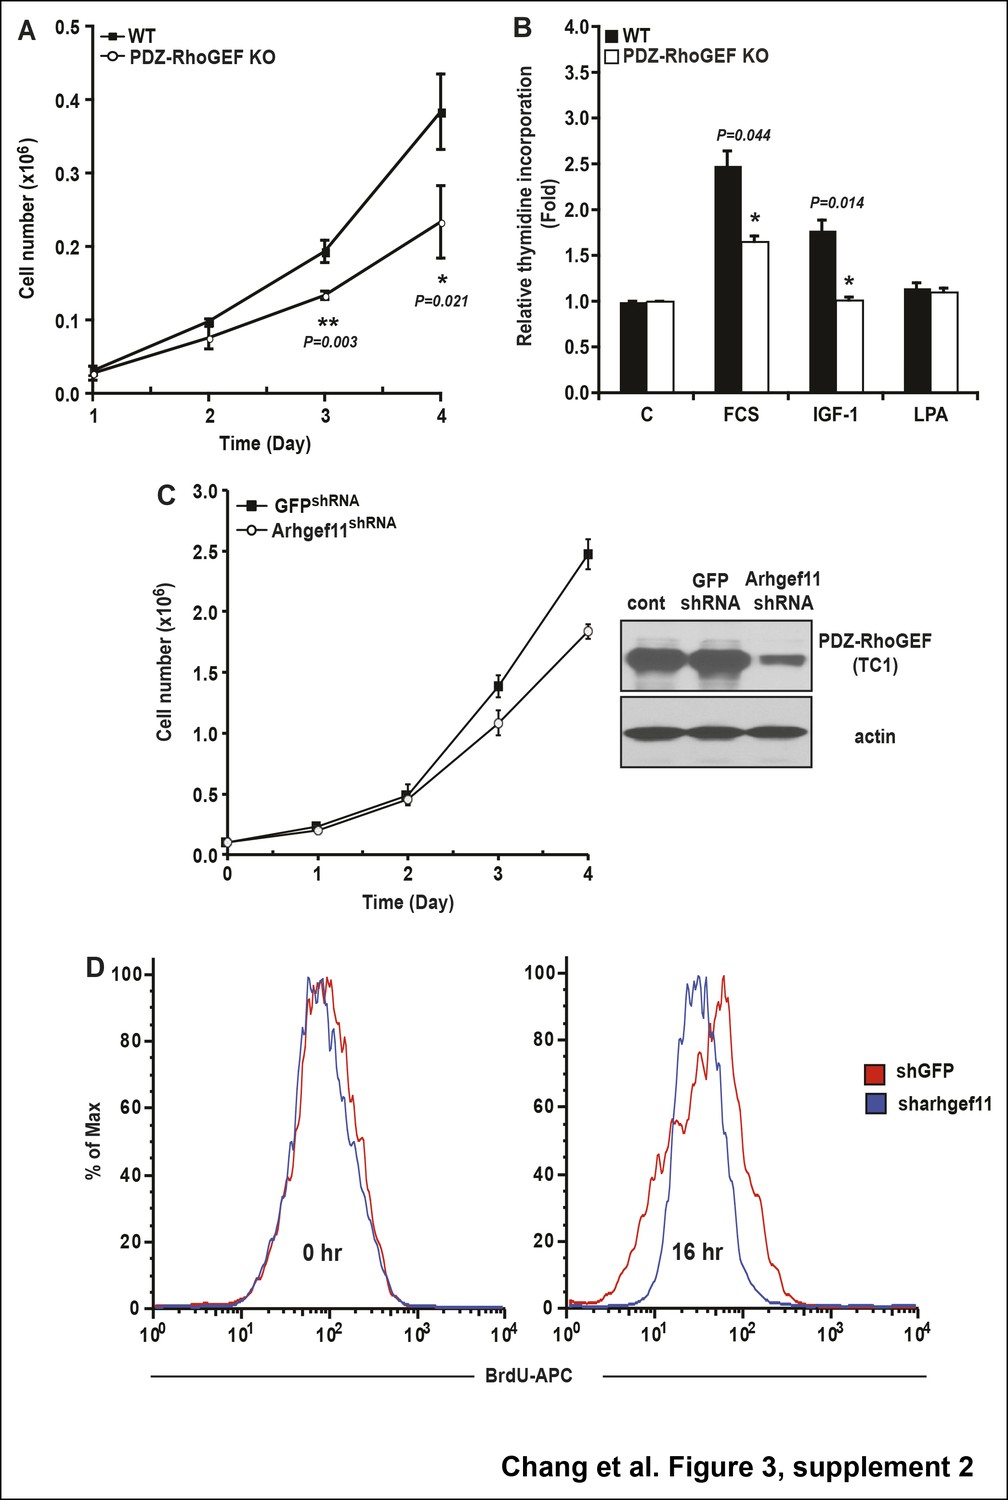
The role of PDZ-RhoGEF in cell proliferation.
(A) Impaired proliferation of PDZ-RhoGEF KO MEFs grown in FCS. Cells were counted on the indicated days (n = 3). (B) [3H]-thymidine incorporation of WT and PDZ-RhoGEF KO MEFs in response to the indicated factors (n = 3). Statistical significance was calculated by a Student’s t test using Excel software (*p<0.05, **p<0.01, ***p<0.001). (C) Impaired proliferation of 3T3-L1 preadipocytes with reduced PDZ-RhoGEF expression under normal culture condition. Cells were counted on the indicated days. Expression of PDZ-RhoGEF was determined by immunoblotting (control: parental 3T3-L1). (D)Impaired insulin-mediated cell proliferation in 3T3-L1 preadipocytes when PDZ-RhoGEF expression was reduced, judged by percent of BrdU + cells, representative of three independent experiments.
Figure 3—figure supplement 3
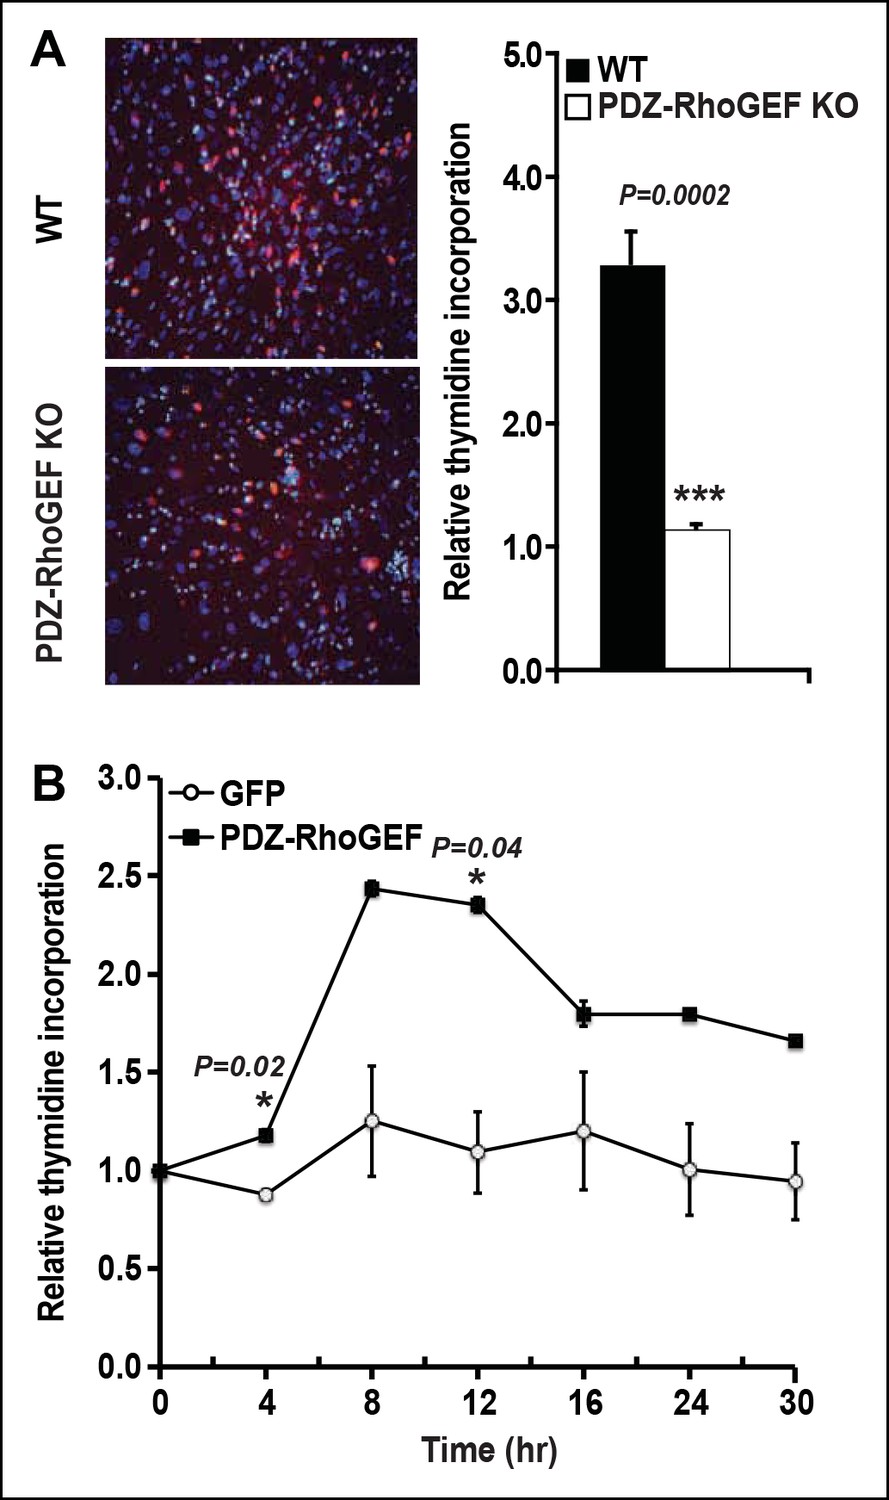
PDZ-RhoGEF regulates clonal expansion during adipocyte differentiation in vitro.
(A)Reduction of post-confluent mitosis determined by [3H}-thymidine incorporation and mitotic clonal expansion in PDZ-RhoGEF KO MEFs during in vitro adipogenesis, pulsed-chased by BrdU + (Red) and counterstained by DAPI (Blue). (B)Overexpression of PDZ-RhoGEF resulted in increased DNA synthesis in 3T3-L1 cells after induction of adipogenesis. Statistical significance was calculated by a Student’s t test using Excel software (*p<0.05, **p<0.01, ***p<0.001).
Figure 3—figure supplement 4
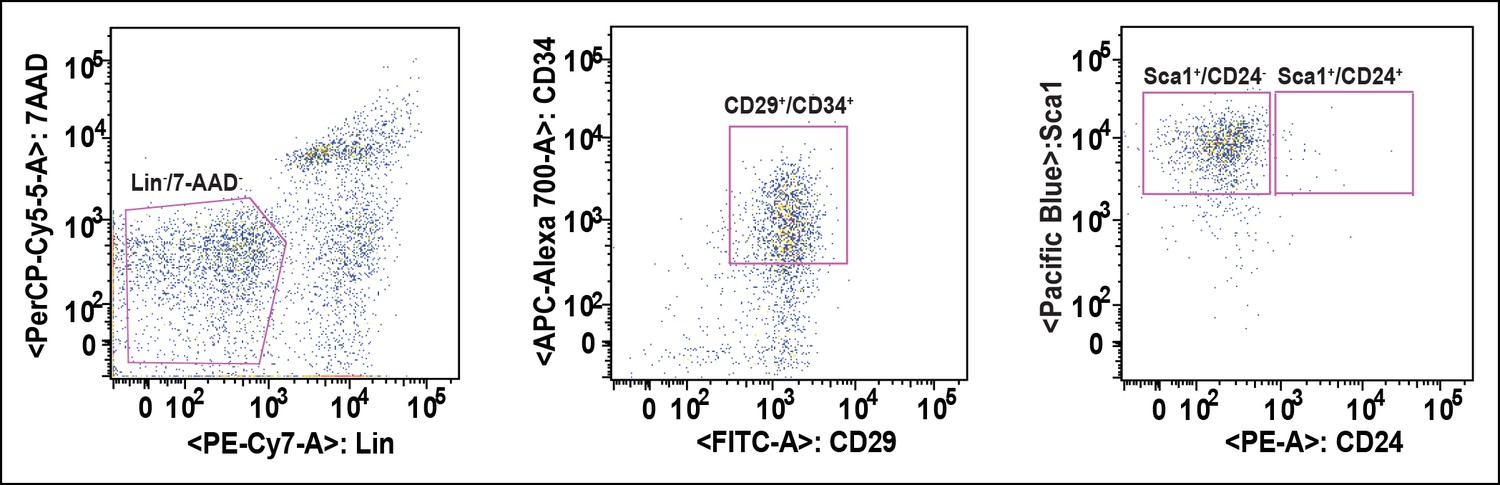
Strategy of FACS-based purification of adipogenic progenitor cells.
Adipogenic progenitor cells were sorted from the adipogenic progenitor specific maker-labeled SVF suspensions with AriaII (Becton Dickson) cell sorter, and the purity of sorted cells verified as >95% by rerunning the sorted population.
Figure 3—supplement 5
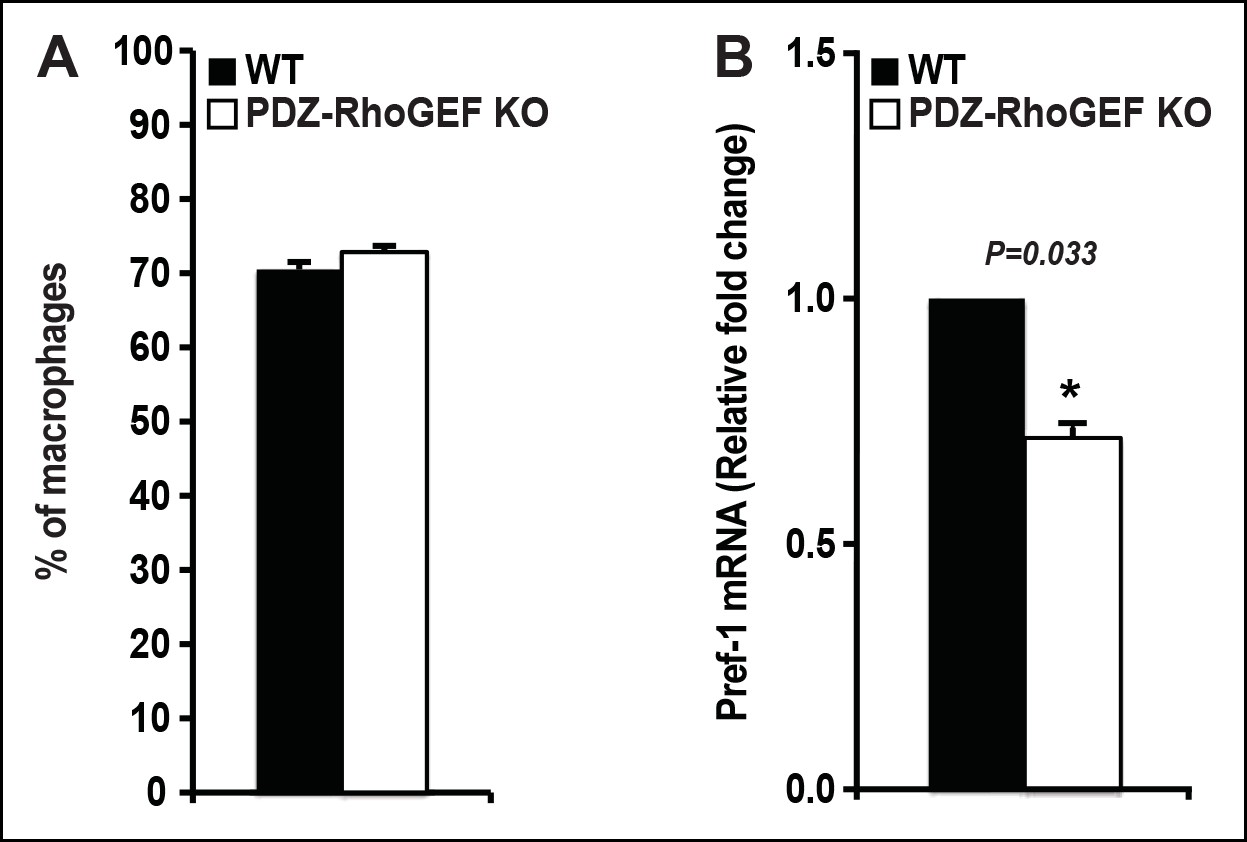
The proportion of resident/infiltrating adipose tissue macrophages and the expression of preadipocyte marker (Pref-1) from NCD-fed WT and PDZ-RhoGEF KO mice.
(A) Quantification of adipose tissue macrophages (n = 6–9) from 4 weeks old WT and PDZ-RhoGEF KO mice. (B) The levels of Pref-1 mRNA in 16 weeks old WT and PDZ-RhoGEF KO EWAT SVF were determined by qPCR (n = 4). Statistical significance was calculated by a Student’s t test using Excel software (*p<0.05, **p<0.01, ***p<0.001).
Figure 4 with 1 supplement
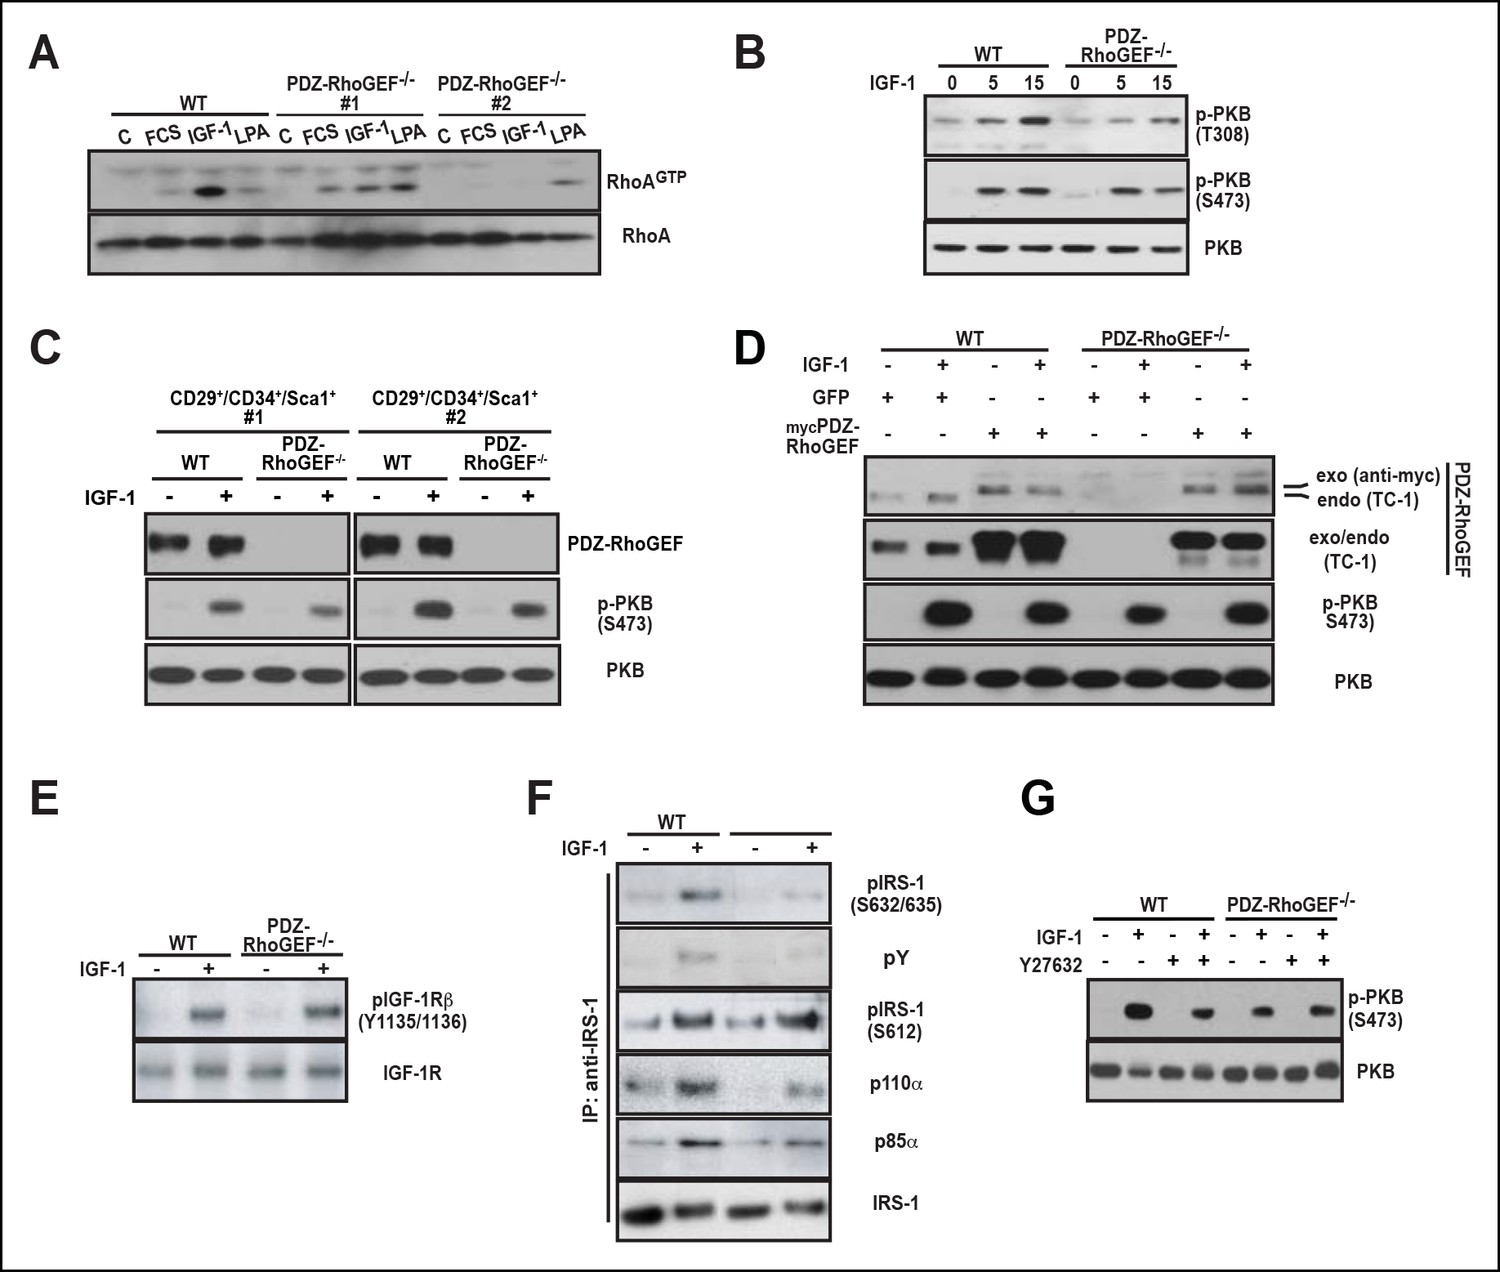
PDZ-RhoGEF is required for the optimal IGF-1 signaling output in MEFs and adipogenic progenitor cells.
(A) RhoA activation was determined by the RBD-binding assay in response to the indicated factors (FCS [10%], IGF-1 [100 ng/ml], LPA [20 μM]). (B) Differential PKB/Akt phosphorylation in WT and PDZ-RhoGEF KO MEFs in response to IGF-1. (C) Differential PKB/Akt phosphorylation and PDZ-RhoGEF expression in WT and PDZ-RhoGEF KO adipogenic progenitor cells in response to IGF-1. (D) IGF-1 response of PDZ-RhoGEF KO MEFs is rescued by ectopic expression of myc-tagged PDZ-RhoGEF. (E) IGF-1 stimulated tyrosine phosphorylation of IR. (F) Serine phosphorylation of IRS1 and interaction between IRS1 and PI3K in WT and PDZ-RhoGEF KO MEFs in response to IGF-1. (G) Phosphorylation of PKB/Akt S473 in response to IGF-1 is dependent on ROCK activity.
Figure 4—figure supplement 1
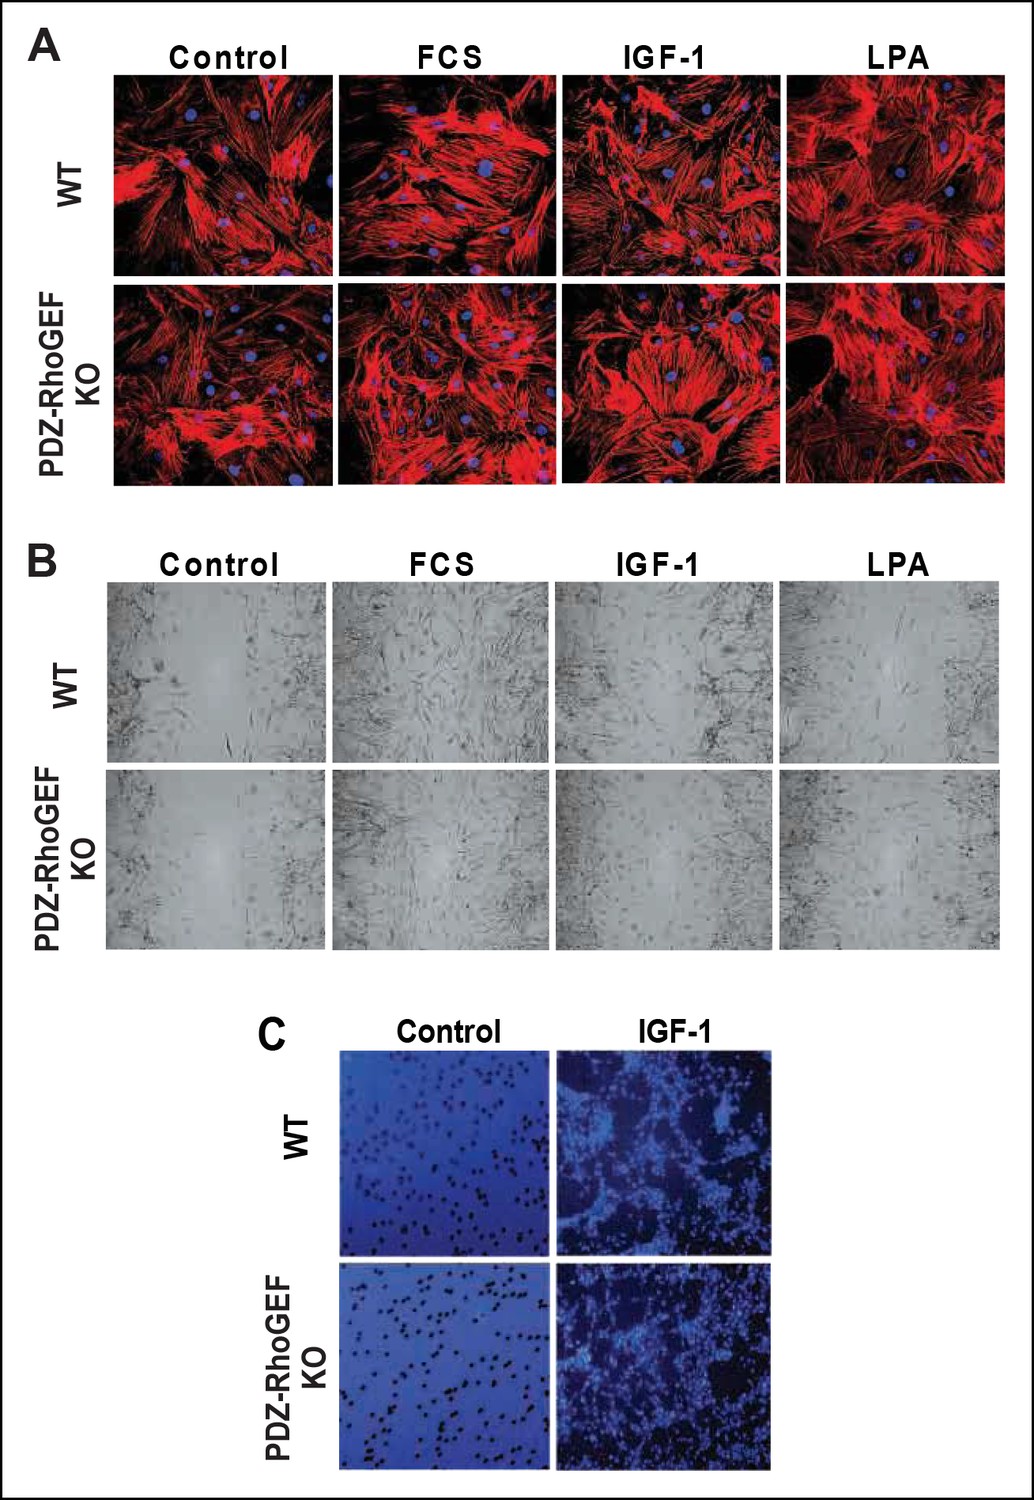
Stress fiber formation and mitogen-induced cell migration.
(A) Stress fiber formation 15 min after mitogen stimulation (FCS [10%], IGF-1 [100 ng/ml], LPA [20 μM]) was determined by phaloidin-rhodamine staining (B) Twenty-four hours after mitogen stimulation (as in [A]), cell migration of MEFs with the indicated genotypes was determined by a wound-healing assay. (C) Six hours after plating, IGF-1-induced migration of MEFs with the indicated genotypes was determined by the transwell migration assay.
Figure 5 with 1 supplement
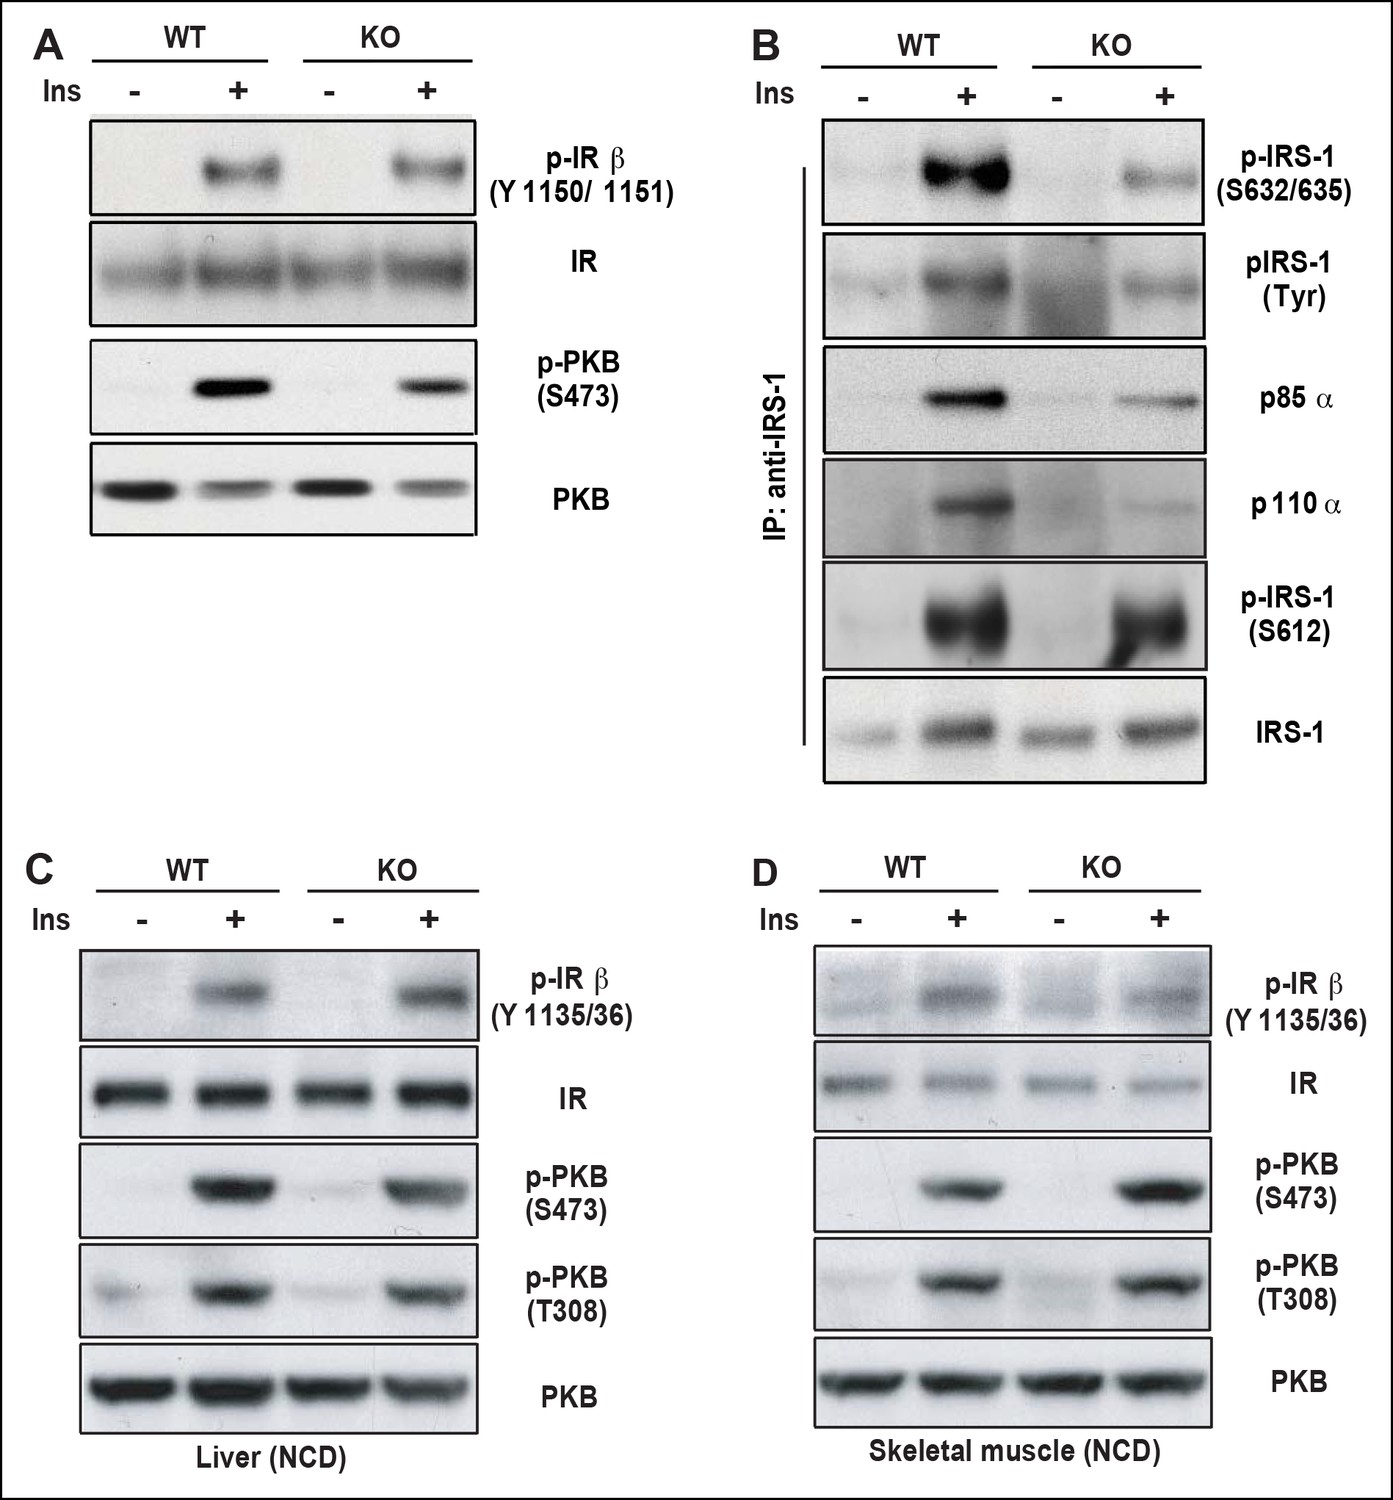
PDZ-RhoGEF is required for optimal IGF-1 signaling output in EWAT.
(A) IR phosphorylation and differential PKB/Akt phosphorylation in WT and PDZ-RhoGEF KO EWAT in response to insulin. (B) Serine phosphorylation of IRS1 and interaction between IRS1 and PI3K in WT and PDZ-RhoGEF KO EWAT in response to insulin. (C) IR phosphorylation and differential PKB/Akt phosphorylation in WT and PDZ-RhoGEF KO liver in response to insulin. (D) IR phosphorylation and differential PKB/Akt phosphorylation in WT and PDZ-RhoGEF KO skeletal muscle in response to insulin.
Figure 5—figure supplement 1
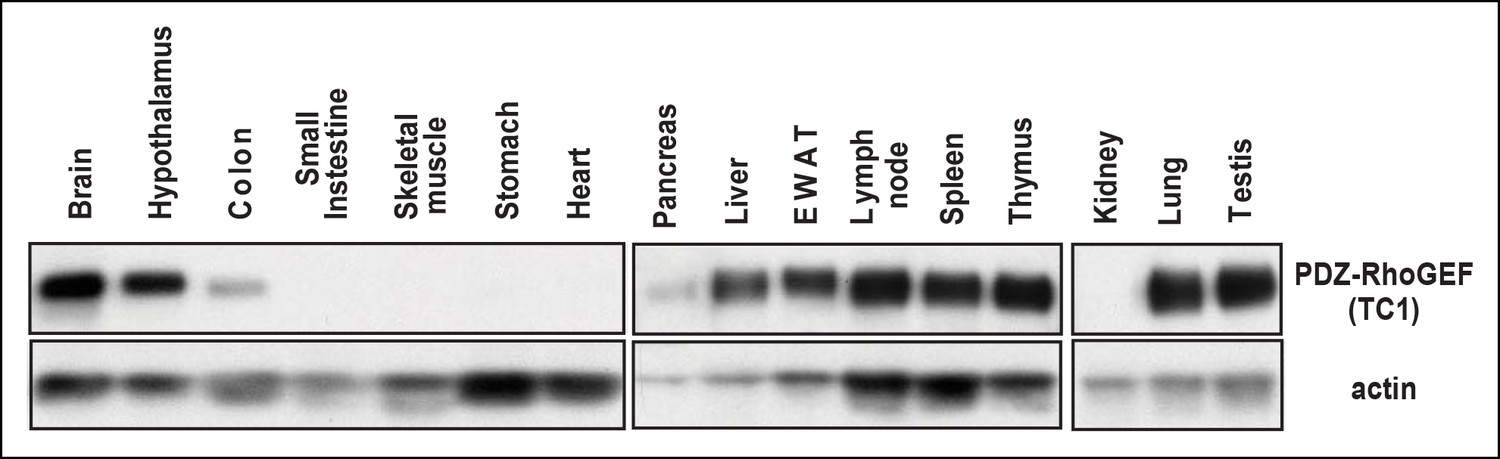
The tissue expression profile of PDZ-RhoGEF.
The indicated tissue lysates were immunoblotted with the anti-PDZ-RhoGEF antibody.
Figure 6 with 4 supplements
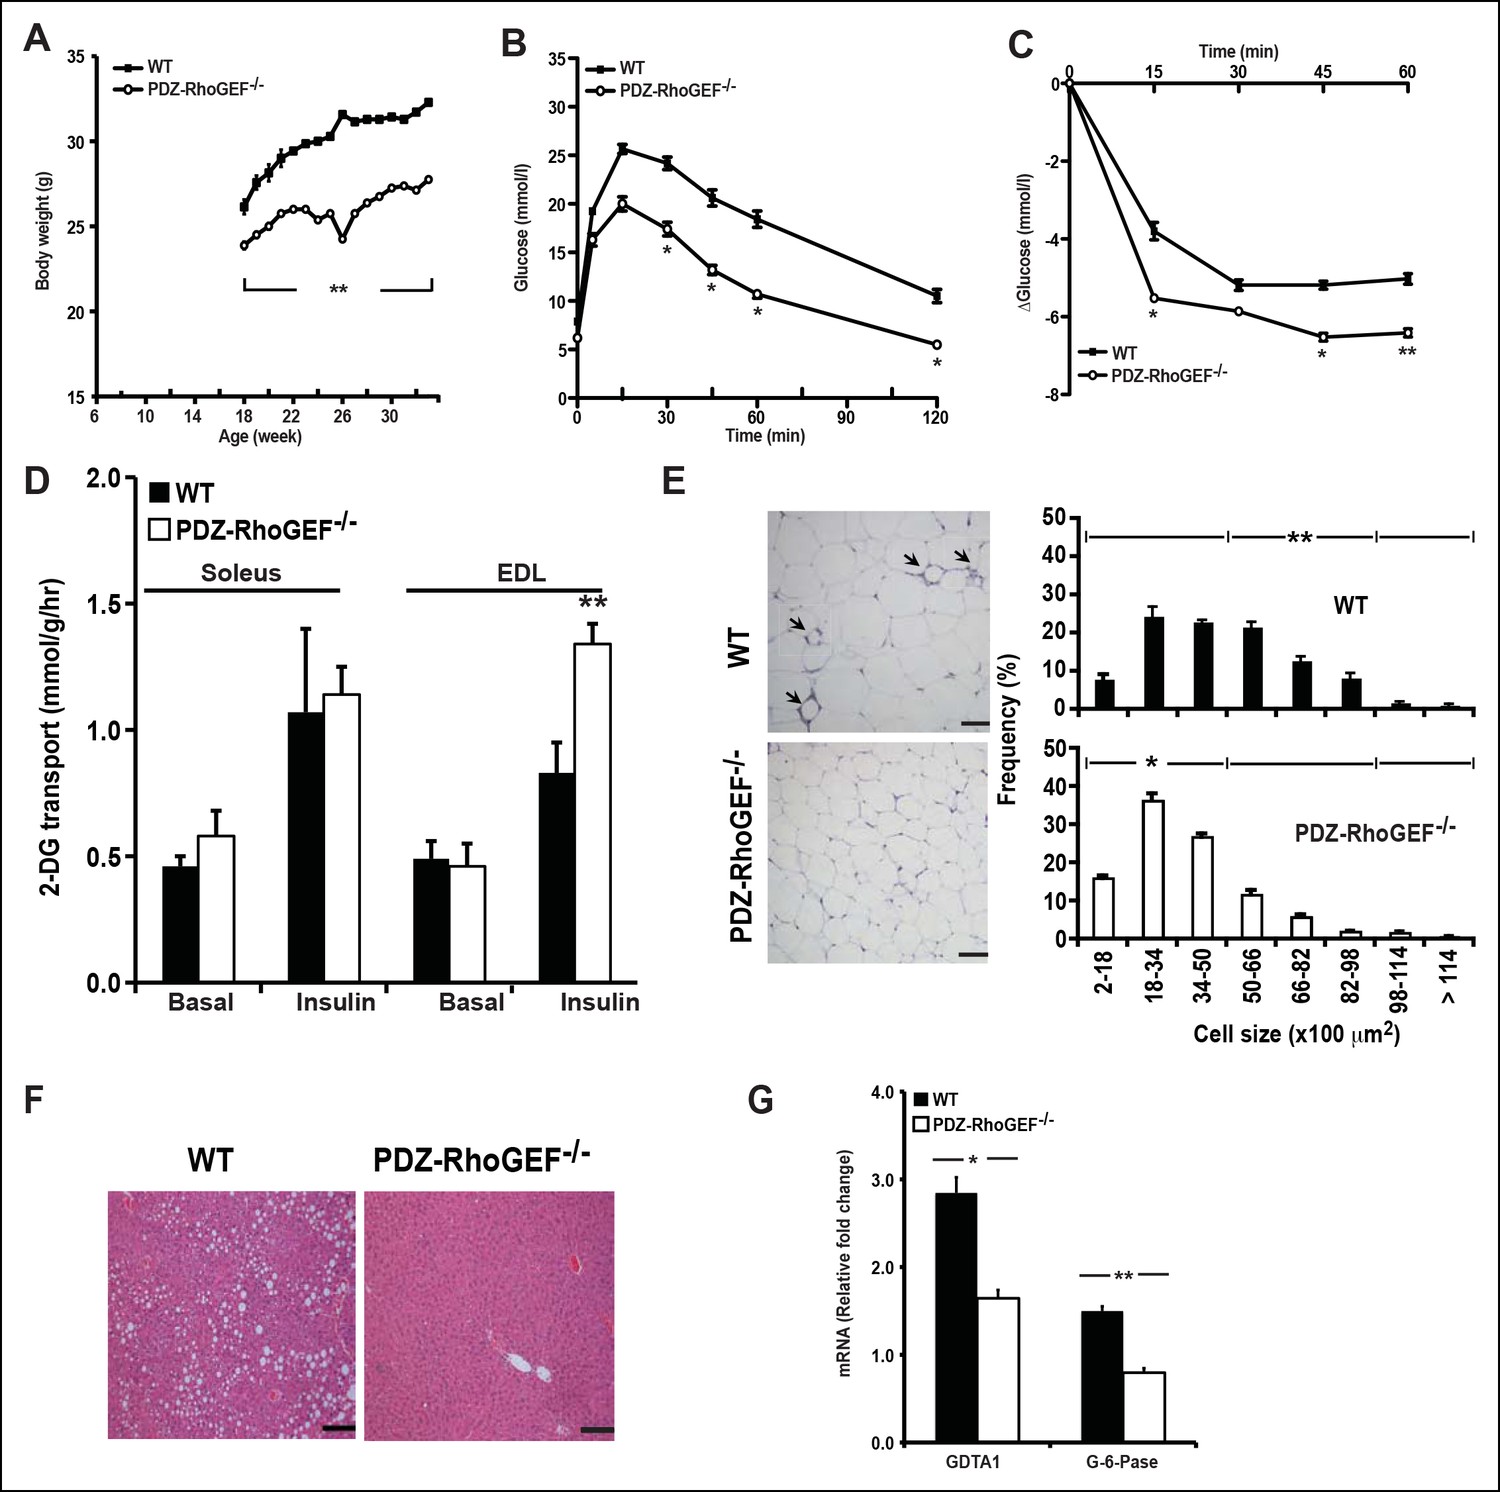
PDZ-RhoGEF deficiency protects animals from diet-induced obesity, glucose intolerance and insulin resistance.
(A) The body weight of mice switched to HFD at 18 weeks of age was monitored for 14 weeks (n = 8). (B) GTT on overnight fasted 32-wk old mice after 14 weeks on HFD (n = 4). (C) Insulin-mediated glucose excursion in mice described in (B) determined by ITT (n = 8). (D) Ex vivo glucose transport in isolated skeletal muscles (Soleus and EDL) from HFD-fed animals (n = 4). Statistical significance was calculated by a Student’s t test using Excel software (*p<0.05, **p<0.01, ***p<0.001). (E) Morphometric analysis of epididymal adipocyte cell size and crown-like structure (arrows) in WT and PDZ-RhoGEF KO mice (n = 4–6). Scale bar = 100 μm (100X). (F) Histological analysis of representative liver sections from WT and PDZ-RhoGEF KO mice. Scale bar = 100 μm (100X). (G) The mRNA expression of DGAT1 and G-6-Pase in liver from HFD-fed animals (n = 4). Statistical significance was calculated by a Student’s t test using Excel software (*p<0.05, **p<0.01, ***p<0.001).
Figure 6—figure supplement 1
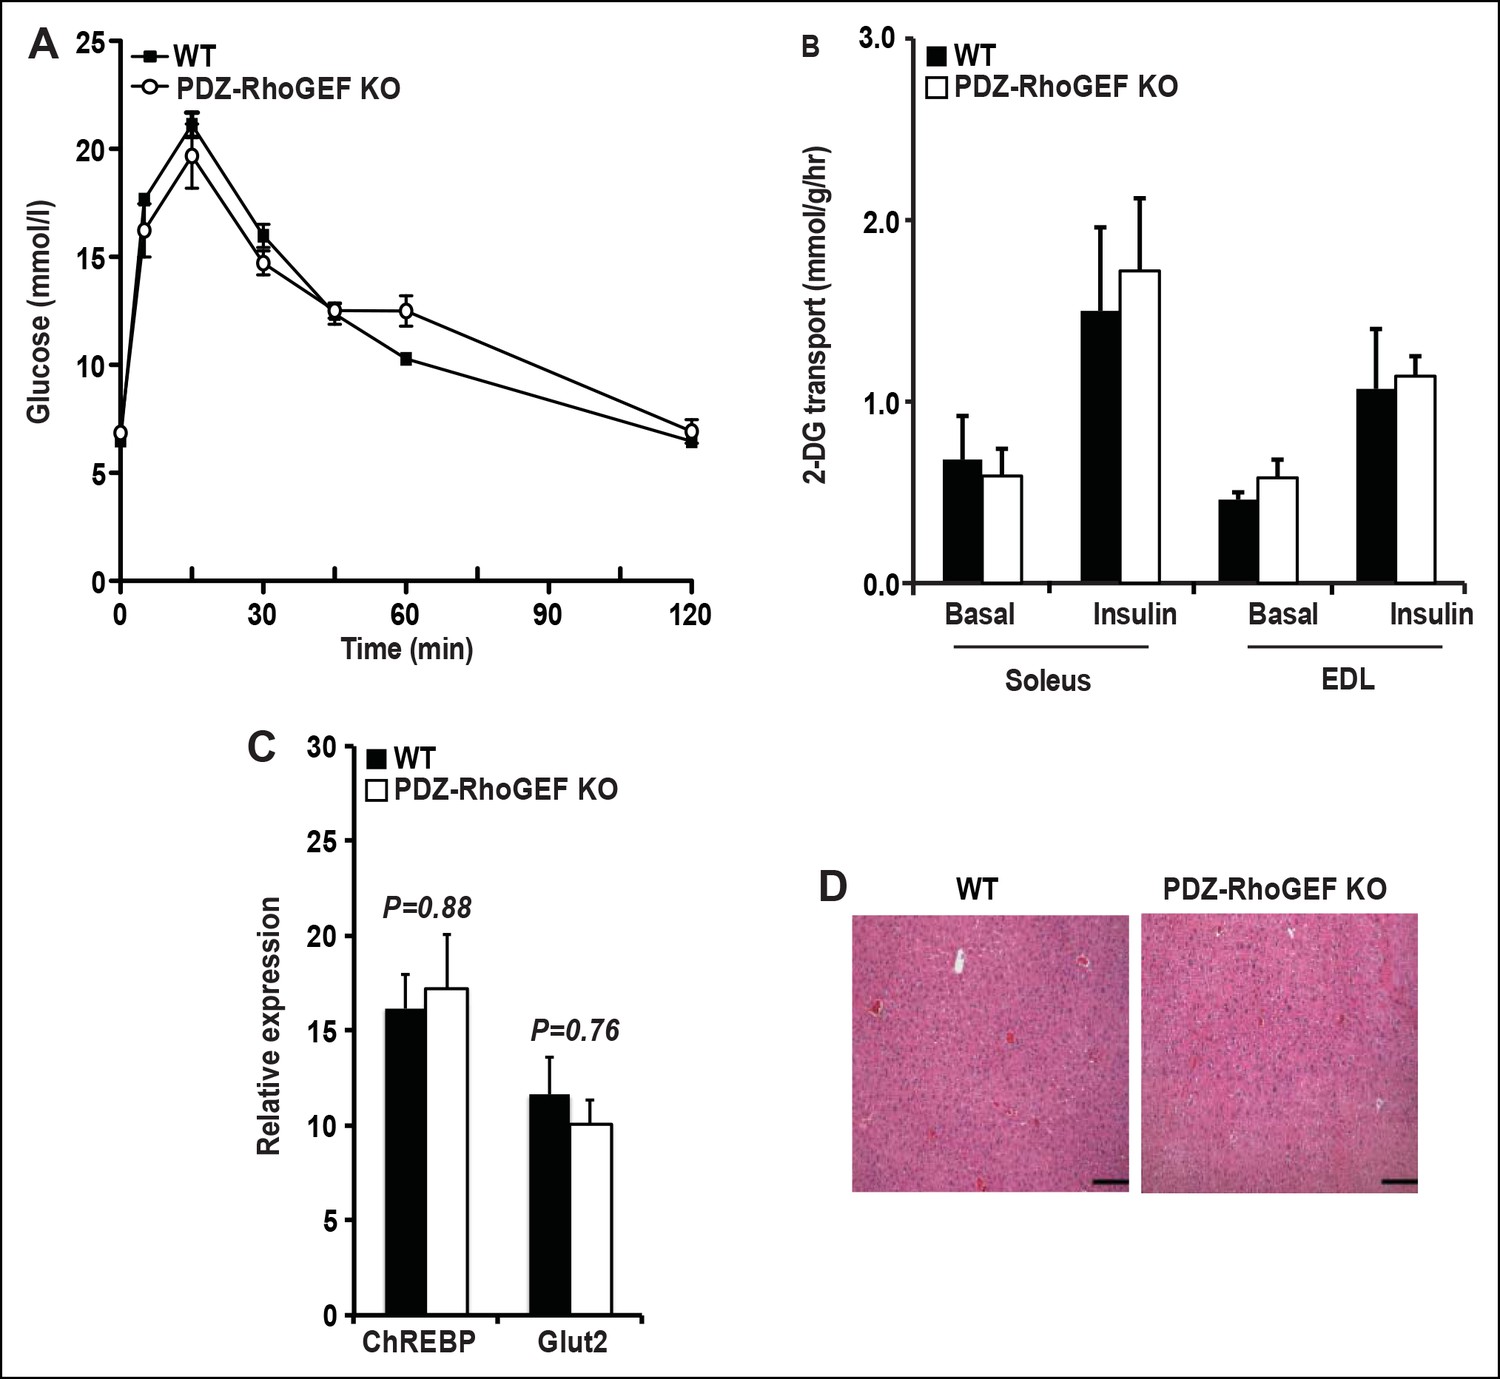
Glucose metabolism in WT and PDZ-RhoGEF KO mice under normal diet.
(A) Glucose tolerance test in NCD-fed WT and PDZ-RhoGEF KO mice (n = 8). (B)Glucose transport in isolated skeletal muscles from mice under NCD (n = 4). (C)The level of mRNA of ChREBP and Glut2 in the liver (n = 4). (D)Histological analysis of representative liver H&E stained sections from NCD-fed WT and PDZ-RhoGEF KO mice. Scale bar = 100 μm (100X). Statistical significance was calculated by a Student’s t test using Excel software (*p<0.05, **p<0.01, ***p<0.001).
Figure 6—figure supplement 2

Adiposity and food consumption in WT and PDZ-RhoGEF KO mice under high-fat diet.
(A). The body weight of mice switched to HFD at 6-weeks of age was monitored for 16 weeks (n = 4). (B) Anatomical quantification of fat mass from mice of late-onset group after 24 weeks under HFD (n = 8). (C) Anatomical quantification of fat mass from early-onset group after 16 weeks under HFD (n = 4). (D) Food intake in WT and PDZ-RhoGEF KO mice (n = 4). Food intake per mouse was measured every week over 12-week period. Statistical significance was calculated by a Student’s t test using Excel software (*p<0.05, **p<0.01, ***p<0.001).
Figure 6—figure supplement 3
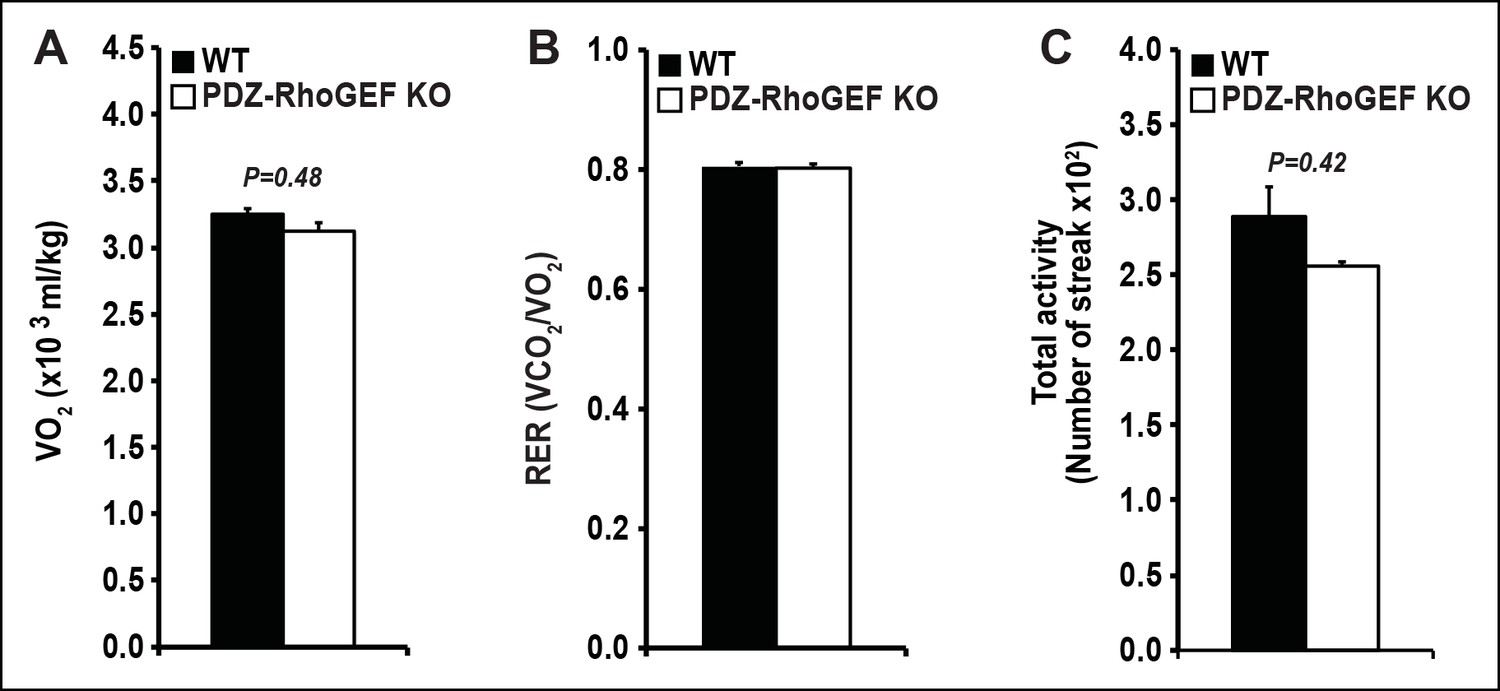
Energy expenditure of WT and PDZ-RhoGEF KO mice under HFD.
(A)The total oxygen consumption rate (VO2). (B) total RER. (C) total physical activity measured under HFD (n = 4).
Figure 6—figure supplement 4
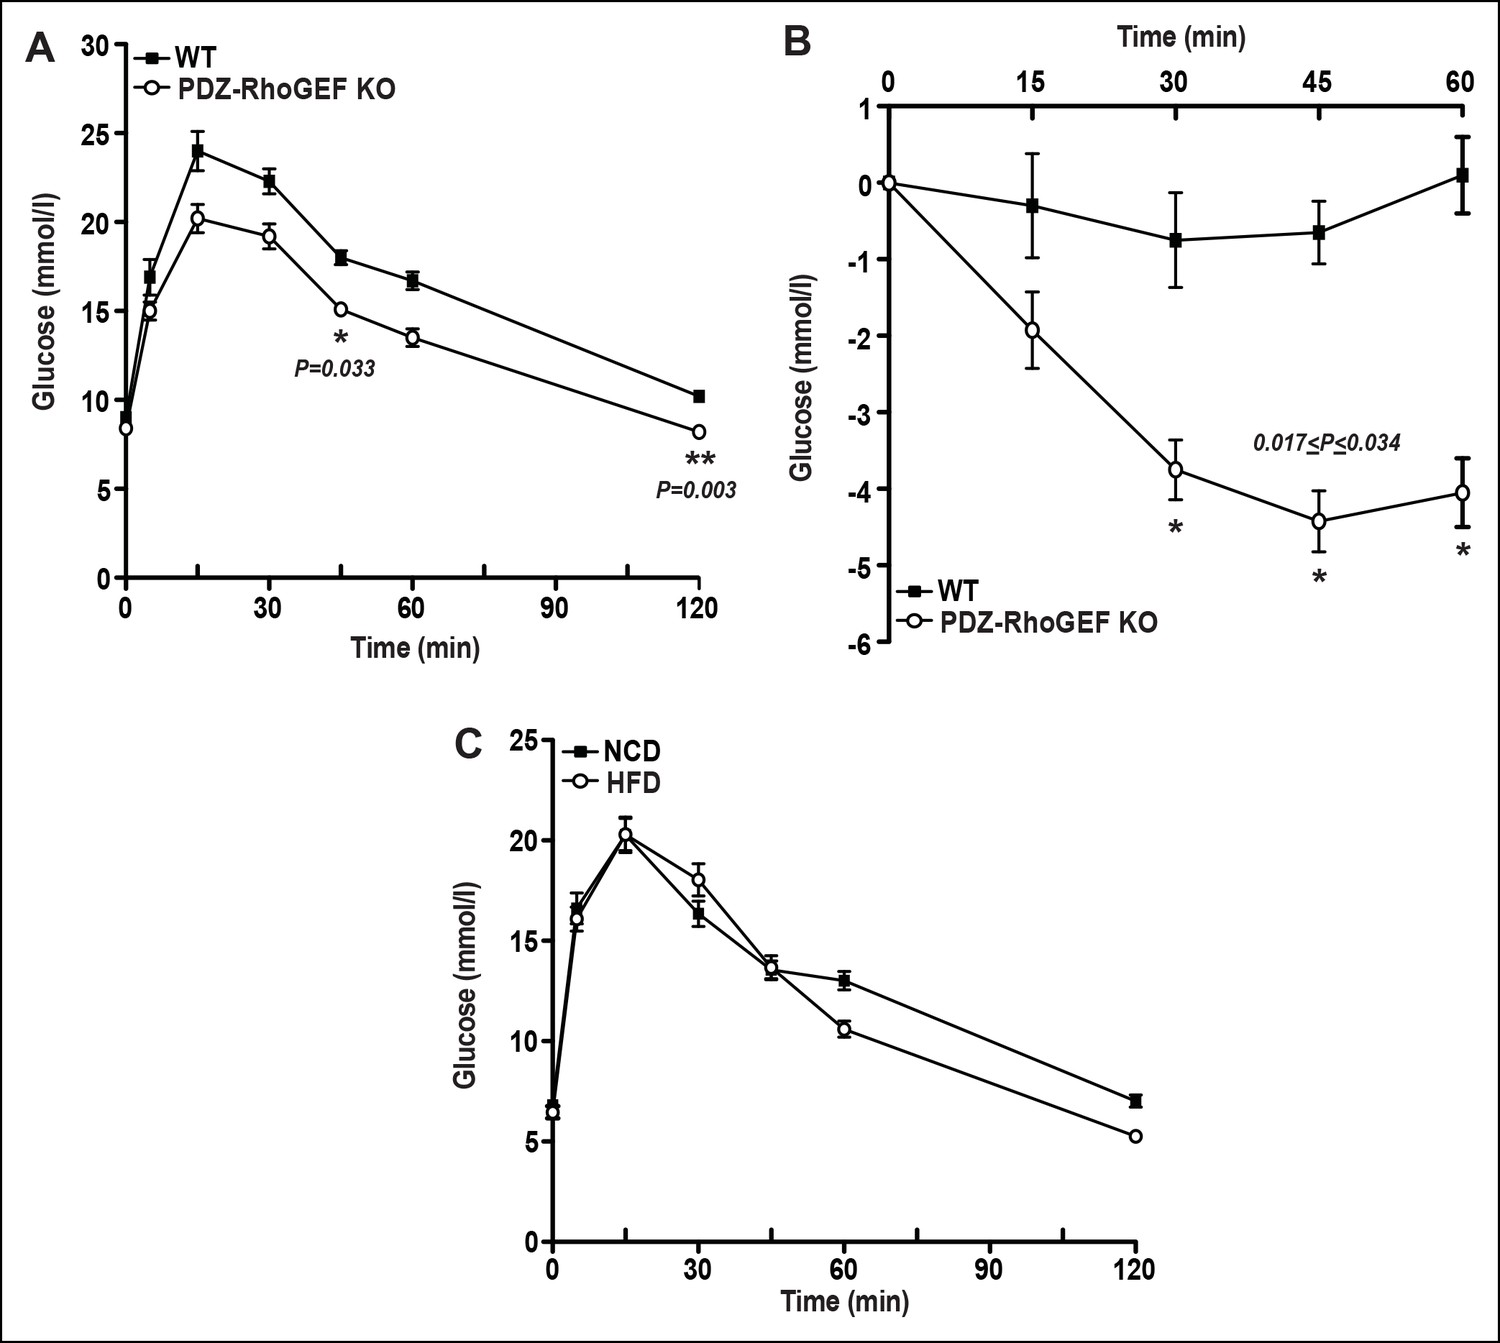
Glucose metabolism in WT and PDZ-RhoGEF KO mice.
(A)Glucose tolerance test on overnight fasted 22-week old WT and PDZ-RhoGEF KO mice, after 16-week high-fat feeding (n = 4). (B) Insulin tolerance test on overnight fasted 22-week old WT and PDZ-RhoGEF KO mice, after 16-week high-fat feeding (n = 4). (C) Glucose tolerance test on overnight fasted PDZ-RhoGEF KO mice, NCD (before HFD) and HFD (after HFD) (n = 8). Statistical significance was calculated by a Student’s t test using Excel software (*p<0.05, **p<0.01, ***p<0.001).
Figure 7 with 1 supplement
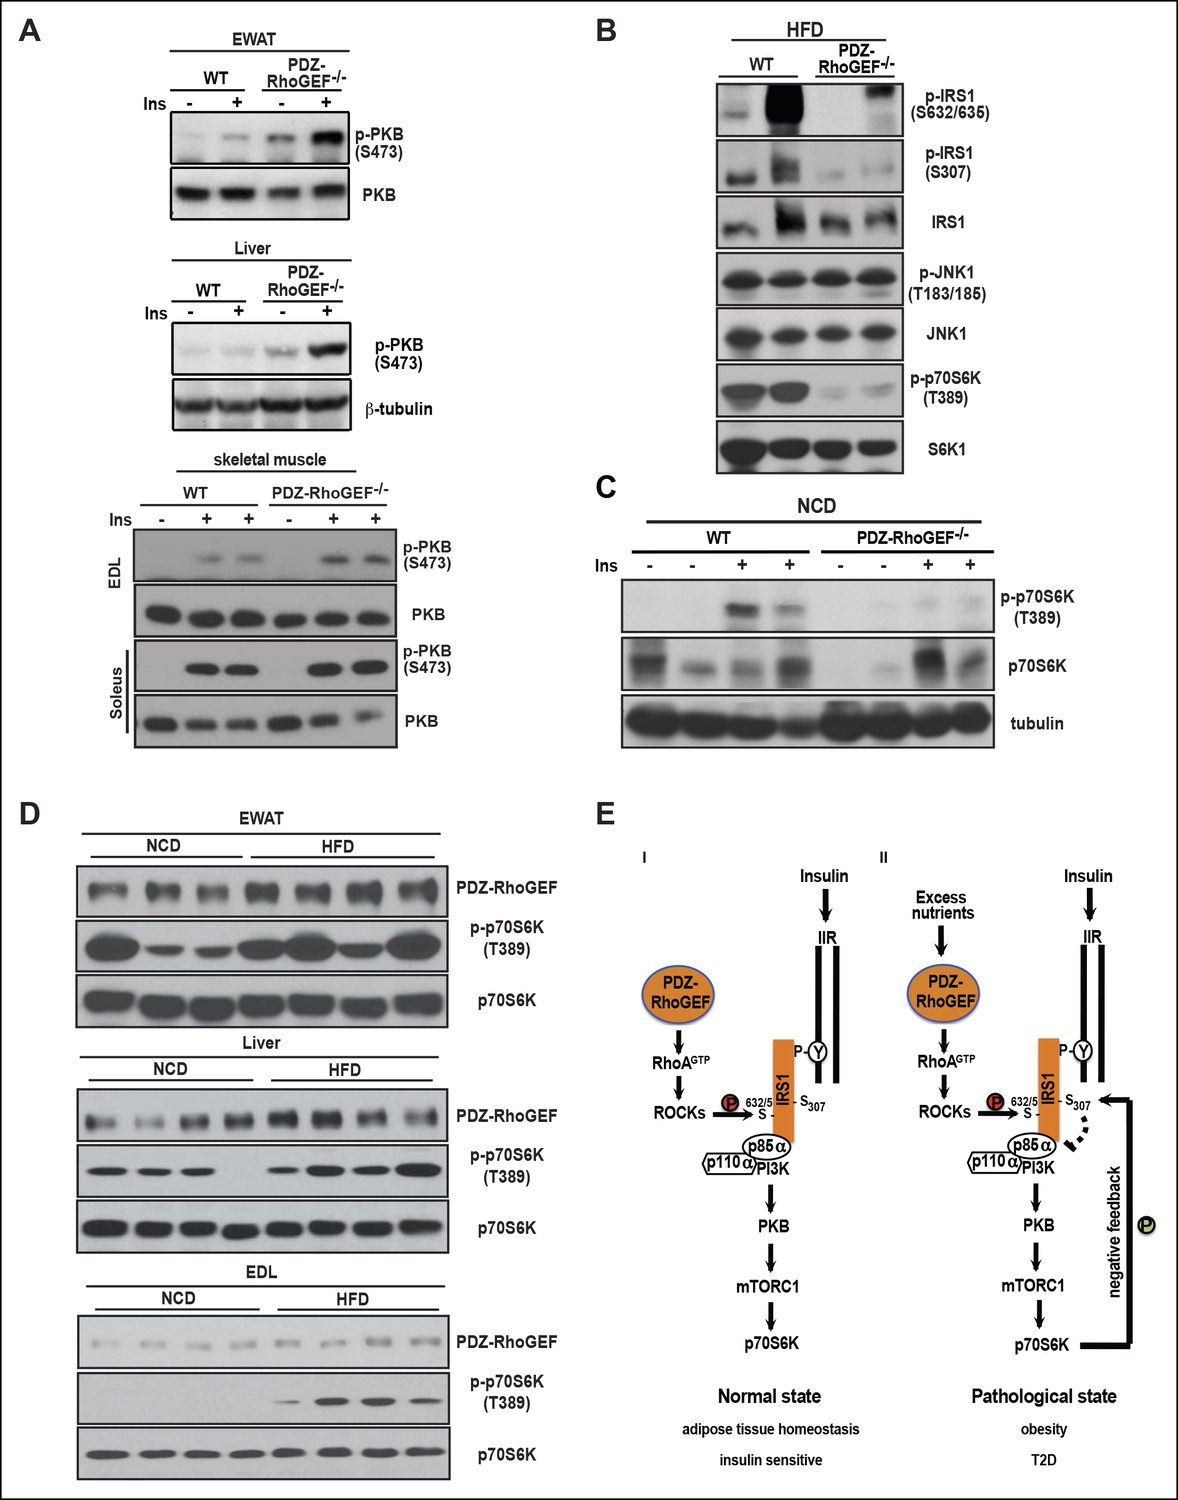
PDZ-RhoGEF contributes to the HFD-induced insulin resistance through a S6K1-mediated negative feedback.
(A) Western blot analysis of insulin-mediated PKB/Akt phosphorylation in peripheral tissues: EWAT, liver, and skeletal muscles (EDL and soleus). (B) Phosphorylation status of IRS1 S632/635, S307, JNK1 T183/185, and p70S6K1 T389 in EWATs from HFD-fed WT and PDZ-RhoGEF KO mice. (C) Phosphorylation of p70S6K1 T389 in EWATs from NCD-fed WT and PDZ-RhoGEF KO mice after in vivo insulin stimulation. (D) Differential protein levels of PDZ-RhoGEF in EWAT of NCD- and HFD-fed wild type mice. (E) PDZ-RhoGEF modulates insulin/IGF-1 signaling to impact adipose tissue homeostasis (I) and susceptibility to dietary-induced obesity and T2D (II).
Figure 7—figure supplement 1

EWAT insulin sensitivity determined by IR tyrosine phosphorylation.
After 14-week of HFD, IR from both WT and PDZ-RhoGEF KO EWAT and liver remained sensitive to insulin, determined by IR tyrosine phosphorylation.
Tables
Table 1
Quantification of fasting serum metabolites of wild type and PDZ-RhoGEF KO mice.
| Wild type | PDZ-RhoGEF KO | |
|---|---|---|
| Triglycerides (mg/ml) | 0.63 +±0.02 | 0.43 + ± 0.01* |
| Glucose (mmol/l) | 12.13 + ± 0.53 | 7.62 + ± 0.16* |
| Insulin (ng/ml) | 1.80 + ± 0.20 | 0.51 + ± 0.07* |
| Adiponectin (ng/ml) | 0.29 + ± 0.01 | 0.36 + ± 0.01* |
-
Values are from 8-month-old male mice of the indicated genotype fed with high fate diet after overnight fasting.
-
Data represent mean + ± s.e.m.
-
*p<0.05 compared with wild type (n = 8).
Additional files
-
Supplementary file 1
Composition of the high-fat diet.
- https://doi.org/10.7554/eLife.06011.028
Download links
A two-part list of links to download the article, or parts of the article, in various formats.
Downloads (link to download the article as PDF)
Open citations (links to open the citations from this article in various online reference manager services)
Cite this article (links to download the citations from this article in formats compatible with various reference manager tools)
The Rho-guanine nucleotide exchange factor PDZ-RhoGEF governs susceptibility to diet-induced obesity and type 2 diabetes
eLife 4:e06011.
https://doi.org/10.7554/eLife.06011


