Structural evidence for Scc4-dependent localization of cohesin loading
- Harvard Medical School, United States
- University of Edinburgh, United Kingdom
- Howard Hughes Medical Institute, Harvard Medical School, United States
Figures
Figure 1 with 1 supplement
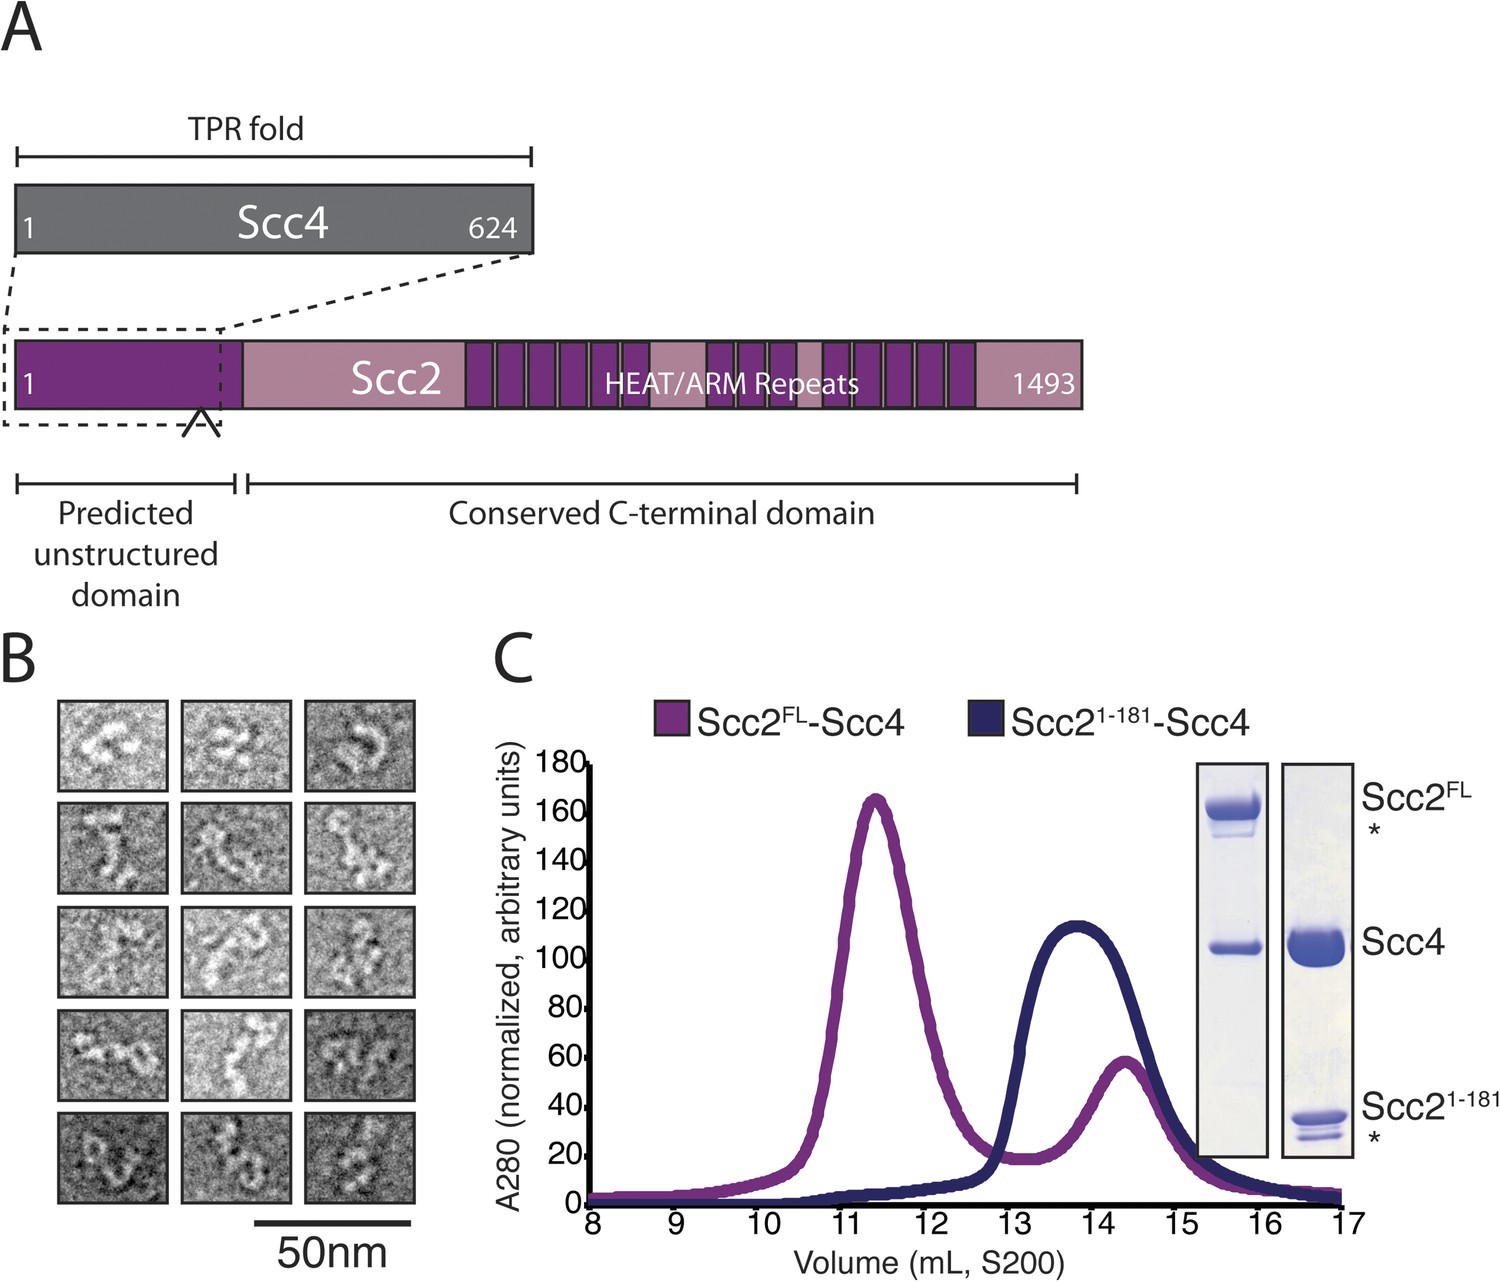
Purification of the cohesin-loading complex.
(A) Domain organization of Scc2/4. Dotted lines show the Scc2–Scc4 interaction. An arrow indicates the position of a regulated cleavage site (Woodman et al., 2014). (B) Negatively stained Scc2/4 visualized by electron microscopy. Individual particles are shown. (C) Gel filtration chromatograms and SDS-PAGE show that Scc2FL/Scc4 (magenta, left inset) and Scc21–181/Scc4 (purple, right inset) form stable complexes (* marks an Scc2 cleavage product).
Figure 1—figure supplement 1
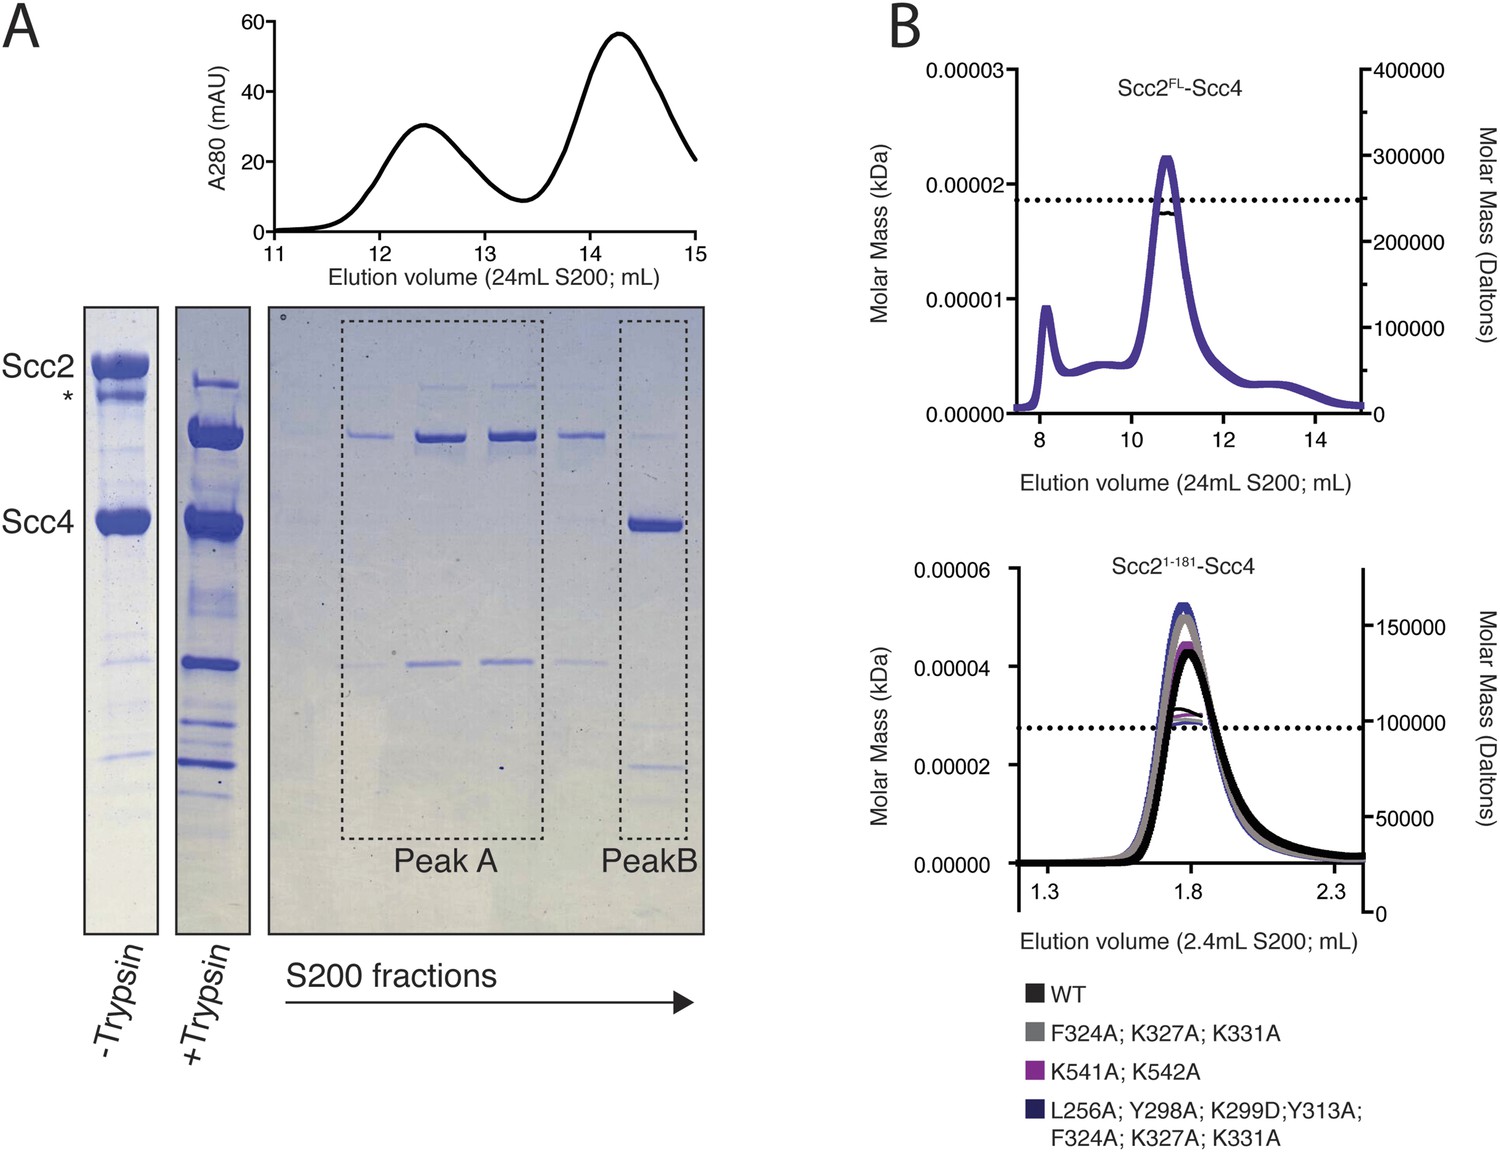
Purification and characterization of an Scc2N–Scc4 complex.
(A) Full-length recombinant Scc2/4 was digested with trypsin and analyzed by gel filtration. Fractions from peak B contain full-length Scc4 and the N-terminal 181 or 205 residues of Scc2. A scaled absorbance (A280) trace is shown above for reference. (B) SEC-MALS to determine the molecular weight of Scc2FL-Scc4 (top) and Scc21–181-Scc4 (bottom). Dotted lines show calculated molecular weights for intact complexes. The measured molecular weights were as follows: 238.3 kDa for Scc2FL-Scc4; 104.1 kDa for Scc21–-181-Scc4WT; 100.3 kDa for Scc21–181-Scc4F324A; K327A; K331A; 103.0 kDa for Scc21–181-Scc4K541A; K542A; and 98.8 kDa for Scc21–181-Scc4L256A; Y298A; K299A; Y313A; F324A; K327A; K331A.
Figure 2 with 3 supplements
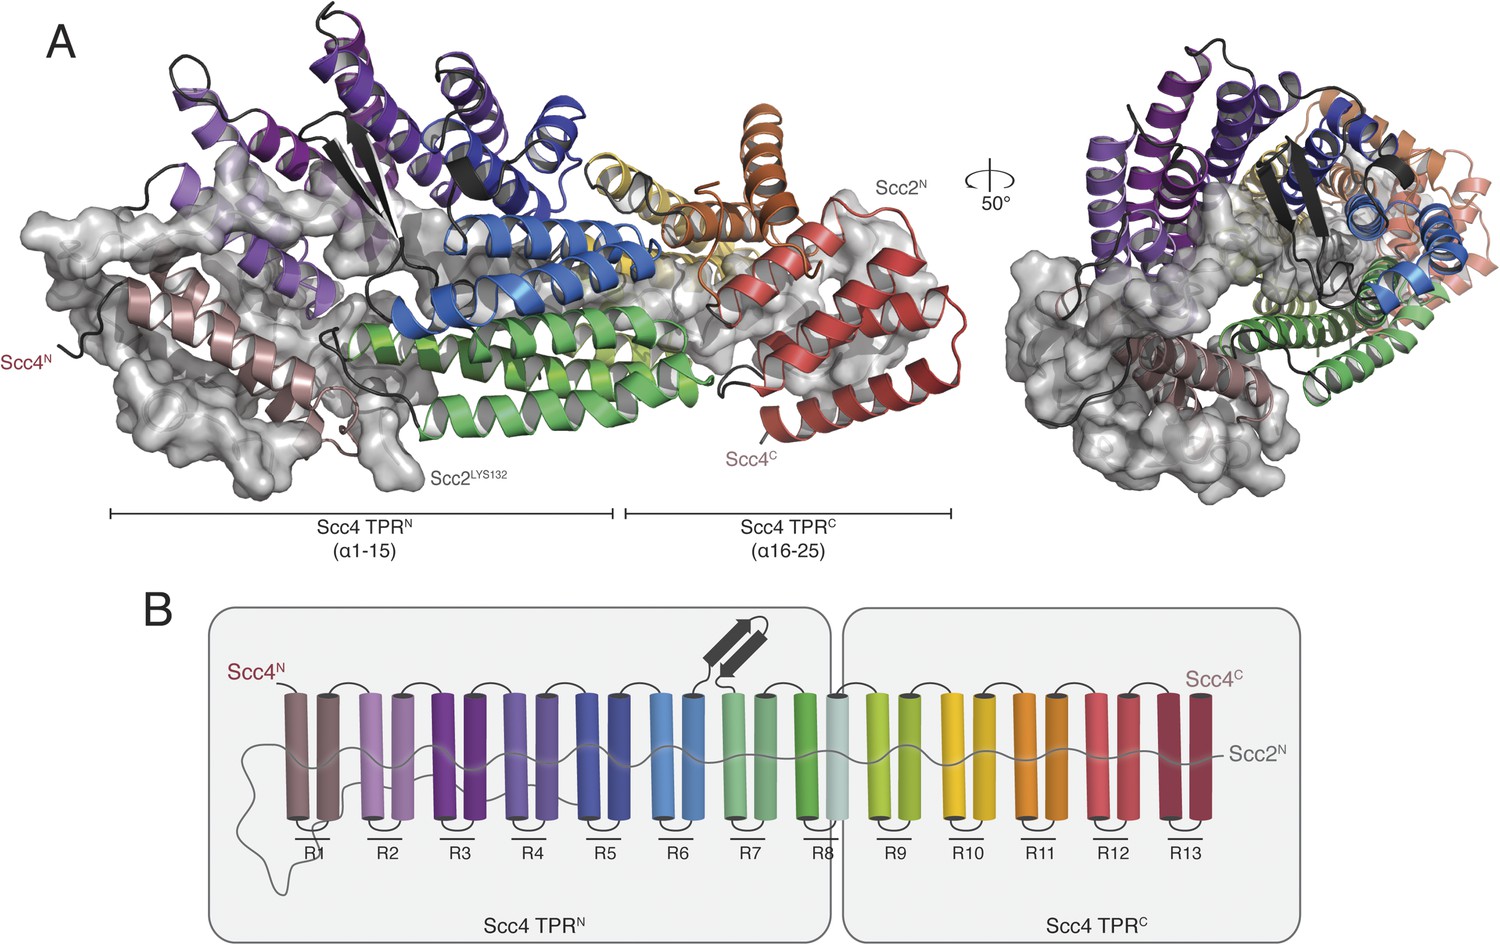
Crystal structure of the Scc21–181/Scc4 complex.
(A) Rotated views of the Scc21–181/Scc4 complex. Scc2 is shown in gray as a cartoon and transparent surface. Individual Scc4 repeats (R1-13) are colored as indicated in (B).
Figure 2—figure supplement 1
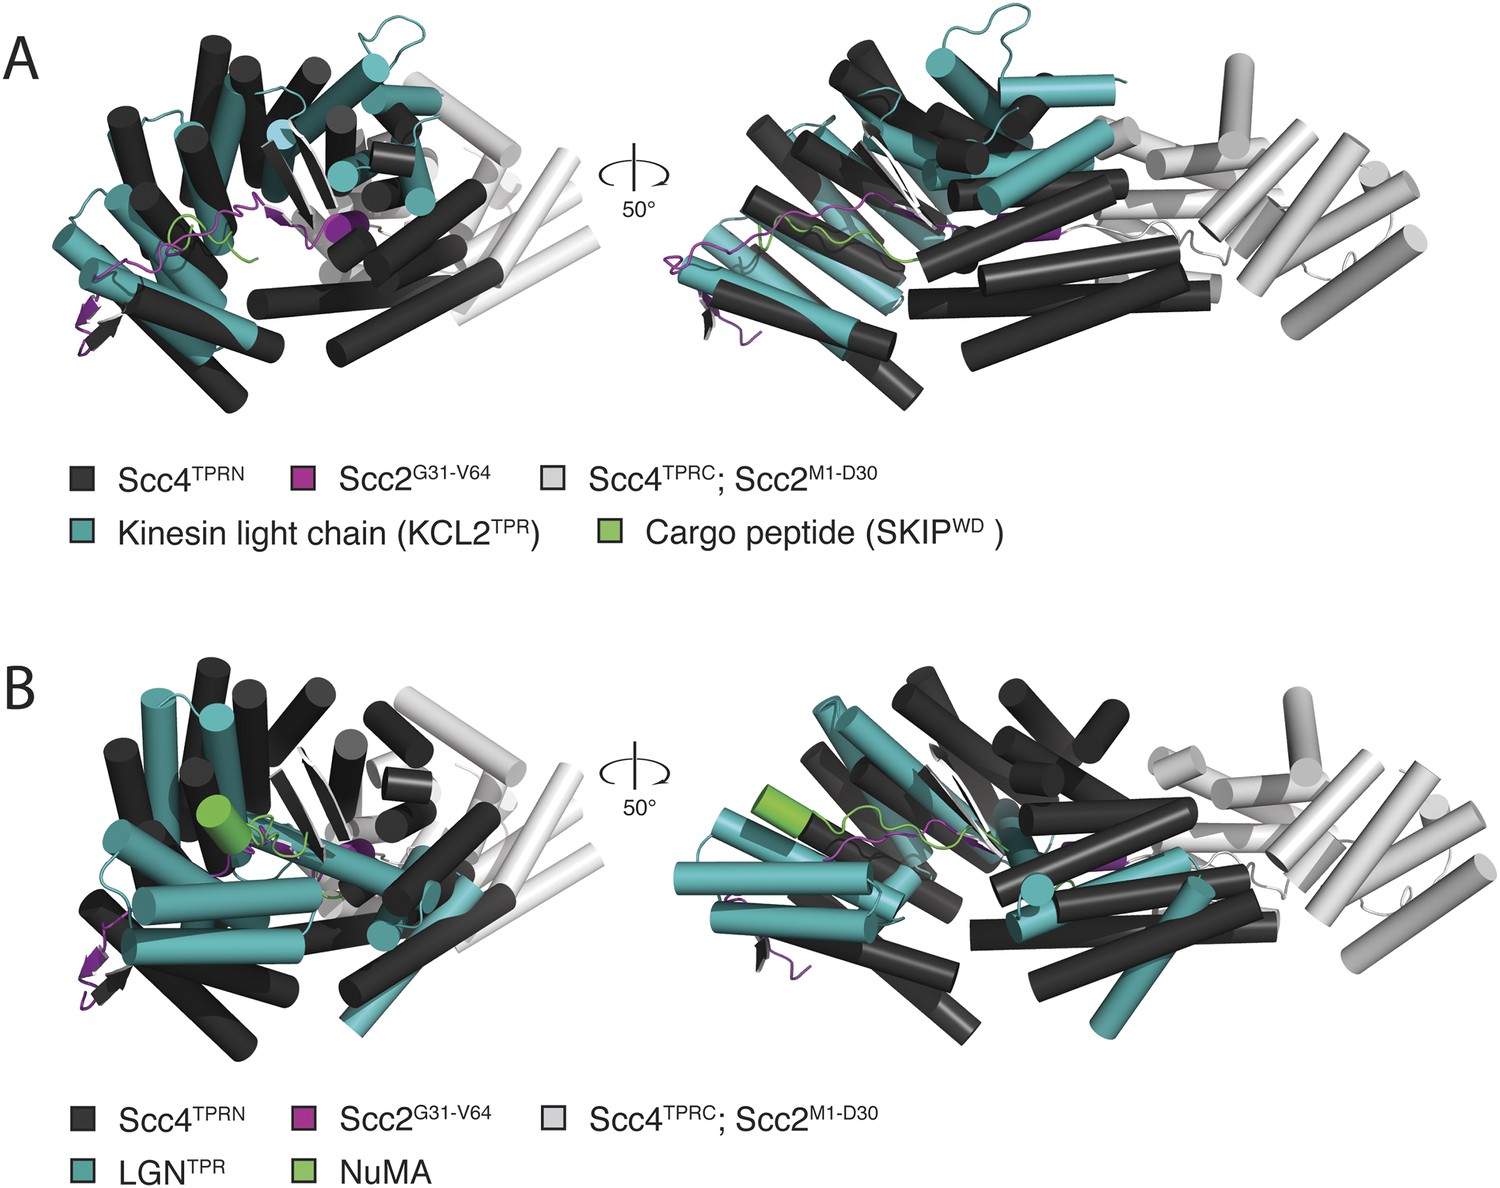
Comparison of Scc2N-Scc4 with structural homologs.
(A) Scc2N–Scc4 crystal structure superimposed onto the crystal structure of the TPR domain of kinesin light chain 2 (teal) in complex with a cargo peptide (green; PDB 3ZFW). (B) Scc2N–Scc4 crystal structure superimposed onto the crystal structure of a complex between LGN (teal) and NuMA (green; PDB 3RO2). In both cases, Scc4 TPRN is colored dark gray, and Scc4 TPRC is colored light gray. Only Scc2 residues in contact with the internal surface of Scc4 TPRN (Scc2G31-V64) are shown in magenta. For clarity, the remainder of Scc2 is either colored light gray (Scc21–30) or it is not shown (Scc265–132).
Figure 2—figure supplement 2
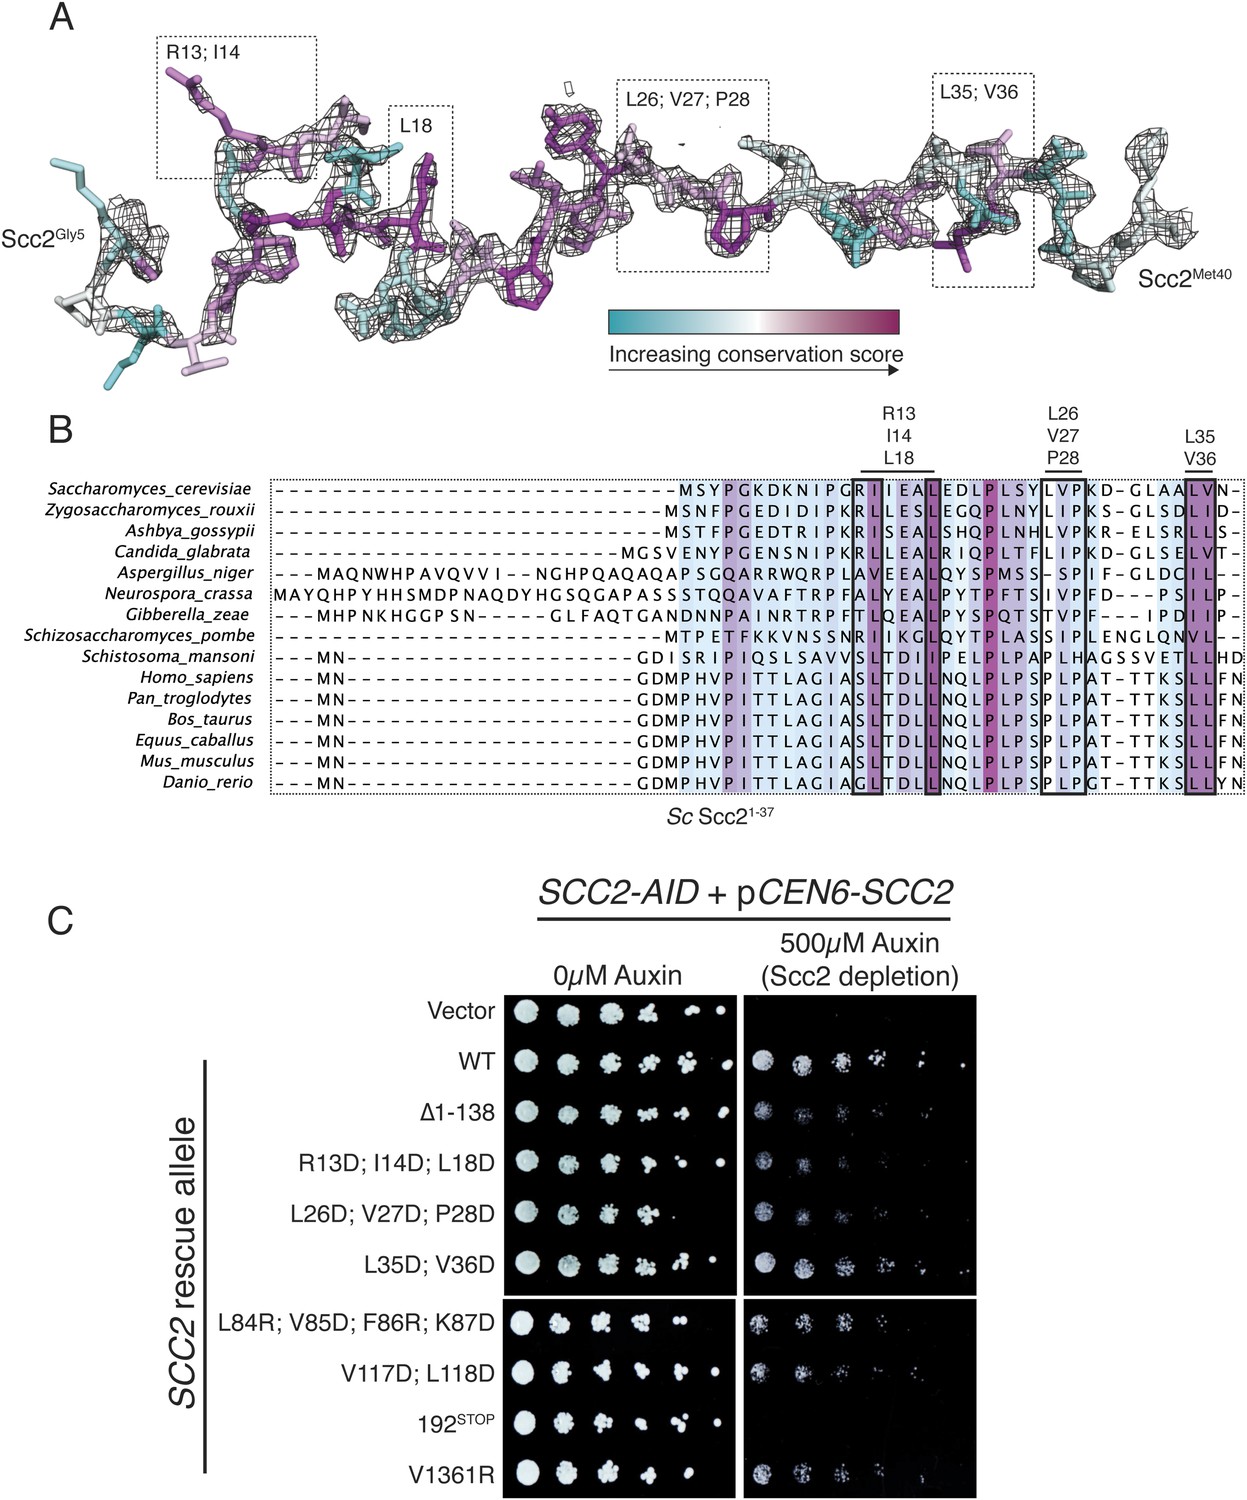
Structure and conservation of Scc2N.
(A) Scc2 amino acid residues 5–40 are shown and colored according to conservation across diverse eukaryotes. 2Fo − Fc map contoured at 1.8σ is shown. Boxes indicate a subset of residues mutated in (C). (B) Alignment of Scc2 amino acid sequences from diverse eukaryotes. The N-terminal fragments from all included sequences were selected, and the alignment was recalculated for this region (shown). Redundant sequences and sequences lacking this fragment of Scc2 have been removed. (C) SCC2 alleles under the control of their native promoter were tested for the ability to restore viability to an SCC2-AID strain in depletion conditions (500 µM auxin). Δ1-138 indicates removal of Scc2 residues 1–138. 192STOP indicates removal of all residues following Scc2Leu192. Scc2V1361R mimics a CDLS-associated NIBPL allele found in a human patient (Tonkin et al., 2004).
Figure 2—figure supplement 3
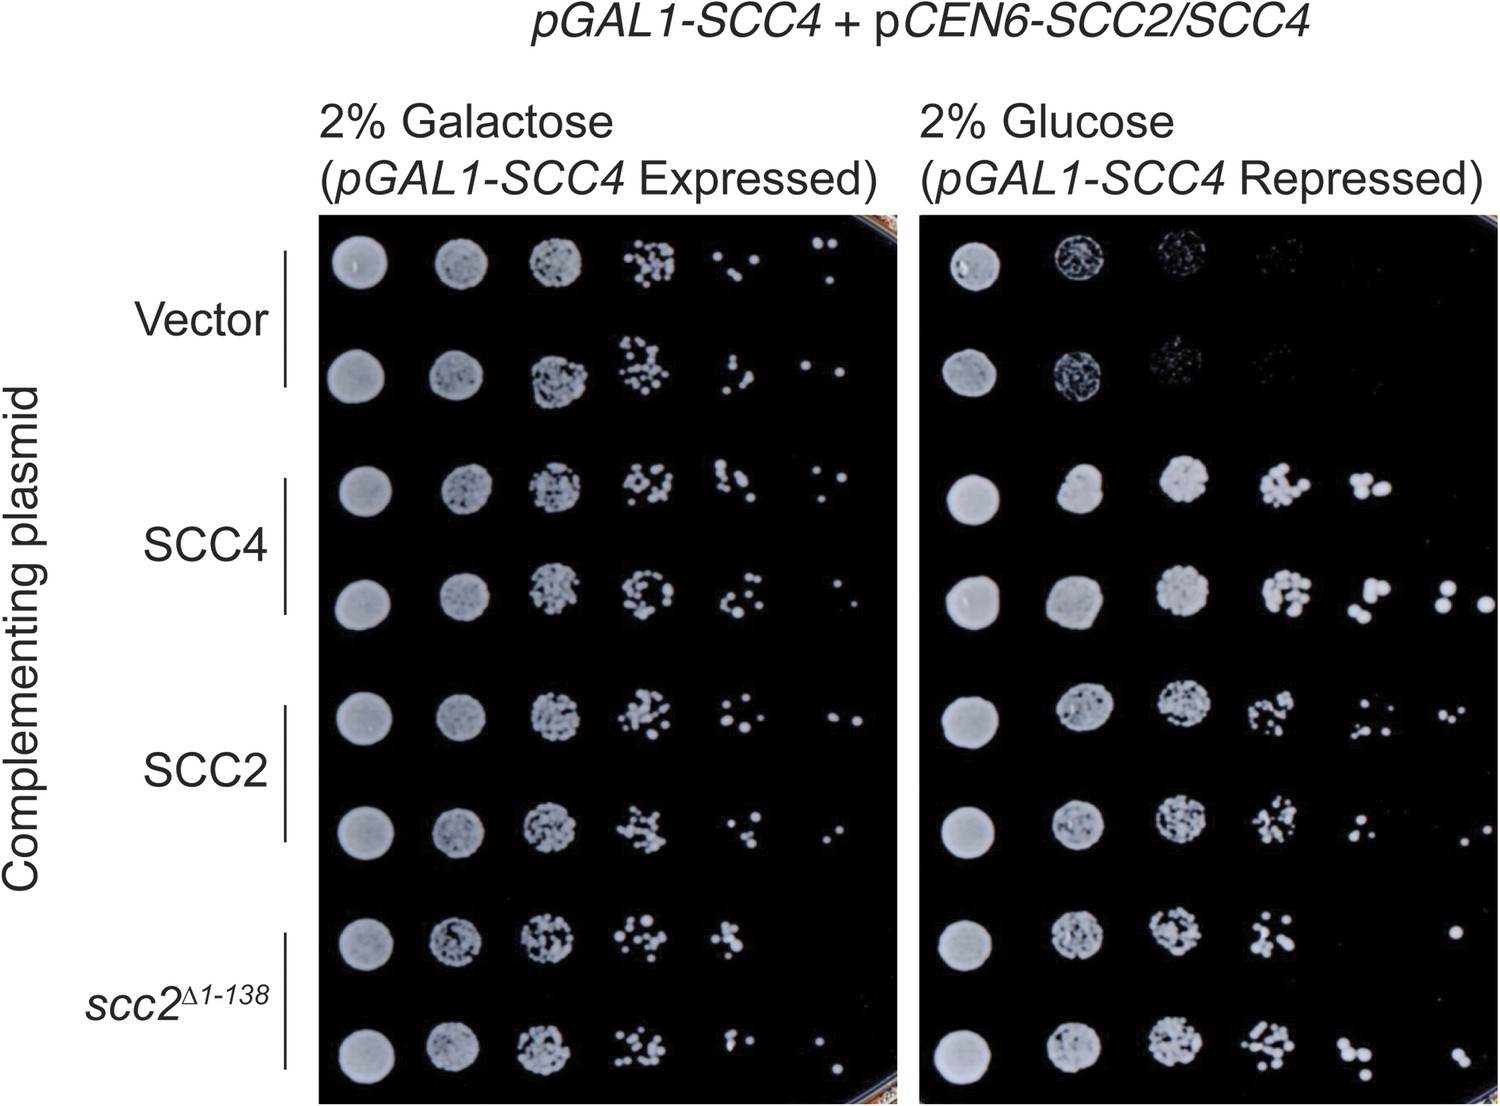
Complementation of Scc4 repression by Scc2.
SCC2 or SCC4 under the control of its native promoter was tested for the ability to restore viability to a pGAL1-SCC4 strain in depletion conditions (2% glucose [wt:vol]). scc2Δ1–138 indicates removal of Scc2 residues 1–138.
Figure 3 with 1 supplement
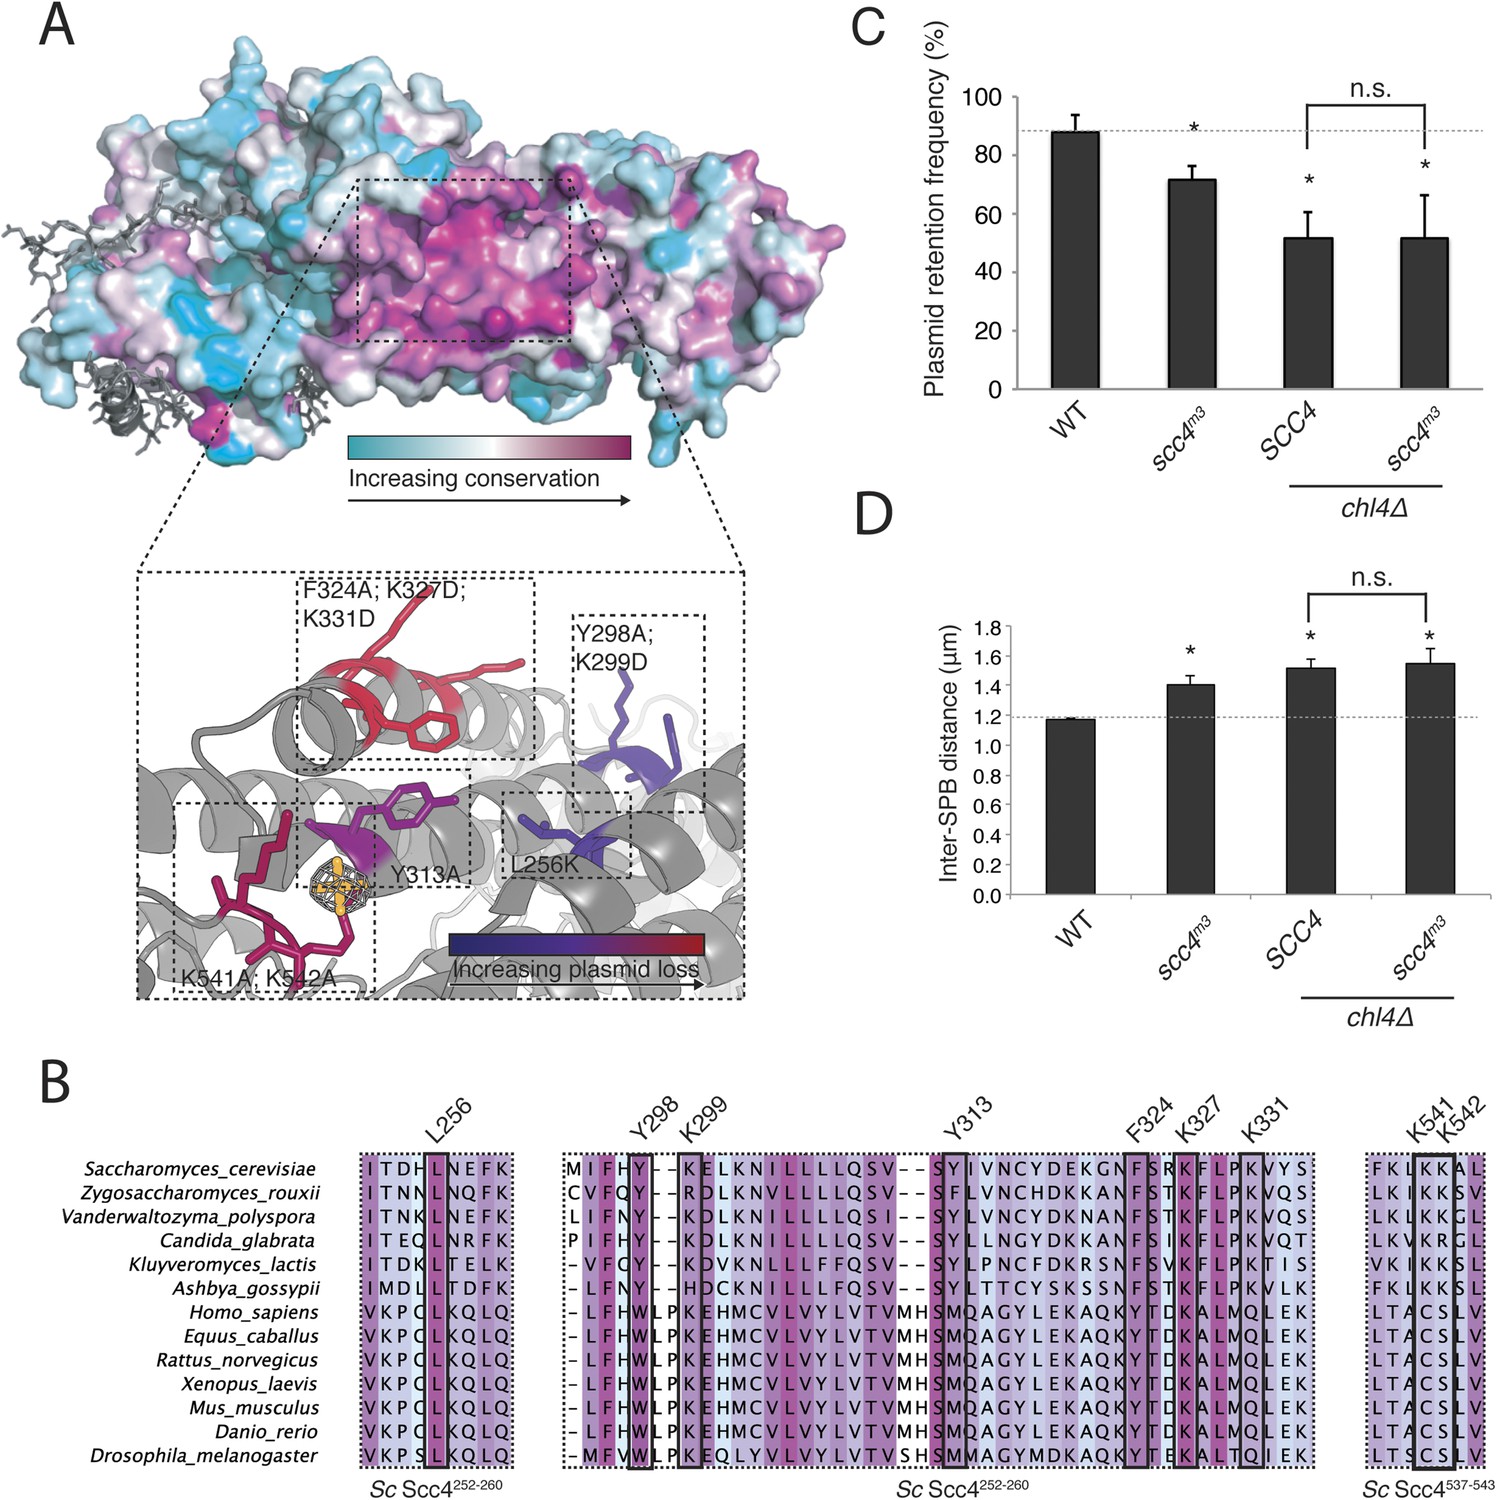
A conserved patch on the surface of Scc4.
(A) Surface view of Scc4 colored according to primary sequence conservation across eukaryotes. Inset shows the Scc4-conserved patch with mutated residues labeled and colored according to their effect on plasmid segregation fidelity (Figure 3—figure supplement 1). (B) Multiple sequence alignment of Scc4 and homologs from fungi and metazoans. Alignment is colored by conservation according to the color scheme in (A). (C) Plasmid missegregation was measured for the indicated strains (scc4m3—scc4F324A; K327D; K331D; error bars indicate SD; * p < 0.05, Student's t-test vs WT, two tails; n.s. indicates p > 0.05.). The dotted line shows the rate of plasmid segregation in a WT background. (D) Spindle length measurements for each indicated strain arrested in S phase with hydroxyurea. The dotted line shows the WT mean spindle length (error bars indicate SD; * p < 0.05, Student's t-test vs WT, two tails).
Figure 3—figure supplement 1
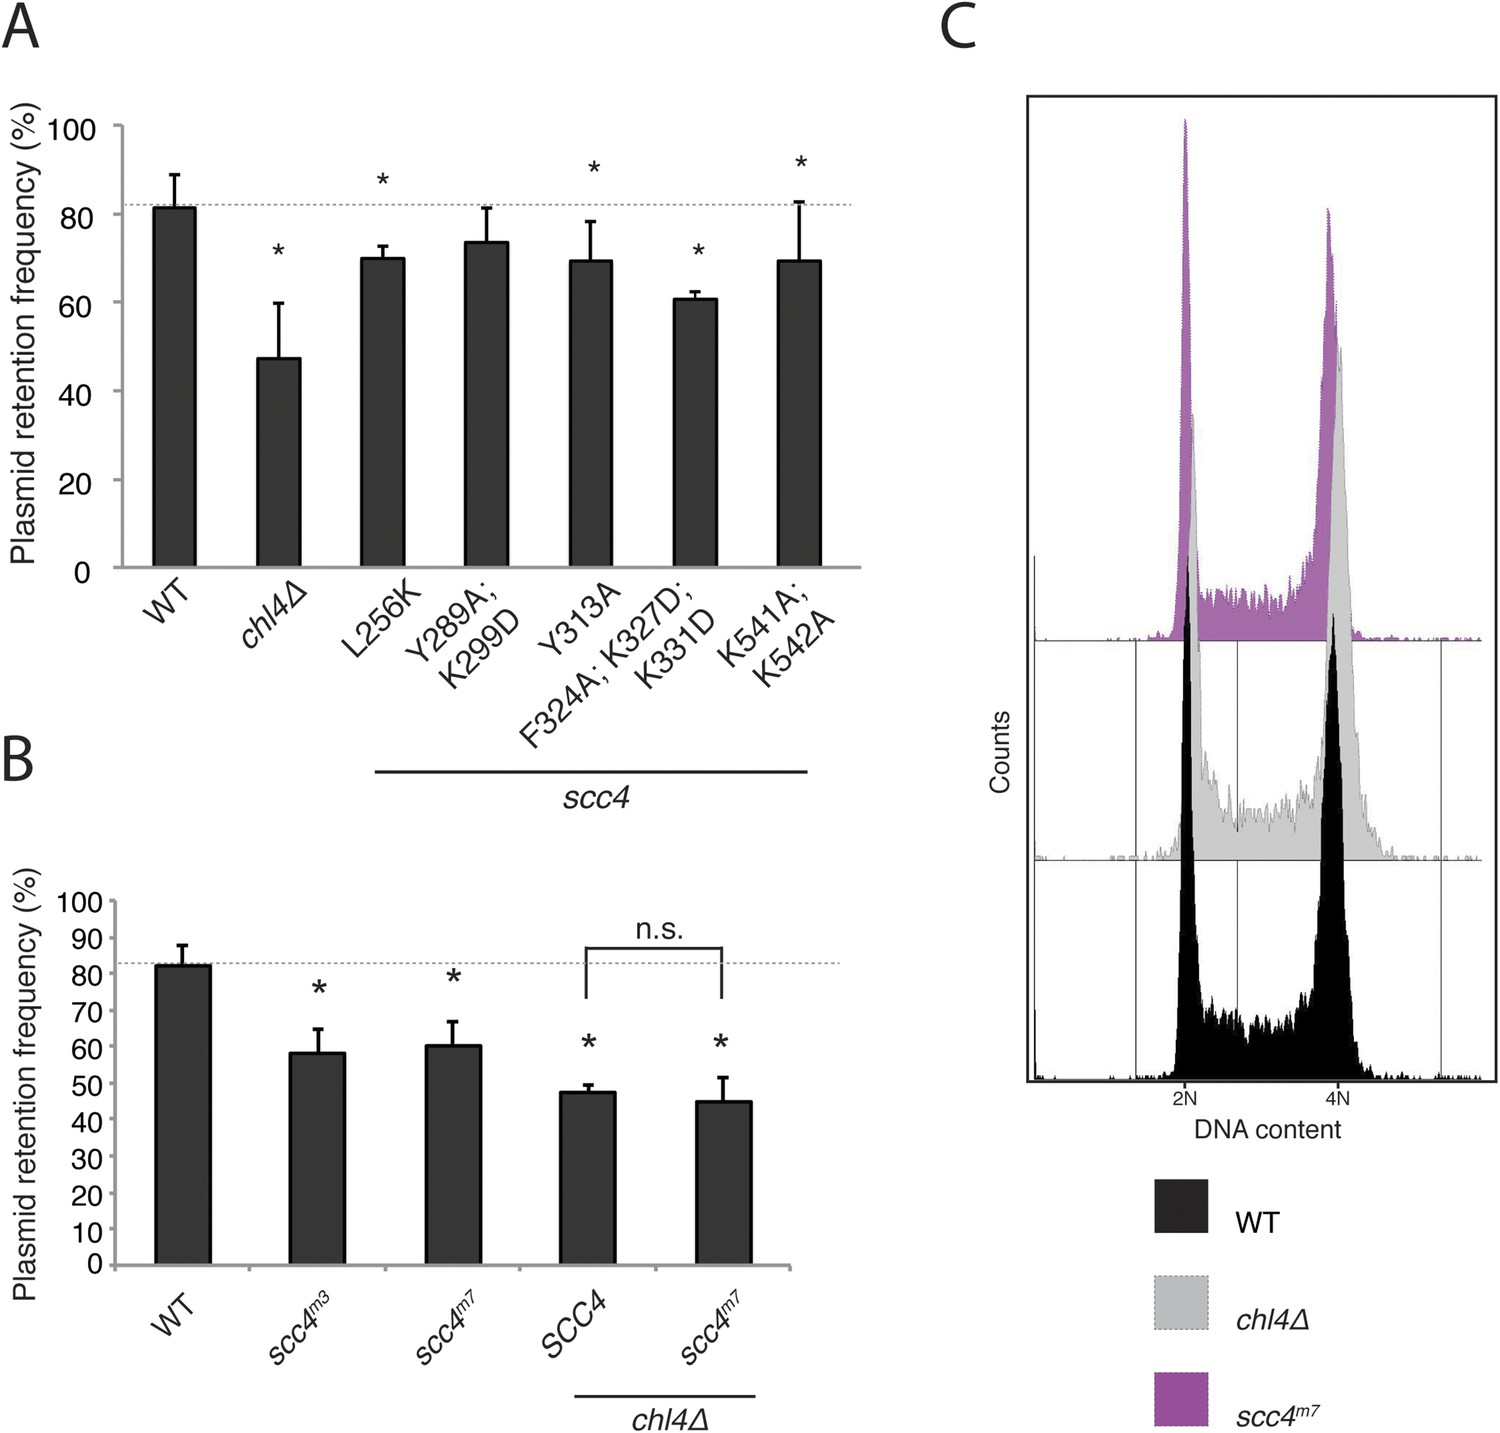
(A) Plasmid segregation defects in Scc4-conserved patch mutants.
Plasmid segregation in the absence of selection was measured in a chl4Δ strain and in strains with the listed Scc4 amino acid substitutions (error bars indicate SD; *p < 0.05, Student's t-test vs WT, two tails). The dotted line shows the rate of plasmid segregation in a WT background. (B) Plasmid missegregation was measured for the indicated strains (scc4m3—scc4F324A; K327D; K331D; n.s. indicates p > 0.05). (C) DNA content was measured by flow cytometry in log-phase cultures of homozygous diploids with the indicated genotypes.
Figure 4 with 3 supplements
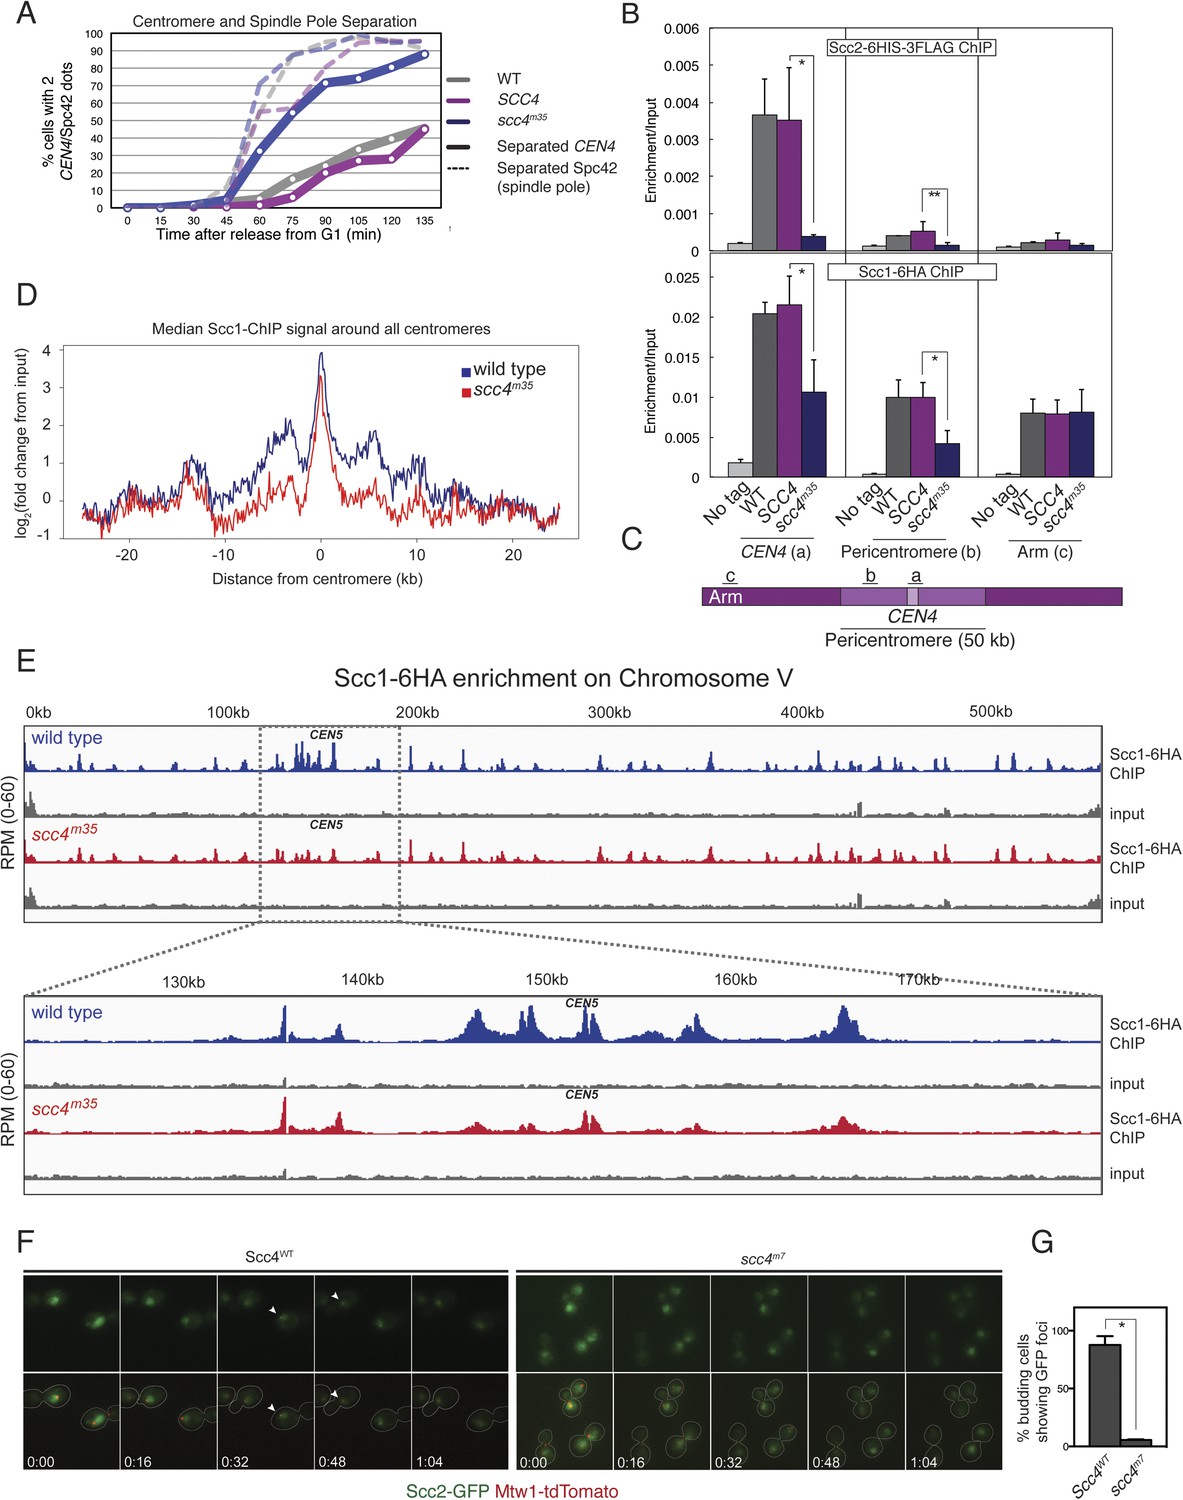
Defective centromeric cohesin loading in Scc4 conserved patch mutants.
(A) Sister centromeres (+2.4CEN4-GFP) are separated earlier and more frequently in an scc4m35 strain entering the cell cycle after a G1 arrest. pMET-CDC20 strains of the indicated genotypes (gray—wild type; magenta—SCC4 integrated; blue—scc4m35 integrated) were arrested in G1 with alpha factor and released into the cell cycle in the presence of methionine to repress CDC20 expression. Solid lines show the percent of cells with separated CEN4 dots, and dotted lines show the percent of cells with separated spindle pole bodies (Spc42-tdTomato). (B) Strains of the indicated genotypes and either Scc2-His6-3FLAG (top) or Scc1-6HA (bottom) were arrested in metaphase of mitosis following treatment with nocodazole and benomyl (to depolymerize microtubules). Cells were harvested after 2 hr. Anti-FLAG or anti-HA antibodies were used for ChIP, and pulldown samples were analyzed by qPCR. Mean values of four independent experiments are shown (error bars indicate ±SD; * p < 0.05; **p < 0.01 paired two-tailed t-test). (C) Schematic of a fragment of chromosome IV showing the location of qPCR amplicons used in (B). (D) Scc1 enrichment in a 50-kb domain surrounding all 16 budding yeast centromeres is shown for wild-type and scc4m35 cells. For both wild type and scc4m35, the ratio of reads (normalized to RPM) over input in a 100-bp window was calculated separately for each chromosome at the indicated position. The median count value for each window was then plotted to give a composite view of all 16 pericentromeres. (E) Scc1 enrichment along chromosome V together with a magnification of a 50-kb region including the centromere is shown. The number of reads at each position was normalized to the total number of reads for each sample (RPM: reads per million) and shown in the Integrated Genome Viewer from the Broad Institute (Robinson et al., 2011). (F) Live cell imaging of homozygous diploid cells expressing Scc2-GFP, Mtw1-tdTomato to mark centromeres, and the indicated version of Scc4 (left—wild type; right scc4m7). GFP dots observed in wild-type cells are marked with white arrows in the first frame in which they are visible, and these foci were not observed in scc4m7 cells. Time is given relative to the start of the imaging session (hr:mm). (G) Quantification of live cell imaging. At least 10 budding cells per field (three fields of view each for each strain for three separate experiments) were scored for the presence of an Scc2-GFP focus (error bars indicate ±SD; *p < 0.005, two-tailed t-test).
Figure 4—figure supplement 1
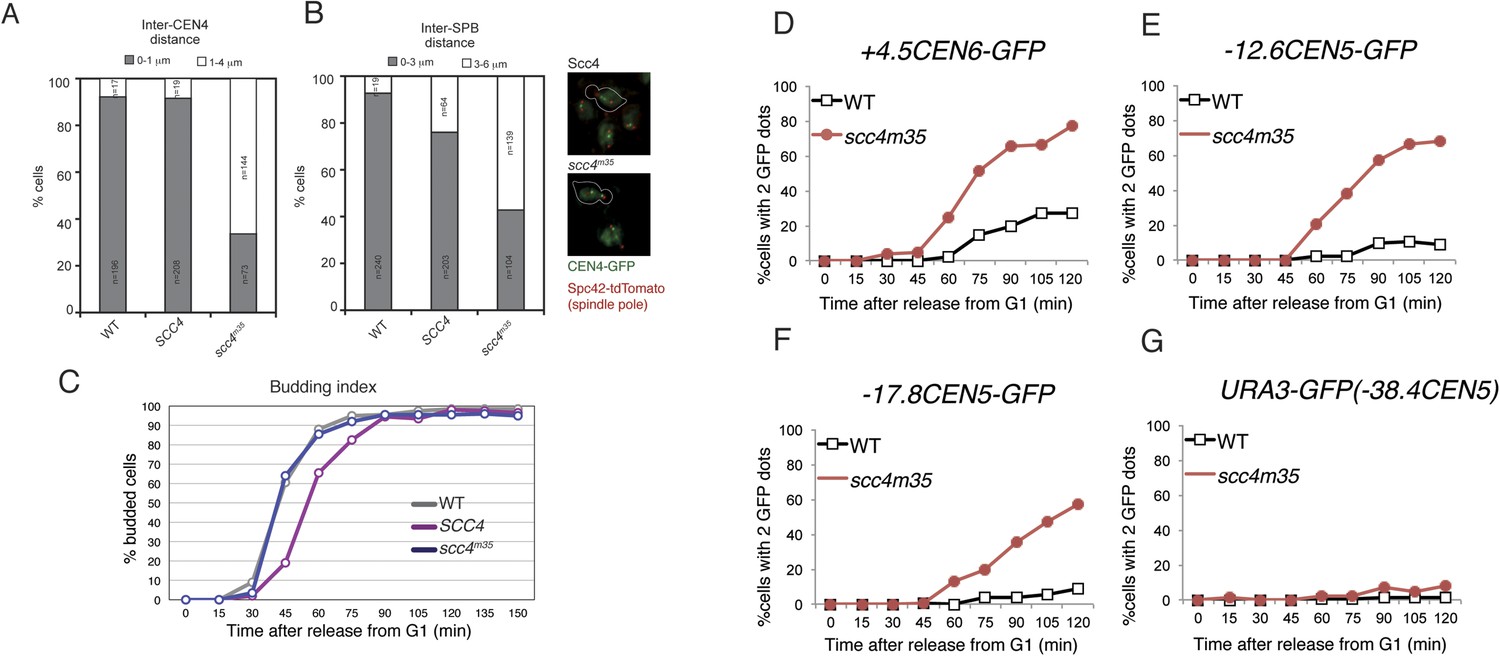
Spindle pole and CEN separation but not chromosome arm separation in an Scc4-conserved patch mutant.
(A–B) Quantification of CEN4 (A) and SPB (B) spreading observed in Figure 4A. Representative live cell images are shown at right (green—centromeres; red—Spc42—spindle poles). (C) Budding index corresponding to measurements shown in Figure 4A. (D–G) Cells of the indicated genotypes carrying pMET-CDC20, SPC42-tdTomato, and GFP at various loci were arrested in G1 with α-factor and released into the medium containing methionine. Percentages of separated GFP loci were scored at the indicated time points with tet operators integrated at: (A) +4.5CEN6-GFP in wild type (AM5329) and scc4m35 (AM15971); (B) −12.6CEN5-GFP in wild type (AM5545) and scc4m35 (AM16203); (C) −17.8CEN5-GFP in wild type (AM5533) and scc4m35 (AM15973); and (D) URA3-GFP in wild type (AM1081) and scc4m35 (AM16084). Distances are given from the start of the tetO array from the centromere.
Figure 4—figure supplement 2
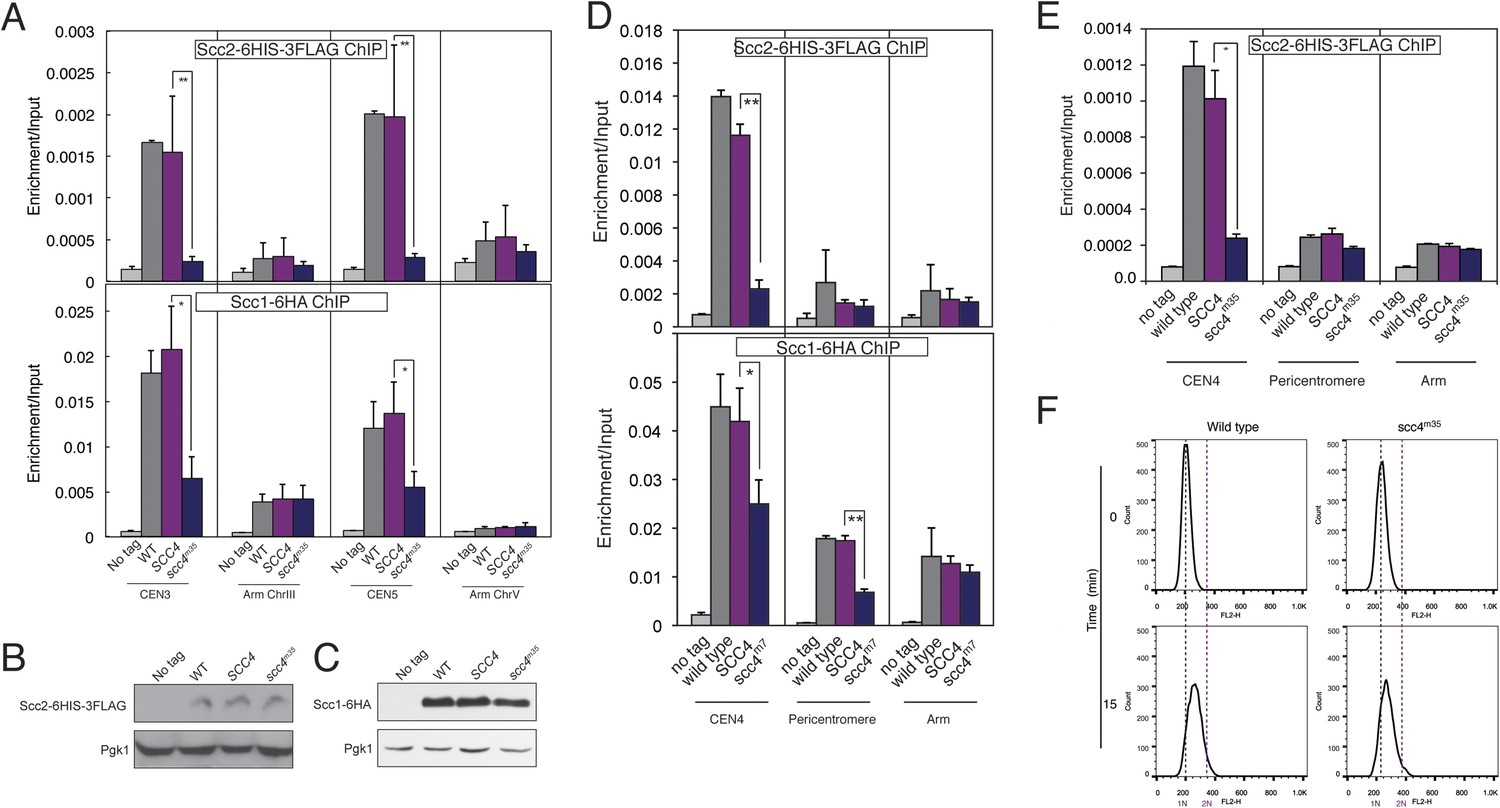
Scc2 and Scc1 association with centromeres and chromosome arms.
(A) Strains from Figure 4B were arrested in metaphase of mitosis following treatment for 2 hr with nocodazole and benomyl (to depolymerize microtubules). Anti-FLAG (top) or anti-HA (bottom) antibodies were used for ChIP, and samples were analyzed by qPCR. Mean values of four independent experiments are shown (error bars indicate ±SD; * p < 0.05; **p < 0.01 paired two-tailed t-test). (B–C) Whole cell extracts from strains used in (A) were analyzed by Western blot for expression of Scc2-6HIS-3FLAG (B), Scc1-6HA (C), and Pgk1. (D) Strains AM1176 (no tag), AM6006 (SCC2-6HIS-3FLAG), AM15307 (SCC2-6HIS-3FLAG SCC4) and AM17882 (SCC2-6HIS-3FLAG scc4m7) or Strains AM1176 (no tag), AM1145 (SCC1-6HA), AM15540 (SCC1-6HA SCC4) and AM17885 (SCC1-6HA scc4m7) were arrested in metaphase of mitosis following treatment with nocodazole and benomyl (to depolymerize microtubules). Cells were harvested after 2 hr. Anti-FLAG or anti-HA antibodies were used for ChIP, and samples were analysed by qPCR. Mean values of four independent experiments are shown (error bars indicate ±SD; *p < 0.05; **p < 0.01 paired two-tailed t-test). (E) Strains shown are AM1176 (no tag), AM6006 (SCC2-6HIS-3FLAG), AM15307 (SCC2-6HIS-3FLAG SCC4), and AM15311 (SCC2-6HIS-3FLAG scc4-m35). Cells were first arrested in G1 using alpha factor and harvested 15 min after release from G1. An anti-FLAG antibody was used for ChIP, and isolated chromatin was analyzed by qPCR. Mean values of four independent experiments are shown (error bars indicate ±SD; *p < 0.05; paired two-tailed t-test). Cells were stained with propidium iodide and analyzed by flow cytometry (FACS) to confirm entry into S phase. Samples were taken prior to release from G1 (0 min) and 15 min after release. (F) Cells were stained with propidium iodide and analyzed by flow cytometry (FACS) to confirm entry into S phase. Samples were taken prior to release from G1 (0 min) and 15 min after release.
Figure 4—figure supplement 3
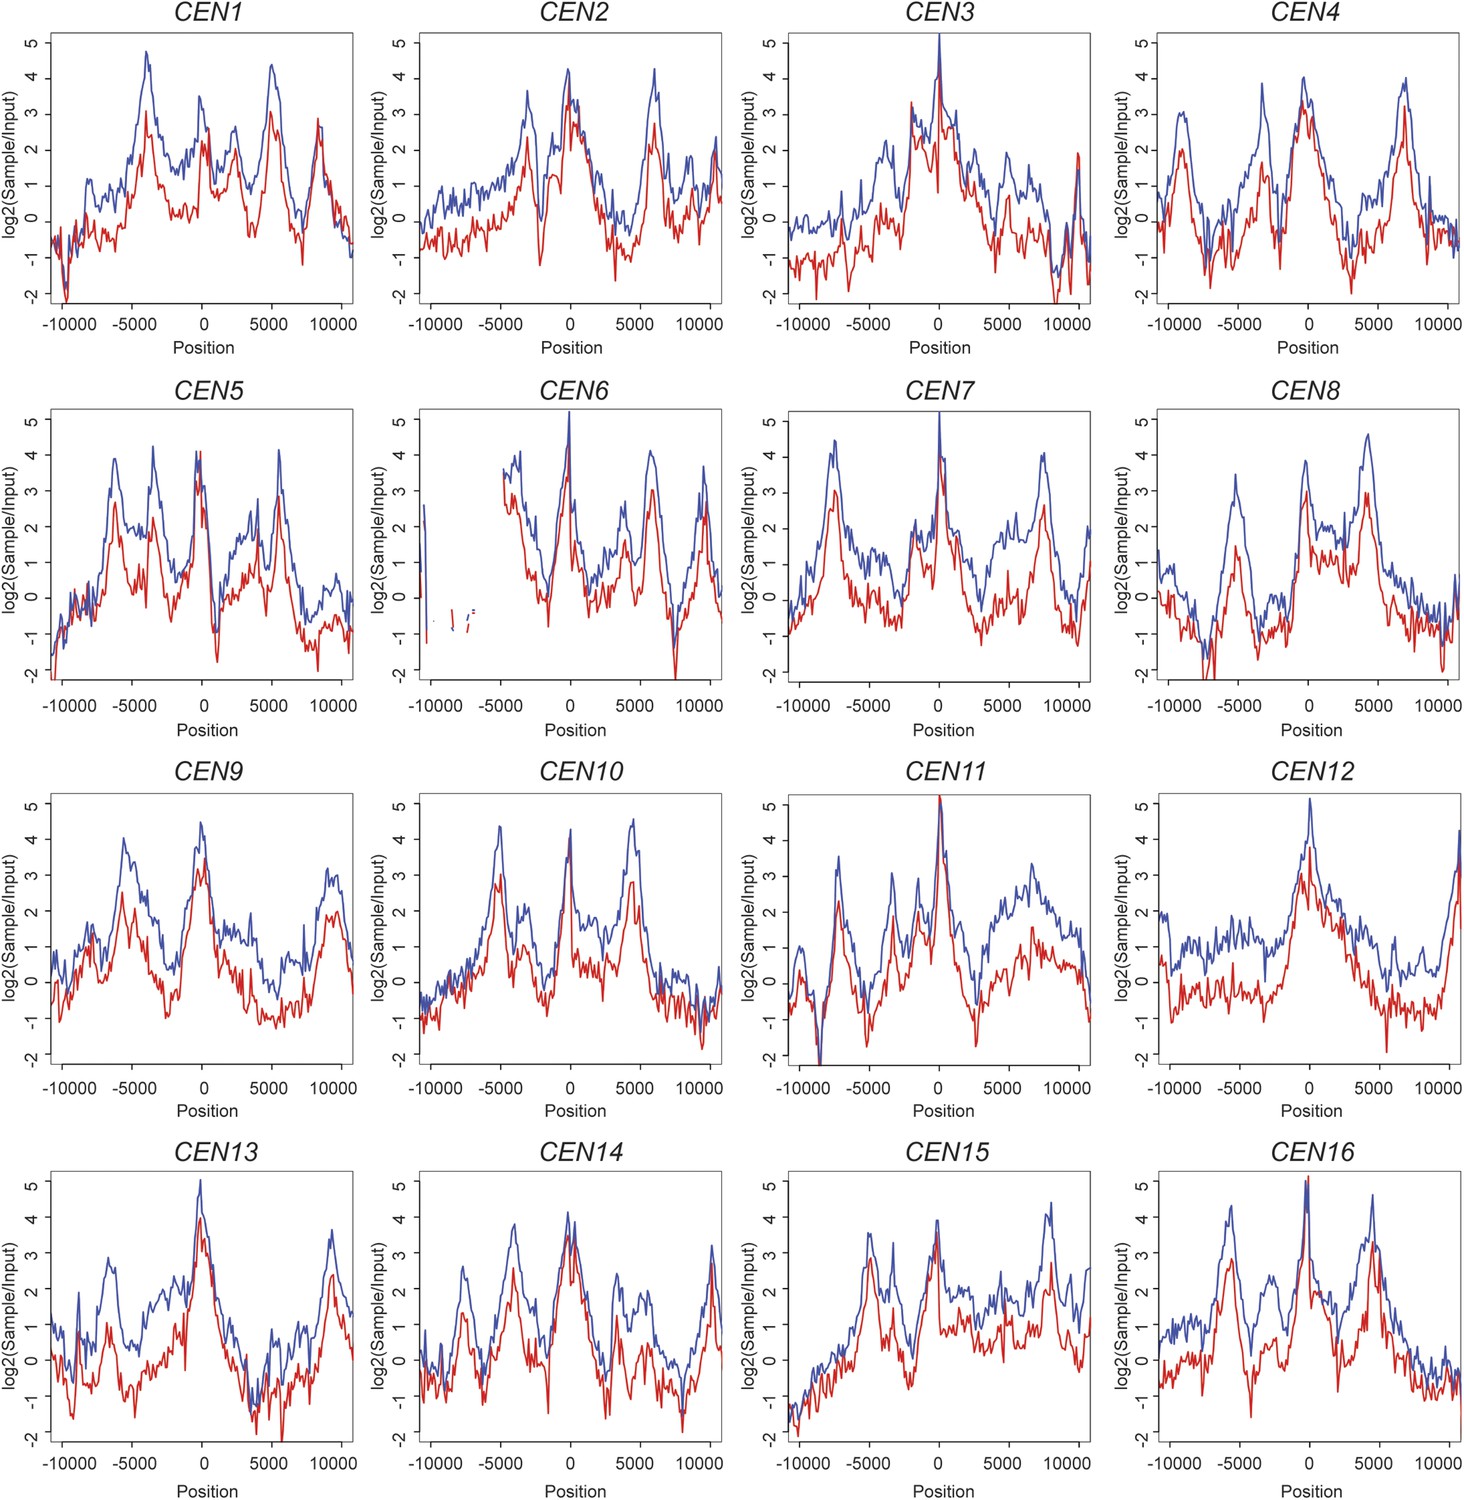
Scc1 is reduced around all 16 individual centromeres in scc4m35 cells.
ChIP-seq data from Figure 4D,E is shown for each individual centromere. Transformed sample-to-input ratios are shown for a 20-kb region surrounding each centromere (blue—wild type; red; scc4m35).
Tables
Table 1
De novo mutation profiles for human NIPBL and Mau2
| Observed | Expected | |
|---|---|---|
| NIPBL | ||
| Synonymous | 58 | 58.4 |
| Missense | 88 | 160.9 |
| Loss of function | 0 | 18.4 |
| Mau2 | ||
| Synonymous | 25 | 26.6 |
| Missense | 13 | 52.7 |
| Loss of function | 0 | 3.8 |
Table 2
Crystallographic data collection and refinement statistics
| Scc21–181; Scc4 (SeMet) | Scc21–181; Scc4 (Native) | |
|---|---|---|
| Data collection | ||
| Resolution (Å) | 30.0–2.8 | 178–2.0 |
| Wavelength (Å) | 0.979210 | 0.979240 |
| Space group | P212121 | P21 |
| Unit cell dimensions (a, b, c) (Å) | 58.6, 89.0, 178.0 | 51.9, 178.1, 52.7 |
| Unit cell angles (α, β, γ) (°) | 90, 90, 90 | 90, 111.7, 90 |
| I/σ (last shell) | 11.6 (1.9) | 6.0 (1.3) |
| Rsym (last shell) (%) | 14.1 (92.3) | 11.0 (72.9) |
| Completeness (last shell) (%) | 99.7 (90.0) | 93.0 (89.7) |
| Number of reflections | 168241 | 154940 |
| unique | 23460 | 50878 |
| Number of Se sites | 18 | – |
| Refinement | ||
|---|---|---|
| Resolution (Å) | – | 28.7–2.1 |
| Number of reflections | – | 47188 |
| working | – | 45322 |
| free | – | 1866 |
| Rwork (last shell) (%) | – | 18.5 (28.7) |
| Rfree (last shell) (%) | – | 21.0 (28.0) |
| Structure Statistics | ||
|---|---|---|
| Number of atoms (protein) | – | 5845 |
| sulfate | – | 24 |
| solvent | – | 301 |
| r.m.s.d. bond lengths | – | 0.004 |
| r.m.s.d. bond angles | – | 0.661 |
Additional files
-
Supplementary file 1
Yeast strains used in this study.
- https://doi.org/10.7554/eLife.06057.015
-
Supplementary file 2
Primers for ChIP-qPCR experiments in this study.
- https://doi.org/10.7554/eLife.06057.016
Download links
A two-part list of links to download the article, or parts of the article, in various formats.
Downloads (link to download the article as PDF)
Open citations (links to open the citations from this article in various online reference manager services)
Cite this article (links to download the citations from this article in formats compatible with various reference manager tools)
Structural evidence for Scc4-dependent localization of cohesin loading
eLife 4:e06057.
https://doi.org/10.7554/eLife.06057


