Regulation of EGFR signal transduction by analogue-to-digital conversion in endosomes
- Max Planck Institute of Molecular Cell Biology and Genetics, Germany
- Moscow State University, Russia
Figures
Figure 1 with 9 supplements

Cells keep a constant amount of p-EGFR in endosomes.
(A) Time course of total integral intensity of EGFR (green) and p-EGFR (red) in endosomes measured by a FRET microscopy assay in HeLa EGFR BAC cells after continuous stimulation with 10 ng/ml EGF. The total integral intensity is defined as the sum of integral intensities of all endosomes in an image normalized by the area covered by the cells (for details see ‘Materials and methods’ and Supplementary information). (B) Time course of mean integral intensity per endosome for total EGFR (green curve) and p-EGFR (red curve) as in (A). Intensity curves (A–B) were normalized to the intensity value at 10 min. Crosses show the corresponding values after 1 min of EGF stimulation and incubation in ligand-free medium for 10 or 30 min (pulse-chase). (C) Time course of histogram distributions of the total EGFR integral intensity per endosome upon EGF stimulation as in (A). (D) Time course of histogram distributions of the p-EGFR integral intensity per endosome upon EGF stimulation as in (A). In both graphs, receptors in CCVs are responsible for the width of the distribution at 3 min (red curves in C and D). For comparison, histogram amplitude in B and C were normalized by each curve integral. In each graph, the integral intensity values were scaled by the mode of the histogram at 10 min. The experimental points from all histograms were fitted with a log-normal distribution. (E–F) Distribution of p-EGFR in endosomes as a function of EGF concentration after continuous stimulation for 30 min. Mean number of endosomes with EGFR (green curve) and p-EGFR (red curve) per 1000 μm2 of the area covered by cells (E) and mean integral intensity of EGFR (green curve) and p-EGFR (red curve) per endosome (F). On panel (F) curves were normalized to the intensity value at 10 ng/ml EGF. Lines are hyperbolic fits (E) or least square fits (F) to the experimental points. In both cases insets show the same graphs in linear scale. The different magnitude of the error bars in (E) and (F) is due to the averaging by the total number of images (E) or the total number of endosomes (F). In all cases, points show mean ± SEM. All measurements were done in three independent experiments with a total of ∼150 cells per time point or condition.
Figure 1—figure supplement 1
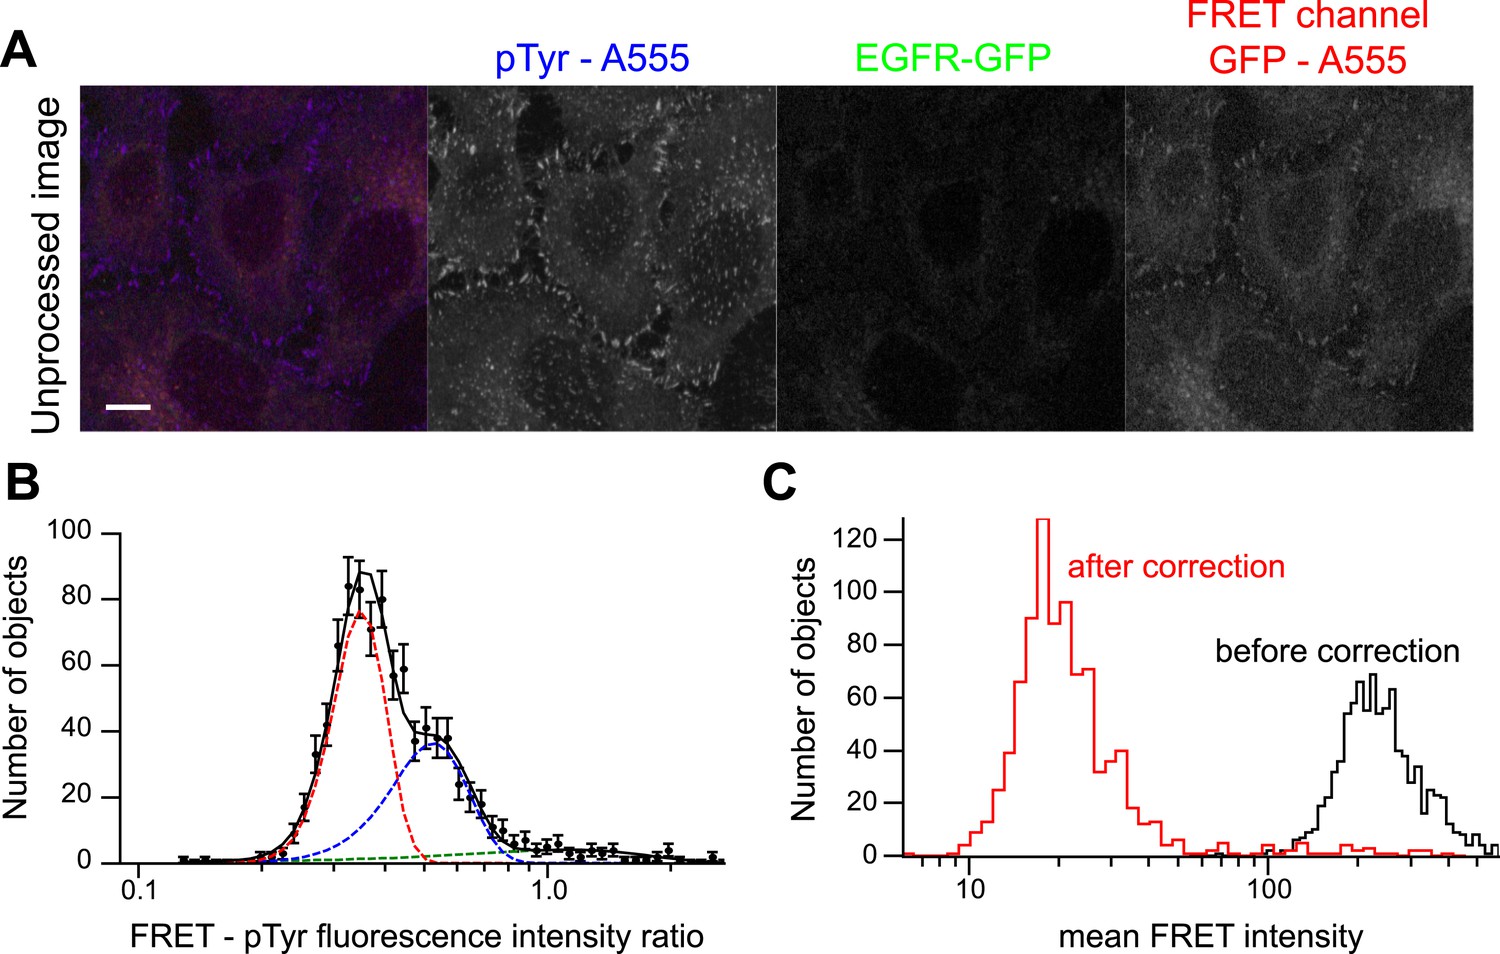
Bleed-through correction for p-EGFR detection by FRET microscopy.
(A) Representative image of HeLa cells with no EGFR-GFP expression stained with an anti-p-Tyr antibody directly labelled with AlexaFluor 555 used to quantify the amount of fluorescence bleed-through. Scale bars, 10 μm. (B) Distribution of the ratio of FRET-p-Tyr maximum intensities of individual colocalized objects in the FRET and p-Tyr channel. Since there is no GFP fluorescence, these objects give an estimation of fluorescence bleed-through (filled circles). The continuous black line is the fit of three Gaussian components (shown in coloured dashed lines). The mean and variance of the red and blue curves were used for image corrections (see ‘Materials and methods’ for details). (C) Mean FRET-p-Tyr intensity distribution before (black curve) and after correction (red curve).
Figure 1—figure supplement 2
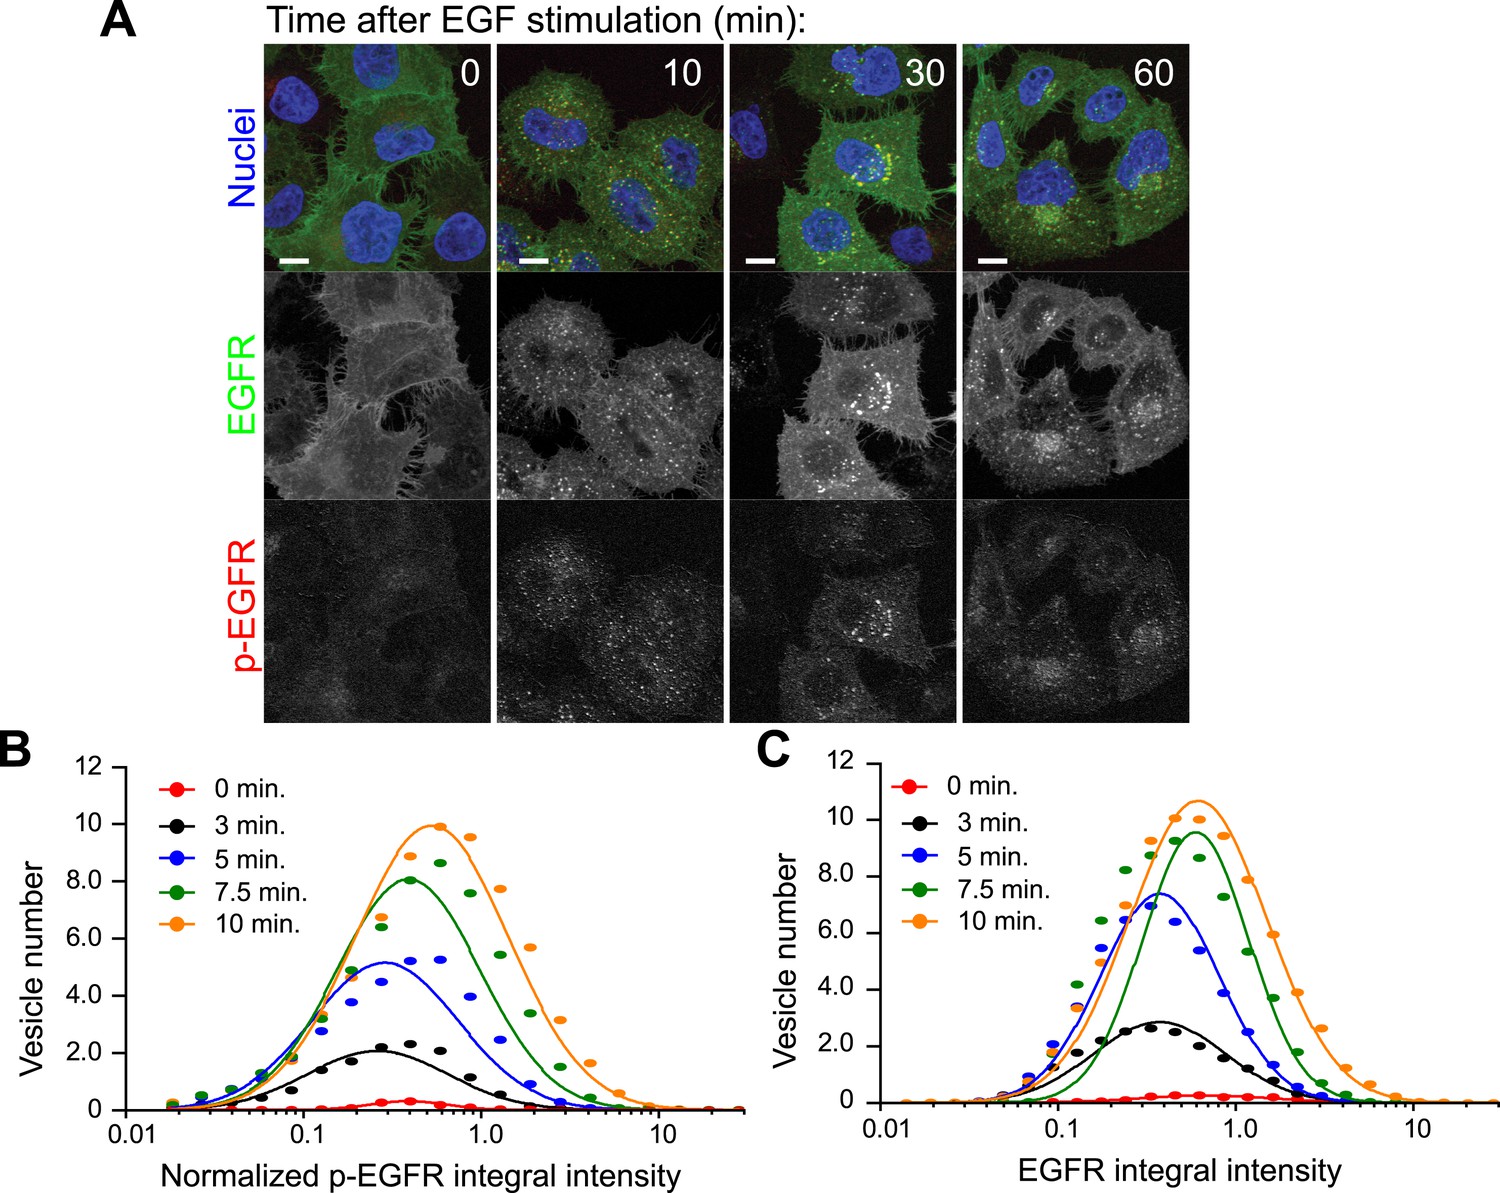
EGFR and p-EGFR measurements by FRET microscopy.
(A) Representative images of HeLa EGFR-GFP BAC cells after continuous stimulation with 10 ng/ml EGF for the indicated time points. EGFR-GFP fluorescence is shown in green, the corrected p-EGFR intensity is shown in red, and DAPI-stained nuclei are shown in blue. Measurements from each individual endosome were used for all quantifications. Scale bars, 10 μm. (B–C) Time course of histogram distributions of the total p-EGFR (B) or EGFR (C) integral intensity per endosome upon EGF stimulation as in Figure 1. The histogram shows the number of vesicles per 1000 μm2 of the area covered by cells. Intensity values were scaled by the mode of the histogram at 10 min. In all graphs, experimental points were fitted with a log-normal distribution. Points show the mean from three independent experiments with a total of ∼150 cells per time point or condition.
Figure 1—figure supplement 3
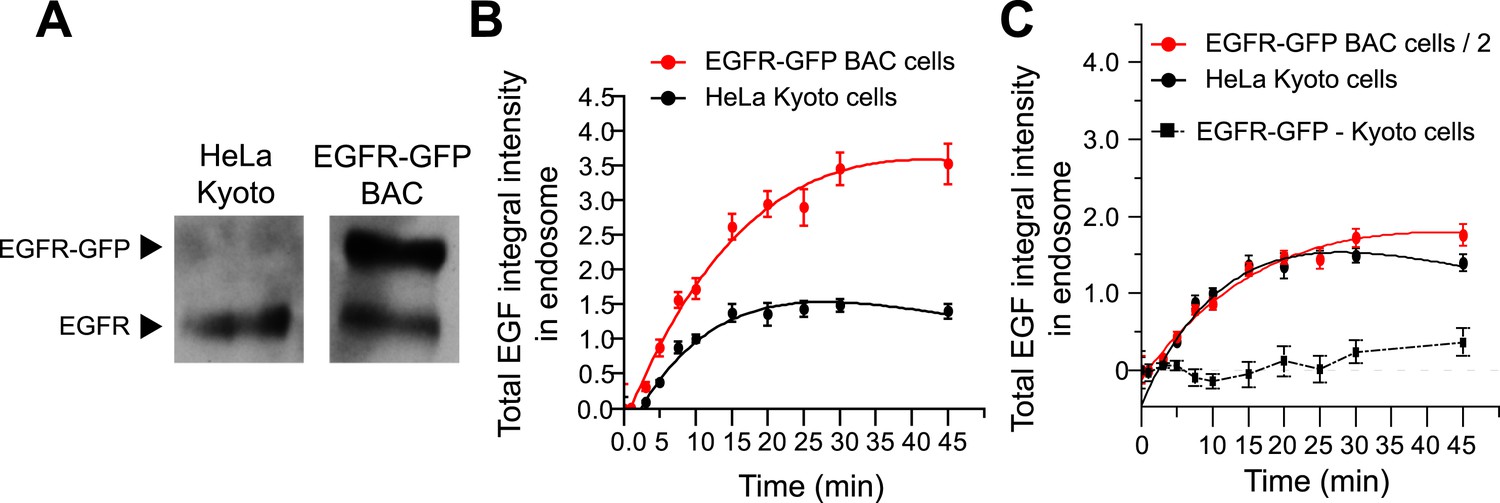
BAC expression of EGFR-GFP does not change EGF transport kinetics.
(A) Representative Western blot of comparing the expression of EGFR and EGFR-GFP in HeLa Kyoto and HeLa EGFR-GFP BAC cells. The lower band corresponds to the untagged receptor, whereas the upper band corresponds to EGFR-GFP, which is absent in HeLa Kyoto cells. (B) Time course of EGF integral intensity in endosomes in HeLa Kyoto (black curve) and HeLa EGFR-GFP BAC cells (red curve). Intensity curves were normalized to the intensity value at 10 min for HeLa Kyoto cells. (C) Comparison of both time courses after dividing the HeLa EGFR-GFP BAC cells by 2. Squares show the difference between both curves. Experimental points show mean ± SEM from one representative experiment with a total of ∼150 cells per time point and condition. Time courses were fitted as in Figure 1.
Figure 1—figure supplement 4
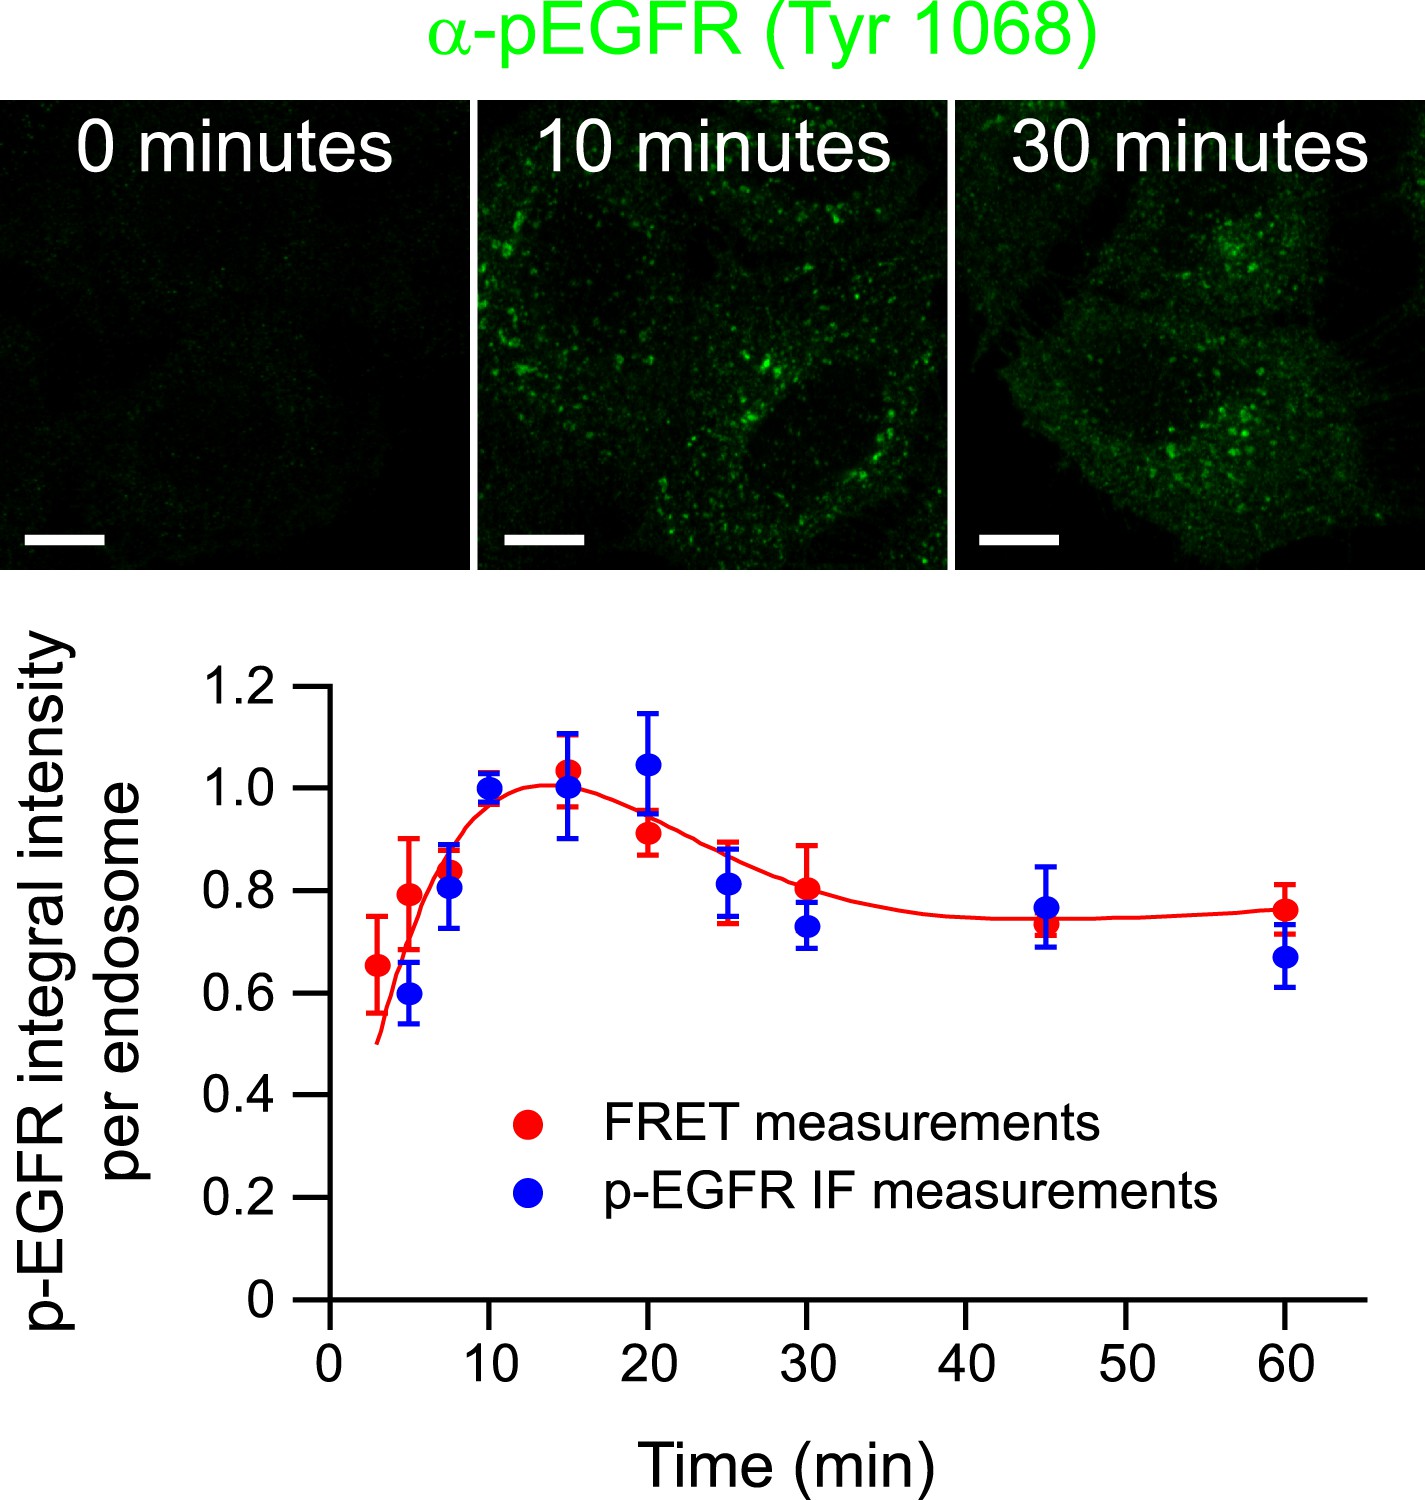
Validation of FRET measurements with a specific anti-Tyr1068 antibody.
Representative images of p-EGFR staining by an antibody against a single phospho-tyrosine residue of EGFR after 0, 10, and 30 min of continuous stimulation with 10 ng/ml EGF. Scale bars, 10 μm. Time course of the p-EGFR mean integral intensity per endosome measured by standard immunofluorescence (blue) and by FRET assay (red). For comparison, both curves were normalized to the value at 10 min. Experimental points were fitted as in Figure 1A.
Figure 1—figure supplement 5
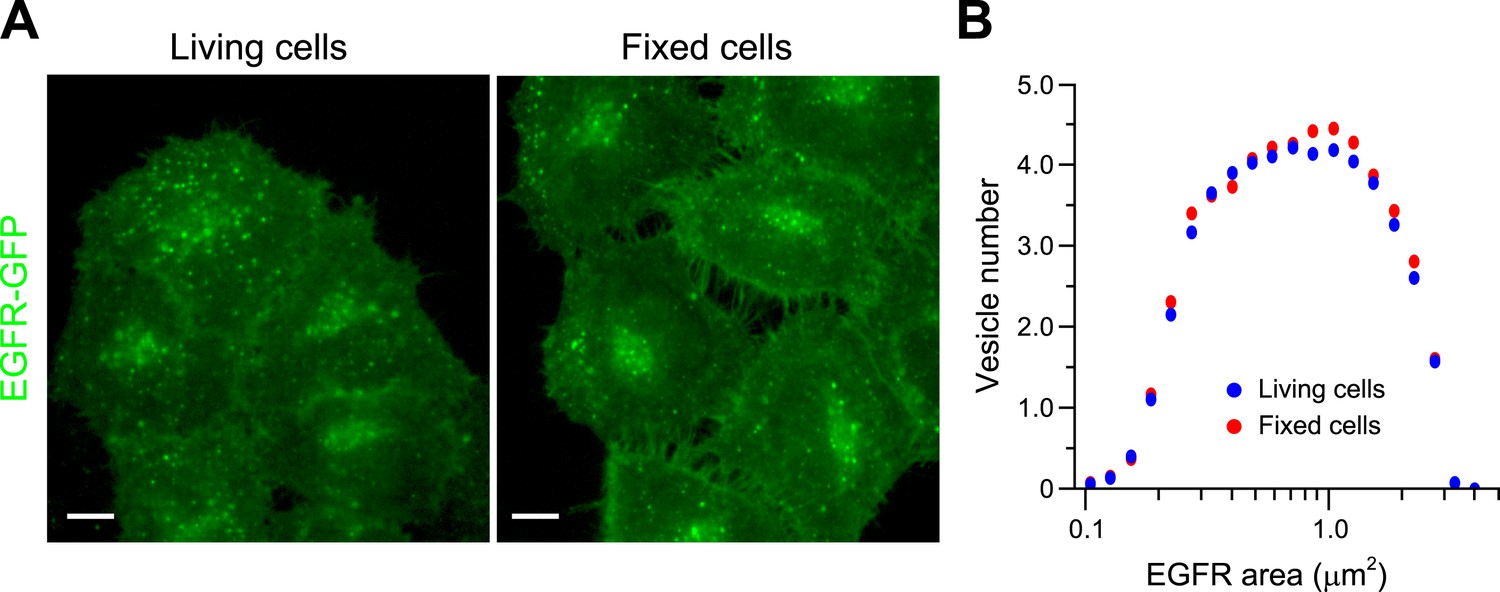
PFA fixation does not significantly change endosome EGFR endosome morphology.
(A) Representative images of HeLa BAC cells expressing EGFR-GFP after 20 min of stimulation with 10 ng/ml EGF before (left panel) or after fixation (right panel). Scale bars, 10 μm. (B) Histogram distribution of EGFR endosome area before (blue) and after fixation (red). The histogram shows the number of EGFR endosomes per 1000 μm2 of the area covered by cells. Measurements were taken from ∼500 cells from one representative experiment.
Figure 1—figure supplement 6
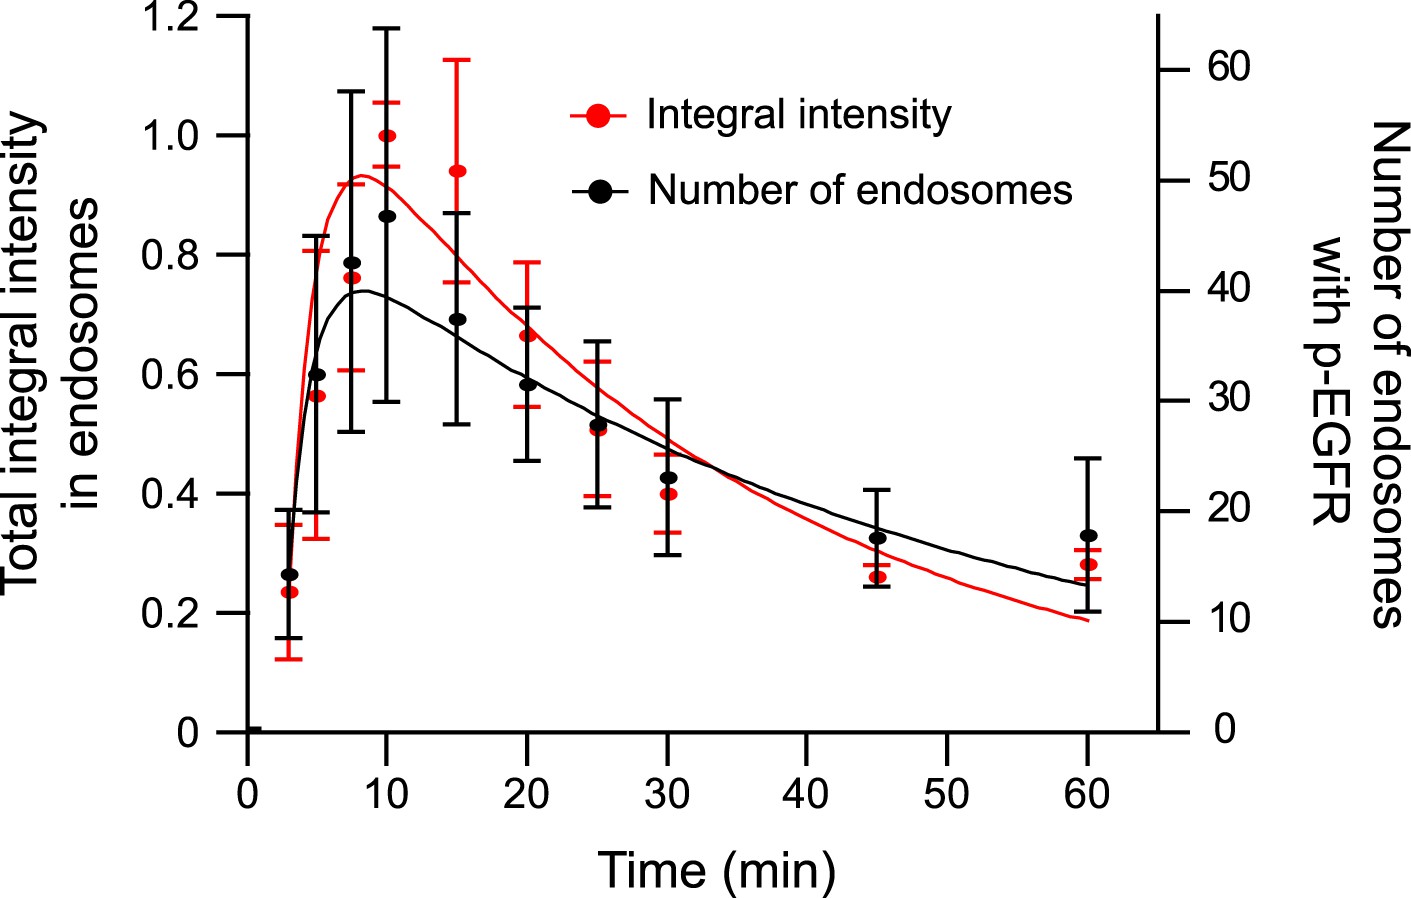
The total amount of p-EGFR in endosomes decays with the same kinetics as the number of endosomes with p-EGFR.
Time course of total integral p-EGFR intensity in endosomes (red) and endosomes with p-EGFR (black) per 1000 μm2 of the area covered by cells (black) after stimulation with 10 ng/ml EGF as in Figure 1. Points show mean ± SEM. All measurements were done in three independent experiments with a total of ∼150 cells per time point or condition.
Figure 1—figure supplement 7
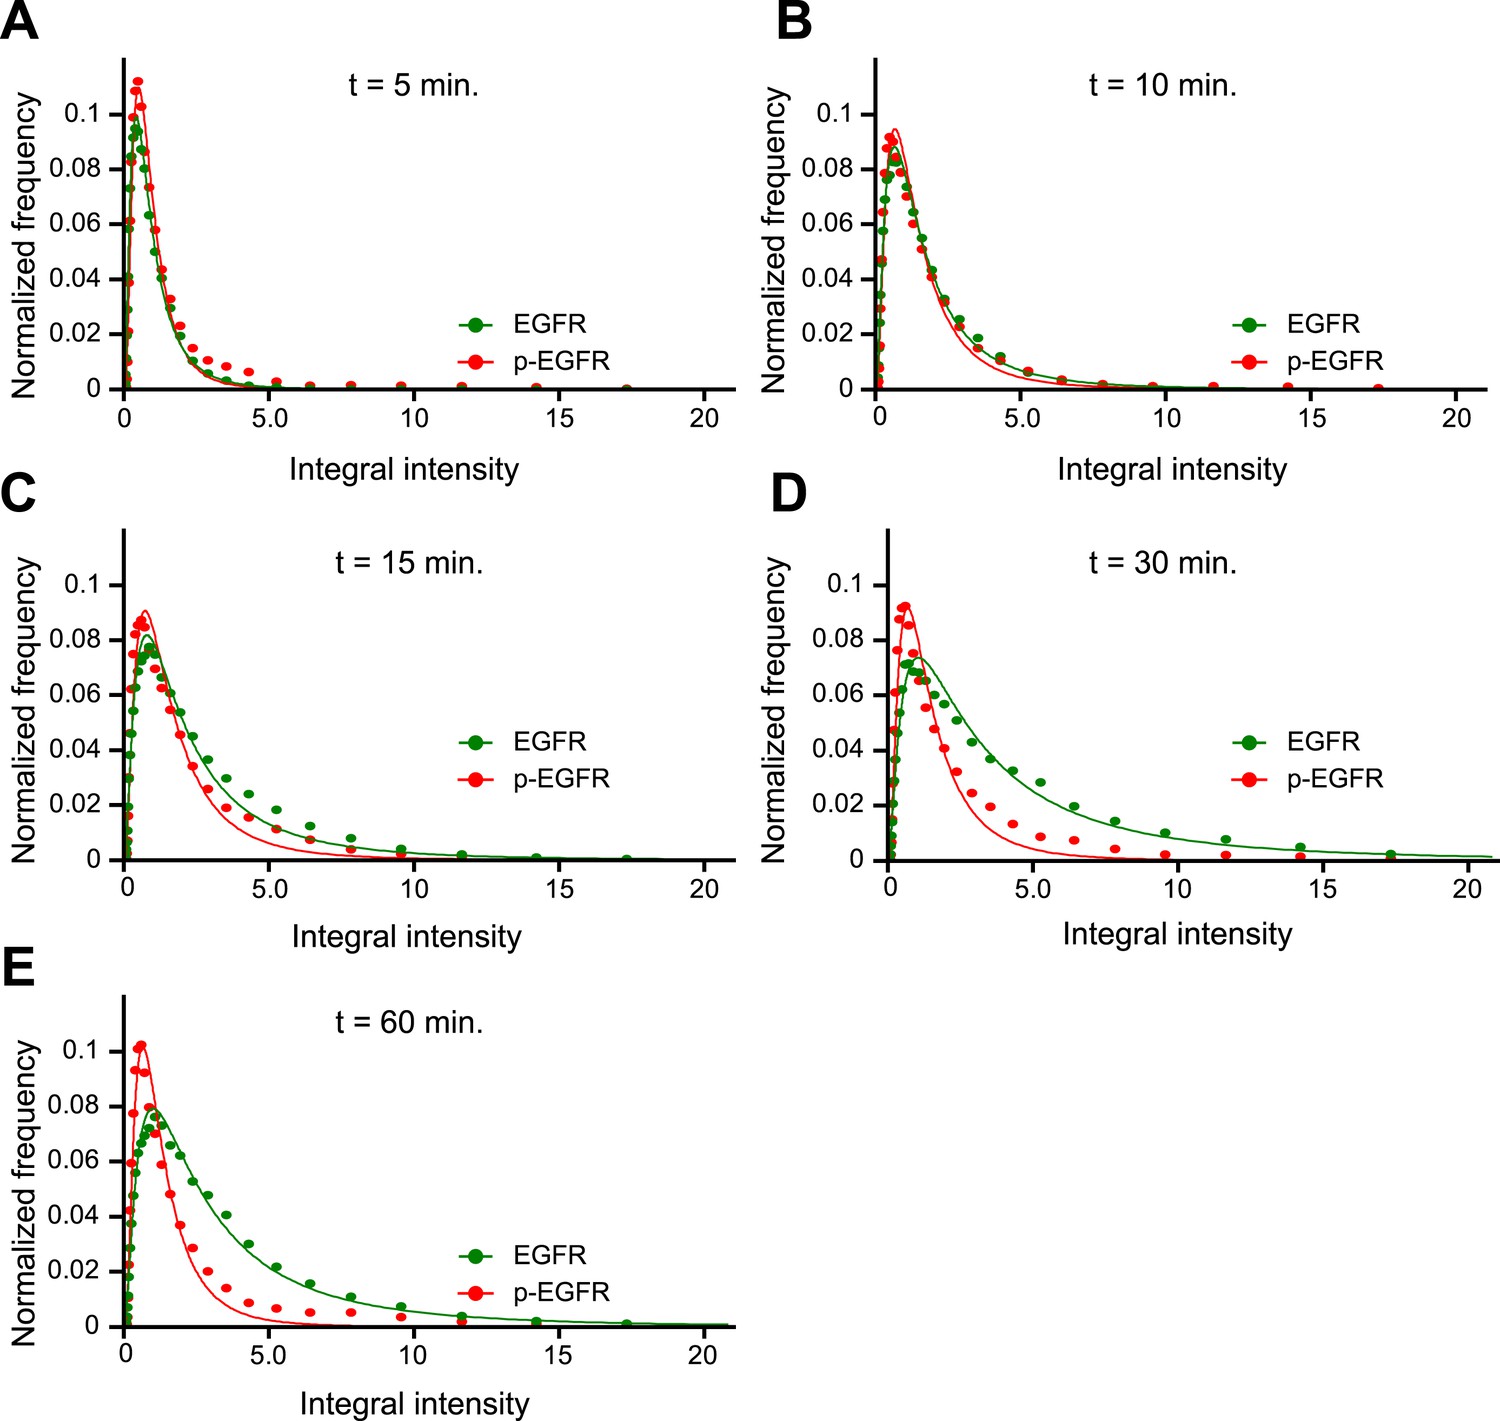
p-EGFR has a narrower integral intensity per endosome distribution than the total EGFR at late time points.
(A–E) Histogram distributions for the p-EGFR (red) or total EGFR (green) integral intensity per endosome at 5 (A), 10 (B), 15 (C), 30 (D), and 60 (E) min of continuous stimulation with 10 ng/ml EGF. For comparison, the amplitude of all histograms was normalized by the curve integral and the integral intensity was scaled by the mode of each histogram. In all graphs, experimental points were fitted with a log-normal distribution. Points show the mean from three independent experiments with a total of ∼150 cells per time point or condition.
Figure 1—figure supplement 8
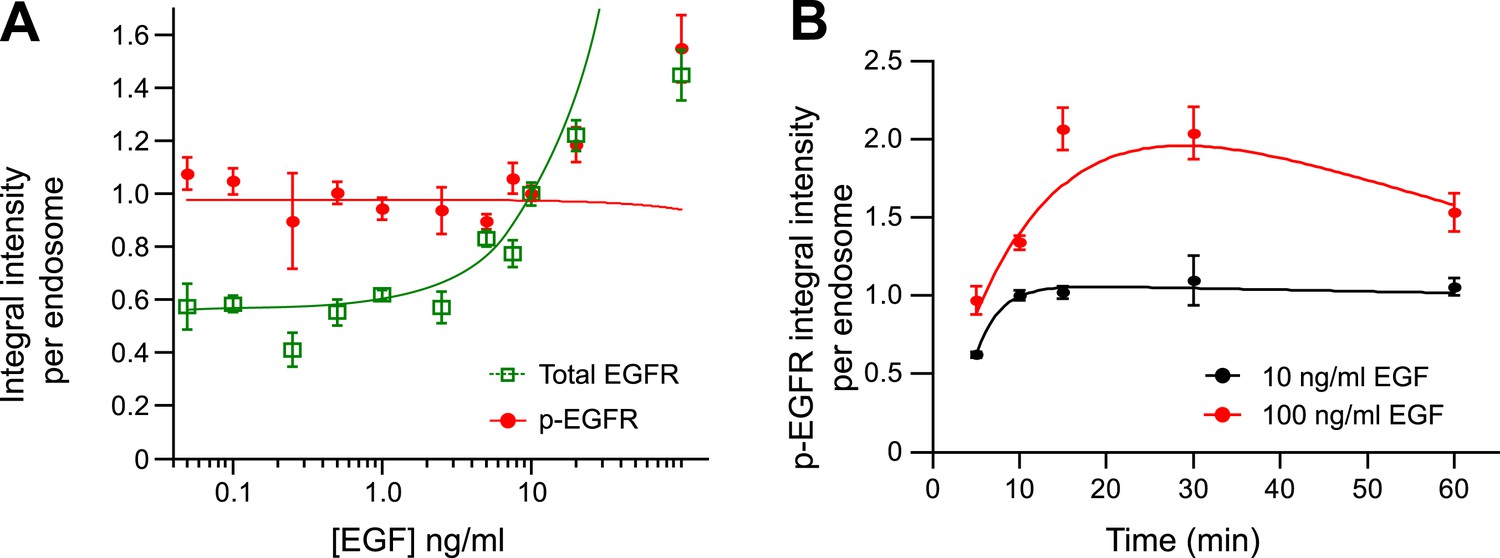
The mean amount of p-EGFR per endosome increases at high concentrations of EGF.
(A) Mean integral intensity of EGFR (green curve) and p-EGFR (red curve) per endosome upon stimulation with different EGF concentrations for 30 min (B) Time course of mean integral intensity of p-EGFR per endosome after continuous stimulation with 10 ng/ml (black curve) or 100 ng/ml (red curve) EGF. Curves were normalized by the intensity value at 10 min for 10 ng/ml EGF. Experimental points were fitted as in Figure 1A.
Figure 1—figure supplement 9
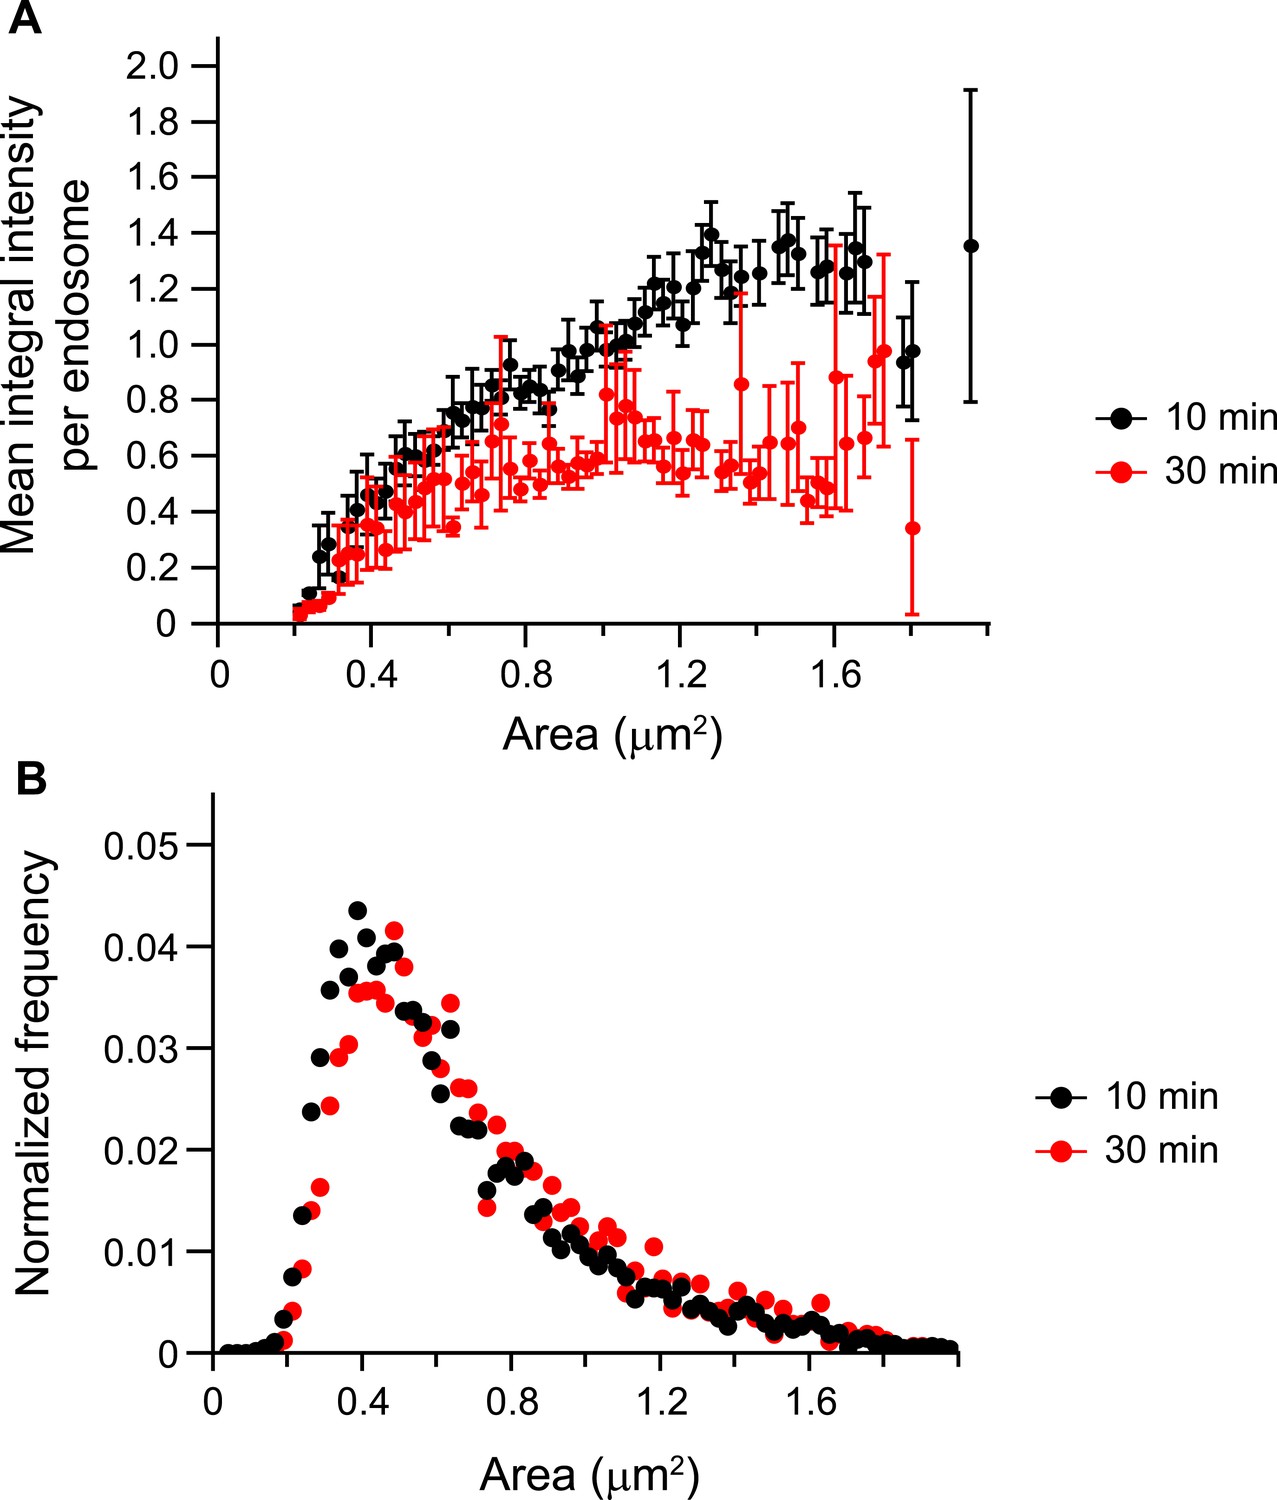
The mean p-EGFR amount per endosome does not correlate with endosome area at late time points after EGF stimulation.
(A) Mean p-EGFR integral intensity per endosome as a function of endosome area upon 10 (black curve) or 30 min (red curve) of EGF stimulation. Both curves were normalized to the intensity value at 1 μm2 for 10 min stimulation. (B) Histogram distribution of endosome area upon 10 (black curve) or 30 min (red curve) of EGF stimulation. Each histogram was normalized by its respective curve integral. Points show mean ± SEM. All measurements were done in three independent experiments with a total of ∼150 cells per time point or condition.
Figure 2 with 8 supplements
The constant mean amount of p-EGFR per endosome corresponds to receptor clusters that are regulated by Hrs and PTPN11.
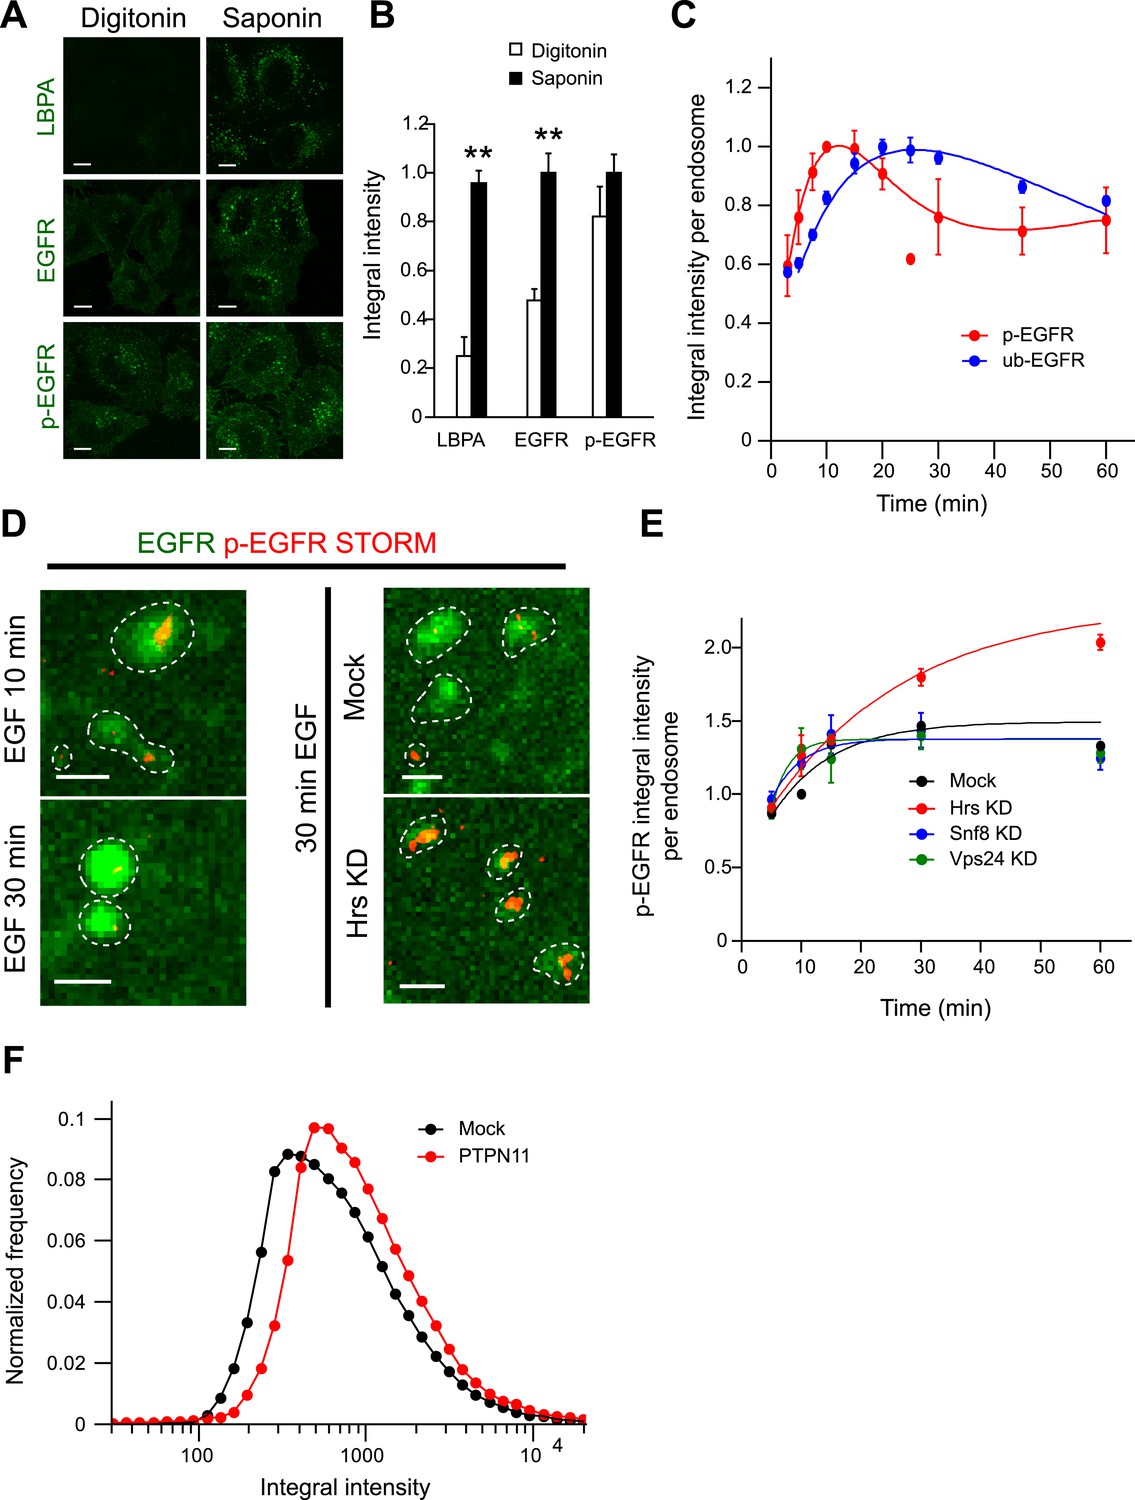
(A) Representative images of total EGFR and p-EGFR after staining with saponin or digitonin permeabilization methods. Immunofluorescence staining of LBPA is shown as a control marker for ILVs in MVBs. Scale bars, 10 μm. (B) Integral intensity of EGFR, p-EGFR, and LBPA (mean ± SEM) after permeabilization with digitonin or saponin. **p < 0.005 by a two-tailed t-test. Measurements were done in three independent experiments with a total of ∼150 cells per condition. (C) Time course of mean integral intensity per endosome for ub-EGFR (blue curve) upon EGF stimulation as in Figure 1A. p-EGFR is included for comparison. (D) Representative STORM images of p-EGFR (red) stained using a rabbit monoclonal anti-p-EGFR (Tyr 1068) antibody overlaid on top of a high magnification confocal image of EGFR (green). Left panels show clusters of p-EGFR upon stimulation with EGF for 10 or 30 min. Right panels show clusters of p-EGFR upon stimulation with EGF for 30 min in Hrs down-regulation or mock treatment. (E) Time course of the mean p-EGFR integral intensity per endosome in Hrs (red), Snf8 (blue), Vps24 (green), or mock-treated cells (black) (using three different siRNA oligonucleotides per gene). All curves were normalized by the intensity value at 10 min for the mock sample. Points show mean ± SEM from three different siRNAs per gene. Scale bar, 1 μm. (F) Integral intensity distribution of p-EGFR per endosome after down-regulation for 72 hr of PTPN11 (red) or in mock treatment (black) after continuous stimulation with 10 ng/ml EGF for 30 min. Red points show the average distribution of three different siRNAs. Experimental points were fitted as in Figure 1A.
Figure 2—figure supplement 1
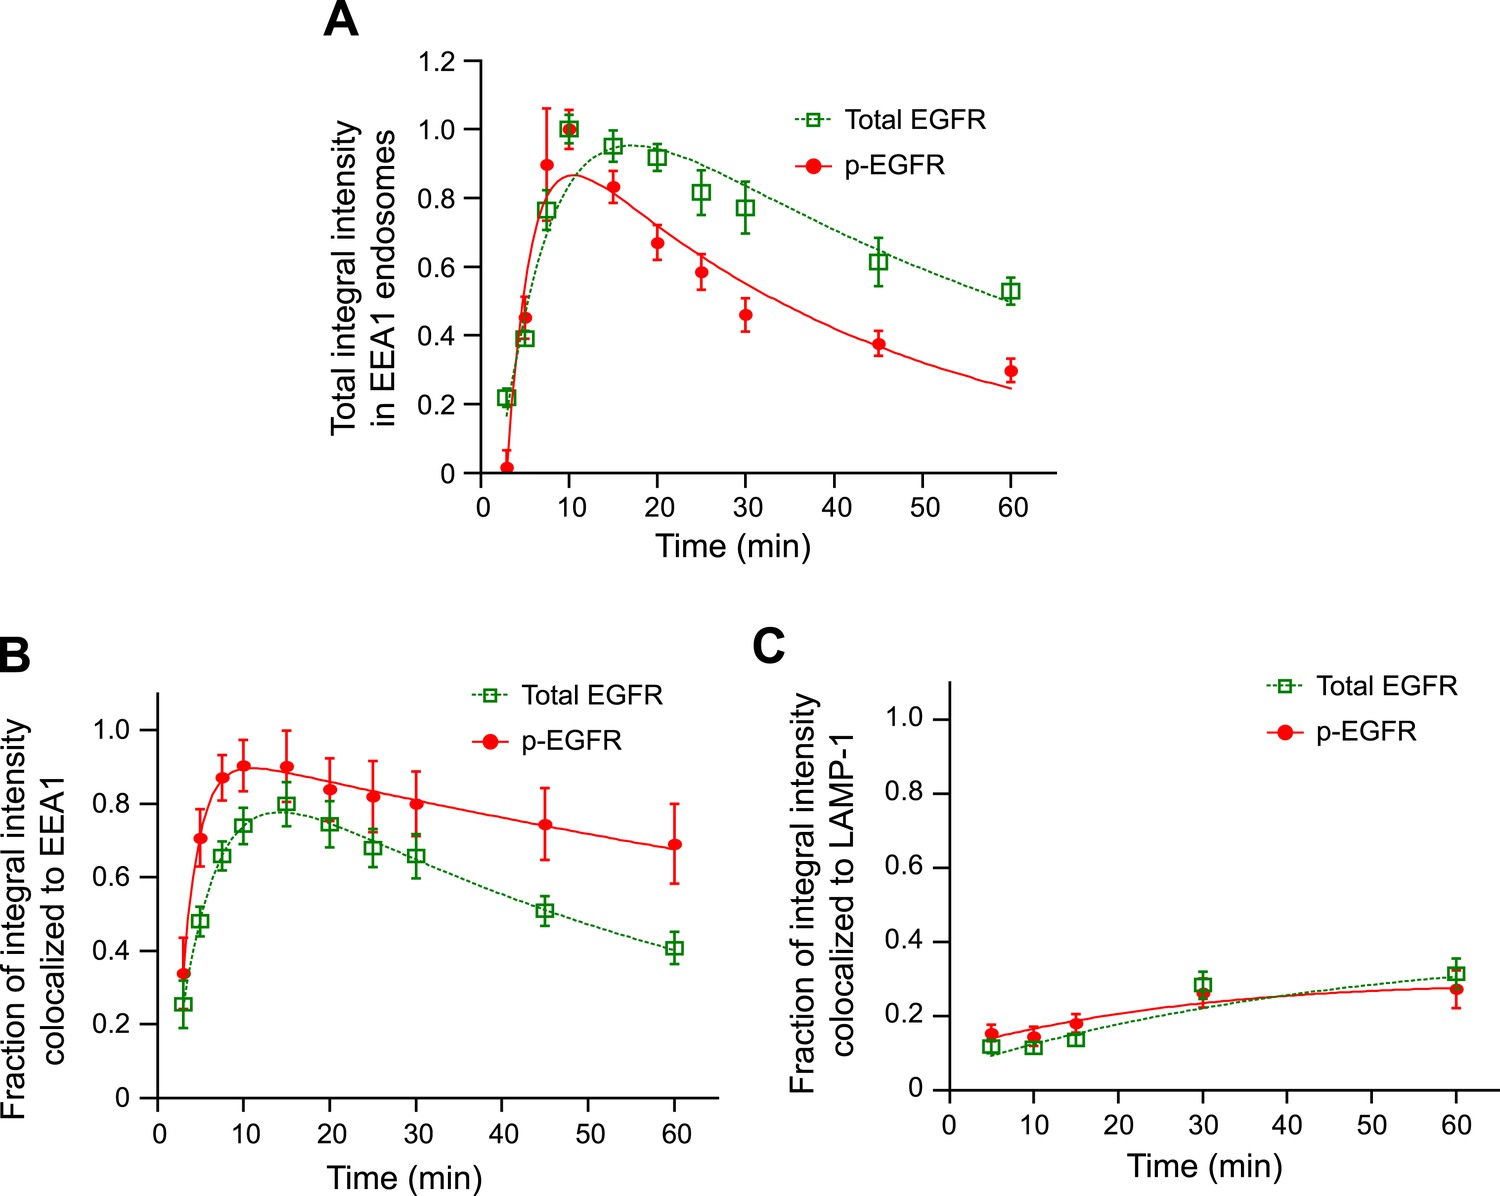
The majority of the p-EGFR is located in EEA1-positive endosomes.
(A) Time course of integral intensity of total EGFR (green curve) and p-EGFR (red curve) colocalizing with EEA1 after continuous stimulation with 10 ng/ml EGF for different time points. Intensity curves were normalized to the intensity value at 10 min (B–C) Fraction of the total integral intensity of EGFR (green curve) or p-EGFR (red curve) colocalized with EEA1 (B) or LAMP-1 (C). In all cases, points show mean ± SEM. Measurements were done in three independent replicates with a total of ∼150 cells per time point or condition. Time courses were fitted to obtain the decay half-time τ (for details on the fitting procedure see ‘Materials and methods’).
Figure 2—figure supplement 2
ub-EGFR measurements by FRET microscopy.
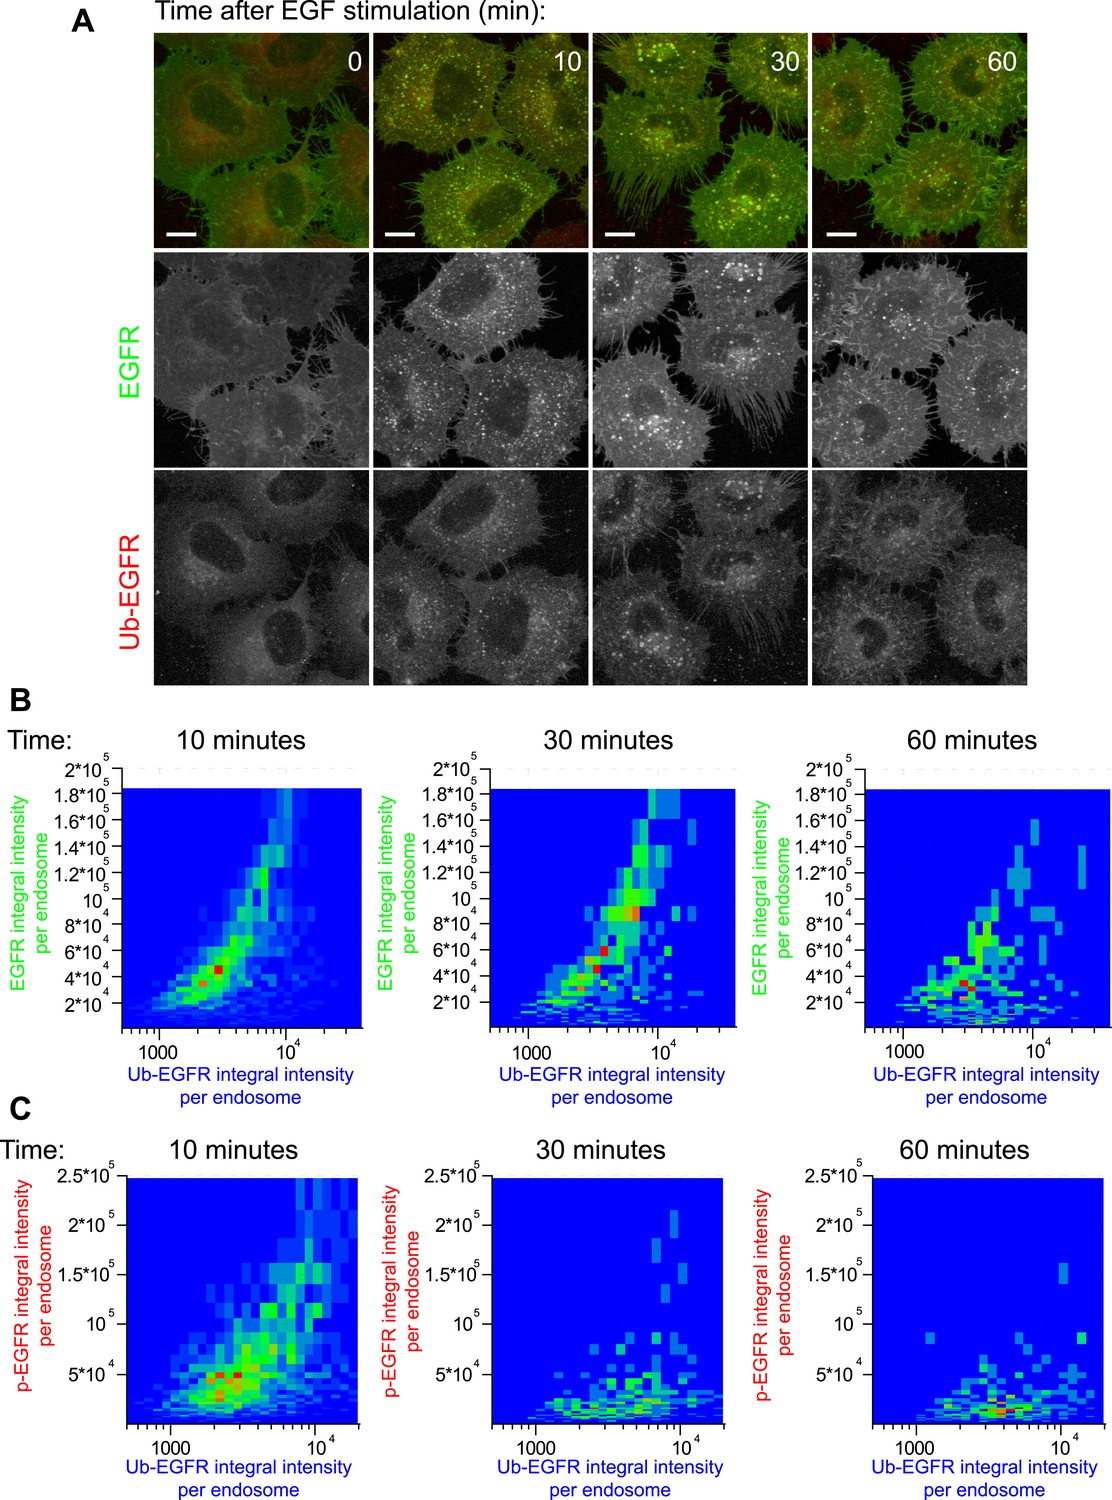
(A) Representative images of HeLa EGFR-GFP BAC cells after continuous stimulation with 10 ng/ml EGF for the indicated time points. EGFR-GFP fluorescence is shown in green, the corrected ub-EGFR intensity is shown in red. Measurements from each individual endosome were used for all quantifications. Scale bars, 10 μm. (B–C) Heat map of the 2D co-distribution of ub-EGFR and EGFR (B) or ub-EGFR and p-EGFR (C) integral intensity per endosome upon EGF stimulation as in Figure 1 after 10, 30, or 60 min. ub-EGFR and EGFR are well correlated, whereas the distribution of p-EGFR is significantly narrower than ub-EGFR at 30 and 60 min. Heat maps show the result of one representative experiment.
Figure 2—figure supplement 3
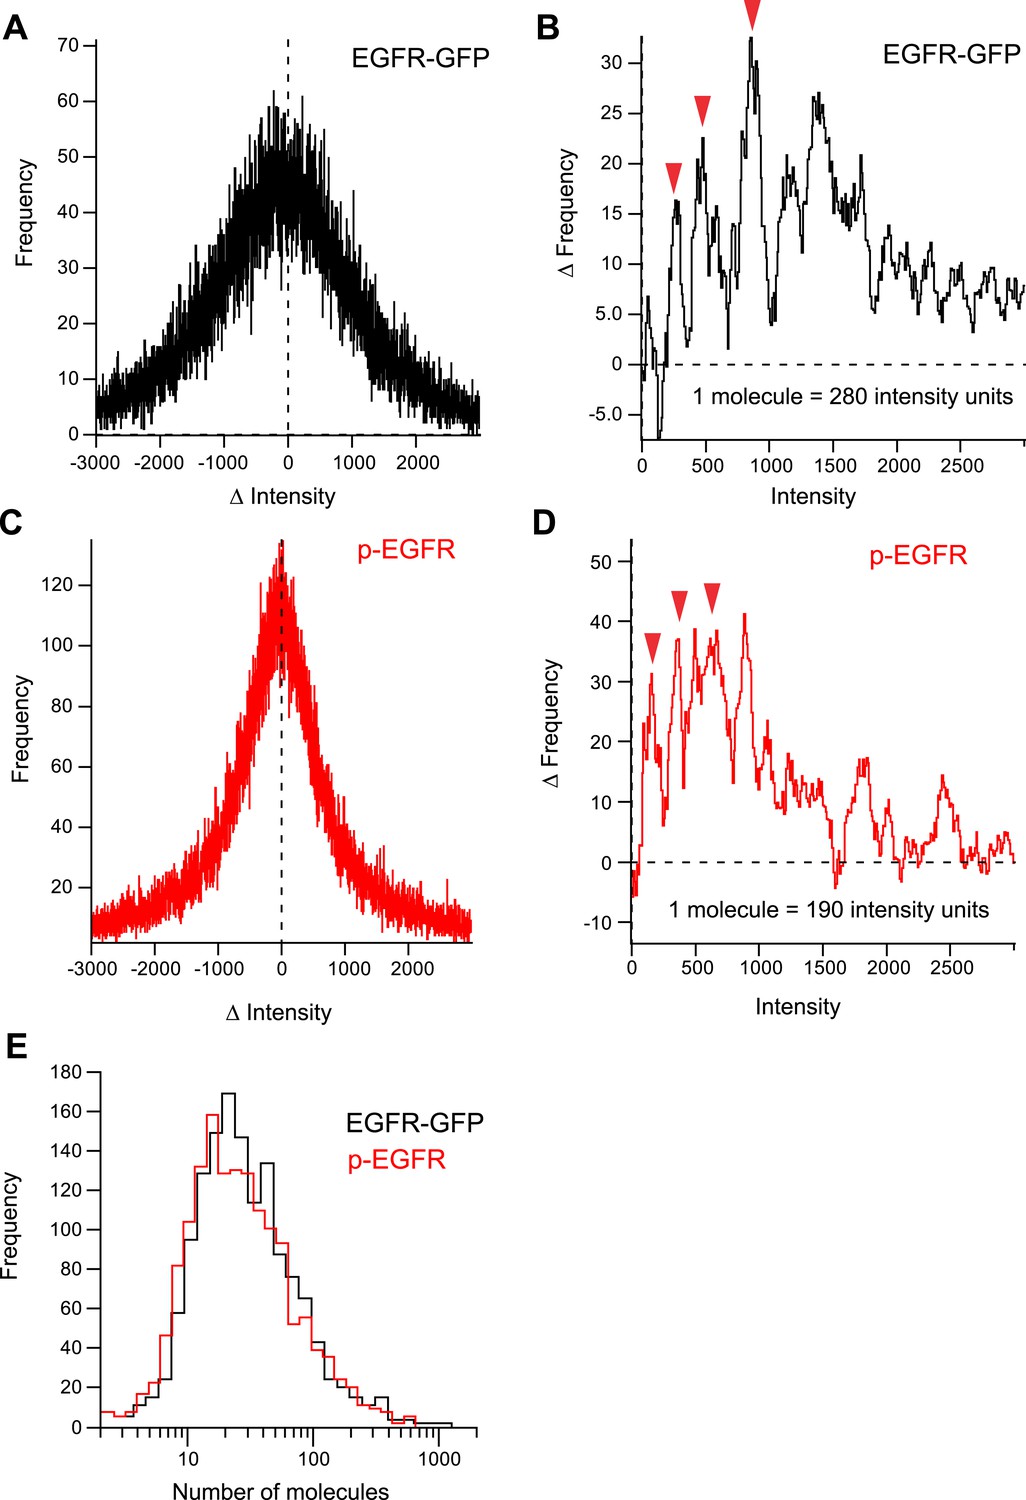
Quantification of number of EGFR and pEGFR molecules per endosome.
(A) Distribution histogram of the differences in intensity between individual endosomes in consecutive frames during sequential photo-bleaching of EGFR-GFP (see ‘Materials and methods’ for details). (B) Difference between the number of positive and negative events in (A) for each ΔIntensity value. (C) Distribution histogram of the differences in intensity between individual endosomes in consecutive frames during sequential photo-bleaching of p-EGFR (see ‘Materials and methods’ for details). (D) Difference between the number of positive and negative events in (C) for eachΔIntensity value. The local amplitude maxima of the periodic function in (B) and (D) give an estimate of the change in intensity values when 1,2,3, …, n number of molecules are bleached. (E) Distribution of the number of molecules of EGFR-GFP and p-EGFR in individual endosomes after stimulation with 10 ng/ml EGF for 10 min.
Figure 2—figure supplement 4
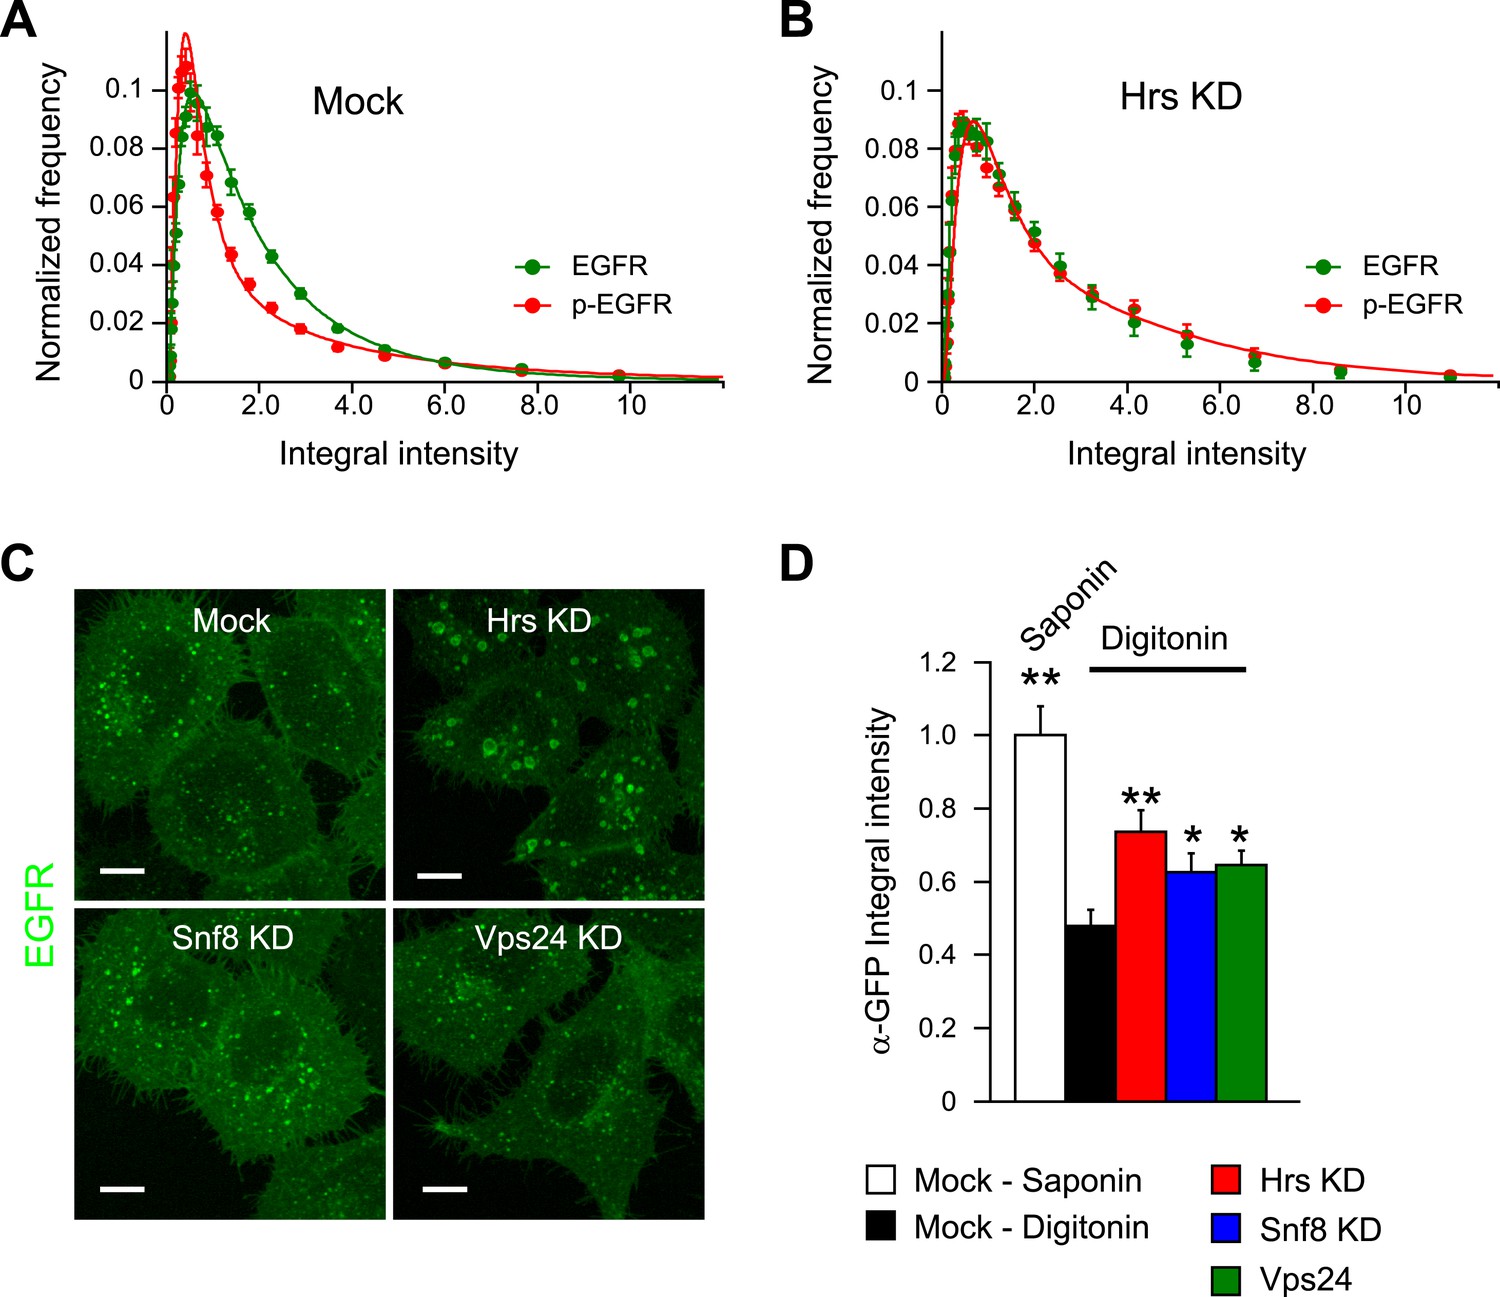
Hrs, but not ESCRT-II or ESCRT-III components, increases the mean p-EGFR amount per endosome.
(A–B) Histogram distributions of the total EGFR (green) or p-EGFR (red) integral intensity per endosome after 30 min of EGF stimulation as in Figure 5 for Hrs (A) or mock-treated cells (B). (C) Representative images of HeLa EGFR BAC cells after continuous stimulation with 10 ng/ml EGF for 30 min and Hrs, Snf8, or Vps24 knock-down. Scale bars, 10 μm. (D) Changes in EGFR at the endosomal surface after knock-down of different ESCRT components measured by the differential permeabilization assay shown in Figure 2A Bar graphs show mean ± SEM. Measurements were done in three independent experiments using three different siRNA oligonucleotides with a total of ∼150 cells. In all graphs, experimental points were fitted with a log-normal distribution. Points show the mean from three independent experiments with a total of ∼150 cells per time point or condition.
Figure 2—figure supplement 5

Kinetics of Shc1 recruitment to endosomes.
(A) Representative images of HeLa EGFR-GFP BAC cells before (left panel) and after 10 min stimulation with 10 ng/ml EGF (right panel). EGFR fluorescence is shown in green and Shc1 is shown in red. (B) Time course of mean integral intensity of Shc1 per endosome (black curve). The mean intensity of p-EGFR per endosome (red curve) is included for comparison. (C) Mean integral intensity of Shc1 per endosome as a function of EGF concentration. The curve was normalized to the intensity value at 10 ng/ml EGF. The solid line is a least square fits to the experimental points. In all cases, points show mean ± SEM. Measurements were done in three independent replicates with a total of ∼150 cells per time point or condition. Time courses were fitted as in Figure 1.
Figure 2—figure supplement 6
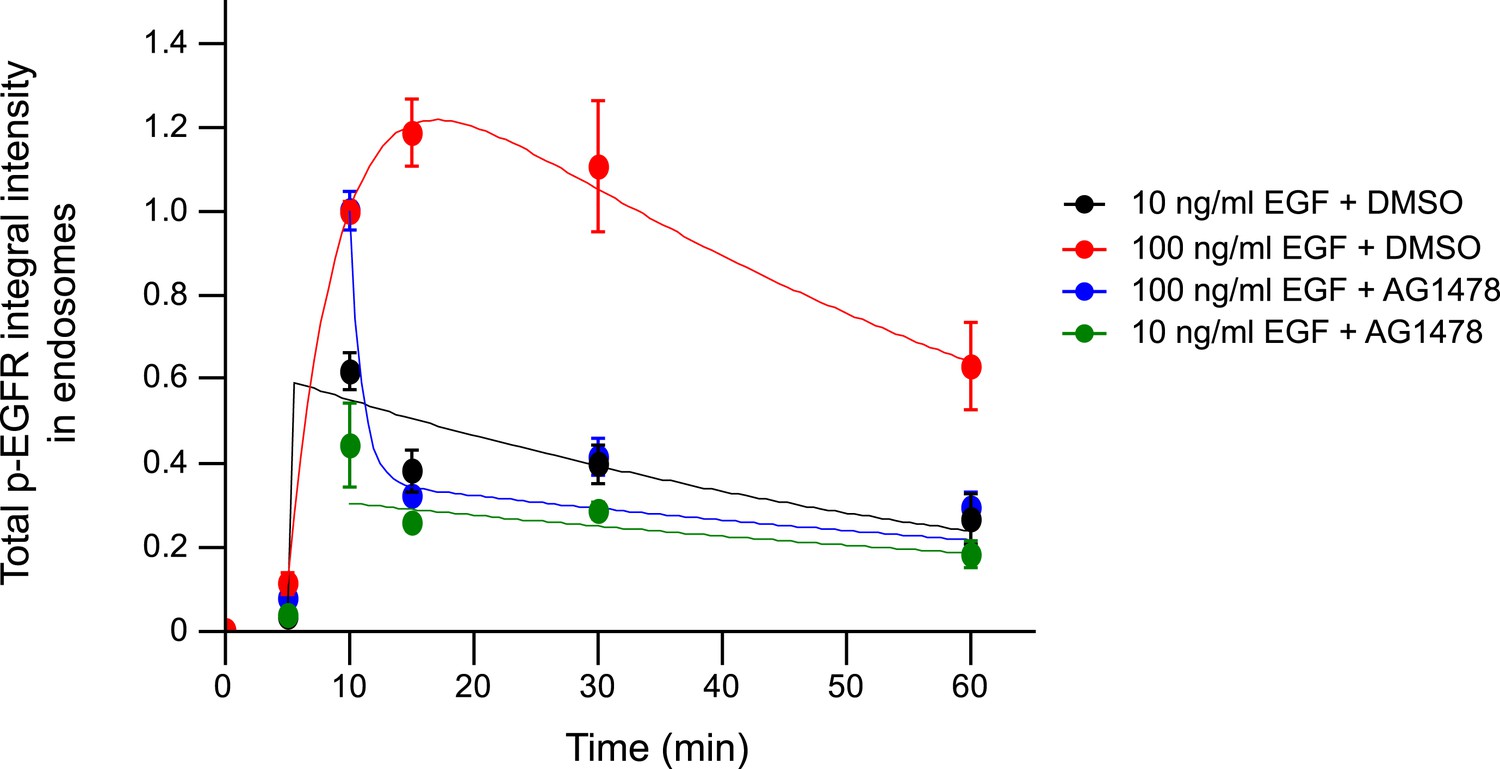
Pharmacological inhibition of EGFR kinase rapidly decreases the total p-EGFR in endosomes only at high but not low EGF concentrations.
Time course of the total p-EGFR integral intensity upon stimulation with 10 (black and green curves) or 100 ng/ml (red and blue curves) of EGF. AG1478 (green and blue curves) was added 10 min after stimulation with EGF and remained in the medium throughout the time course. All curves were normalized by the intensity value at 10 min for the DMSO—10 ng/ml sample. Experimental points were fitted as in Figure 1. Points show mean ± SEM of ∼150 cells per time point and condition from one representative experiment.
Figure 2—figure supplement 7
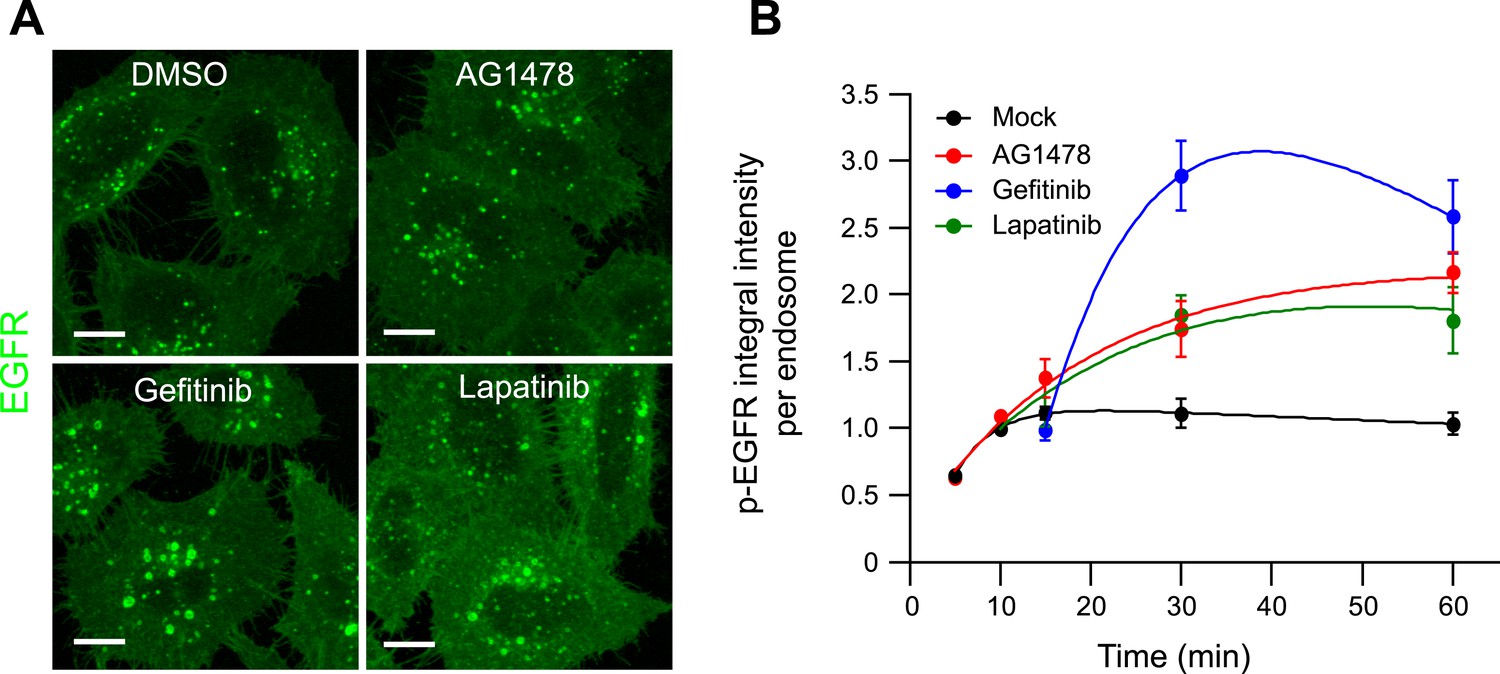
Pharmacological inhibition of EGFR kinase activity increases the mean p-EGFR amount per endosomes.
(A) Representative images of HeLa EGFR BAC cells after continuous stimulation with 10 ngl/ml EGF for 30 min. Inhibitors were added 10 min after stimulation with EGF and remained in the medium throughout the time course. Scale bars, 10 μm. (B) Time course of the mean p-EGFR integral intensity per endosome in AG1478 (red), Gefitinib (blue), Lapatinib (green), or DMSO-treated cells (black). All curves were normalized by the intensity value at 10 min for the mock sample. Experimental points were fitted as in Figure 1. Measurements for AG1478 were done in three independent experiments; measurements from Gefitinib and Lapatinib show a representative experiment with a total of ∼150 cells per time point and condition.
Figure 2—figure supplement 8
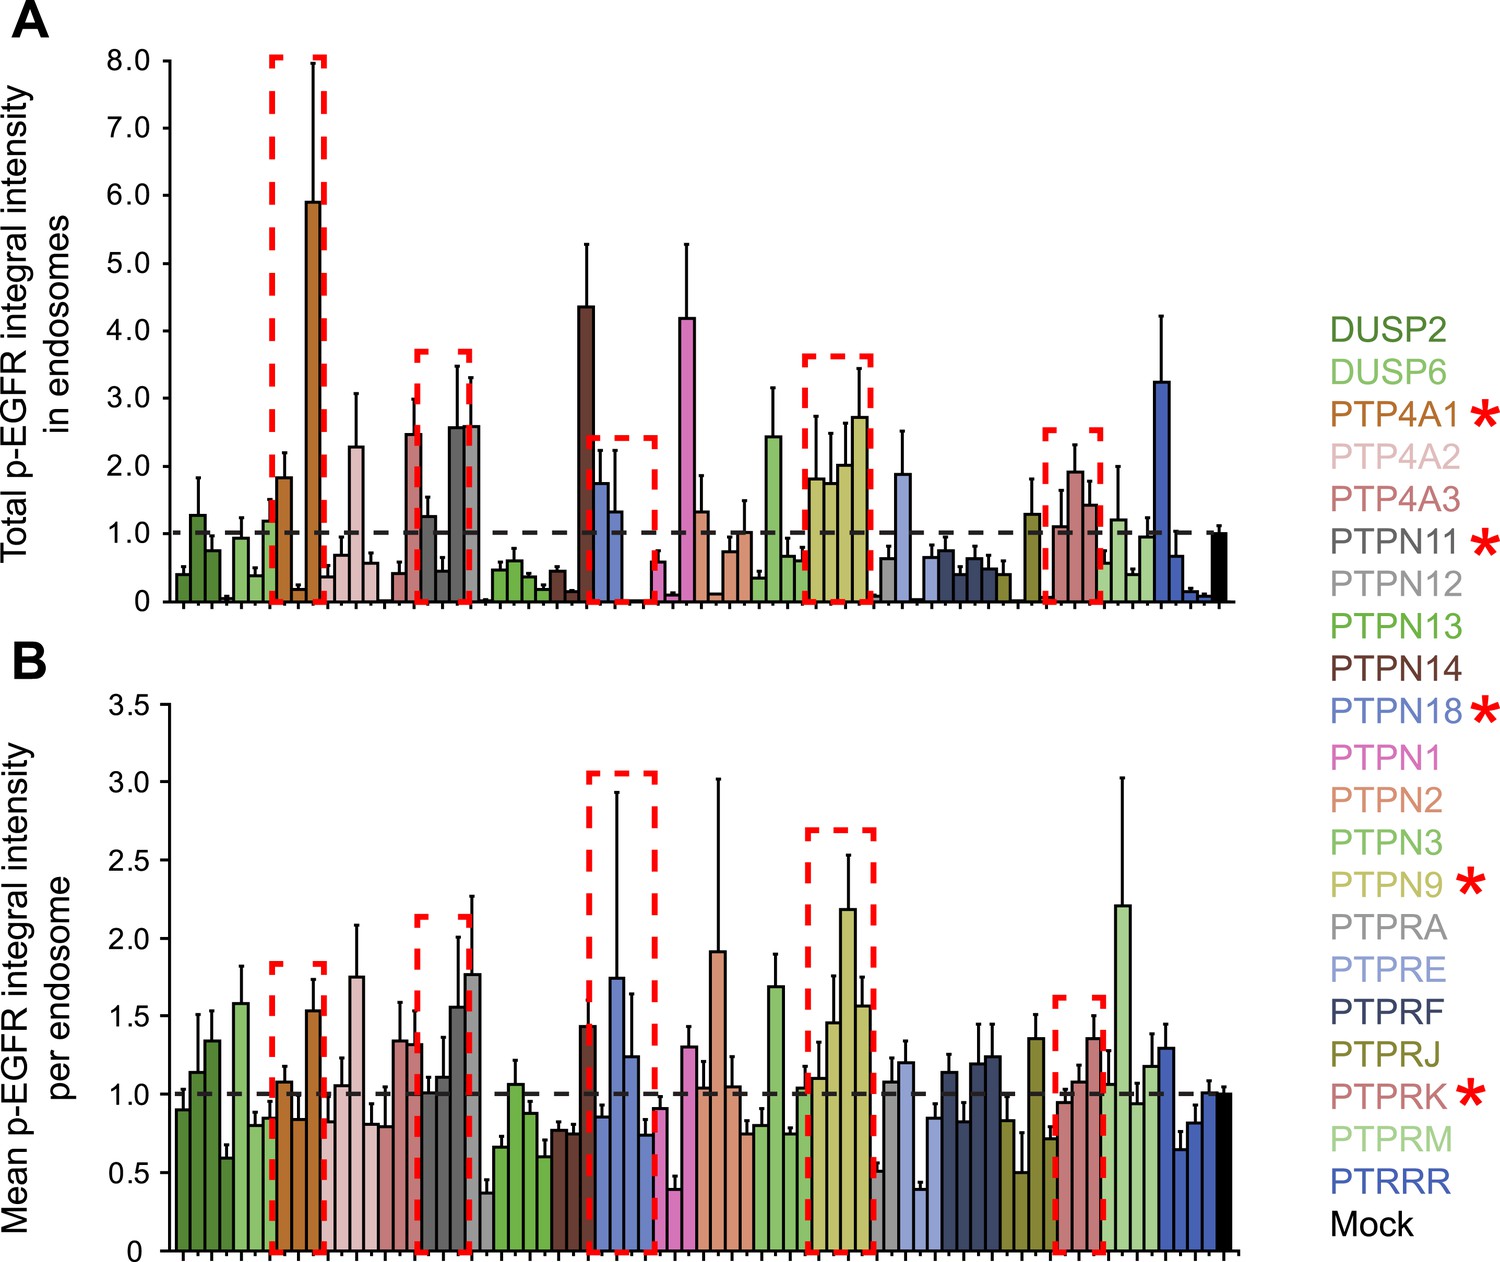
Phosphatases can control the p-EGFR packaging in endosomes.
(A) Total p-EGFR integral intensity after continuous stimulation with 10 ng/ml EGF in HeLa EGFR-GFP BAC cells and down-regulation of the indicated phosphatase or treatment with transfection reagent only. (B) Mean p-EGFR integral intensity per endosome after continuous stimulation with 10 ng/ml EGF in HeLa EGFR-GFP BAC cells and down-regulation of the indicated phosphatase or treatment with transfection reagent only. In both cases, bars are colour coded according to their respective phosphatase. All phosphatases were down-regulated with at least three oligos. Bars show mean ± SEM of all images for each oligo.
Figure 3 with 1 supplement
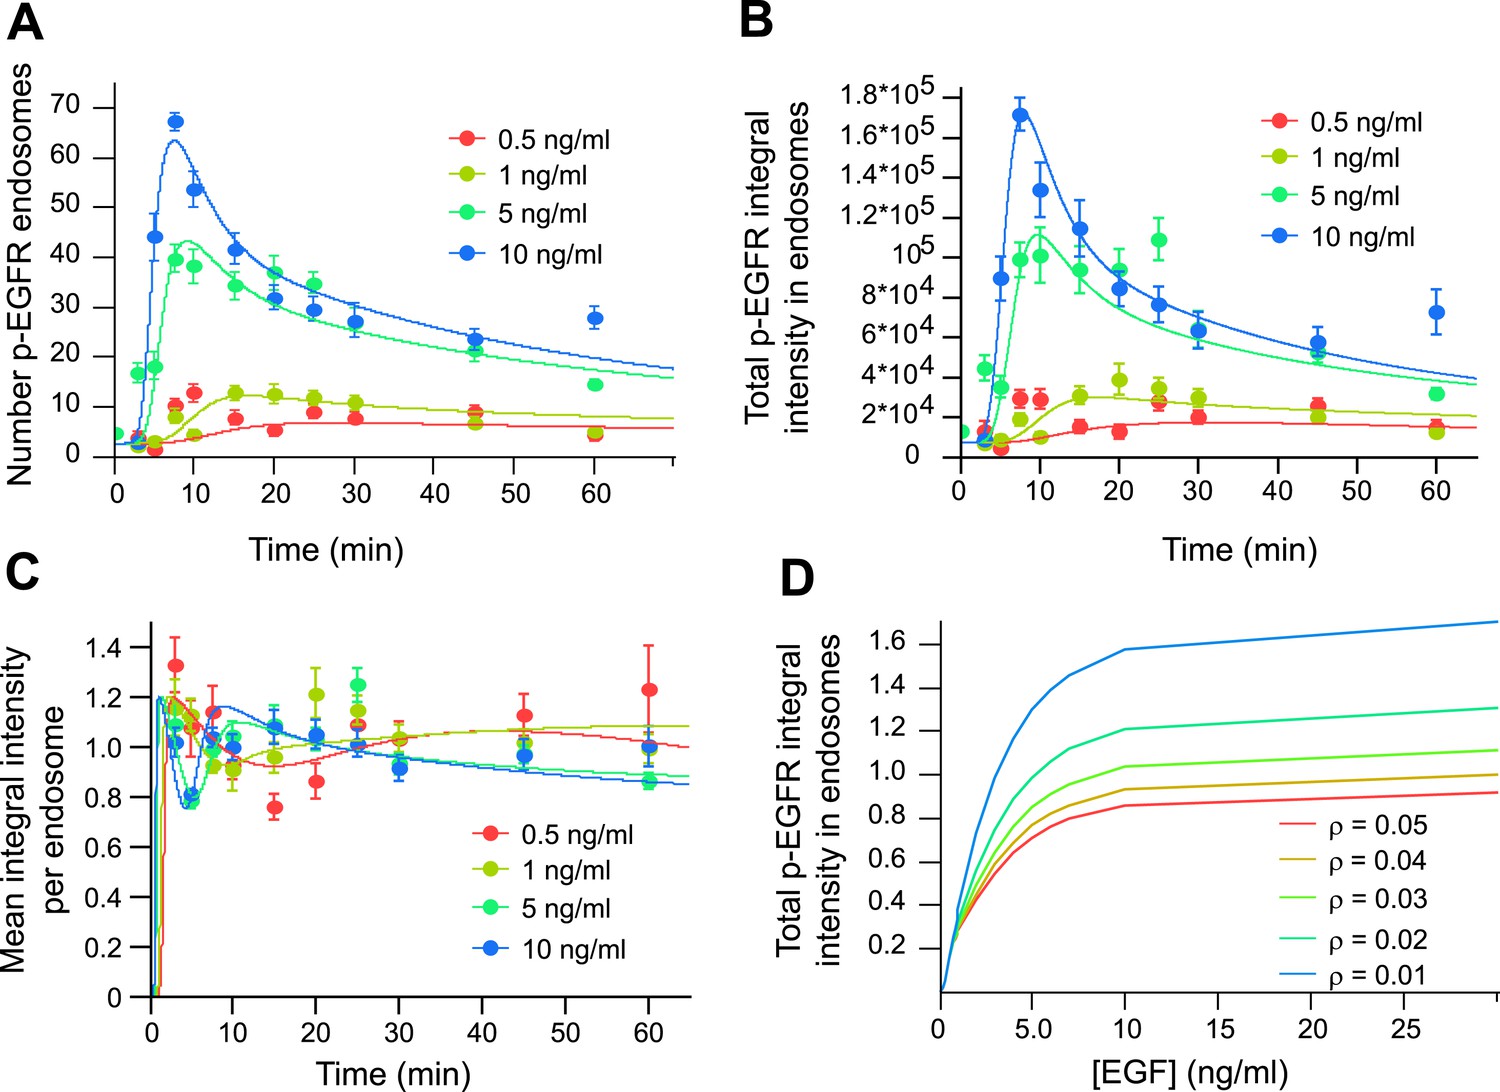
Mathematical model of p-EGFR predicts signalling amplitude and duration depends on early endosome fusion/fission rate.
Parameters of the mathematical model were fitted to the experimentally measured number of p-EGFR endosomes, total integral intensity of p-EGFR, mean integral intensities of p-EGFR per endosome and total vesicular EGFR. The experimental data were obtained in a time course of EGF stimulation at four concentrations (0.5, 1.0, 5.0, and 10 ng/ml, colour coded as indicated). The fit results are presented on panels (A–C). The experimental data and model predictions are drawn as filled circles and solid curves, respectively. (A) Number of p-EGFR endosomes per 1000 μm2 of cell area. (B) Total integral intensity of p-EGFR measured by FRET. The scaling factors that convert arbitrary numbers of the model to the experimental data were found by the least square procedure (see ‘Materials and methods’). (C) Comparison of mean integral intensity of p-EGFR per endosome measured experimentally (filled circles) and mathematical model (solid curves) of the time course of p-EGFR upon EGF stimulation as in Figure 1A. The concentration of EGF is colour coded as presented. (D) Model predictions of the total amount of p-EGFR in endosomes as a function of EGF concentration and in the presence of different homotypic early endosome fusion rates (colour coded as indicated).
Figure 3—figure supplement 1
A mathematical model without the non-linear phosphorylation dependency cannot describe the mean amount of p-EGFR per endosome.
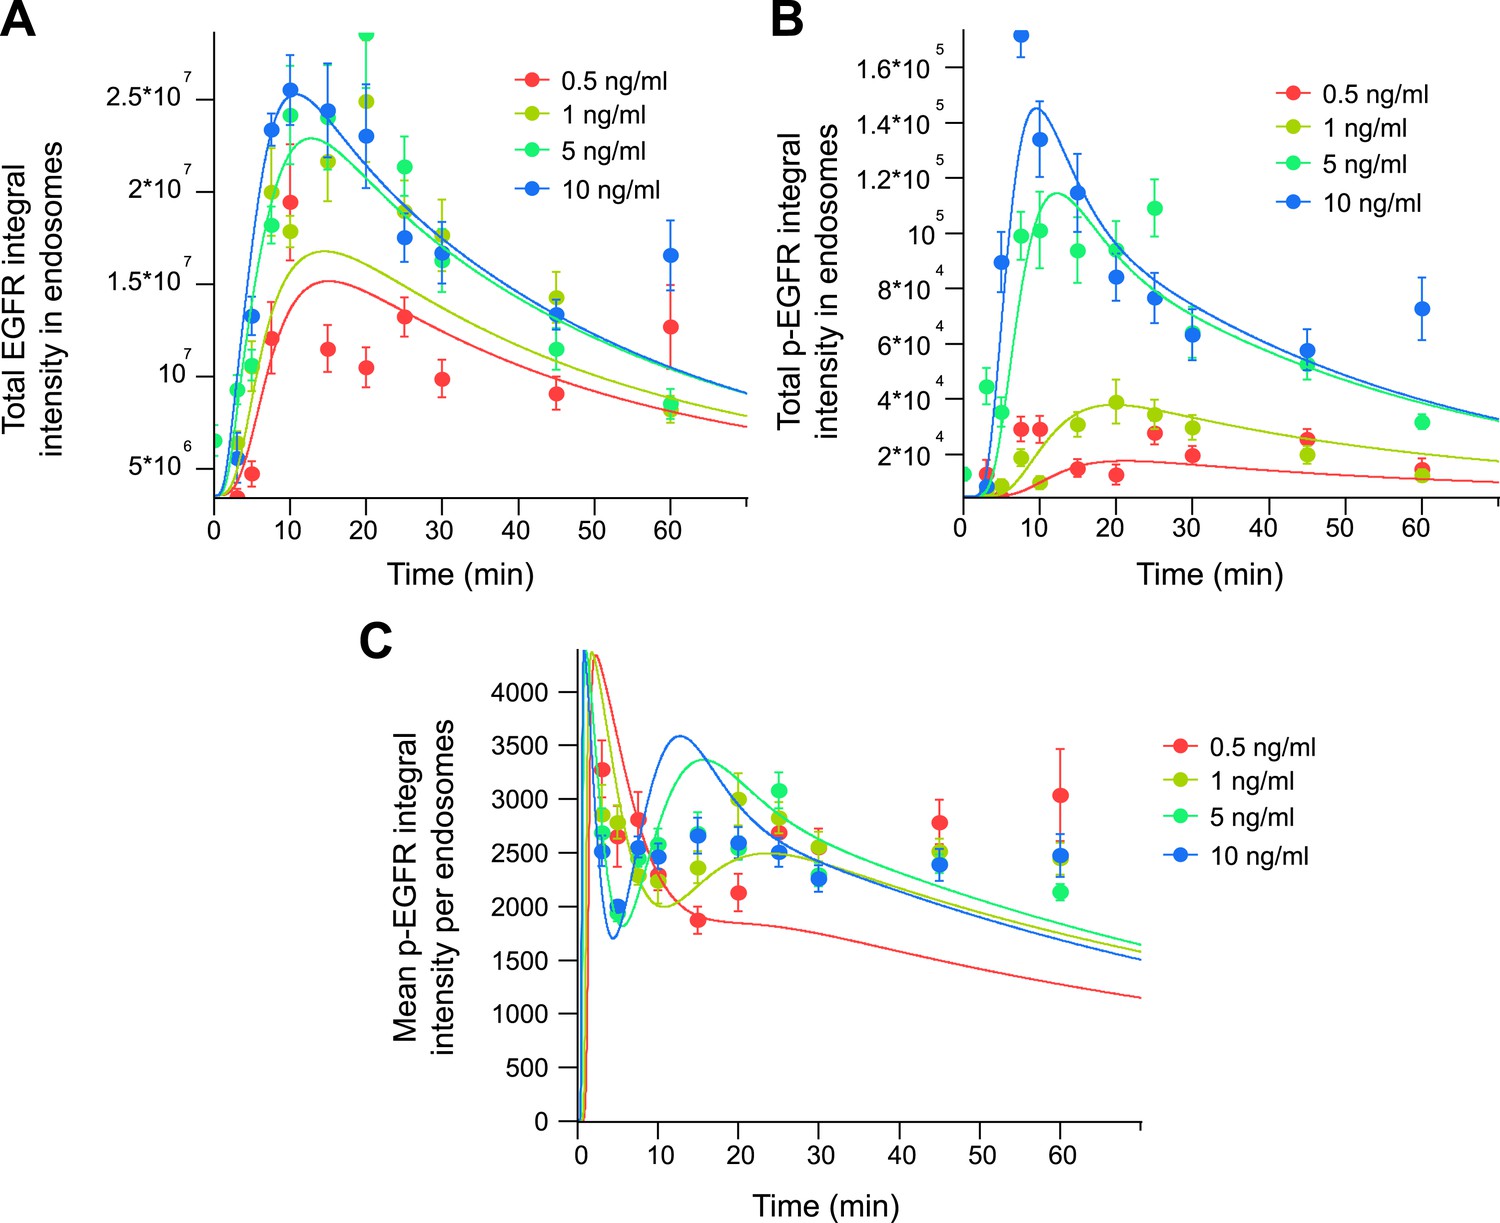
Parameters of a mathematical model with a first-order dephosphorylation rate were fitted to the experimental data as in Figure 3. (A) Total integral intensity of EGFR. (B) Total integral intensity of p-EGFR measured by FRET. (C) Mean integral intensity of p-EGFR per endosome. The experimental data and model predictions are drawn as filled circles and solid curves, respectively.
Figure 4 with 3 supplements

Increasing the number and life-time of p-EGFR endosomes results in prolonged EGFR activation.
(A) Protein down-regulation of EEA1 and Rabenosyn5 72 hr after siRNA transfection. RT-PCR showed an 80% reduction in Vps45 mRNA levels (data not shown). (B) Time course of EGFR integral intensity in endosomes after partial protein depletion of EEA1, Rabenosyn5, and Vps45 (red curve) or mock treatment (black curve). Cells were given a 1-min pulse of 10 ng/ml EGF, washed and chased for the indicated time points before fixation. (C) Representative images of HeLa EGFR BAC cells after EEA1, Rabenosyn5, and Vps45 knock-down or treatment with transfection reagent only (mock). Scale bars, 10 μm. (D) Shift in the EGFR-endosome area distribution toward smaller endosomes after EEA1, Rabenosyn5, and Vps45 knock-down. The values of the histograms of endosome area distribution for the control and knock-down conditions were normalized and subtracted. The curve shows the relative increase (above zero) or reduction (below zero) in the number of endosomes for each area bin (in logarithmic scale) (for details see ‘Materials and methods’ and Figure 6—figure supplement 2). Experimental points were fitted with two log-normal distributions. (E–G) Changes in p-EGFR endosomes in EEA1, Rabenosyn5, and Vps45 knock-down (red curve) or mock-treated (black curve) cells after continuous stimulation with 10 ng/ml EGF. Time courses of the mean integral intensity of p-EGFR per endosome (E), mean number of p-EGFR endosomes determined experimentally (squares) or predicted by the mathematical model (solid curves) for a 37% endosomes fusion rate (red curve) compared to control (black curve) (F), and total p-EGFR integral intensity in endosomes (G) measured as in Figure 1. Intensity curves were normalized to the intensity value at 10 min for mock-treated cells. Experimental points show mean ± SEM. All measurements were done in three independent experiments with a total of ∼150 cells per time point or condition. Time courses were fitted as in Figure 1.
Figure 4—figure supplement 1
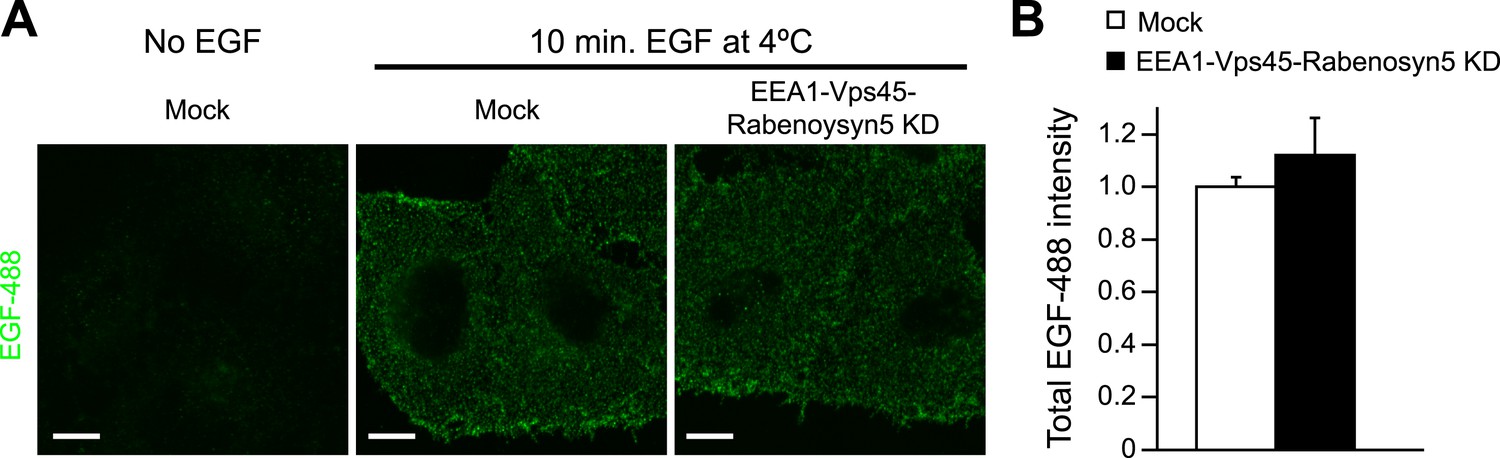
Knock-down of fusion machinery does not change EGFR distribution at the plasma membrane in HeLa cells.
Cells were stimulated with 100 ng/ml EGF-AlexaFluor 488 for 10 min on ice to prevent receptor endocytosis. The AlexaFluor 488 signal was enhanced by detection with a specific antibody to detect the amount of EGFR at the plasma membrane. Scale bar, 10 μm. (A) Representative images of HeLa EGFR BAC cells after EEA1, Rabenosyn5, and Vps45 knock-down or treatment with transfection reagent only (mock). (B) Total intensity of EGF-AlexaFluor 488 (Mean ± SEM) in knock-down or control cells. The total intensity was normalized to the fraction of the area covered by cells. Measurements were done in three independent replicates with a total of ∼150 cells per time point or condition.
Figure 4—figure supplement 2
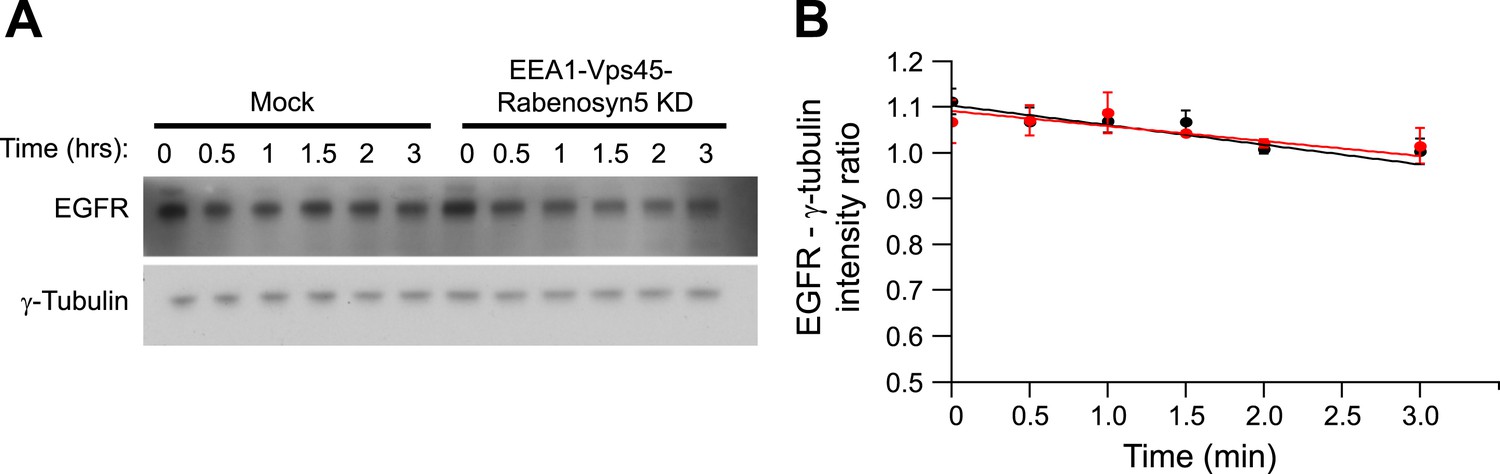
Knock-down of fusion machinery does not change EGFR degradation in HeLa cells.
(A–B) Time course of EGFR degradation after partial protein depletion of the three endosomal fusion components EEA1, Rabenosyn5, and Vps45 or mock treatment and continuous stimulation with 10 ng/ml EGF for the indicated times in the presence of 10 μg/ml cyclohexamide in HeLa EGFR BAC cells. (A) Representative EGFR and γ-Tubulin Western blots and (B) their quantification for EEA1, Rabenosyn5, and Vps45 knock-down (red curve) or mock-treated (black curve) samples. Points show mean ± SEM from three independent experiments. Lines are linear fits to the experimental points.
Figure 4—figure supplement 3
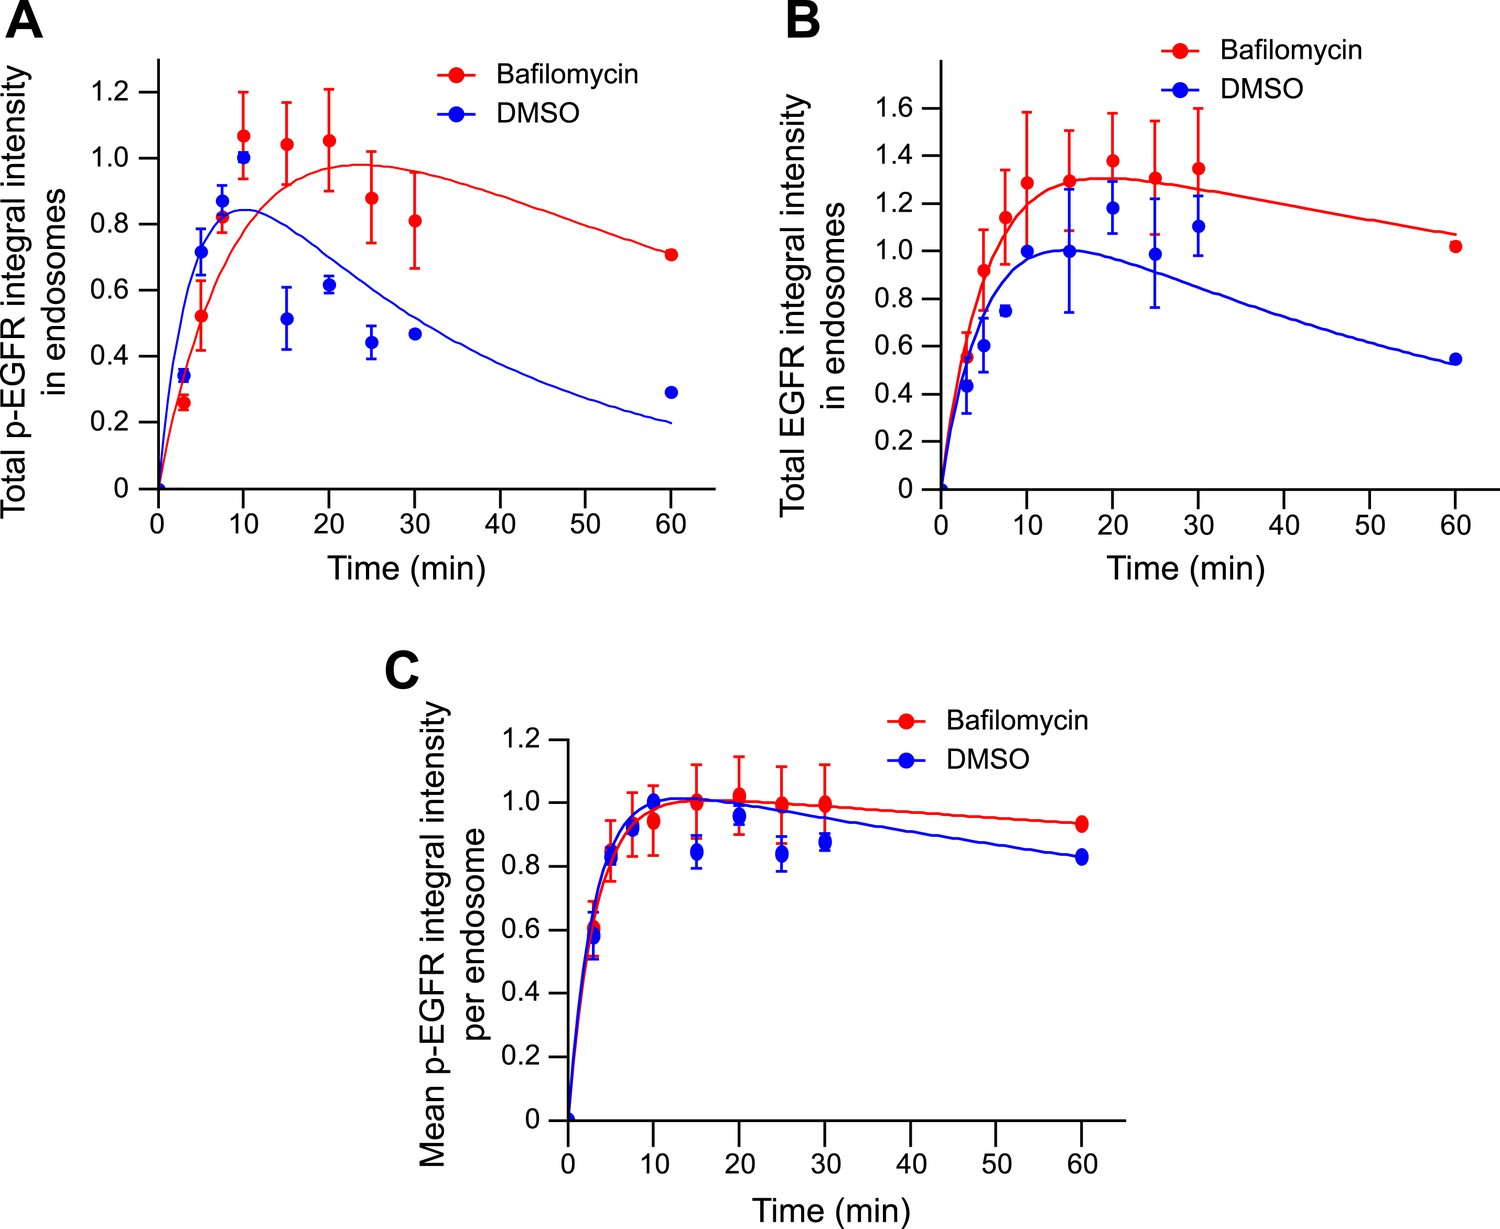
Blocking endosome acidification with Bafilomycin increases both total EGFR and p-EGFR, but not the mean amount of p-EGFR per endosome.
(A) Time course of p-EGFR integral intensity in endosomes after incubation with 50 nM BafilomycinA1 (red curve) or 1% DMSO (blue curve) for 30 min and during the remaining of the time course. (B) Time course of EGFR integral intensity in endosomes after incubation with 50 nM BafilomycinA1 (red curve) or 1% DMSO (blue curve) for 30 min and during the remaining of the time course. (C) Time course of the mean p-EGFR integral intensity per endosome after incubation with 50 nM BafilomycinA1 (red curve) or 1% DMSO (blue curve) for 30 min and during the remaining of the time course. Experimental points show mean ± SEM. All measurements were done in three independent experiments with a total of ∼150 cells per time point and condition. Time courses were fitted as in Figure 1.
Figure 5
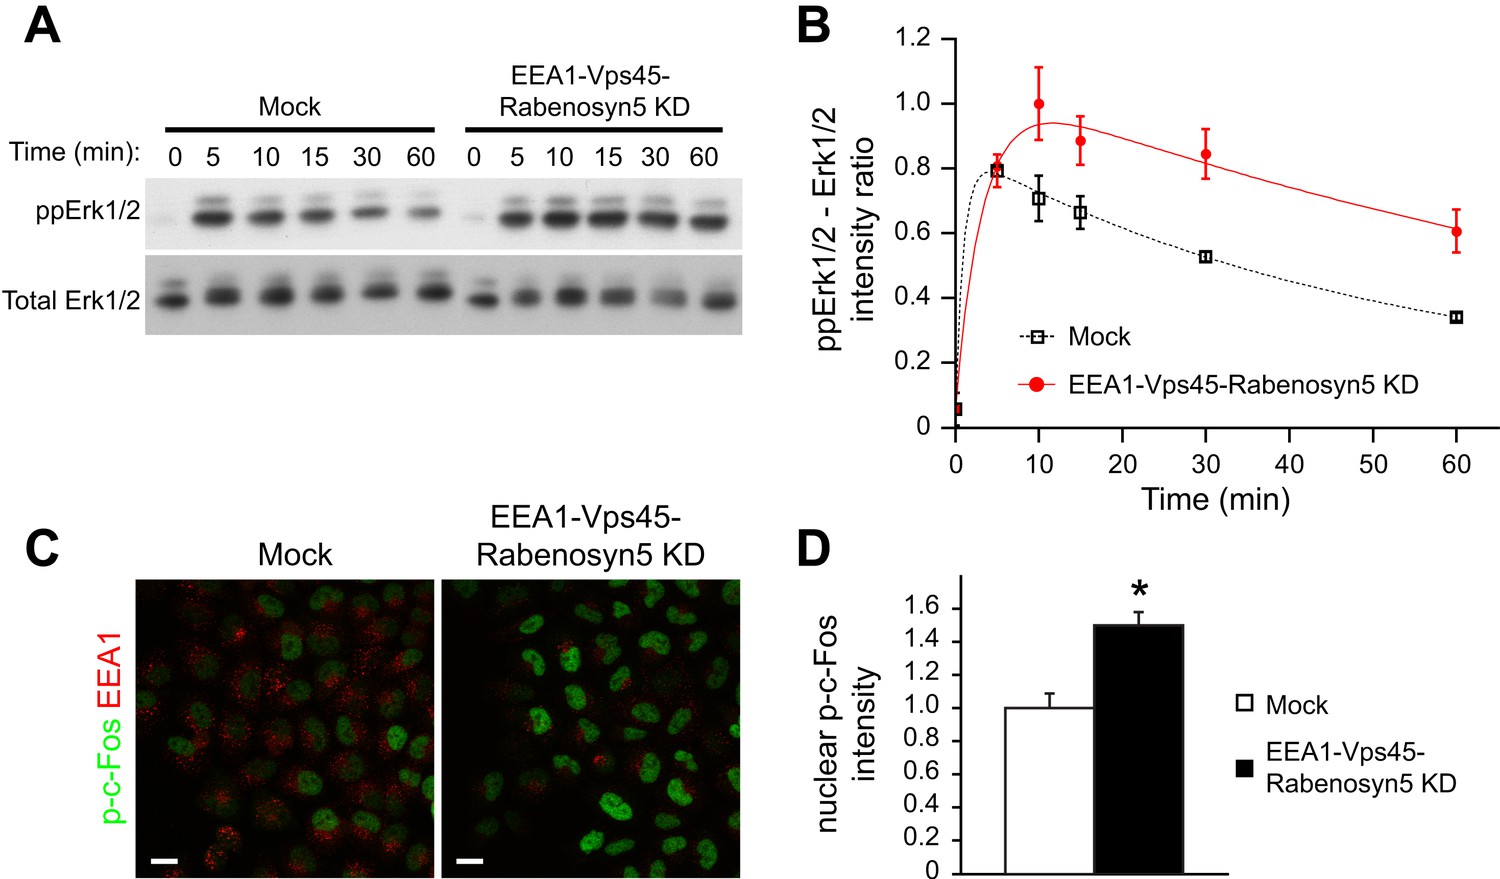
Redistribution of endosomal EGFR increases the amplitude and duration of MAPK signalling.
(A–B) Time course of Erk1/2 phosphorylation after partial protein depletion of the three endosomal fusion components EEA1, Rabenosyn5, and Vps45 or mock treatment and continuous stimulation with 10 ng/ml EGF for the indicated times in HeLa EGFR BAC cells. (A) Representative phospho-Erk1/2 and Erk1/2 Western blots and (B) their quantification for EEA1, Rabenosyn5, and Vps45 knock-down (red curve) or mock-treated (black curve) samples. Points show mean ± SEM from three independent experiments. The time course was fitted as in Figure 1. (C–D) Nuclear c-Fos phosphorylation in EEA1, Rabenosyn5, and Vps45 knock-down or mock-treated cells as in (A) after 30 min of EGF stimulation. (C) Representative images of EEA1 and phospho-c-Fos immunostaining in EEA1, Rabenosyn5, and Vps45 knock-down or mock-treated cells. Scale bars, 20 μm. (D) Total intensity of nuclear phospho-c-Fos in EEA1, Rabenosyn5, and Vps45 knock-down or mock-treated cells. Bar graph shows mean ± SEM. Measurements were done in three independent experiments from a total of ∼1000 cells per condition. *p < 0.05 by a 2-tailed t-test.
Figure 6 with 2 supplements
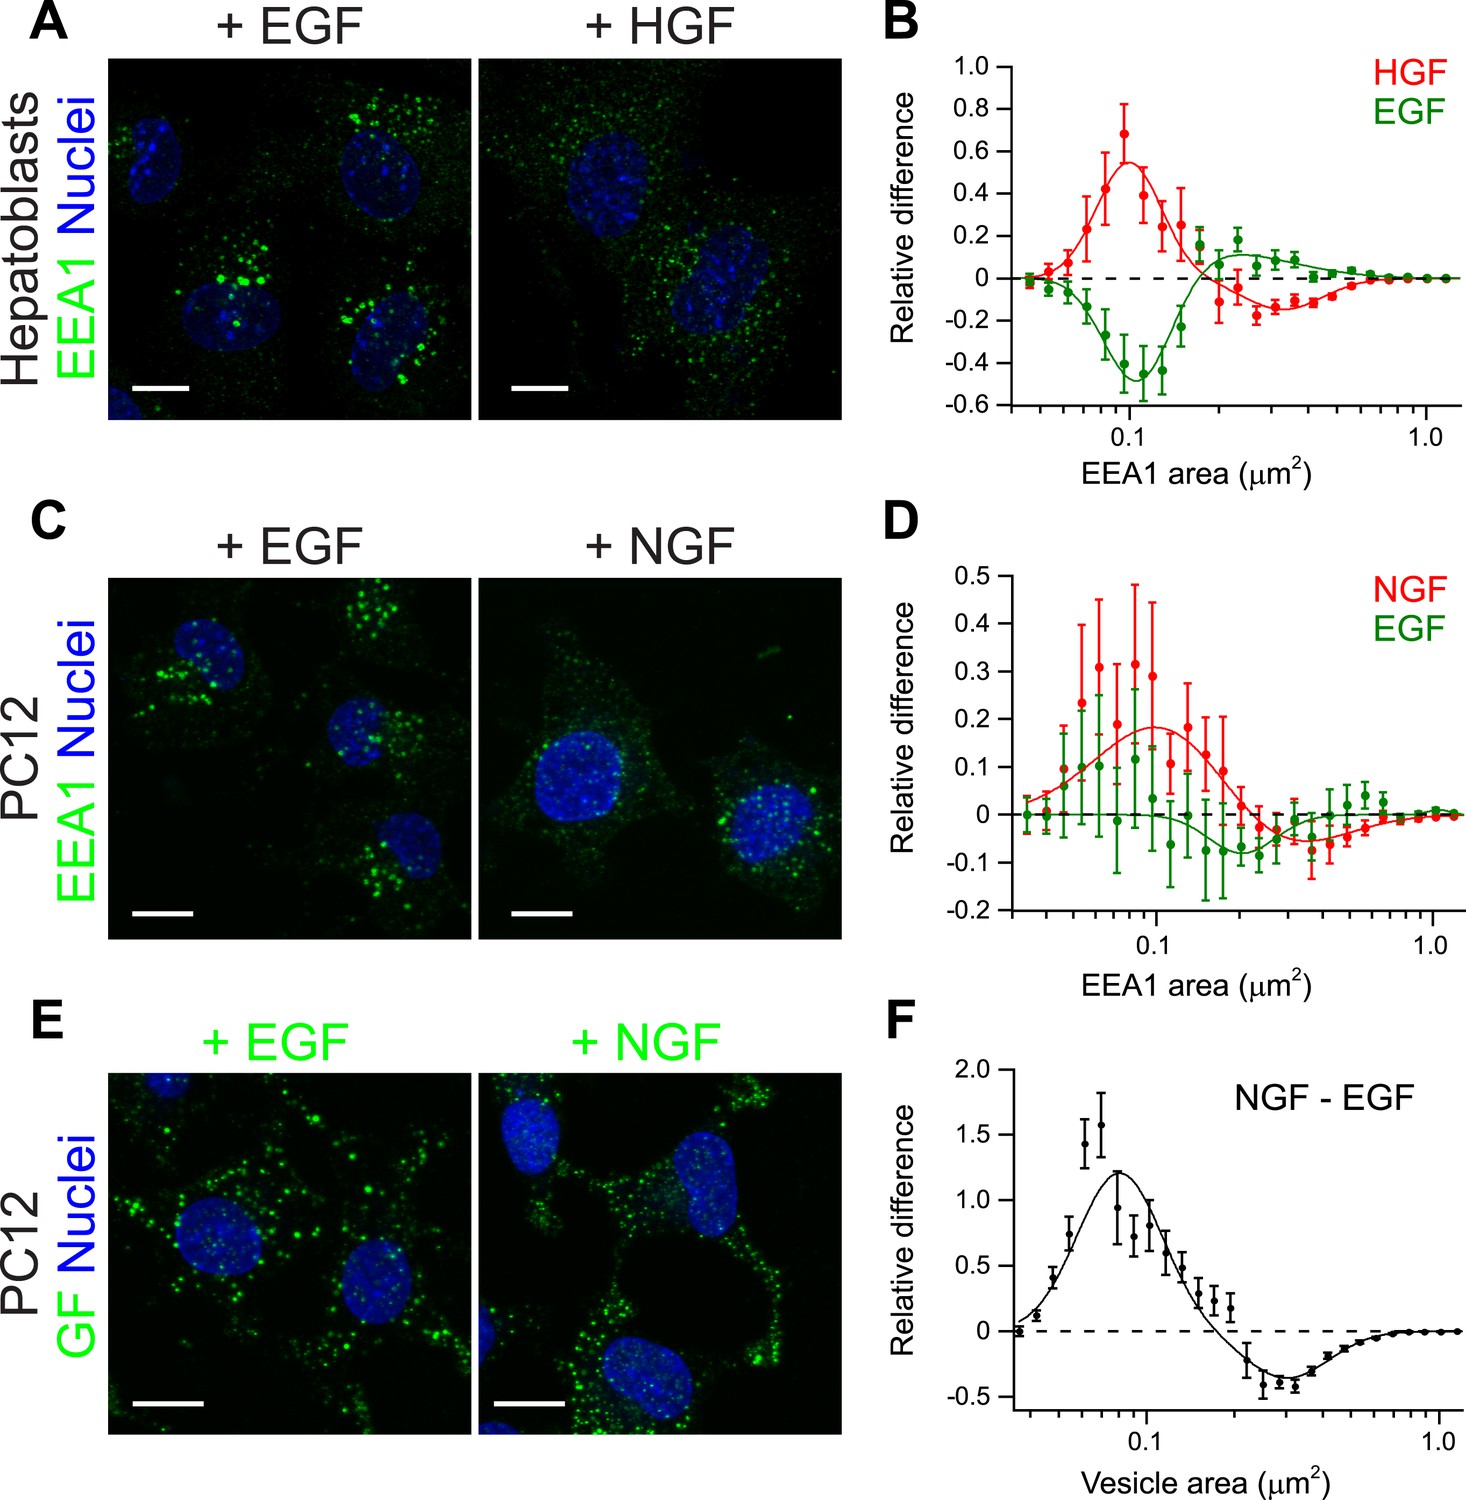
Growth factors differentially shift the distribution of the number and size of endosomes.
(A) Representative images of primary mouse hepatoblasts after stimulation with 10 ng/ml EGF or HGF for 30 min (B) Shift in the EEA1-positive endosome area distribution after stimulation with HGF (red curve) or EGF (green curve). The values of the histograms of endosome area distribution for growth factor stimulated and non-stimulated cells were normalized and subtracted. The curve shows the relative increase (above zero) or reduction (below zero) in the number of endosomes for each area bin (in logarithmic scale). HGF stimulation increased while EGF decreased the proportion of endosomes smaller than 0.2 μm2. (C–F) PC12 cells after stimulation for 30 min with 100 ng/ml EGF or 50 ng/ml NGF. (C) Representative images of EEA1-positive endosomes. (D) Shift in the EEA1-positive endosome area distribution after stimulation with NGF (red curve) or EGF (green curve) measured as in (B). NGF stimulation increased while EGF slightly decreased the proportion of endosomes smaller than 0.2 μm2. (E) Representative images of EGF or NGF. (F) Differences in the area distribution of endosomal NGF and EGF measured as in (B). NGF is enriched in endosomes smaller than 0.2 μm2 relative to EGF. For all graphs points show the mean ± SEM of experimental distributions. Measurements were done in three independent experiments with n ∼150 cells per condition. In all graphs, experimental points were fitted with two log-normal distributions. Image scale bars, 10 μm.
Figure 6—figure supplement 1
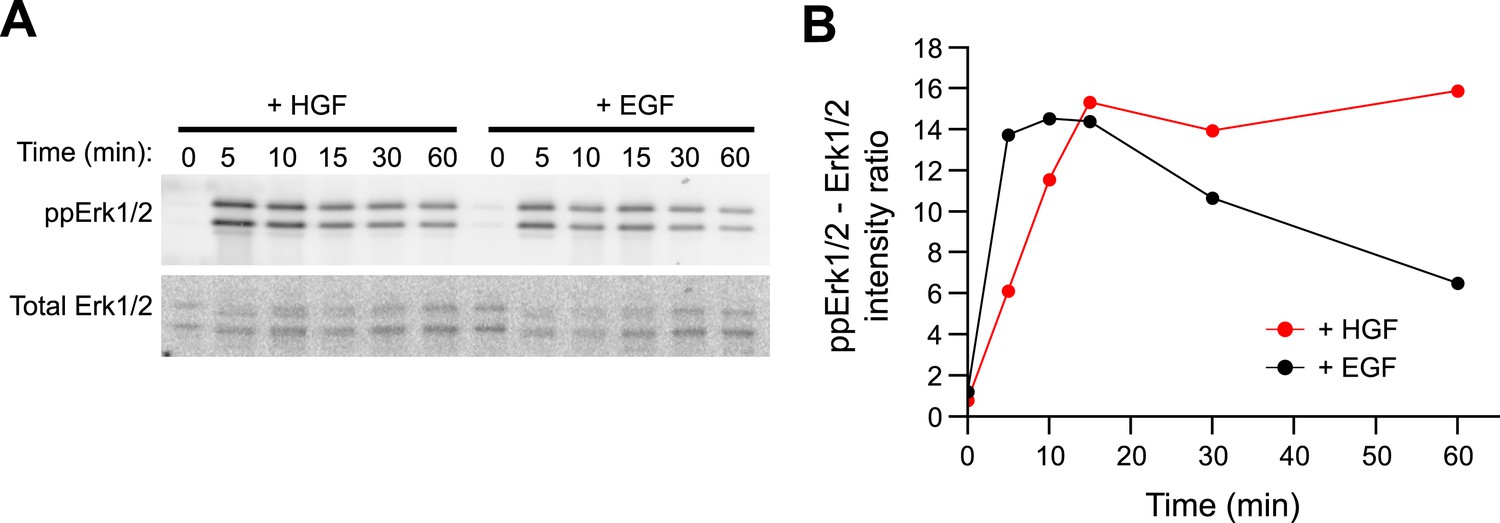
HGF triggers sustained Erk1/2 activation in primary mouse hepatoblasts.
(A–B) Time course of Erk1/2 phosphorylation after continuous stimulation with 10 ng/ml HGF or EGF for the indicated times in mouse primary hepatoblasts. (A) Representative phospho-Erk1/2 and Erk1/2 Western blots and (B) its quantification for HGF (red curve) or EGF (black curve) stimulation.
Figure 6—figure supplement 2
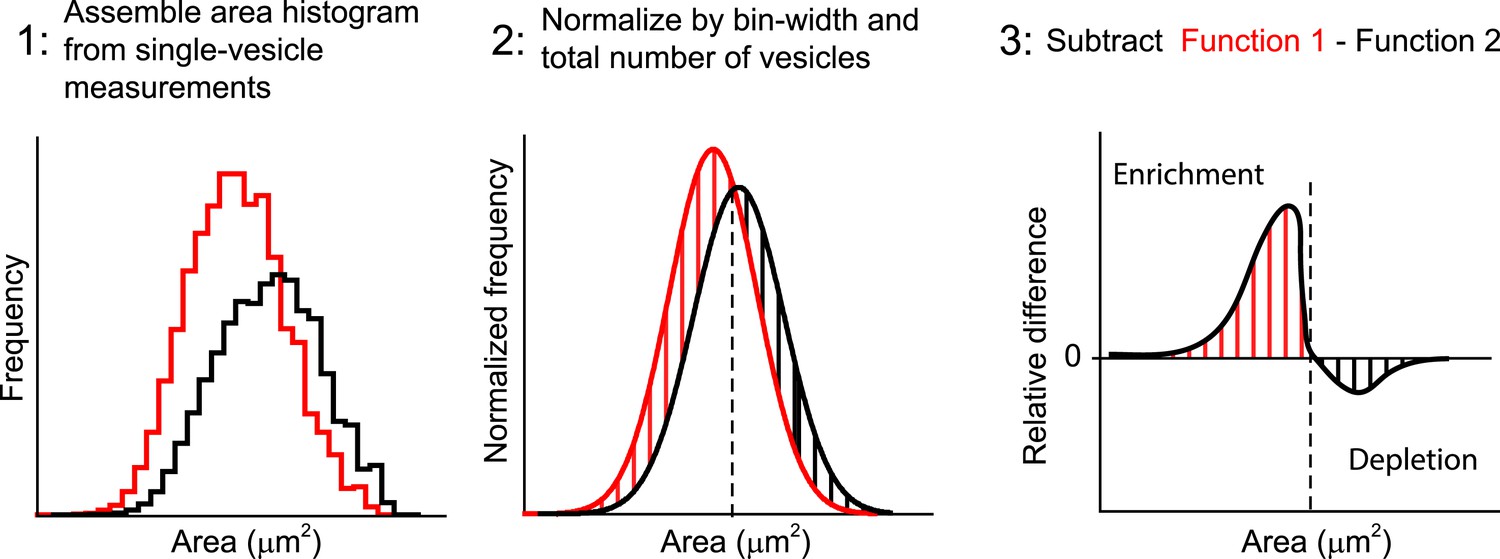
Quantification of the difference between two area distributions.
The differences between two endosome area distributions are measured as follows: (1) The binned histograms of the endosome area are built from the measurements of individual vesicles with bins linear in a logarithmic scale. (2) The histograms are normalized on their integrals, i.e., histograms are scaled to have the sum of values in all bins equal to one. (3) The histogram from the control condition is subtracted from the respective histograms of interest. The relative enrichment (red lines) or depletion (black lines) in the population of vesicles is calculated by the integral over a particular area interval.
Figure 7 with 2 supplements
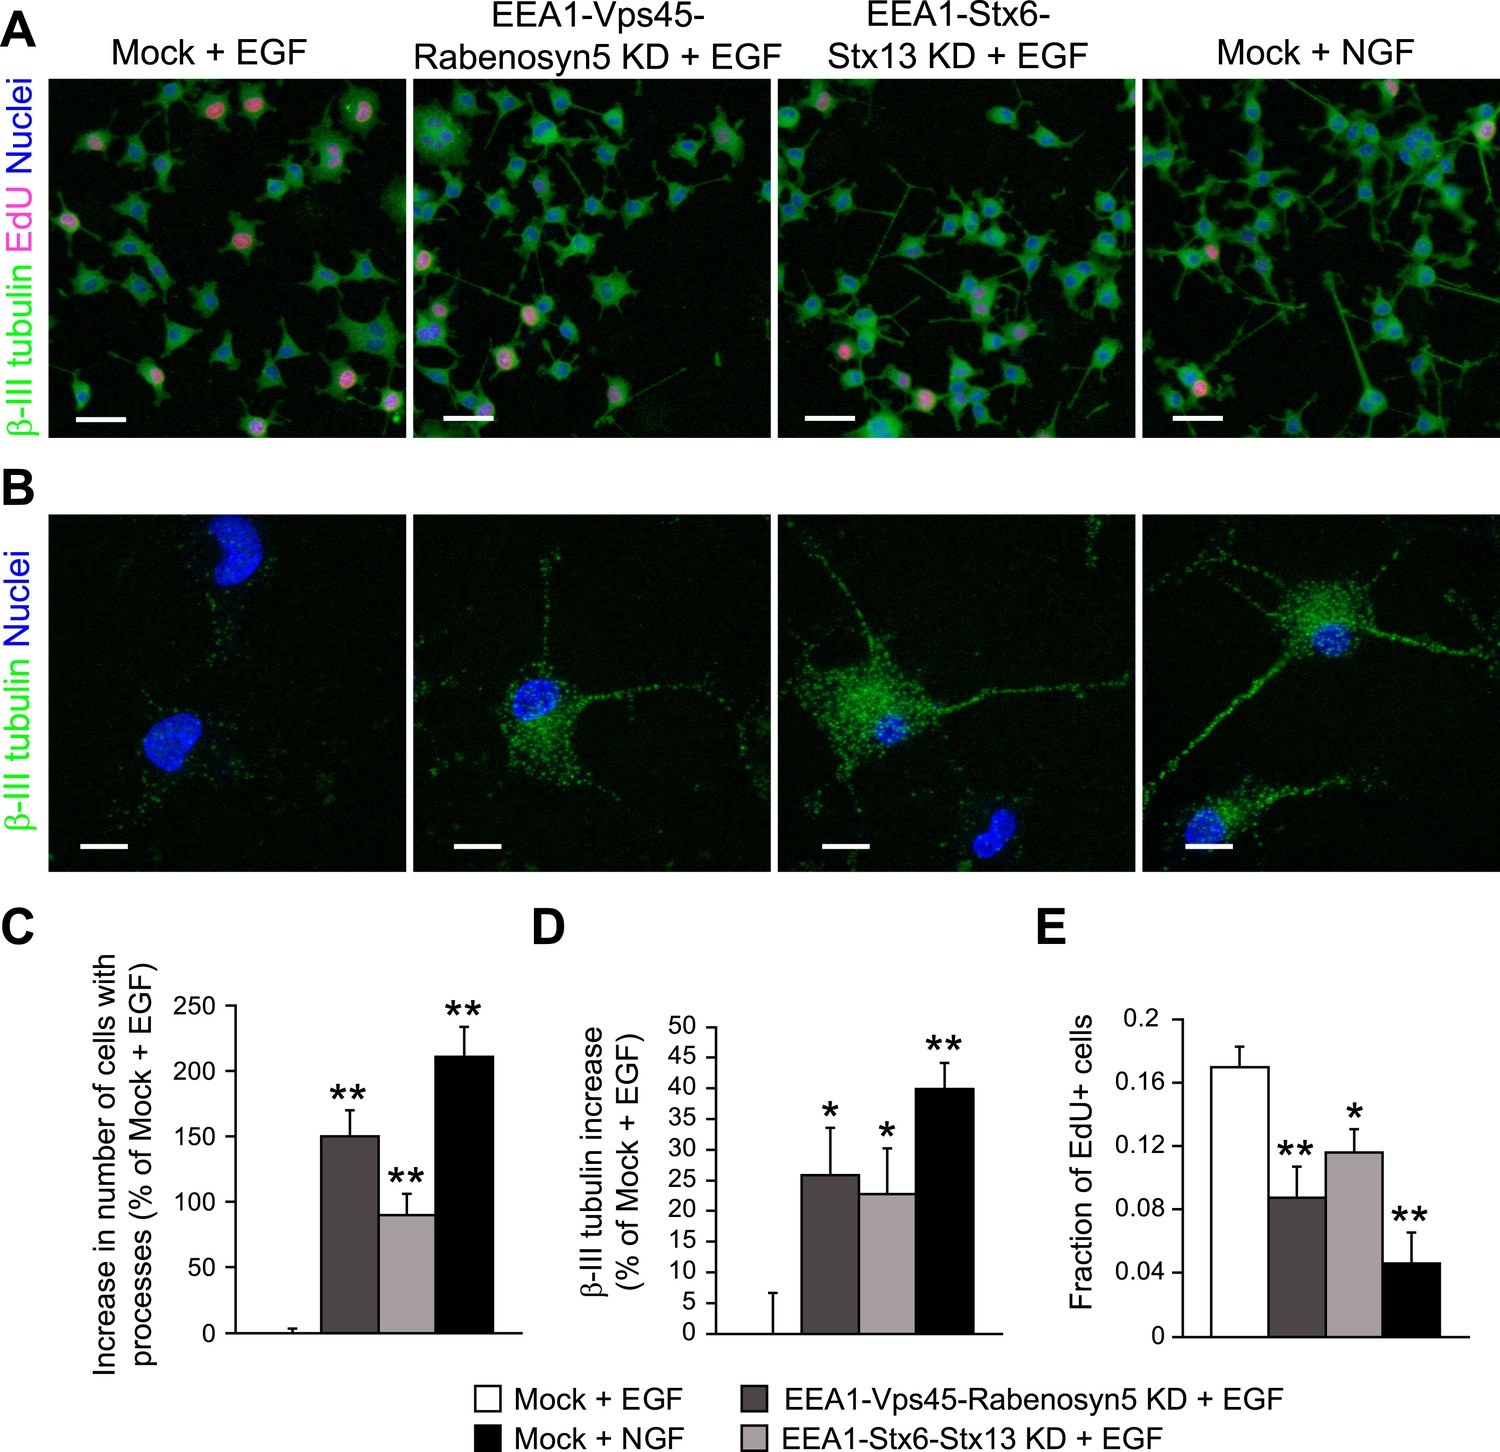
Redistribution of endosomal EGF is sufficient to trigger neuronal differentiation in PC12 cells.
(A–B) Representative images of PC12 cells after partial protein depletion of either EEA1, Rabenosyn5, and Vps45 or EEA1, Syntaxin-6, and Syntaxin-13, or mock treatment and stimulation with 100 ng/ml EGF or 50 ng/ml NGF for 24 hr. Scale bars, 50 μm. (B) A high-resolution image of single cells to highlight the changes in β-III tubulin expression and neurite formation. β-III tubulin is shown in green, nuclei are shown in blue, and EdU-positive nuclei are shown in pink. Scale bars, 10 μm. Note that in Figure 6C,E, the short incubation times did not permit neurite outgrowth. (C) Increase in the number of cells with β-III tubulin-positive processes longer than 1 μm compared to mock-treated cells after EGF stimulation. (D) Increase in β-III tubulin expression measured by the total intensity of the cytoplasmic β-III tubulin immunostaining. The total intensity per image was normalized by the image area covered by cells. (E) Number of proliferating cells measured by EdU incorporation. The number of EdU-positive nuclei was divided by the total number of nuclei. In all cases, data show mean ± SEM. For each parameter, pair-wise comparisons were done against EGF-stimulated mock-treated cells. *p < 0.05, **p < 0.005 by Fisher's LSD test. All measurements were done in three independent experiments with a total of ∼15000 cells per condition.
Figure 7—figure supplement 1
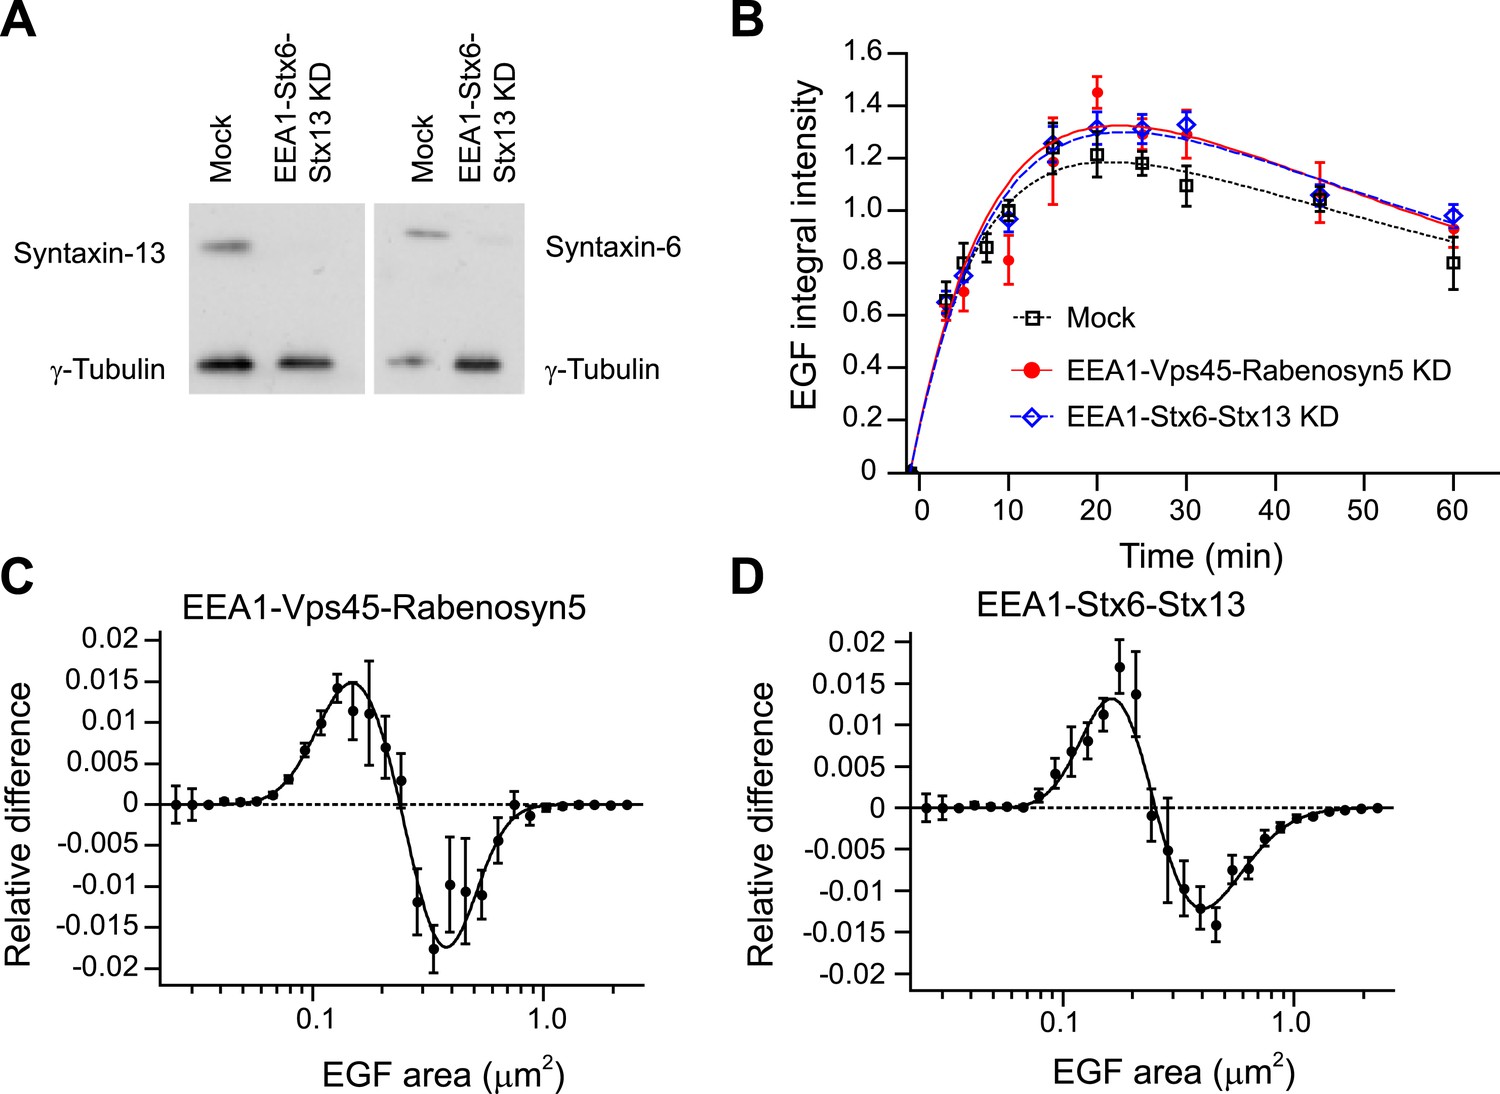
Knock-down of fusion machinery redistributes endosomal EGF in PC12 cells.
(A) Partial protein depletion of Syntaxin-6 and Syntaxin-13 72 hr after electroporation. Protein reduction of EEA1 and Rabenosyn5 was similar to that in HeLa cells (not shown). (B) Time course of EGF integral intensity in endosomes after EEA1, Rabenosyn5, and Vps45 (red curve) or EEA1, Syntaxin-6, and Syntaxin-13 knock-down (blue curve) or mock treatment (black curve). Cells were given a 1-min pulse of 100 ng/ml of EGF-AlexaFluor 555, washed and chased for the indicated time points before fixation. Curves were normalized to the intensity value at 10 min for mock-treated cells. Points show mean ± SEM. All measurements were done in three independent replicates with a total of ∼150 cells per time point or condition. Time courses were fitted as in Figure 1 (C–D) Shift in the EGF-endosome area distribution after EEA1, Rabenosyn5, and Vps45 (C) or EEA1, Syntaxin-6, and Syntaxin-13 (D) knock-down measured as in Figure 3. Endosomes smaller than 0.2 μm2 (cross-sectional area) are increased after EEA1, Rabenosyn5, and Vps45 (C) or EEA1, Syntaxin-6, and Syntaxin-13 knock-down (D). Points show the mean ± SEM. All measurements were done in four independent replicates with a total of ∼200 cells per time point or condition. Experimental points were fitted with two lognormal distributions.
Figure 7—figure supplement 2
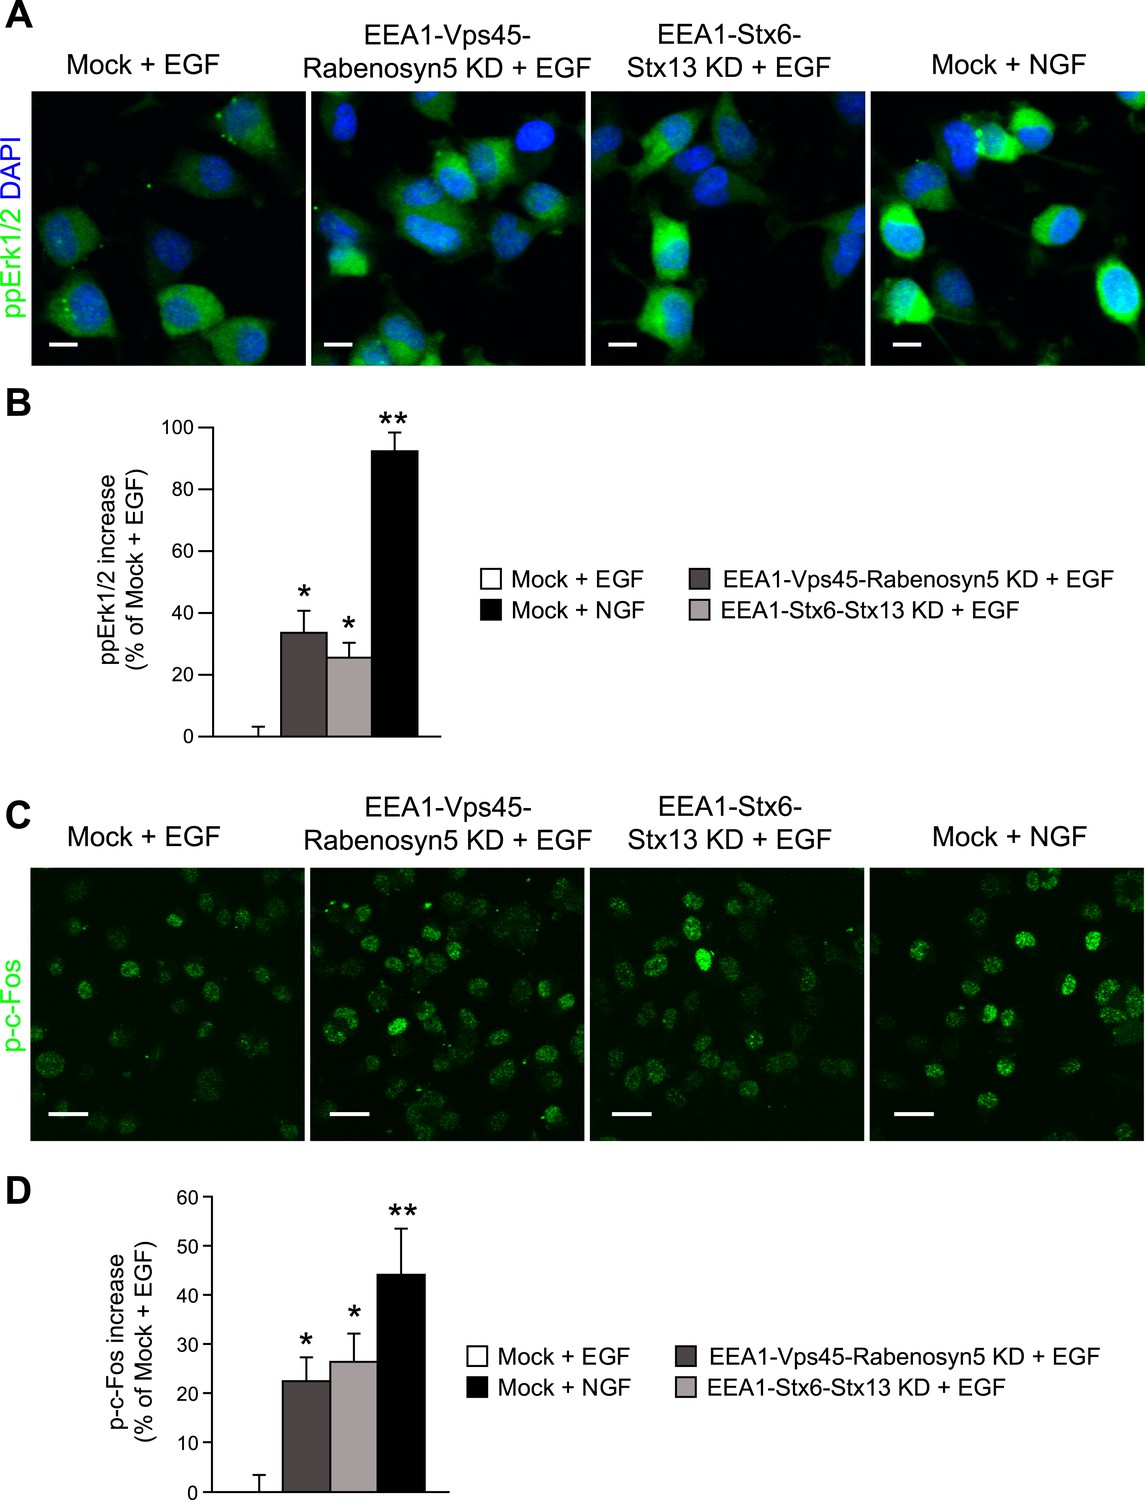
Redistribution of endosomal EGF is sufficient to increase MAPK activation in PC12 cells.
(A–D) Analysis of MAPK activation in PC12 cells after partial protein depletion of either EEA1, Rabenosyn5, and Vps45 or EEA1, Syntaxin-6, and Syntaxin-13, or mock treatment and stimulation with 100 ng/ml EGF or 50 ng/ml NGF for 30 min (A) Representative images of Erk1/2 activation by immunofluorescence in PC12 cells. phospho-Erk1/2 is shown in green and nuclei are shown in blue. Scale bars, 10 μm. (B) Increase in phospho-Erk1/2 intensity compared to EGF-treated control cells. The total intensity was normalized by the fraction of the area covered by cells. (C) Representative images of c-Fos phosphorylation by immunofluorescence in PC12 cells. phospho-c-Fos is shown in green. Scale bar, 25 μm. (D) Increase in nuclear phospho-c-Fos intensity compared to EGF-treated control cells. In all cases, data show mean ± SEM. For each parameter, pair-wise comparisons were done against EGF-stimulated mock-treated cells. *p < 0.05, **p < 0.005 by Fisher's LSD test. All measurements were done in three independent experiments with a total of ∼500 cells per condition.
Videos
Video 1
Live-cell imaging of EGFR endocytosis.
HeLa EGFR-GFP BAC cells were imaged with a spinning disk microscope after 1 minute of EGF stimulation with 10 ng/ml EGF. Movie shows maximal projection of 3 z-slices of 0.8 mm thickness.
Tables
Table 1
Changes in endosome number and area
| Cell type | Endosome marker or cargo | Growth factor | Endosome number* | Endosome area (μm2) | Increase in number of smaller vesicles |
|---|---|---|---|---|---|
| HeLa# | EGFR | EGF | 22 ± 9 | 0.518 ± 0.023 (control = 0.629 ± 0.029) | 9.53% ± 0.014 (<0.4 μm2) |
| E14.5 hepatoblast | EEA1 | EGF | −6 ± 18 | 0.286 ± 0.02 (control = 0.294 ± 0.02) | −0.91% ± 0.003 (<0.3 μm2) |
| E14.5 hepatoblast | EEA1 | HGF | 18 ± 12 | 0.276 ± 0.02 (control = 0.294 ± 0.02) | 2.05% ± 0.002 (<0.3 μm2) |
| PC12 | EEA1 | EGF | 3 ± 10 | 0.471 ± 0.05 (control = 0.461 ± 0.05) | −1.03% ± 0.01 (<0.3 μm2) |
| PC12 | EEA1 | NGF | 23 ± 16 | 0.454 ± 0.05 (control = 0.461 ± 0.05) | 2.2% ± 0.01 (<0.3 μm2) |
| PC12 | EGF | EGF | 316 ± 46 | 0.276 ± 0.003 | – |
| PC12 | NGF | NGF | 341 ± 5 | 0.245 ± 0.007 | 5.15% ± 0.01 (<0.3 μm2, difference from EGF-endosomes) |
-
*
Endosome number is expressed as the difference from the control or non-stimulated cells. The value shows the number of endosomes per 1000 μm2 of area covered by cells.
-
#
HeLa cells after knock-down of EEA1, Rabenosyn5, and Vps45. All values show mean ± SEM.
Table 2
List of siRNAs used for down-regulation of endosomal proteins
| Gene name | siRNA library | siRNA ID |
|---|---|---|
| EEA1 | Ambion Silencer | 139147 |
| Rabenosyn5 | Ambion Silencer | 292470 |
| Vps45 | Ambion Silencer | 136363 |
| Hrs | Qiagen | SI00067305 |
| Hrs | Qiagen | SI00288239 |
| Hrs | Qiagen | SI02659650 |
| Vps24 | Invitrogen | 148627 |
| Vps24 | Invitrogen | 148628 |
| Vps24 | Qiagen | SI00760515 |
| Snf8 | Invitrogen | 140086 |
| Snf8 | Qiagen | SI00375641 |
| Snf8 | Qiagen | SI00375648 |
Table 3
List of genes for PTP siRNA screen
| Gene symbol | Gene ID | siRNa ID | Sequence 5′–3′ |
|---|---|---|---|
| PTPN13 | 5783 | 5783-HSS108838 | UCACAUUUCUGAACCAACUAGACAA |
| PTPN13 | 5783 | 5783-HSS184076 | CAUCAGACUCUAAGCAACAUGGUAU |
| PTPN13 | 5783 | 5783-HSS184077 | CCAUUGAGGGUAAUCUCCAGCUAUU |
| PTPN13 | 5783 | 5783-NM_080683.1_1459 | GAAACACCCUUUGAAGGCAACUUAA |
| PTPRK | 5796 | 5796-HSS108869 | CCCAUCCAAGUGGAAUGUAUGUCUU |
| PTPRK | 5796 | 5796-HSS108870 | GGUCAUUCUUGAAACUGAUACUUCA |
| PTPRK | 5796 | 5796-HSS184093 | CCGCGCAAAGGAUACAACAUCUAUU |
| PTPRK | 5796 | 5796-NM_002844.2_975 | CCGCUUCCUUCAGAUUGCAAGAAGU |
| PTPRA | 5786 | 5786-HSS108844 | CCAGUUCACGGAUGCCAGAACAGAA |
| PTPRA | 5786 | 5786-HSS108845 | GCAUUCUCAGAUUAUGCCAACUUCA |
| PTPRA | 5786 | 5786-HSS108846 | GGCACCAACAUUCAGCCCAAAUAUA |
| PTPRA | 5786 | 5786-NM_080841.2_1383 | CGCCUCAUCACUCAGUUCCACUUUA |
| PTPRR | 5801 | 5801-HSS108880 | AGUUGAGGUUCUGGUUAUCAGUGUA |
| PTPN9 | 5780 | 5780-HSS108830 | CCCUCAUUGACUUCUUGAGAGUGGU |
| PTPRR | 5801 | 5801-HSS108882 | GGUACACCUCAUGGCCUGAUCACAA |
| PTPN9 | 5780 | 5780-HSS108831 | ACCUCAUGAGGAACCUCUUCGUUCU |
| PTPRR | 5801 | 5801-HSS184097 | CAAGAGAGAAGAGGGUCCAACGUAU |
| PTPN9 | 5780 | 5780-HSS184065 | CGCUGUCUUGGAAUGUGGCUGUCAA |
| PTPRR | 5801 | 5801-NM_130846.1_1022 | CAGUGGCAAGGAGAAAGCCUUCAUU |
| PTPN9 | 5780 | 5780-NM_002833.2_1369 | CAUCCAAGAGUUGGUGGACUAUGUU |
| PTPN2 | 5771 | 5771-HSS108817 | GGAAGACUUAUCUCCUGCCUUUGAU |
| PTPN2 | 5771 | 5771-HSS108818 | GAGCGGGAGUUCGAAGAGUUGGAUA |
| PTPN2 | 5771 | 5771-HSS184039 | GAGAUUCUCAUACAUGGCUAUAAUA |
| PTPN2 | 5771 | 5771-NM_002828.2_1178 | CCGAUGUACAGGACUUUCCUCUAAA |
| DUSP2 | 1844 | 1844-HSS140936 | GCUCUGCCACCAUCUGUCUGGCAUA |
| PTPN3 | 5774 | 5774-HSS108820 | GGCGUGGUACAGACCUUUAAAGUUA |
| PTPRE | 5791 | 5791-HSS108853 | UCUGGGAAUGGAAAUCCCACACUAU |
| DUSP2 | 1844 | 1844-HSS140937 | GCUGCUGUCCCGAUCUGUGCUCUGA |
| PTPN3 | 5774 | 5774-HSS108821 | GAGCUGUCCGCUCAUUUGCUGACUU |
| PTPRE | 5791 | 5791-HSS108854 | ACGAGACUUUCUGGUCACUCUCAAU |
| DUSP2 | 1844 | 1844-HSS140938 | GGCAUCACAGCCGUCCUCAACGUGU |
| PTPN3 | 5774 | 5774-HSS108822 | CCACCCGGGUAUUAUUGCAGGGAAA |
| PTPRE | 5791 | 5791-HSS108855 | GGAACAGUAUGAAUUCUGCUACAAA |
| DUSP2 | 1844 | 1844-NM_004418.3_925 | UGGACGAGGCCUUUGACUUCGUUAA |
| PTPN3 | 5774 | 5774-NM_002829.2_621 | CAAUCAGAAGCAGAAUCCUGCUAUA |
| PTPRE | 5791 | 5791-NM_130435.2_1499 | GAGCAGGAUAAAUGCUACCAGUAUU |
| PTPRF | 5792 | 5792-HSS108856 | CCCAUCAUCCAAGACGUCAUGCUAG |
| PTPRF | 5792 | 5792-HSS108858 | GGACAGCAGUUCACGUGGGAGAAUU |
| PTPRF | 5792 | 5792-HSS184088 | CAGCUGUGCCCUUUAAGAUUCUGUA |
| PTPRF | 5792 | 5792-NM_130440.2_6013 | CAGCUUUGACCACUAUGCAACGUAA |
| PTP4A2 | 8073 | 8073-HSS140957 | GAUAACUCACAACCCUACCAAUGCU |
| DUSP6 | 1848 | 1848-HSS176270 | GAGAGCAGCAGCGACUGGAACGAGA |
| PTP4A2 | 8073 | 8073-HSS140958 | GCGUUCAAUUCCAAACAGCUGCUUU |
| DUSP6 | 1848 | 1848-HSS176271 | UGGCAUUAGCCGCUCAGUCACUGUG |
| PTP4A2 | 8073 | 8073-HSS188476 | GGUUCGAGUUUGUGAUGCUACAUAU |
| DUSP6 | 1848 | 1848-HSS176272 | UGGCUUACCUUAUGCAGAAGCUCAA |
| PTP4A2 | 8073 | 8073-NM_080392.2_1123 | UCGAGUUUGUGAUGCUACAUAUGAU |
| DUSP6 | 1848 | 1848-NM_022652.2_1097 | CAUGUGACAACAGGGUUCCAGCACA |
| PTPRM | 5797 | 5797-HSS108871 | CCGAGUGAGGCUGCAGACAAUAGAA |
| PTP4A3 | 11156 | 11156-NM_007079.2_423 | UCAGCACCUUCAUUGAGGACCUGAA |
| PTPN18 | 26469 | 26469-HSS120076 | GCUGCCUUAUGAUCAGACGCGAGUA |
| PTPN14 | 5784 | 5784-HSS108841 | UCAUGGGAAUGAAGAAGCCUUGUAU |
| PTPRM | 5797 | 5797-HSS108872 | CAGGCUCUGGUUACAGGGCAUUGAU |
| PTP4A3 | 11156 | 11156-NM_007079.2_460 | UACCACUGUGGUGCGUGUGUGUGAA |
| PTPN18 | 26469 | 26469-HSS120077 | UCGAGAGAUAGAGAAUGGGCGGAAA |
| PTPN14 | 5784 | 5784-HSS108843 | GCCGCUGAUGUUGGCAGCAUUGAAU |
| PTPRM | 5797 | 5797-HSS108873 | CCCGACGCUUCAUUGCUUCAUUUAA |
| PTP4A3 | 11156 | 11156-NM_007079.2_473 | CGUGUGUGUGAAGUGACCUAUGACA |
| PTPN18 | 26469 | 26469-HSS120078 | CCCACCUGACUUCAGUCUCUUUGAU |
| PTPN14 | 5784 | 5784-HSS184078 | GAUAUCAGUAUUACCUGCAAGUCAA |
| PTPRM | 5797 | 5797-NM_002845.3_1217 | CCGACGCUUCAUUGCUUCAUUUAAU |
| PTP4A3 | 11156 | 11156-NM_007079.2_678 | CCAUCAACAGCAAGCAGCUCACCUA |
| PTPN18 | 26469 | 26469-NM_014369.2_835 | UCAGUCUCUUUGAUGUGGUCCUUAA |
| PTPN14 | 5784 | 5784-NM_005401.3_3394 | CACGAAGUUUCGAACGGAUUCUGUU |
| PTPN1 | 5770 | 5770-HSS108816 | GAGUGAUGGAGAAAGGUUCGUUAAA |
| PTPN1 | 5770 | 5770-HSS184025 | CAUGAAGCCAGUGACUUCCCAUGUA |
| PTPN1 | 5770 | 5770-HSS184026 | CGAGAGAUCUUACAUUUCCACUAUA |
| PTPN1 | 5770 | 5770-NM_002827.2_507 | CAGAGUGAUGGAGAAAGGUUCGUUA |
| PTPRJ | 5795 | 5795-HSS108867 | GCGACUUCAUAUGUAUUCUCCAUCA |
| PTPRJ | 5795 | 5795-HSS184091 | CGGGUUCUUCUUGAAAGCAUUGGAA |
| PTPRJ | 5795 | 5795-HSS184092 | GAGCAGCCAUGAUGCAGAAUCAUUU |
| PTPRJ | 5795 | 5795-NM_002843.3_1838 | CGGGUAGAAAUAACCACCAACCAAA |
| PTPN12 | 5782 | 5782-HSS108835 | GCCACAGGAAUUAAGUUCAGAUCUA |
| PTP4A1 | 7803 | 7803-HSS111748 | GCAACUUCUGUAUUUGGAGAAGUAU |
| PTPN12 | 5782 | 5782-HSS108836 | GCCUCUUGAUGAGAAAGGACAUGUA |
| PTP4A1 | 7803 | 7803-HSS111749 | UCAAAGAUUCCAACGGUCAUAGAAA |
| PTPN12 | 5782 | 5782-HSS108837 | UCUGAUGGUGCUGUGACCCAGAAUA |
| PTP4A1 | 7803 | 7803-HSS111750 | CCAACCAAUGCGACCUUAAACAAAU |
| PTPN12 | 5782 | 5782-NM_002835.2_554 | CAGGACACUCUUACUUGAAUUUCAA |
| PTP4A1 | 7803 | 7803-NM_003463.3_1382 | AACCAGAUUGUUGAUGACUGGUUAA |
| PTPN11 | 5781 | 5781-HSS108834 | ACAUGGAACAUCACGGGCAAUUAAA |
| PTPN11 | 5781 | 5781-HSS184068 | CAGACAGAAGCACAGUACCGAUUUA |
| PTPN11 | 5781 | 5781-HSS184069 | GAAAGGGCACGAAUAUACAAAUAUU |
| PTPN11 | 5781 | 5781-NM_002834.3_5519 | CAGGAUGCCUUUGUUAGGAUCUGUA |
Additional files
-
Source code 1
System of differential equations for the mathematical model of p-EGFR endocytosis. The ZIP file contains the system of differential equations of the model with non-linear dephosporylation term and experimental data which were used to fit the model (see Figure 3 of main text). The data are provided in the FitModel format (http://pluk.mpi-cbg.de/projects/fitmodel) and as a simple text.
- https://doi.org/10.7554/eLife.06156.039
Download links
A two-part list of links to download the article, or parts of the article, in various formats.
Downloads (link to download the article as PDF)
Open citations (links to open the citations from this article in various online reference manager services)
Cite this article (links to download the citations from this article in formats compatible with various reference manager tools)
Regulation of EGFR signal transduction by analogue-to-digital conversion in endosomes
eLife 4:e06156.
https://doi.org/10.7554/eLife.06156


