Whole genome comparison of a large collection of mycobacteriophages reveals a continuum of phage genetic diversity
- University of Pittsburgh, United States
- Howard Hughes Medical Institute, United States
- James Madison University, United States
- Albert Einstein College of Medicine, United States
Figures
Figure 1
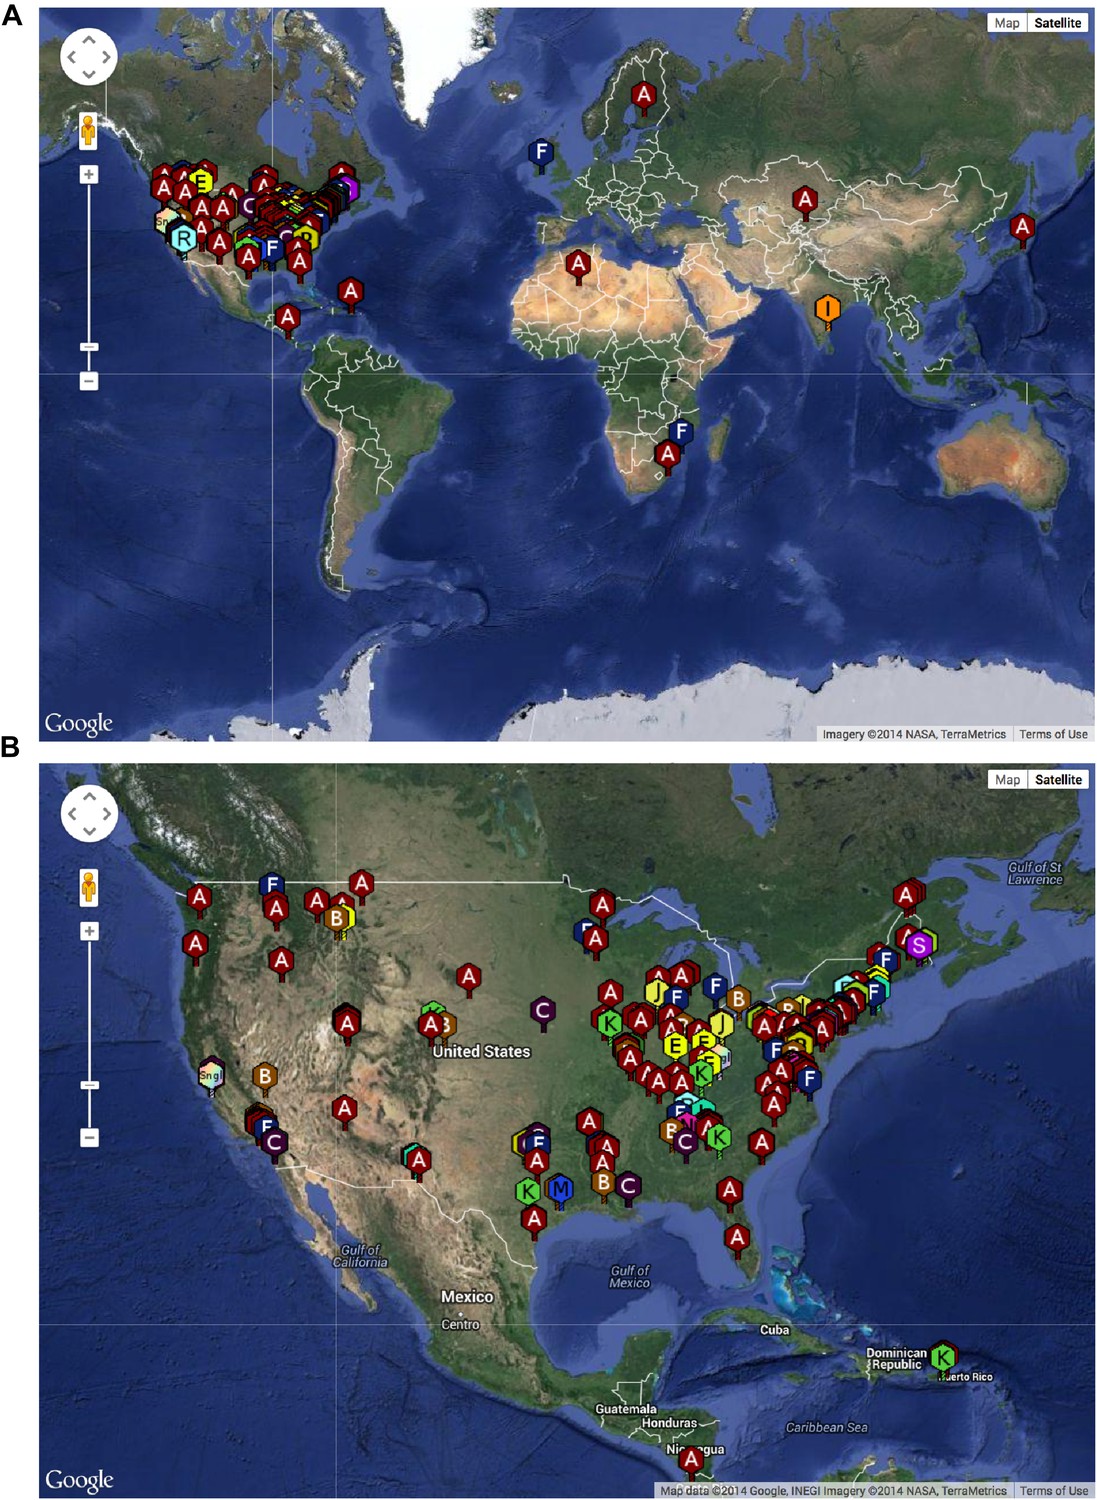
Geographical distribution of sequenced mycobacteriophages.
(A) Locations of sequenced mycobacteriophages across the globe. (B) Locations of sequenced mycobacteriophages across the United States. Colors and letter designations on the isolates refer to the cluster to which the genomes belong. Data from www.phagesdb.org.
Figure 2 with 3 supplements
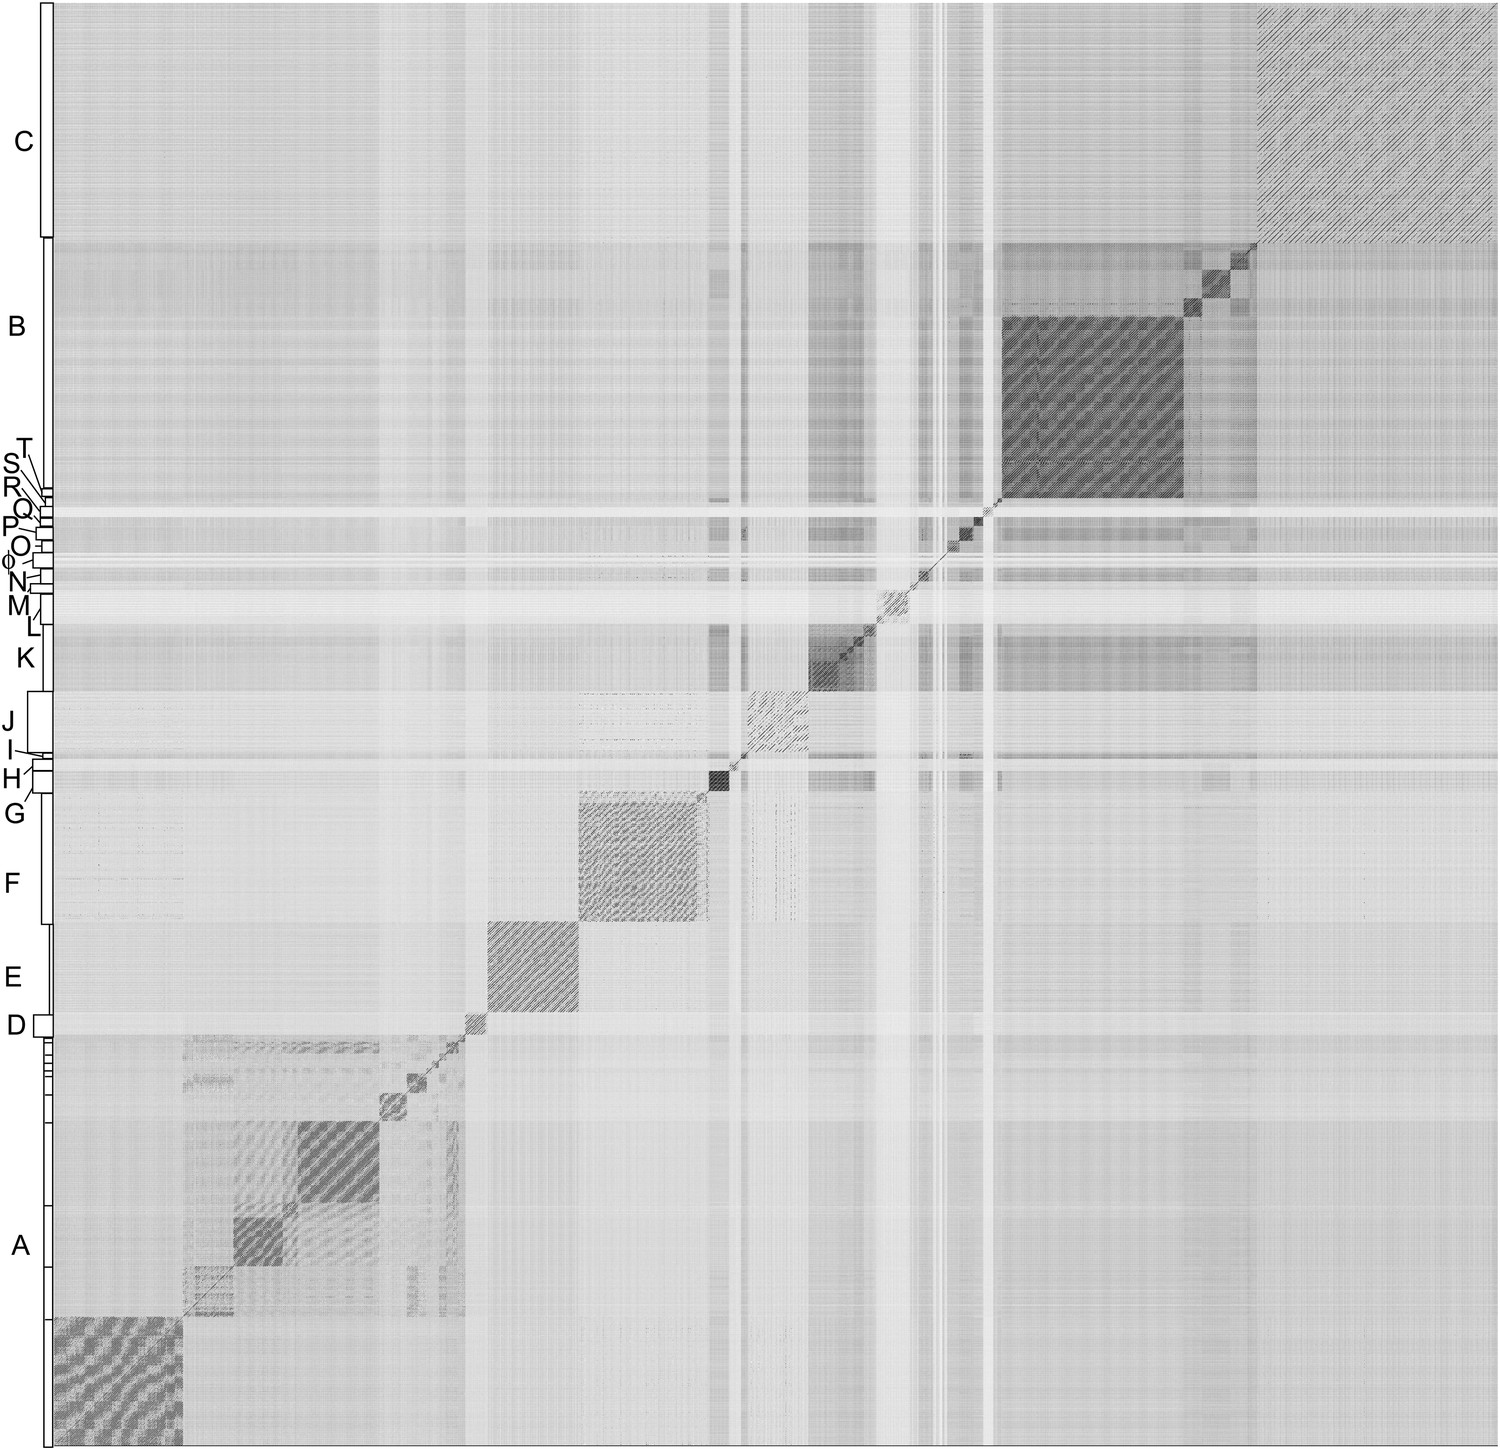
Nucleotide sequence comparison of 627 mycobacteriophages displayed as a dotplot.
Complete genome sequences of 627 mycobacteriophages were concatenated into a single file which was compared with itself using Gepard (Krumsiek et al., 2007) and displayed as a dotplot using default parameters (word length, 10). The order of the genomes is as listed in Supplementary file 1. Nucleotide similarity is a primary component in assembling phages into clusters, which typically requires evident DNA similarity spanning more than 50% of the genome lengths.
-
Figure 2—source data 1
Concatenated DNA sequences for 627 phage genomes.
- https://doi.org/10.7554/eLife.06416.005
Figure 2—figure supplement 1
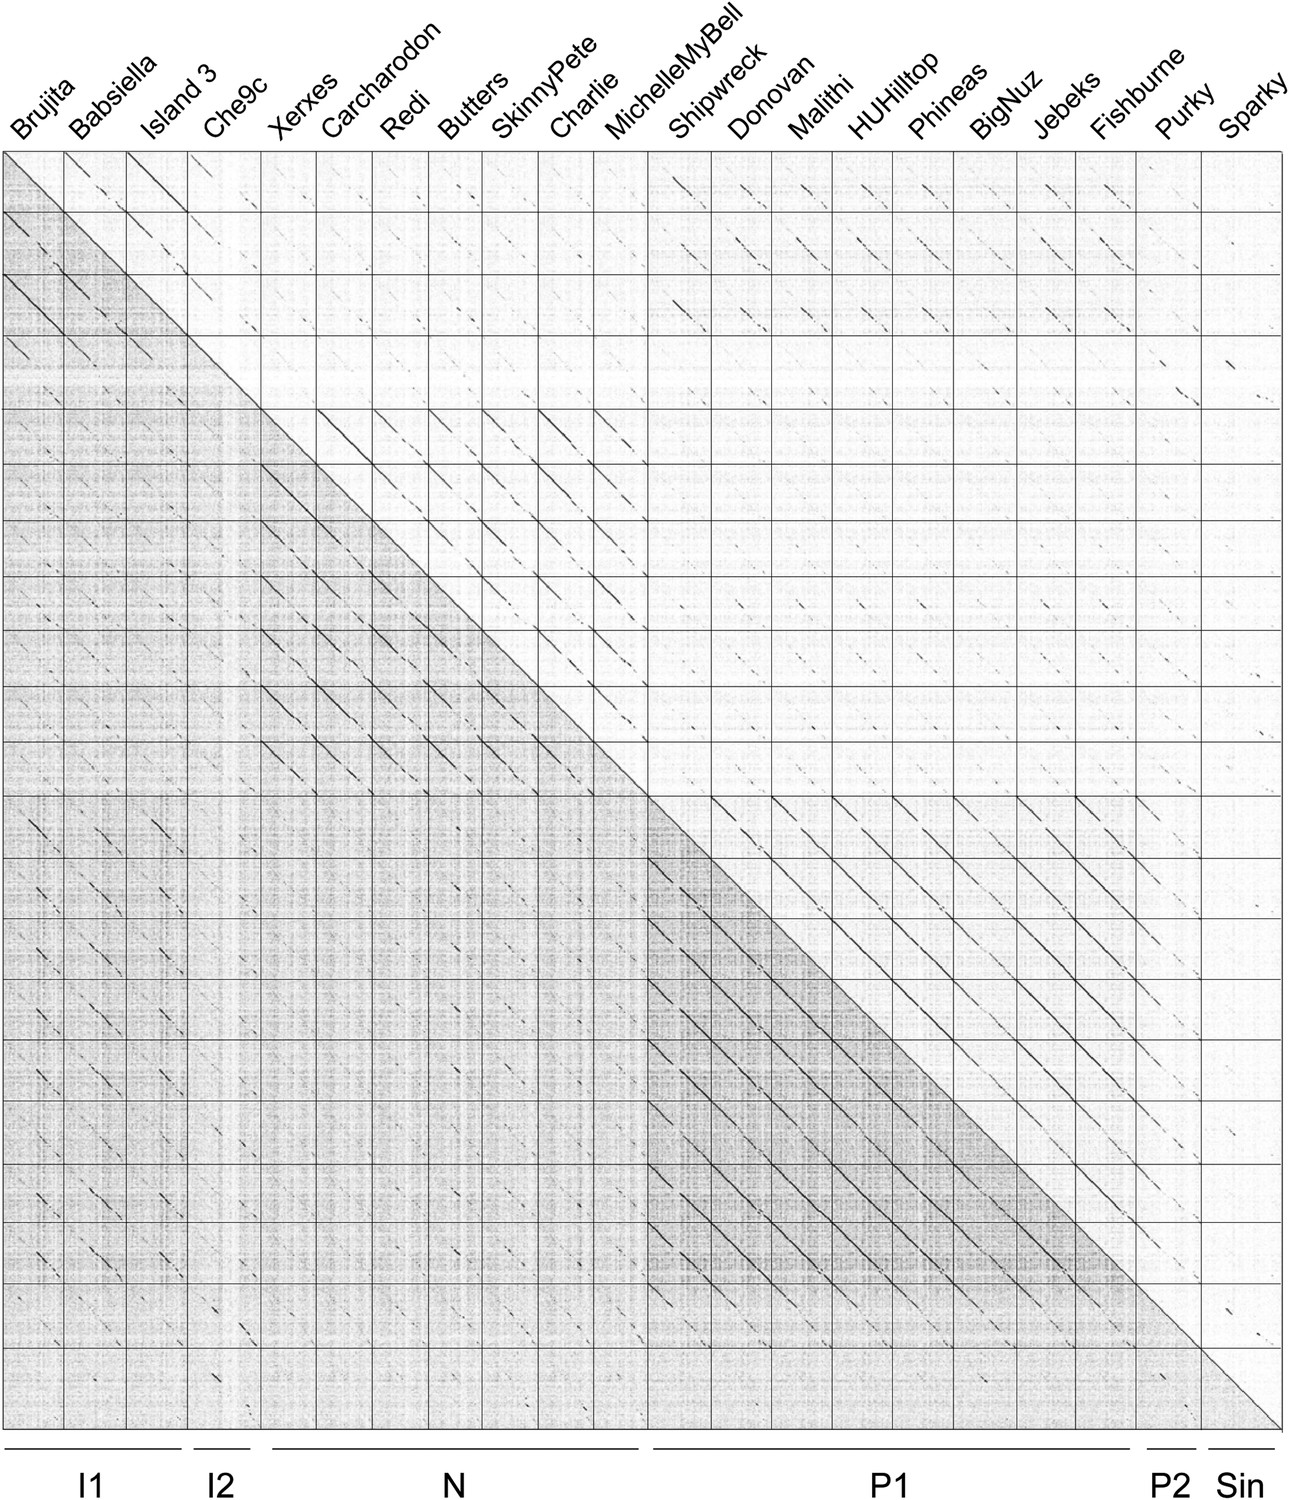
Dotplot of phages in Clusters I, N, P and the singleton Sparky.
A dotplot was generated using a concatenated file of genome sequences using Gepard (Krumsiek et al., 2007). The complexity of the genome relationships is illustrated by the Cluster I phages which share varying degrees of similarity to phages in Clusters N and P, as well as the singleton Sparky. Because inclusion of a phage in a cluster typically requires sharing a span of similarity over half of the genome lengths, these phages are not assembled into a single larger cluster.
Figure 2—figure supplement 2
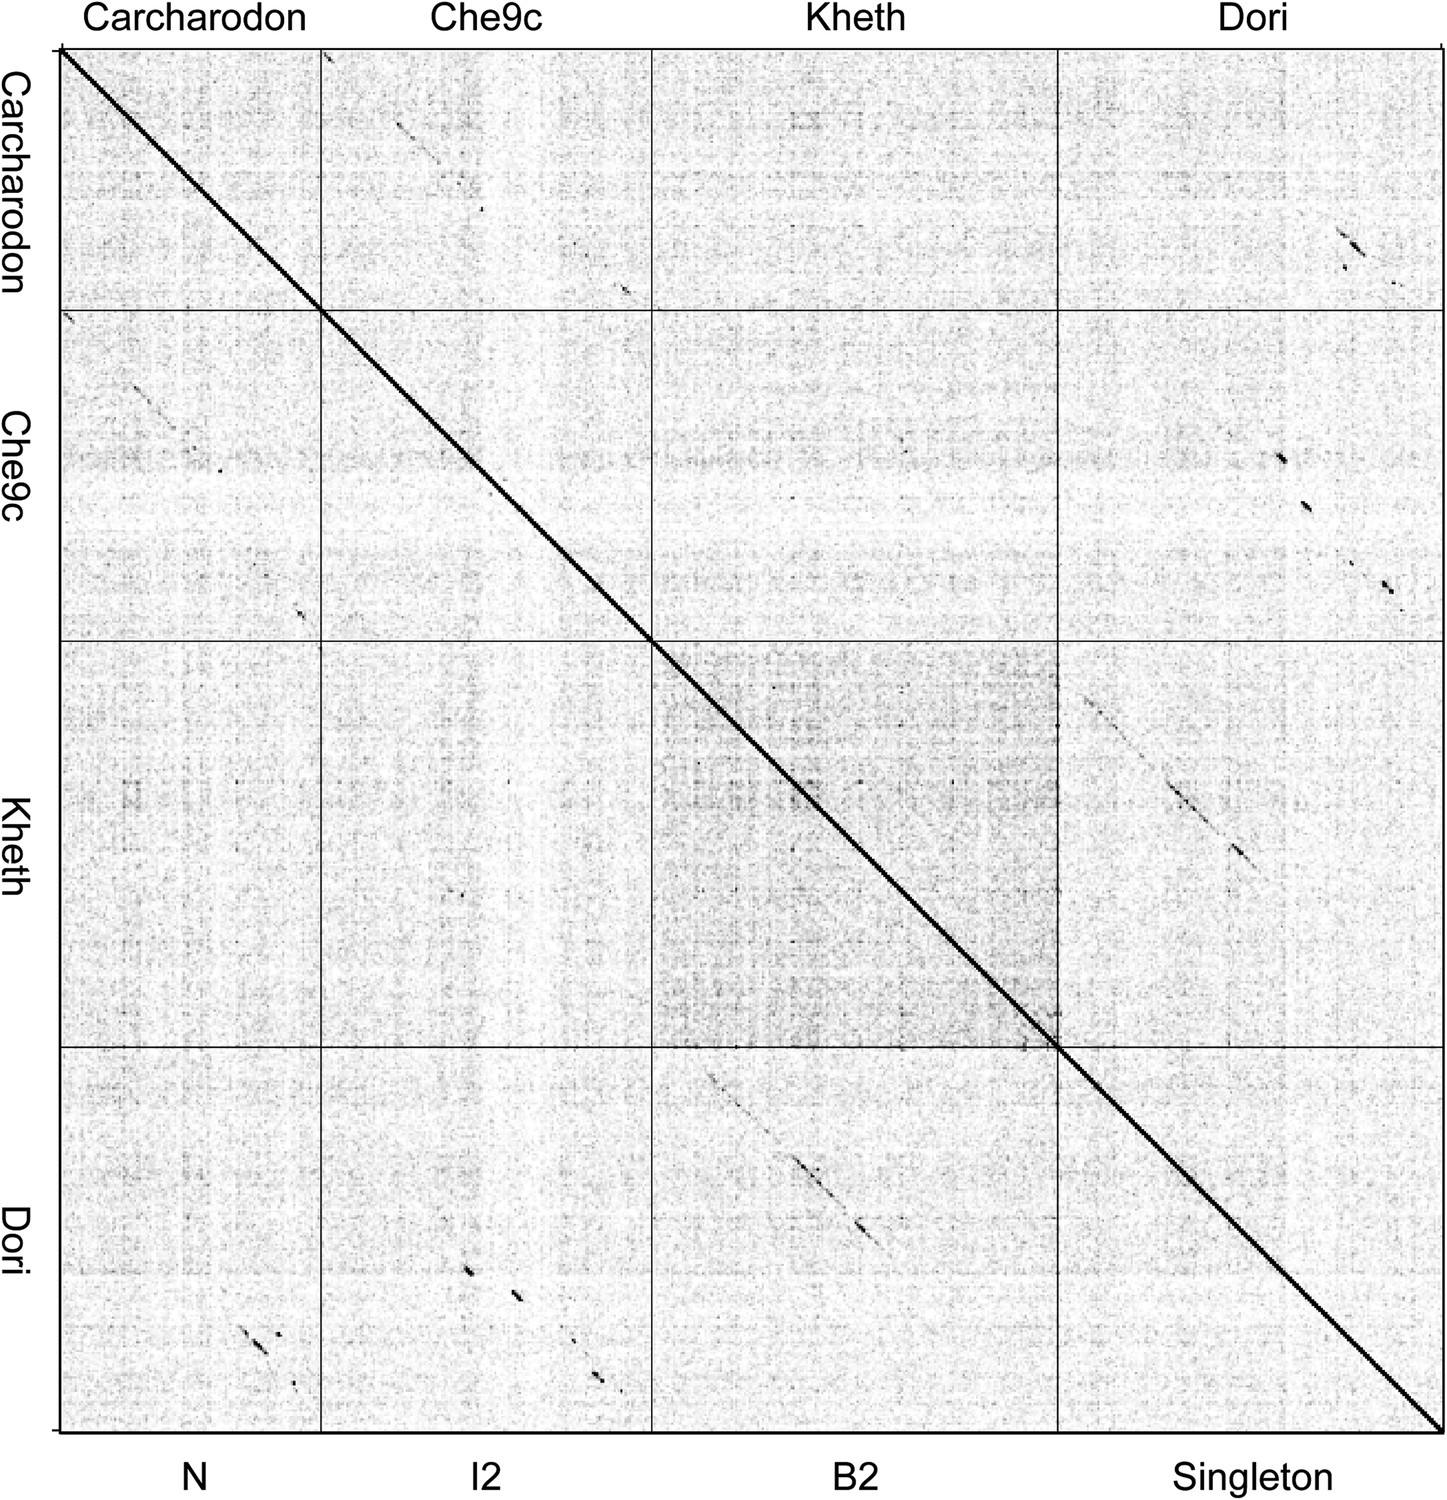
Dotplot of Carcharodon, Che9c, Kheth, and Dori.
The dotplot of concatenated genome sequences illustrates the ambiguity of whether the singleton Dori warrants inclusion in Cluster B. Dori shares DNA sequence similarity with its closest relative Kheth (Subcluster B2), but it does not span 50% of the genome lengths. Dori also shares DNA sequence similarity with Che9c (Cluster I2) and Carcharodon (Cluster N).
Figure 2—figure supplement 3
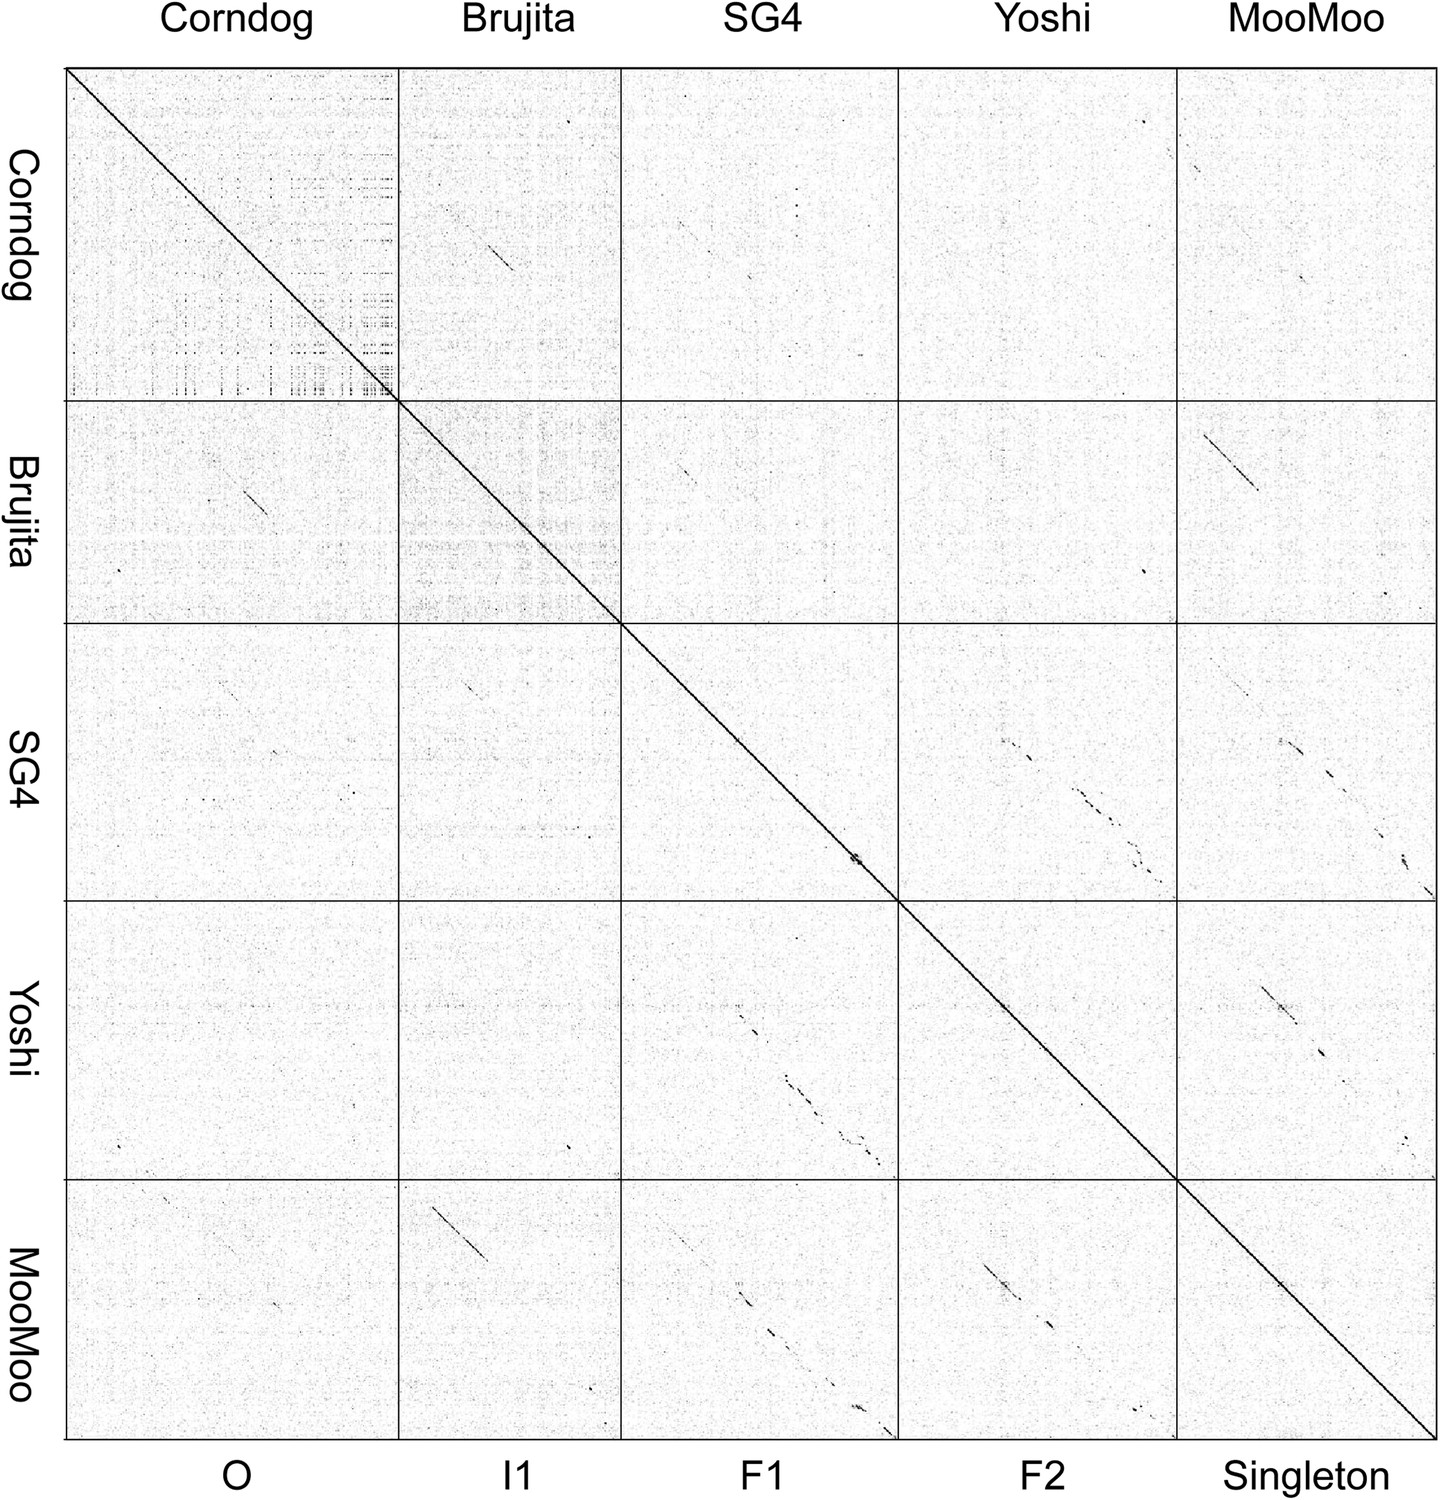
Dotplot of Corndog, Brujita, SG4, Yoshi, and MooMoo.
The dotplot of concatenated genome sequences illustrates the complex relationships between the singleton MooMoo and other phages. MooMoo shares DNA sequence similarity with SG4 (Subcluster F1) and Yoshi (Subcluster F2), but also with Brujita (Subcluster I1). MooMoo has barely detectable DNA sequence similarity with Corndog (Cluster O), but has a similar prolate virion morphology.
Figure 3
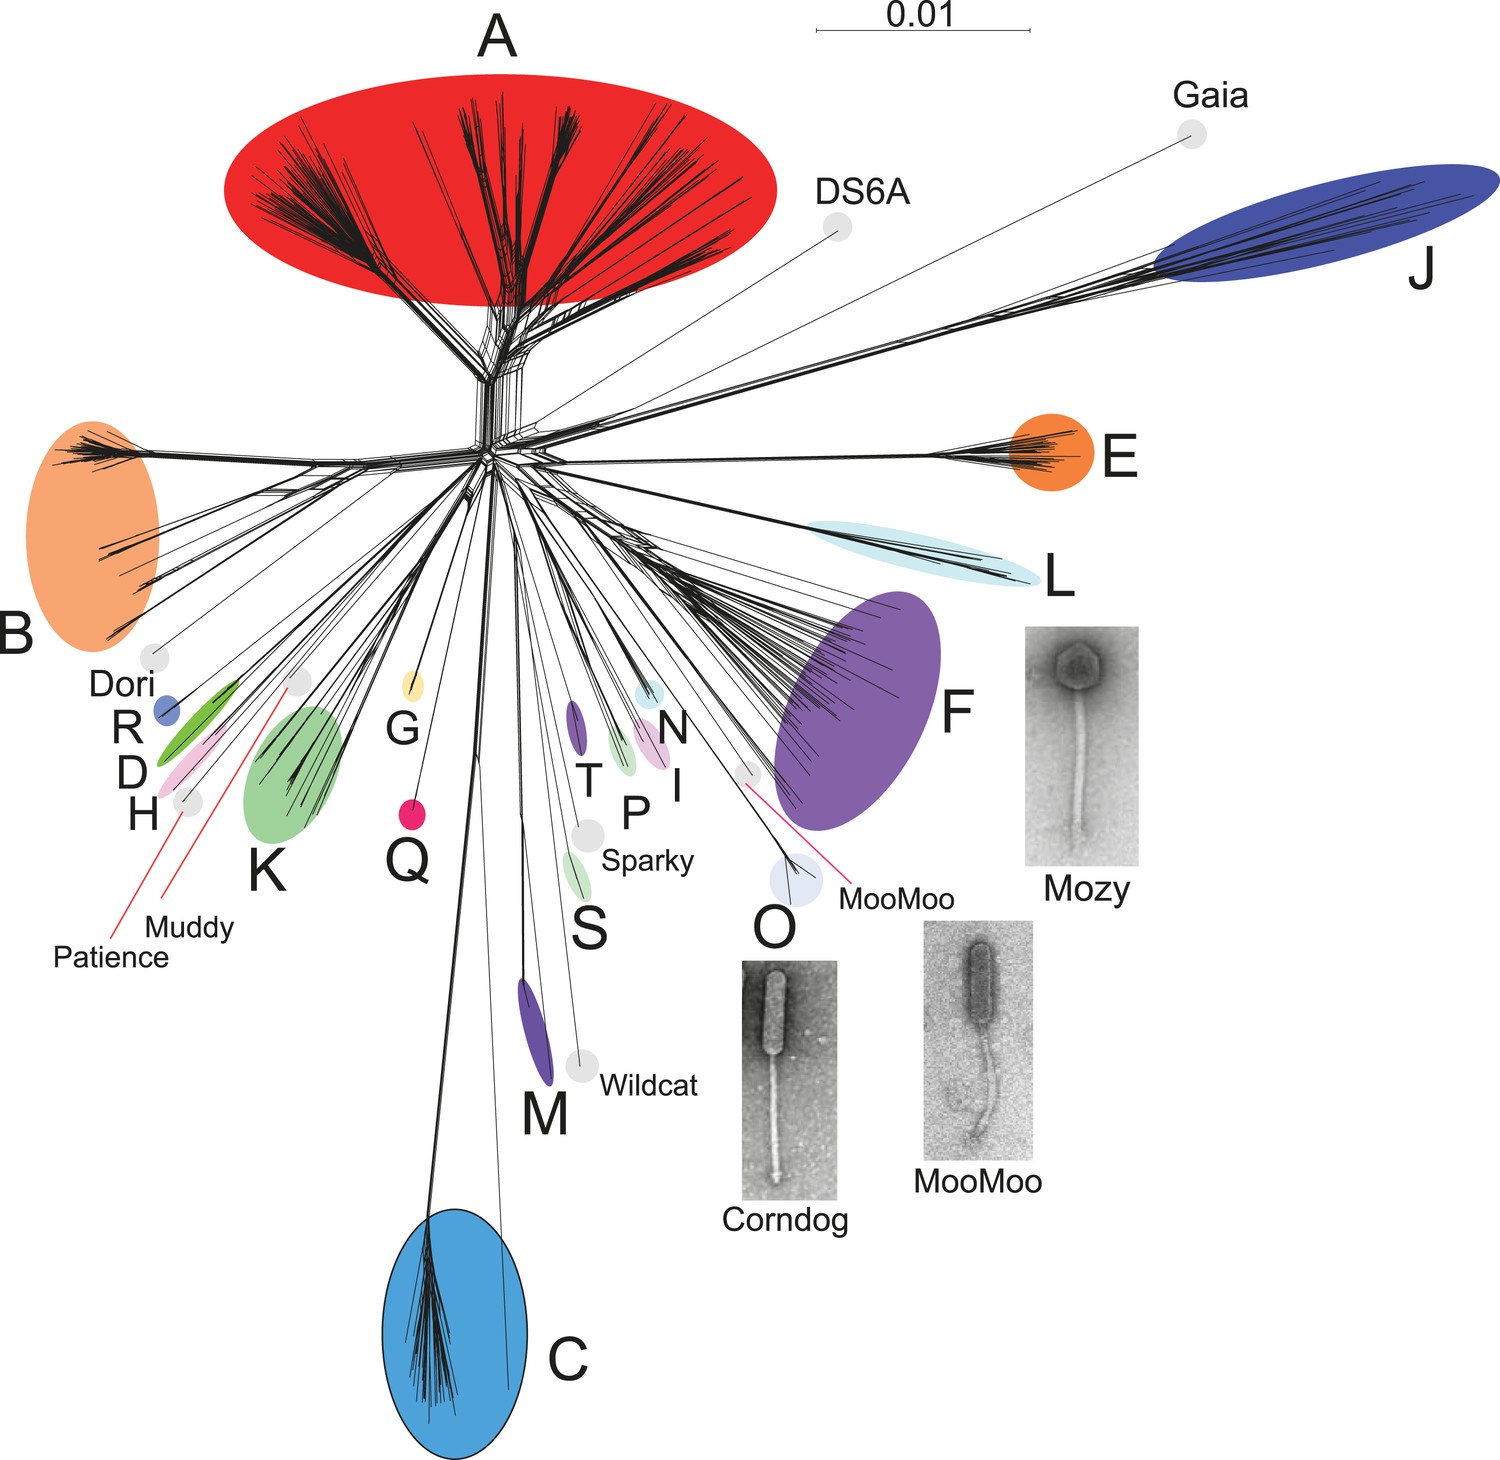
Network phylogeny of 627 mycobacteriophages based on gene content.
Genomes of 627 mycobacteriophages were compared according to shared gene content using the Phamerator (Cresawn et al., 2011) database Mykobacteriophage_627, and displayed using SplitsTree (Huson and Bryant, 2006). Colored circles indicate grouping of phages labeled according to their cluster designations generated by nucleotide sequence comparison (Figure 2); singleton genomes with no close relatives are labeled but not circled. Micrographs show morphotypes of the singleton MooMoo, the Cluster F phage Mozy, and the Cluster O phage Corndog. With the exception of DS6A, all of the phages infect Mycobacterium smegmatis mc2155.
-
Figure 3—source data 1
Nexus file containing phamily assignments for 627 phage genomes.
- https://doi.org/10.7554/eLife.06416.011
Figure 4 with 2 supplements

Proportions of orphams in mycobacteriophage genomes.
The proportions of genes that are orphams (i.e., single-gene phamilies with no homologues within the mycobacteriophage dataset) are shown for each phage. The order of the phages is as shown in Supplementary file 1. All of the singleton genomes have >30% orphams, and most of the other genomes with relatively high proportions of orphams are the single-genome subclusters (Table 2) including Hawkeye (D2), Myrna (C2), Squirty (F3), Barnyard (H2), Che9c (I2), Whirlwind (L3), Rey (M2), and Purky (P2). Three phages shown in red type are not singletons or single-genome subclusters but have relatively high proportions of orphams. Predator and Mendokysei are members of the diverse and small clusters (five or fewer genomes) H and T, respectively; KayaCho is a member of Subcluster B4 but has a sufficiently high proportion of orphams to arguably warrant formation of a new subcluster, B6.
-
Figure 4—source data 1
Pham table containing phamily designations for 627 phage genomes.
- https://doi.org/10.7554/eLife.06416.013
Figure 4—figure supplement 1
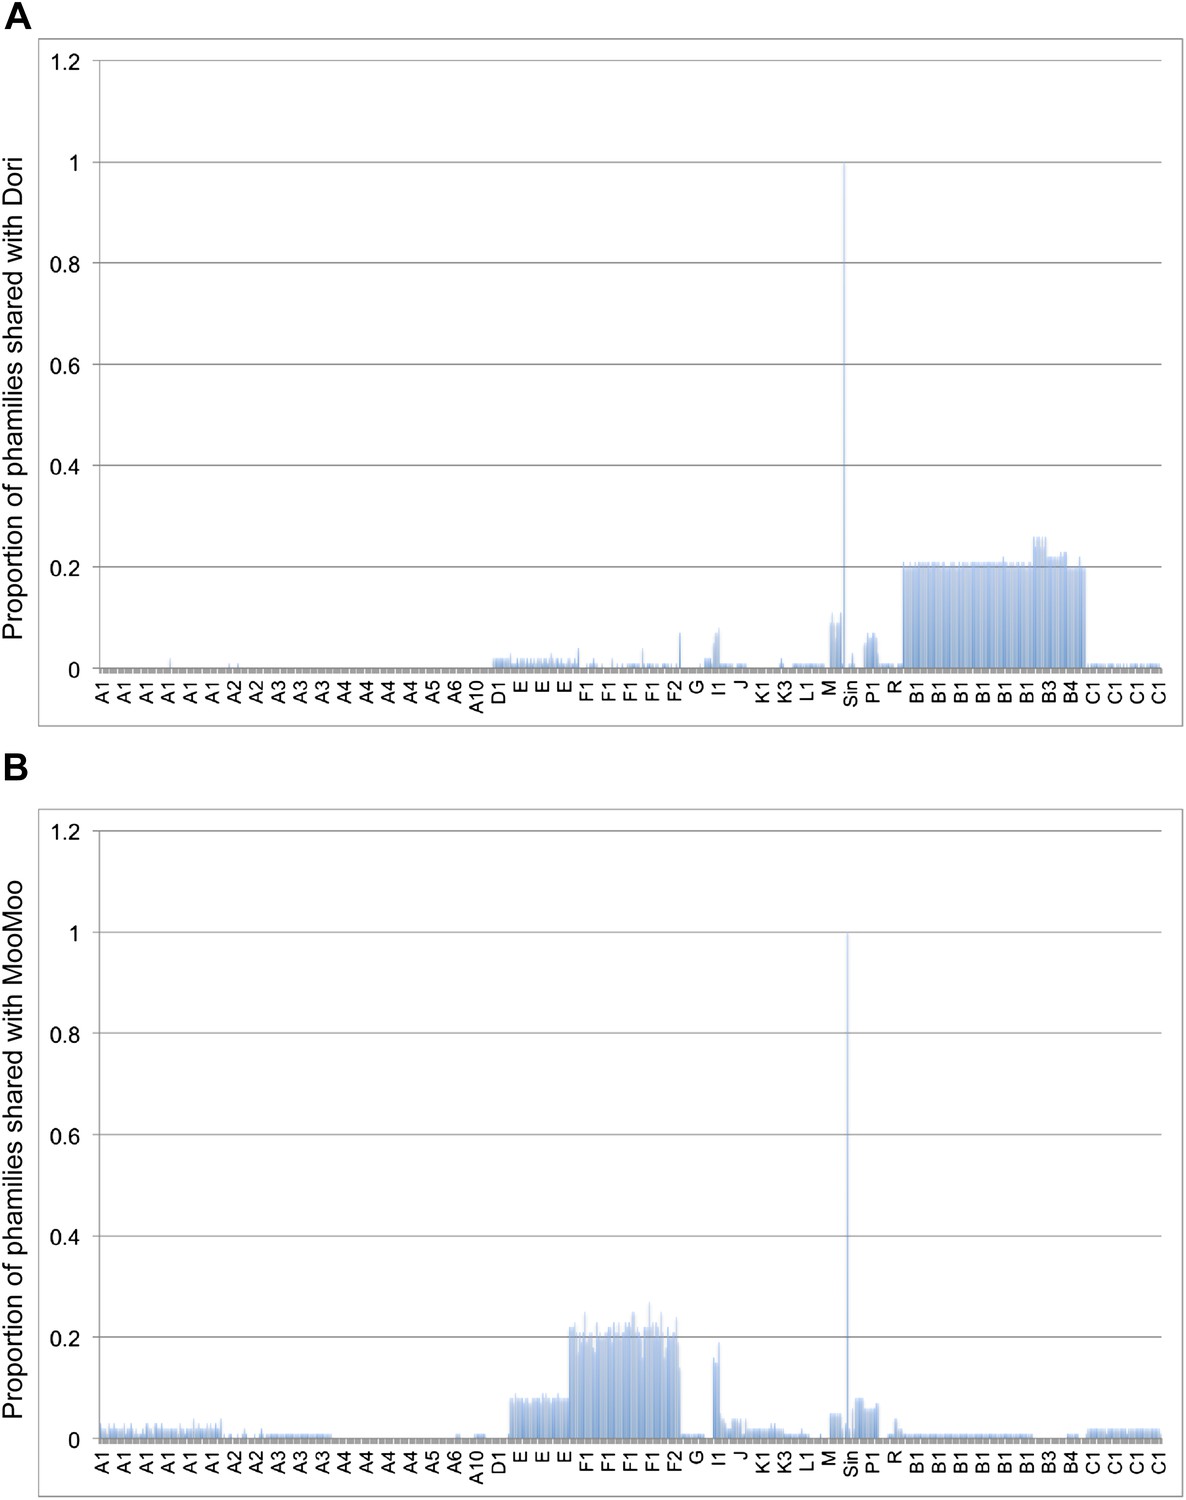
Shared gene content between Dori, MooMoo, and other mycobacteriophages.
(A) Average percentages of phamilies shared between Dori and other mycobacteriophages. (B) Average percentages of phamilies shared between MooMoo and other mycobacteriophages. Genomes on the x axis are listed in the same order as in Supplementary file 1 and the cluster designations are indicated.
Figure 4—figure supplement 2
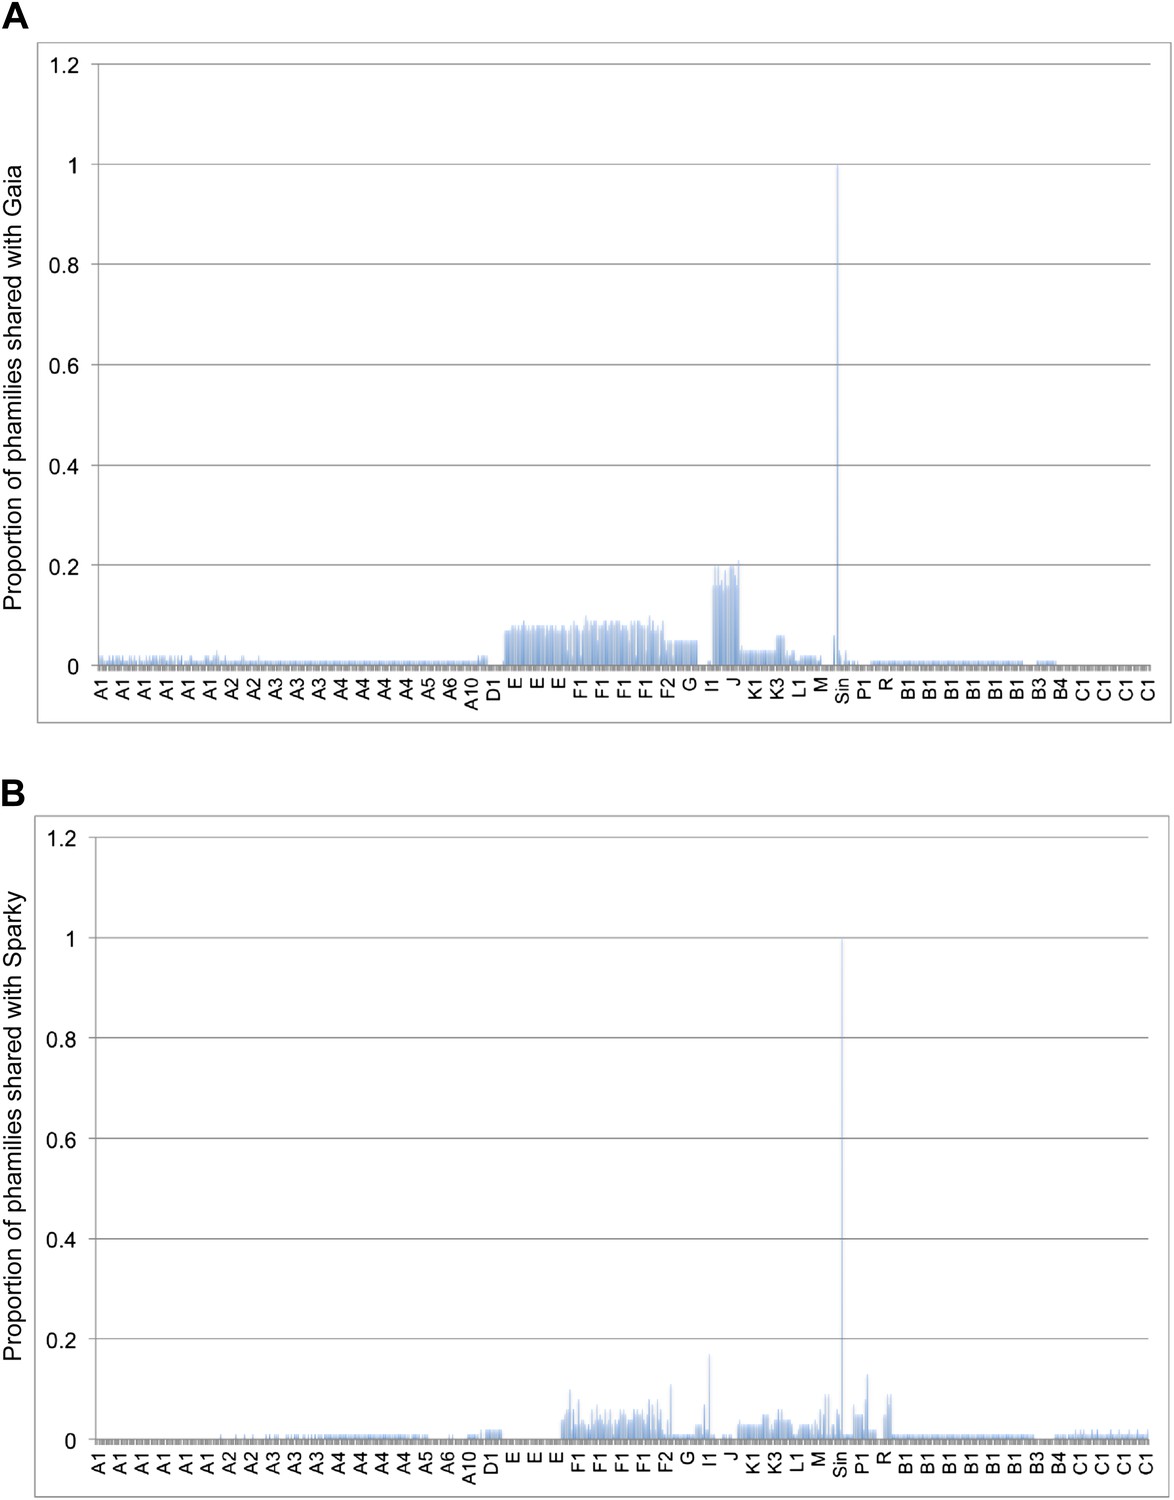
Shared gene content between Gaia, Sparky, and other mycobacteriophages.
(A) Average percentages of phamilies shared between Gaia and other mycobacteriophages. (B) Average percentages of phamilies shared between Sparky and other mycobacteriophages. Genomes on the x axis are listed in the same order as in Supplementary file 1 and the cluster designations are indicated.
Figure 5
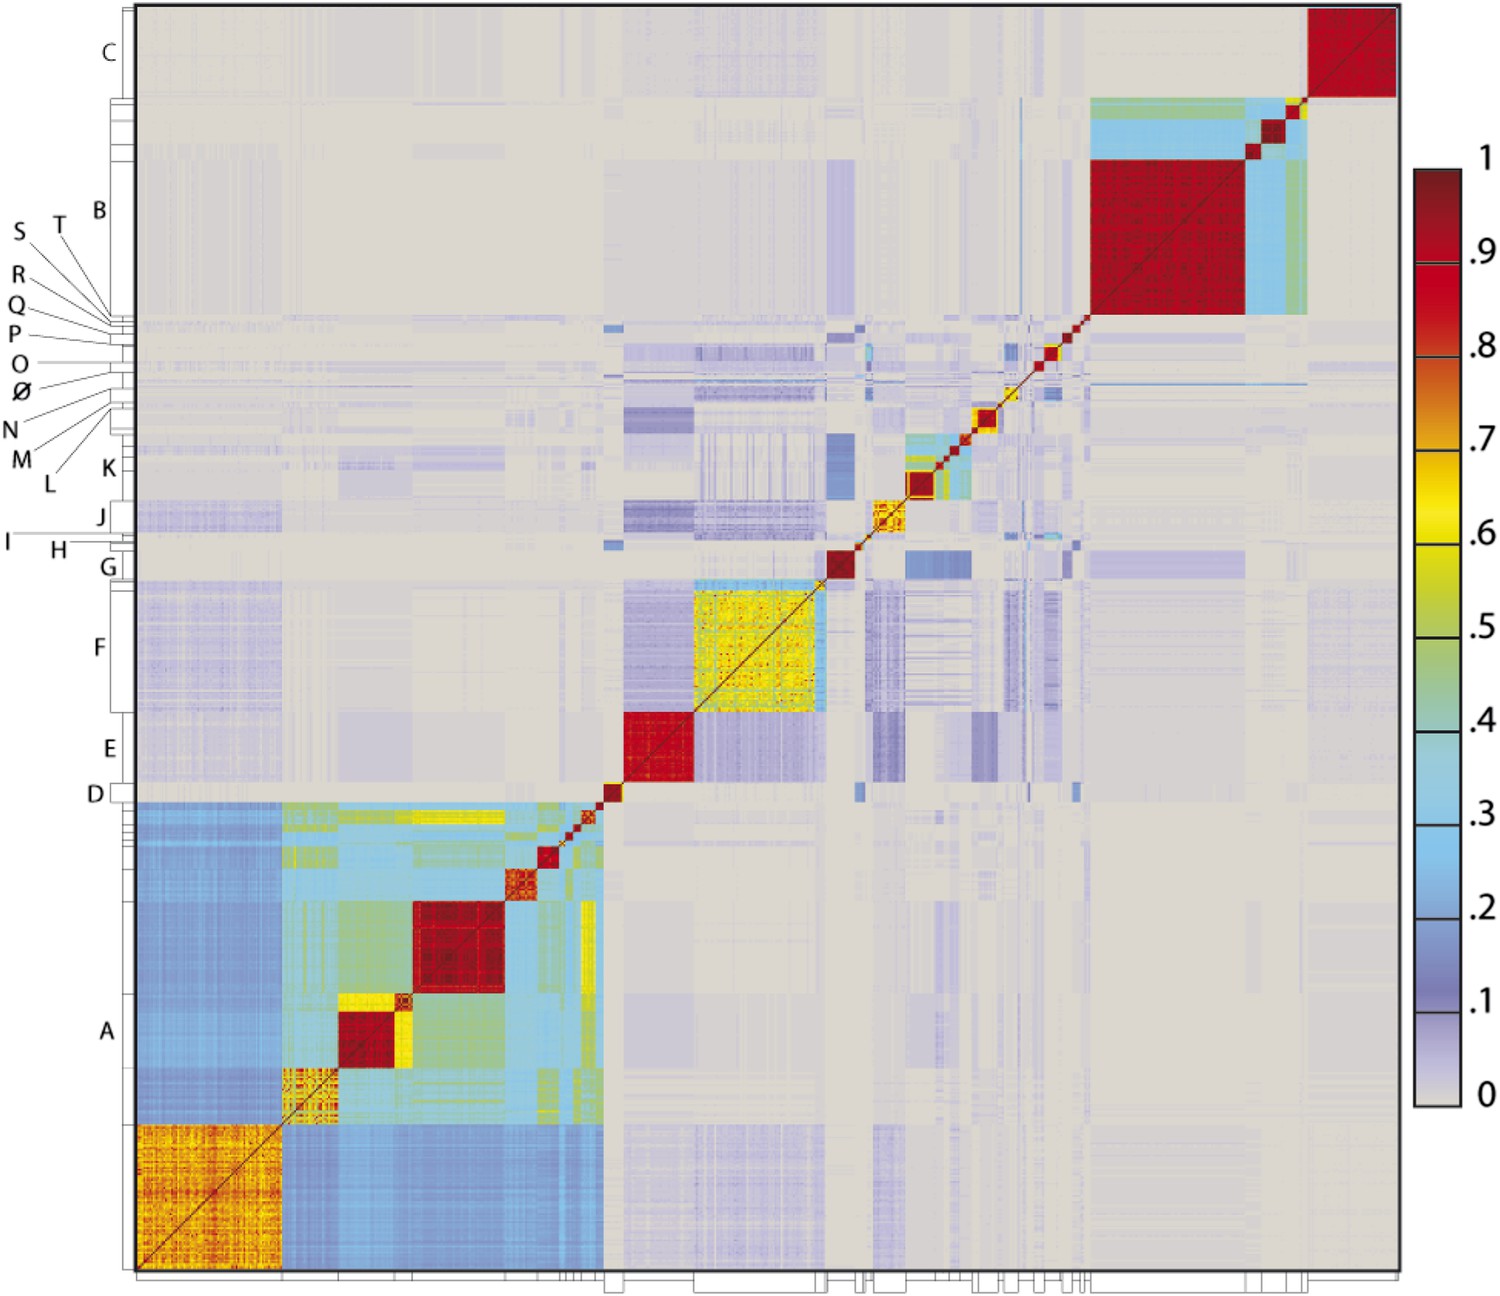
Heat map representation of shared gene content among 627 mycobacteriophages.
The percentages of pairwise shared genes was determined using a Phamerator (Cresawn et al., 2011) database (Mykobacteriophage_627) populated with 627 completely sequenced phage genomes. The 69,574 genes were assembled into 5205 phamilies (phams) of related sequences using kClust, and the average proportions of shared phams calculated. Genomes are ordered on both axes according to their cluster and subcluster designations (Supplementary file 1) determined by nucleotide sequence similarities (Figure 2). The values (proportions of pairwise shared phams averaged between each partner) are colored as indicated.
-
Figure 5—source data 1
Dataset showing percentages of pairwise shared phamilies.
- https://doi.org/10.7554/eLife.06416.017
Figure 6 with 2 supplements
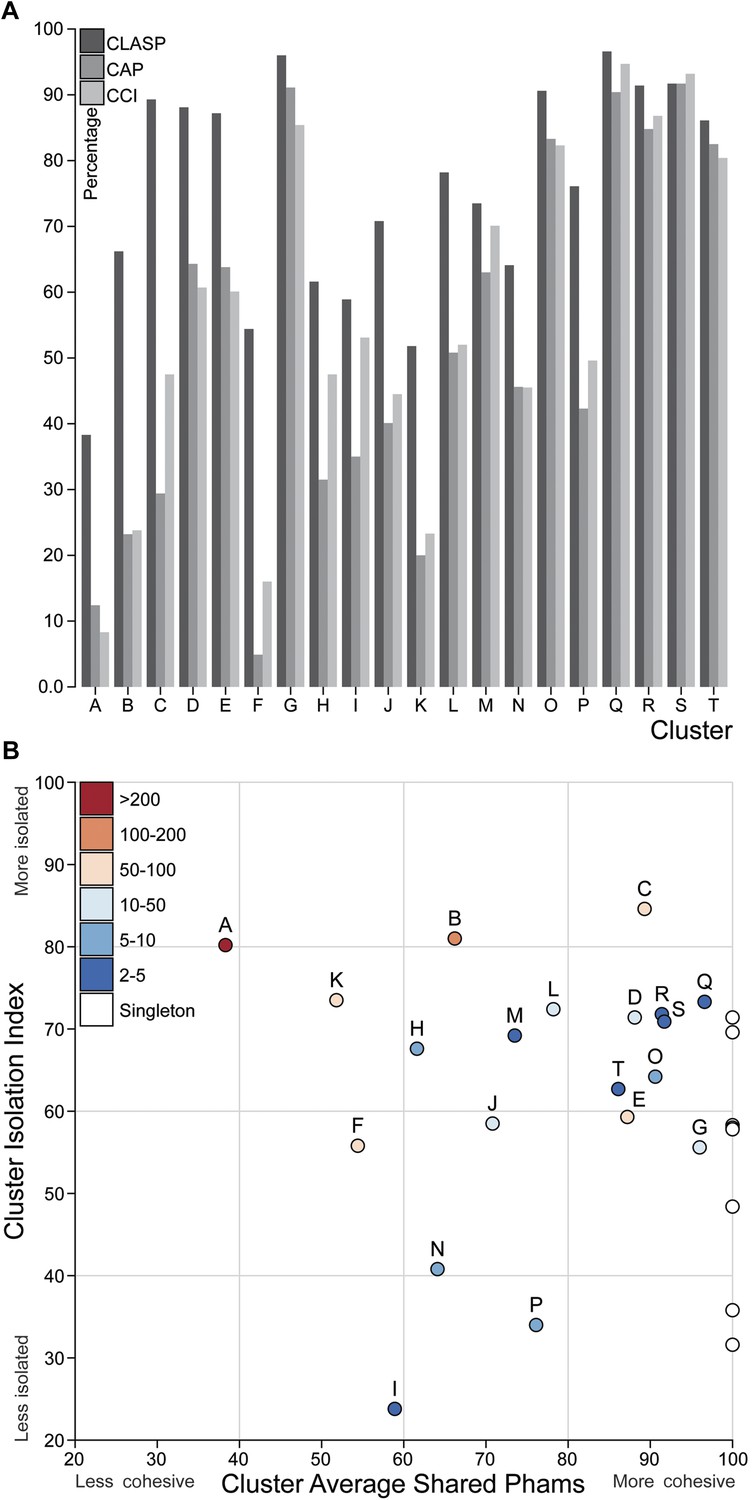
Cluster diversity and isolation.
(A) The CLuster Averaged Shared Phamilies (CLASP; blue), Cluster Associated Phamilies (CAP; red) and Cluster Cohesion Index (CCI; green) values are plotted for each mycobacteriophage cluster. (B) The Cluster Isolation Index (CII) and CLASP values (both shown as percentages) are plotted for each phage cluster. Singletons (white circles) are not individually labeled but correspond to the values shown in Table 1.
-
Figure 6—source data 1
Datasets showing numbers of CLuster Average Shard Phamilies.
- https://doi.org/10.7554/eLife.06416.019
Figure 6—figure supplement 1

Resampling CLASP values for cluster diversity and size.
CLuster Averaged Shared Phamilies (CLASP) values were calculated for Clusters A, B, C, E, F, and K by resampling random subsets of the genomes. The size of the subsets is shown on the x axis and each point is the average of 20 iterations. The minimum and maximum variations among the iterations are shown.
Figure 6—figure supplement 2
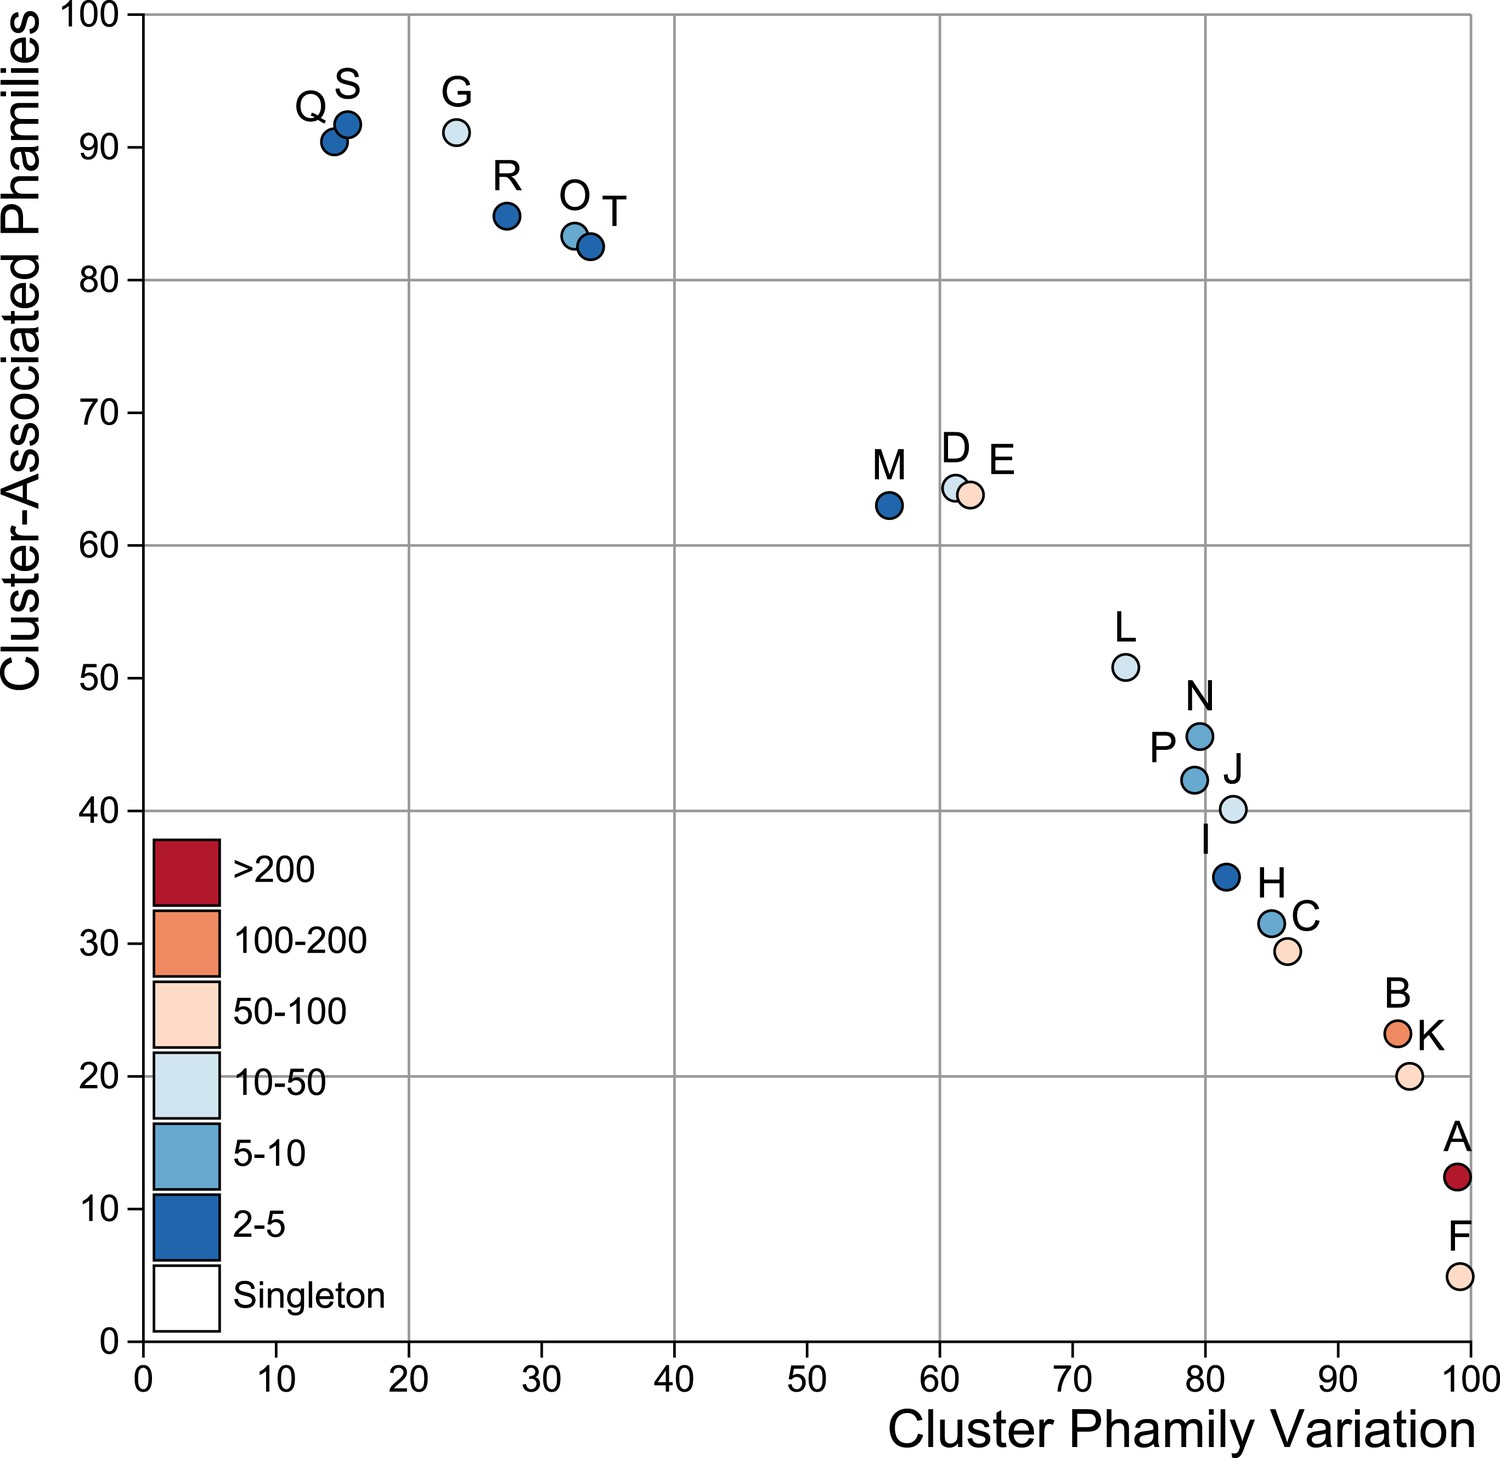
Cluster diversity shown by Cluster-Associated Phamilies (CAP) and Cluster Phamily Variation (CPV) indices.
The CAP and CPV values are plotted for each cluster.
Figure 7

Rarefaction analysis of mycobacteriophage genomes.
(A) The numbers of phamilies are reported for between 1 and 627 phage genomes sampled at random without replacement; the mean of 10,000 iterations is shown in red; gray lines indicate a confidence interval of two standard deviations. The black line shows a hyperbolic curve fit to the data from phage counts 1 to 314. The inset shows the number of new phams encountered upon the inclusion of each phage, with the mean number for the 10,000 iterations shown in blue and the predicted value from the hyperbolic curve shown in black. (B) Rarefaction analysis of 232 Cluster A phages. The total numbers of phamilies are reported for between 1 and 232 phages sampled at random without replacement from Cluster A; the mean of 10,000 iterations is shown in red; gray lines indicate a confidence interval of two standard deviations. The black line shows a hyperbolic curve fit to the data from phage counts 1 to 117. The inset shows the number of new phams encountered upon the inclusion of each phage, with the mean number for 10,000 iterations shown in blue and the predicted value from the hyperbolic curve shown in black. (C) Rarefaction analysis of 108 Cluster B phages; the hyperbolic curve was fit to the data from phage counts 1 to 54. (D) Fits of the hyperbolic (Equation 1) and hyperbolic with linear (Equation 2) models for phamily identification within genome samples.
-
Figure 7—source data 1
Datasets for determination of rarefaction curves.
- https://doi.org/10.7554/eLife.06416.024
Tables
Table 1
Diversity and genetic isolation of mycobacteriophage genome clusters
| Cluster | # Subclusters | # Genomes | Average # genes* | Average length (bp) | Total phams† | Total genes | CLASP‡ | CAP§ | CCI# | CII¶ |
|---|---|---|---|---|---|---|---|---|---|---|
| A | 11 | 232 | 90 ± 5.3 | 51,514 | 1085 | 20,880 | 38.3 | 12.4 | 0.08 | 80.2 |
| B | 5 | 109 | 100.4 ± 4.5 | 68,653 | 421 | 10,944 | 66.2 | 23.2 | 0.24 | 81.0 |
| C | 2 | 45 | 231 ± 5.9 | 155,504 | 486 | 10,395 | 89.3 | 29.4 | 0.48 | 84.6 |
| D | 2 | 10 | 89.3 ± 6.4 | 64,965 | 147 | 893 | 88.1 | 64.3 | 0.61 | 71.4 |
| E | 1 | 35 | 141.9 ± 3.4 | 75,526 | 236 | 4967 | 87.2 | 63.8 | 0.60 | 59.3 |
| F | 3 | 66 | 105.3 ± 5.3 | 57,416 | 658 | 6950 | 54.4 | 4.9 | 0.16 | 55.8 |
| G | 1 | 14 | 61.5 ± 1.2 | 41,845 | 72 | 861 | 96.0 | 91.1 | 0.85 | 55.6 |
| H | 2 | 5 | 98.4 ± 5.7 | 69,469 | 207 | 492 | 61.6 | 31.5 | 0.48 | 67.6 |
| I | 2 | 4 | 78 ± 3.7 | 49,954 | 147 | 312 | 58.9 | 35.0 | 0.53 | 23.8 |
| J | 1 | 16 | 239.8 ± 9.3 | 110,332 | 530 | 3776 | 70.8 | 40.1 | 0.45 | 58.5 |
| K | 5 | 32 | 95.7 ± 4.6 | 59,720 | 411 | 3069 | 51.8 | 20.0 | 0.23 | 73.5 |
| L | 3 | 13 | 127.9 ± 6.5 | 75,177 | 246 | 1663 | 78.2 | 50.8 | 0.52 | 72.4 |
| M | 2 | 3 | 141 ± 8.8 | 81,636 | 201 | 423 | 73.5 | 63.0 | 0.70 | 69.2 |
| N | 1 | 7 | 69.1 ± 2.2 | 42,888 | 152 | 484 | 64.1 | 45.6 | 0.45 | 40.8 |
| O | 1 | 5 | 124.2 ± 3.1 | 70,651 | 151 | 621 | 90.6 | 83.3 | 0.82 | 64.2 |
| P | 2 | 9 | 78.8 ± 2.1 | 47,668 | 159 | 709 | 76.1 | 42.3 | 0.50 | 34.0 |
| Q | 1 | 5 | 85.2 ± 3.7 | 53,755 | 90 | 426 | 96.6 | 90.4 | 0.95 | 73.3 |
| R | 1 | 4 | 101.5 ± 2.5 | 71,348 | 117 | 406 | 91.4 | 84.8 | 0.87 | 71.8 |
| S | 1 | 2 | 109 ± 2.0 | 65,172 | 117 | 218 | 91.7 | 91.7 | 0.93 | 70.9 |
| T | 1 | 3 | 66.7 ± 2.4 | 42,833 | 83 | 200 | 86.1 | 82.5 | 0.80 | 62.7 |
| Dori | 1 | 1 | 94 | 64,613 | 94 | 94 | N/A | N/A | N/A | 35.8 |
| DS6A | 1 | 1 | 97 | 60,588 | 96 | 97 | N/A | N/A | N/A | 58.3 |
| Gaia | 1 | 1 | 194 | 90,460 | 193 | 194 | N/A | N/A | N/A | 58.0 |
| MooMoo | 1 | 1 | 98 | 55,178 | 98 | 98 | N/A | N/A | N/A | 31.6 |
| Muddy | 1 | 1 | 71 | 48,228 | 70 | 71 | N/A | N/A | N/A | 71.4 |
| Patience | 1 | 1 | 109 | 70,506 | 109 | 109 | N/A | N/A | N/A | 57.8 |
| Sparky | 1 | 1 | 93 | 63,334 | 93 | 93 | N/A | N/A | N/A | 48.4 |
| Wildcat | 1 | 1 | 148 | 78,296 | 148 | 148 | N/A | N/A | N/A | 69.6 |
-
*
Average number of protein-coding genes per genome, with standard deviation.
-
†
Total phams is the sum of all phamilies (groups of homologous mycobacteriophage genes) in that cluster.
-
‡
The Cluster Averaged Shared Phamilies (CLASP) index is the average of the percentages of phamilies shared pairwise between genomes within a cluster.
-
§
The Cluster-Associated Phamilies (CAP) index is the percentage of the average number of phamilies per genome within a cluster whose phamilies are present in every cluster member.
-
#
The Cluster Cohesion Index (CCI) is generated by dividing the average number of genes per genome by the total number of phamilies (phams) in that cluster.
-
¶
The Cluster Isolation Index (CII) is the percentage of phams that are present only in that cluster, and not present in other mycobacteriophages.
-
N/A: Not applicable.
Table 2
Genometrics and Cluster Cohesion Indexes of mycobacteriophages
| Cluster | Subcluster | # Genomes | Average # genes | Average length (bp) | # Phams | CLASP* | CAP† | CCI‡ |
|---|---|---|---|---|---|---|---|---|
| A | 232 | 90.0 | 51,514 | 1085 | 38.3 | 12.4 | 8.0 | |
| A1 | 72 | 91.2 | 51,954 | 416 | 72.3 | 36.9 | 22.0 | |
| A2 | 28 | 93.4 | 52,805 | 312 | 64.7 | 30.1 | 30.0 | |
| A3 | 37 | 87.7 | 50,325 | 163 | 81.1 | 48.8 | 54.0 | |
| A4 | 46 | 87.4 | 51,376 | 125 | 92.7 | 70.6 | 70.0 | |
| A5 | 16 | 86.0 | 50,531 | 152 | 81.4 | 58.7 | 57.0 | |
| A6 | 11 | 97.8 | 51,677 | 128 | 90.2 | 75.1 | 76.0 | |
| A7 | 3 | 84.3 | 52,941 | 115 | 74.9 | 64.4 | 73.0 | |
| A8 | 4 | 97.8 | 51,597 | 107 | 93.5 | 86.8 | 91.0 | |
| A9 | 4 | 96.0 | 52,838 | 106 | 92.7 | 83.4 | 91.0 | |
| A10 | 7 | 80.0 | 49,174 | 112 | 81.6 | 60.9 | 71.0 | |
| A11 | 4 | 98.5 | 52,260 | 113 | 93.6 | 88.3 | 87.0 | |
| B | 108 | 100.4 | 68,653 | 421 | 66.2 | 23.2 | 24.0 | |
| B1 | 77 | 101.8 | 68,532 | 144 | 93.2 | 72.9 | 71.0 | |
| B2 | 8 | 89.9 | 67,267 | 101 | 94.9 | 84.6 | 89.0 | |
| B3 | 12 | 102.8 | 68,698 | 121 | 96.3 | 84.7 | 85.0 | |
| B4 | 8 | 96.1 | 70,619 | 166 | 79.9 | 45.8 | 58.0 | |
| B5 | 3 | 96.3 | 70,033 | 108 | 91.7 | 87.2 | 89.0 | |
| C | 45 | 231.0 | 155,504 | 486 | 89.3 | 29.4 | 48.0 | |
| C1 | 44 | 231.0 | 155,297 | 345 | 91.9 | 73.2 | 67.0 | |
| C2 | 1 | 229.0 | 164,602 | 227 | N/A | N/A | N/A | |
| D | 10 | 89.3 | 64,965 | 147 | 88.1 | 64.3 | 61.0 | |
| D1 | 9 | 87.3 | 64,697 | 100 | 94.9 | 88.8 | 87.0 | |
| D2 | 1 | 107.0 | 67,383 | 107 | N/A | N/A | N/A | |
| E | 35 | 141.9 | 75,526 | 235 | 87.2 | 63.8 | 60.0 | |
| F | 66 | 105.3 | 57,416 | 658 | 54.4 | 4.9 | 16.0 | |
| F1 | 60 | 104.8 | 57,486 | 573 | 59.6 | 20.6 | 18.0 | |
| F2 | 5 | 110.8 | 55,996 | 207 | 65.7 | 49.0 | 54.0 | |
| F3 | 1 | 107.0 | 60,285 | 105 | N/A | N/A | N/A | |
| G | 14 | 61.5 | 41,845 | 72 | 96.0 | 91.1 | 85.0 | |
| H | 5 | 98.4 | 69,469 | 207 | 61.6 | 31.5 | 48.0 | |
| H1 | 4 | 95.8 | 69,137 | 131 | 81.9 | 67.9 | 73.0 | |
| H2 | 1 | 109.0 | 70,797 | 110 | N/A | N/A | N/A | |
| I | 4 | 78.0 | 49,954 | 147 | 58.9 | 35.0 | 53.0 | |
| I1 | 3 | 76.0 | 47,588 | 101 | 77.5 | 66.7 | 75.0 | |
| I2 | 1 | 84.0 | 57,050 | 84 | N/A | N/A | N/A | |
| J | 16 | 239.8 | 110,332 | 530 | 70.8 | 40.1 | 45.0 | |
| K | 33 | 95.7 | 59,720 | 411 | 51.8 | 20.0 | 23.0 | |
| K1 | 15 | 94.3 | 59,877 | 166 | 85.5 | 47.9 | 57.0 | |
| K2 | 4 | 96.3 | 56,597 | 128 | 85.2 | 77.7 | 75.0 | |
| K3 | 3 | 98.2 | 61,322 | 111 | 92.2 | 89.5 | 88.0 | |
| K4 | 5 | 94.0 | 57,865 | 106 | 93.7 | 87.2 | 89.0 | |
| K5 | 6 | 98.2 | 62,154 | 144 | 82.1 | 68.2 | 68.0 | |
| L | 13 | 127.9 | 75,177 | 246 | 78.2 | 50.8 | 52.0 | |
| L1 | 3 | 123.7 | 74,050 | 135 | 92.6 | 88.8 | 92.0 | |
| L2 | 9 | 129.3 | 75,456 | 170 | 90.1 | 72.2 | 76.0 | |
| L3 | 1 | 128.0 | 76,050 | 126 | N/A | N/A | N/A | |
| M | 3 | 141.0 | 81,636 | 201 | 73.5 | 63.0 | 70.0 | |
| M1 | 2 | 135.0 | 80,593 | 138 | 96.6 | 96.6 | 98.0 | |
| M2 | 1 | 153.0 | 83,724 | 152 | N/A | N/A | N/A | |
| N | 7 | 69.1 | 42,888 | 152 | 64.1 | 45.6 | 45.0 | |
| O | 5 | 124.2 | 70,651 | 151 | 90.6 | 83.3 | 82.0 | |
| P | 9 | 78.8 | 47,668 | 159 | 76.1 | 42.3 | 50.0 | |
| P1 | 8 | 78.4 | 47,313 | 126 | 82.9 | 52.9 | 62.0 | |
| P2 | 1 | 82.0 | 50,513 | 82 | N/A | N/A | N/A | |
| Q | 5 | 85.2 | 53,755 | 90 | 96.6 | 90.4 | 95.0 | |
| R | 4 | 101.5 | 71,348 | 117 | 91.4 | 84.8 | 87.0 | |
| S | 2 | 109.0 | 65,172 | 117 | 91.7 | 91.7 | 93.0 | |
| T | 3 | 66.7 | 42,833 | 83 | 86.1 | 82.5 | 80.0 |
-
*
Cluster Averaged Shared Phamilies.
-
†
Cluster Associated Phamilies.
-
‡
Cluster Cohesion Index.
Additional files
-
Supplementary file 1
List of 627 sequenced mycobacteriophages and cluster designations.
- https://doi.org/10.7554/eLife.06416.025
-
Supplementary file 2
Full list of group author details.
- https://doi.org/10.7554/eLife.06416.026
Download links
A two-part list of links to download the article, or parts of the article, in various formats.
Downloads (link to download the article as PDF)
Open citations (links to open the citations from this article in various online reference manager services)
Cite this article (links to download the citations from this article in formats compatible with various reference manager tools)
Whole genome comparison of a large collection of mycobacteriophages reveals a continuum of phage genetic diversity
eLife 4:e06416.
https://doi.org/10.7554/eLife.06416


