Age-dependent electroencephalogram (EEG) patterns during sevoflurane general anesthesia in infants
- Boston Children's Hospital, United States
- Massachusetts Institute of Technology, United States
- Massachusetts General Hospital, United States
Figures
Figure 1

Experiment design.
(A) Experiment timeline: schematic time-course of end-tidal sevoflurane concentration during the awake phase, induction, MOSSA (Maintenance of Surgical State of Anesthesia), and emergence phases of general anesthesia. Electroencephalogram (EEG) data from individual recording electrodes were analyzed post hoc for the awake brain state prior to anesthesia (shown in green), and two phases of general anesthesia (i) MOSSA (shown in red), and (ii) emergence from general anesthesia (shown in blue). (B) EEG montage used (modified international 10/20 electrode placement system).
Figure 2

Study profile.
Parents of 51 infants were approached and 36 consented. Five EEG recordings were excluded from the final analysis because of technical failures (n = 4) or a clinical event (n = 1; local anesthetic toxicity prior to surgical incision). For MOSSA analysis, data are presented from 30 EEG recordings (0–3 months, n = 11; 4–6 months, n = 19); for awake analysis, 19 infants were included (0–3 months, n = 7; 4–6 months, n = 12); and for emergence from general anesthesia analysis, 24 infants were included (0–3 months, n = 8; 4–6 months, n = 16).
Figure 3
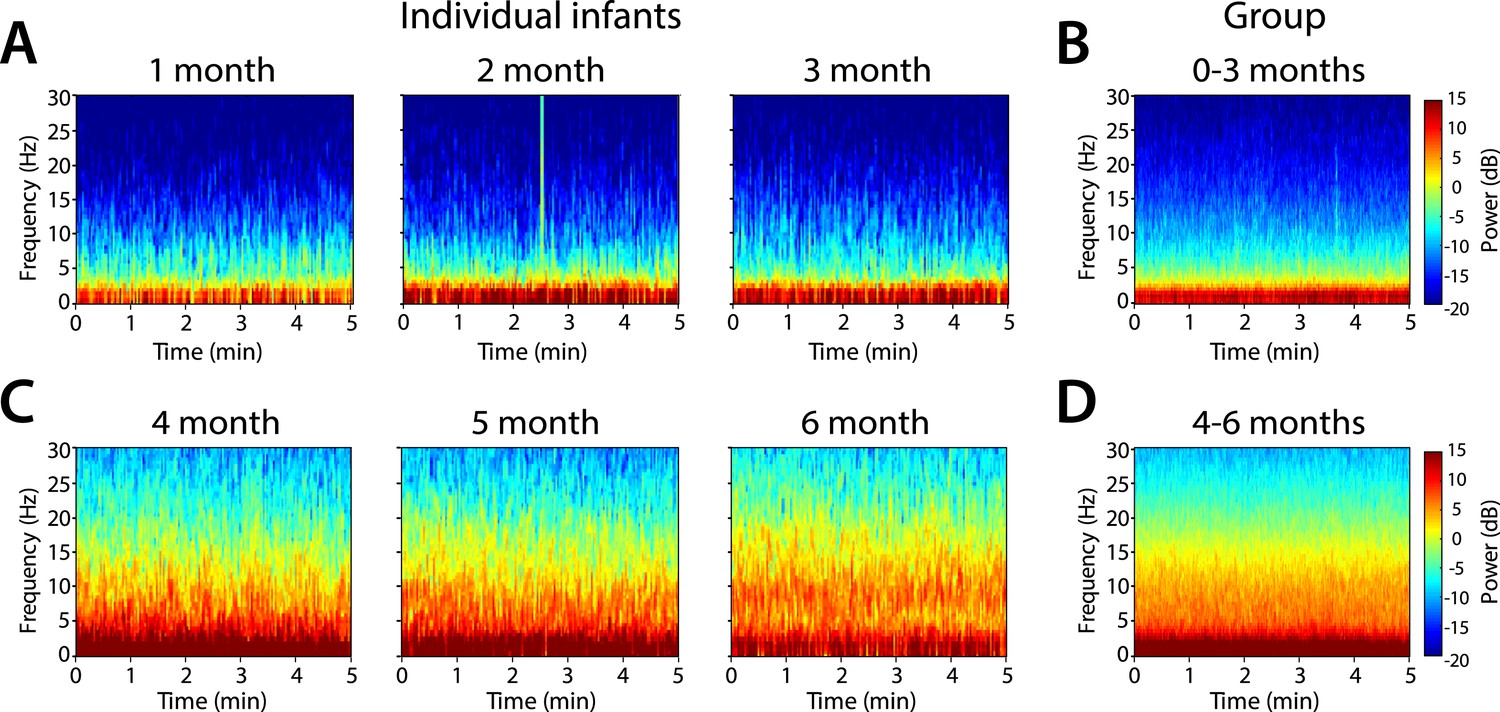
Frontal spectrograms during MOSSA.
Individual infant EEG spectral power for frequencies from 0 to 30 Hz (left hand axis) during a 5-min period of MOSSA. Frontal spectrograms for infants at 0–3 months of age are shown for (A) individual infants and (B) group-median average. Frontal spectrograms for infants at 4–6 months of age are shown for (C) individual infants and (D) group-median average. F7 used with nearest neighbor Laplacian referencing.
Figure 4 with 1 supplement
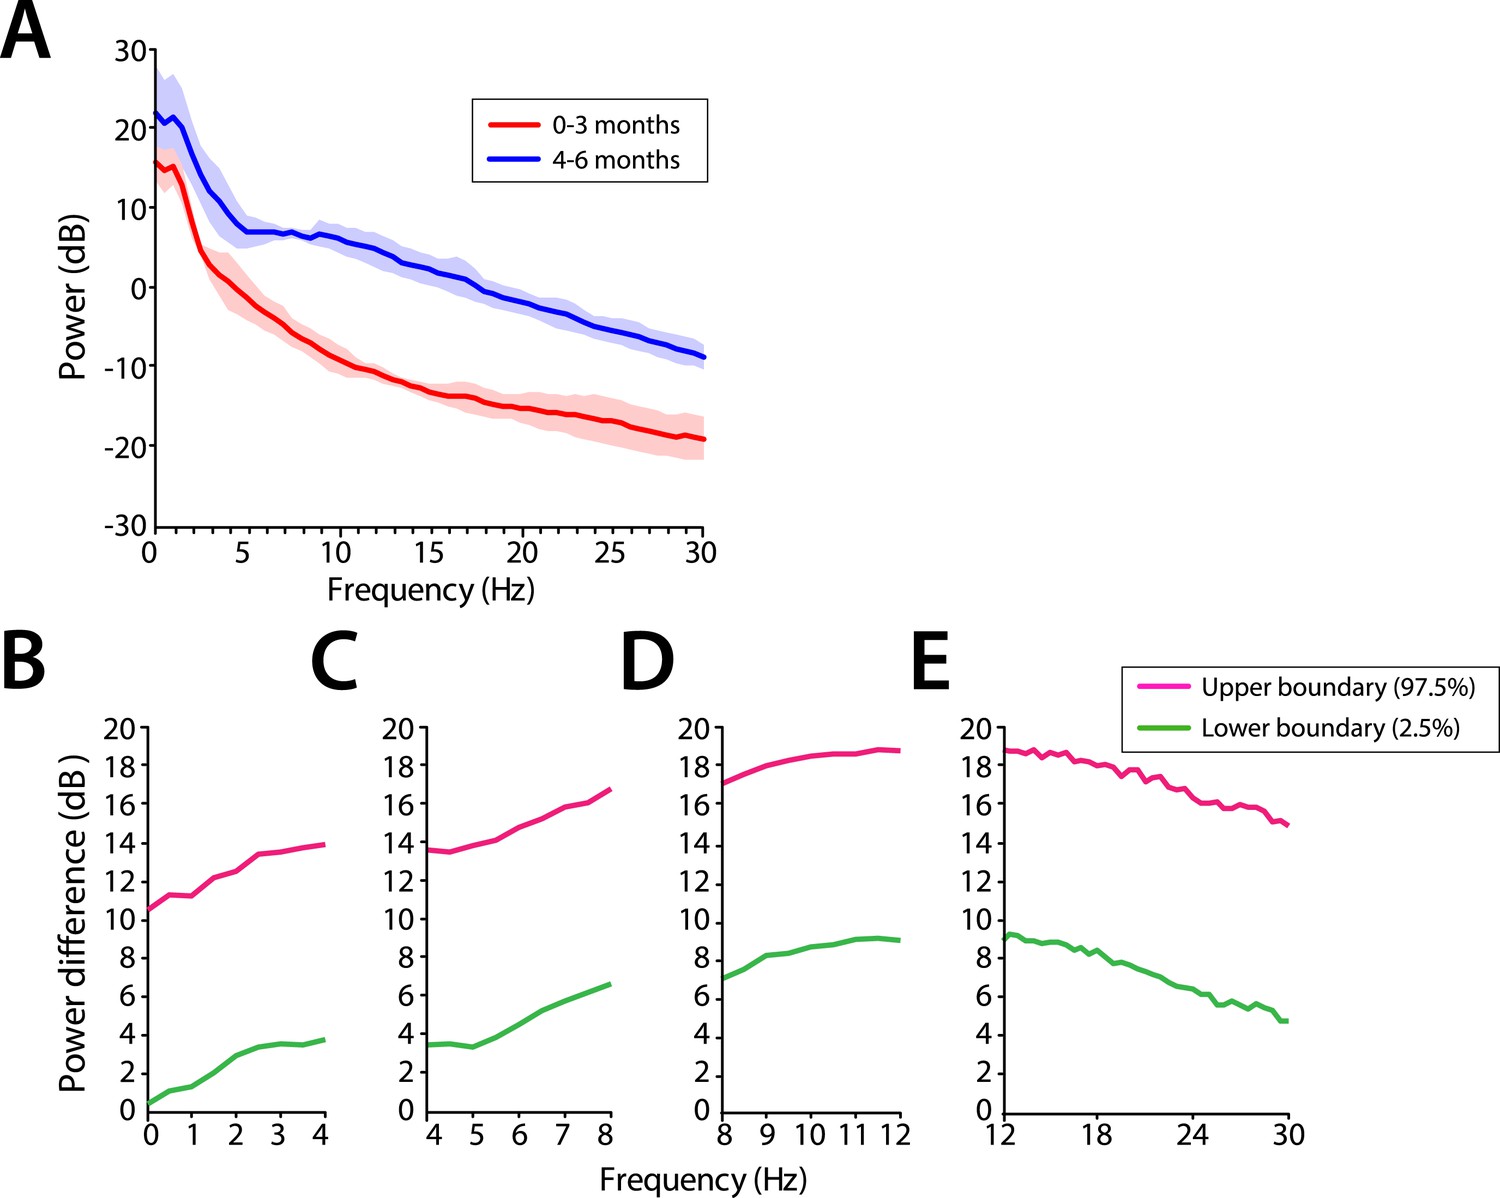
Frontal EEG power is greater in infants 4–6 months of age across all frequencies during MOSSA.
(A) Frontal group-median power spectra (solid line, median; shaded area, 25th–75th percentile) across the 0–30 Hz-frequency band showing increased power in infants 4–6 months of age across all frequencies. (B-E) Differences in frontal group-median power spectra presented with 95% CI from bootstrap analysis (pink line, 97.5th percentile; green line, 2.5th percentile) comparing infants at 0–3 month to 4–6 months of age. (B) Power difference in slow and delta frequency range, 0–4 Hz, (C) theta, 4–8 Hz, (D) alpha, 8–12 Hz, and (E) beta, 12–30 Hz. F7 electrode presented using nearest neighbor Laplacian referencing.
Figure 4—figure supplement 1
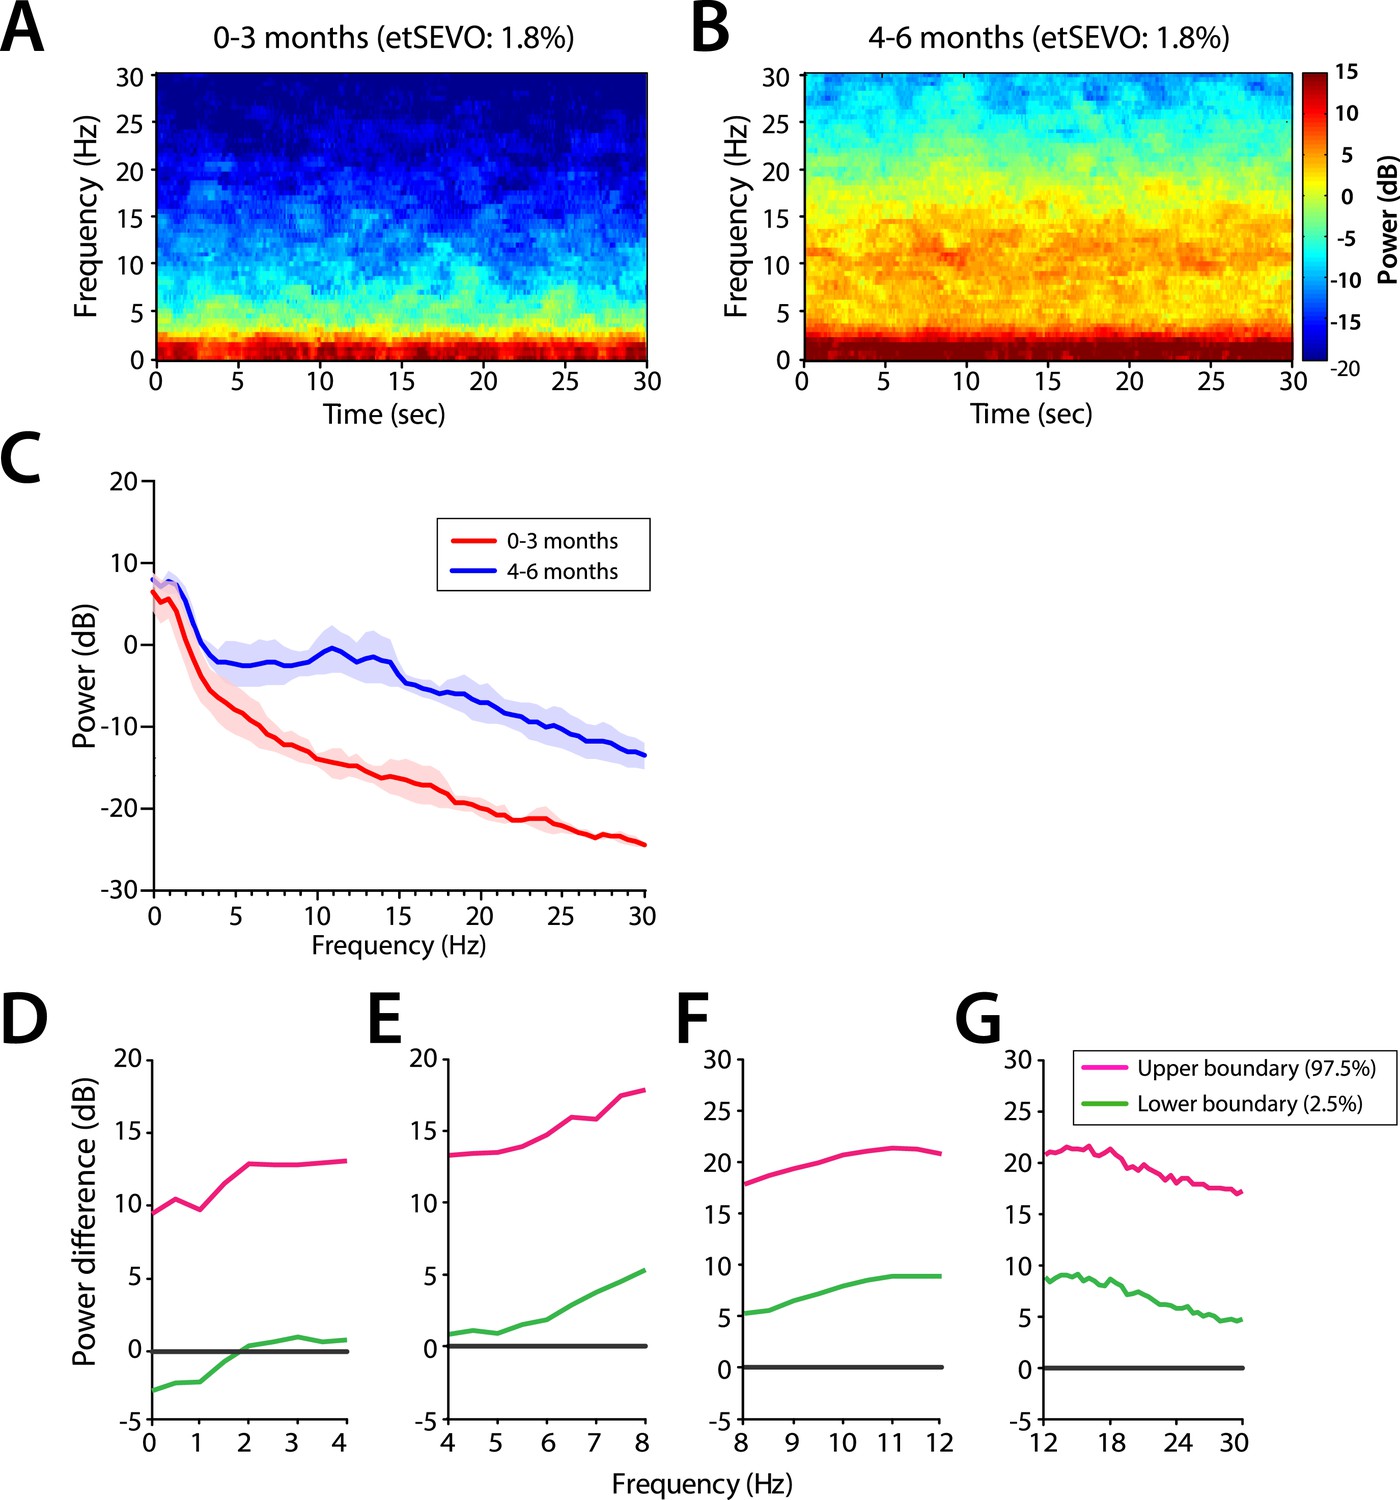
Frontal EEG spectral properties in infants anesthetized under a uniform end-tidal sevoflurance concentration (1.8%).
Group-averaged frontal power spectrograms in infants (A) 0–3 months of age, and (B) 4–6 months of age (C) Frontal group-median power spectra (solid line, median; shaded area, 25th–75th percentile) across 0–30 Hz frequencies. (D–G) Differences in group-averaged frontal power spectra presented with 95% CI from bootstrap analysis (pink line, 97.5th percentile; green line, 2.5th percentile) comparing infants at 0–3 months to infants at 4–6 months of age. F7 electrode presented using nearest neighbour Laplacian referencing. etSEVO: end-tidal sevoflurance concentration. Epoch size of 30 s is used.
Figure 5
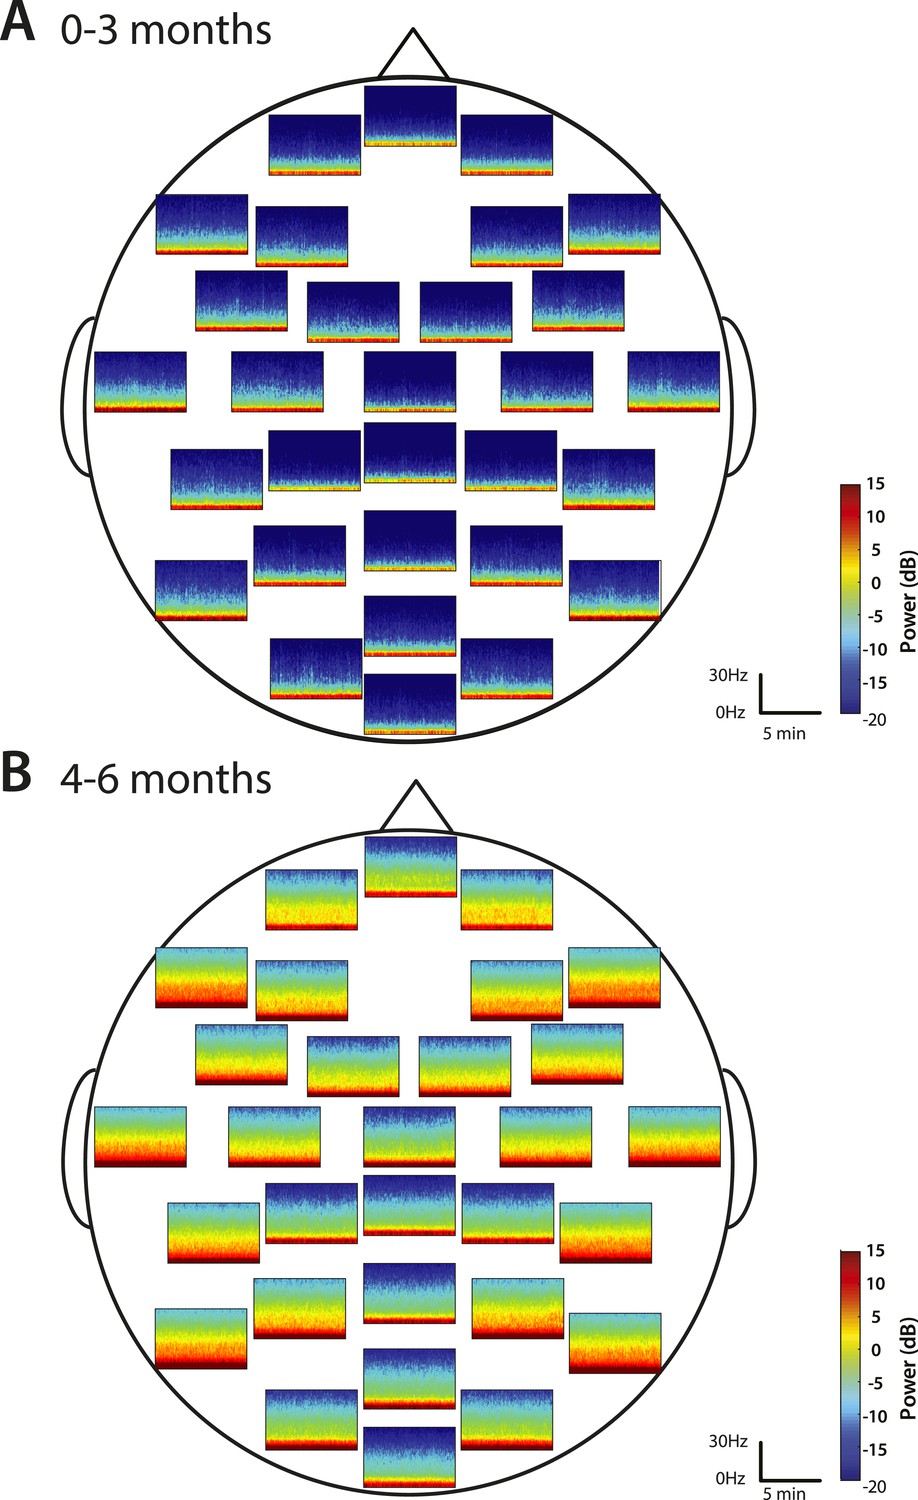
Spatial distribution of spectral power during MOSSA.
Group-median spectrograms at each recording electrode location across the scalp in infants at (A) 0–3 months (n = 11) and (B) 4–6 months (n = 19).
Figure 6
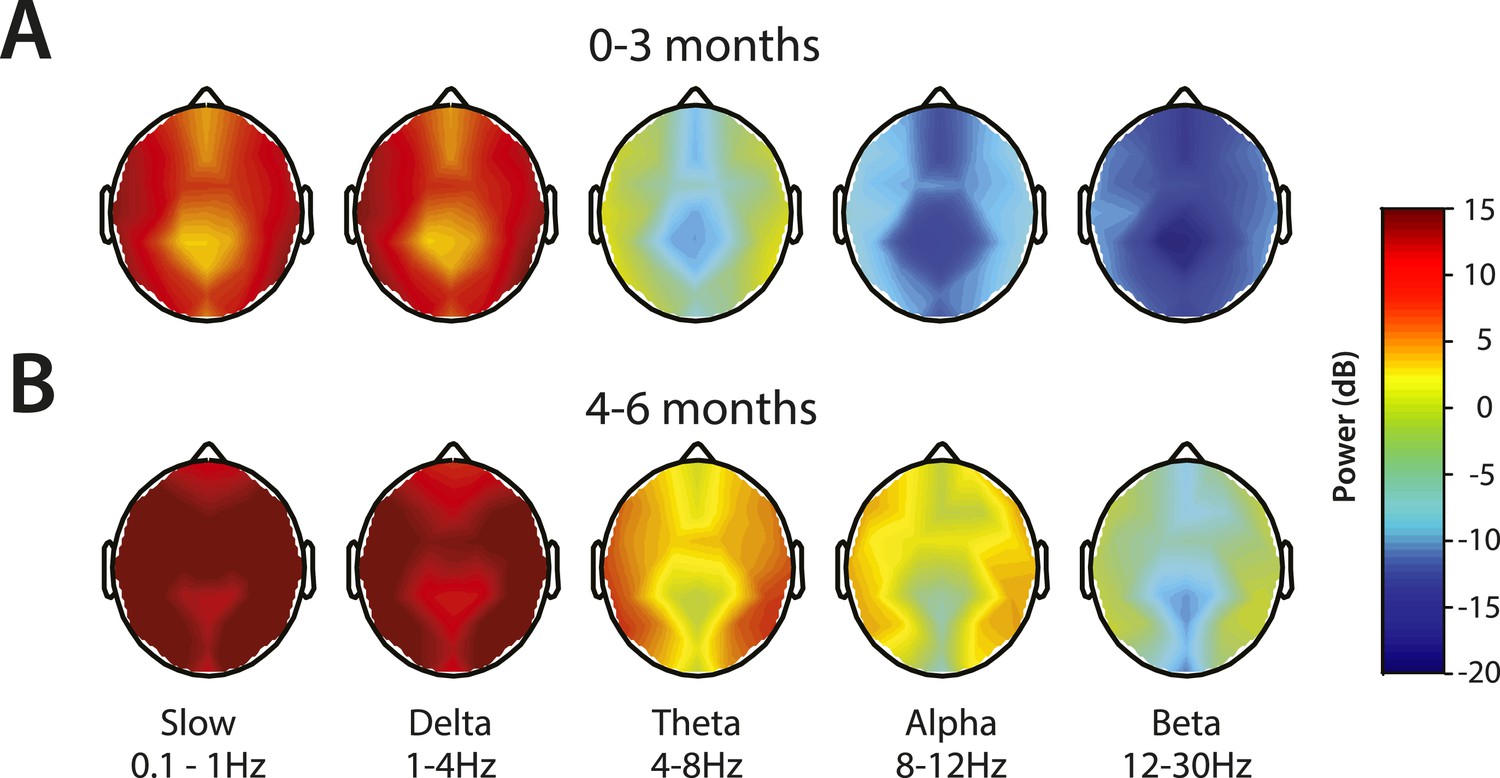
Topographic EEG maps of spectral power for distinct frequency bands during MOSSA.
Topographic EEG maps detailing group-averaged power for each EEG frequency band in infants aged (A) 0–3 months (n = 11) and (B) 4–6 months (n = 19). Slow-wave activity is distributed across the scalp in both postnatal age groups, while alpha activity is present to a greater degree in infants 4–6 months postnatal age. Legend for A and B is shown by the color bar.
Figure 7
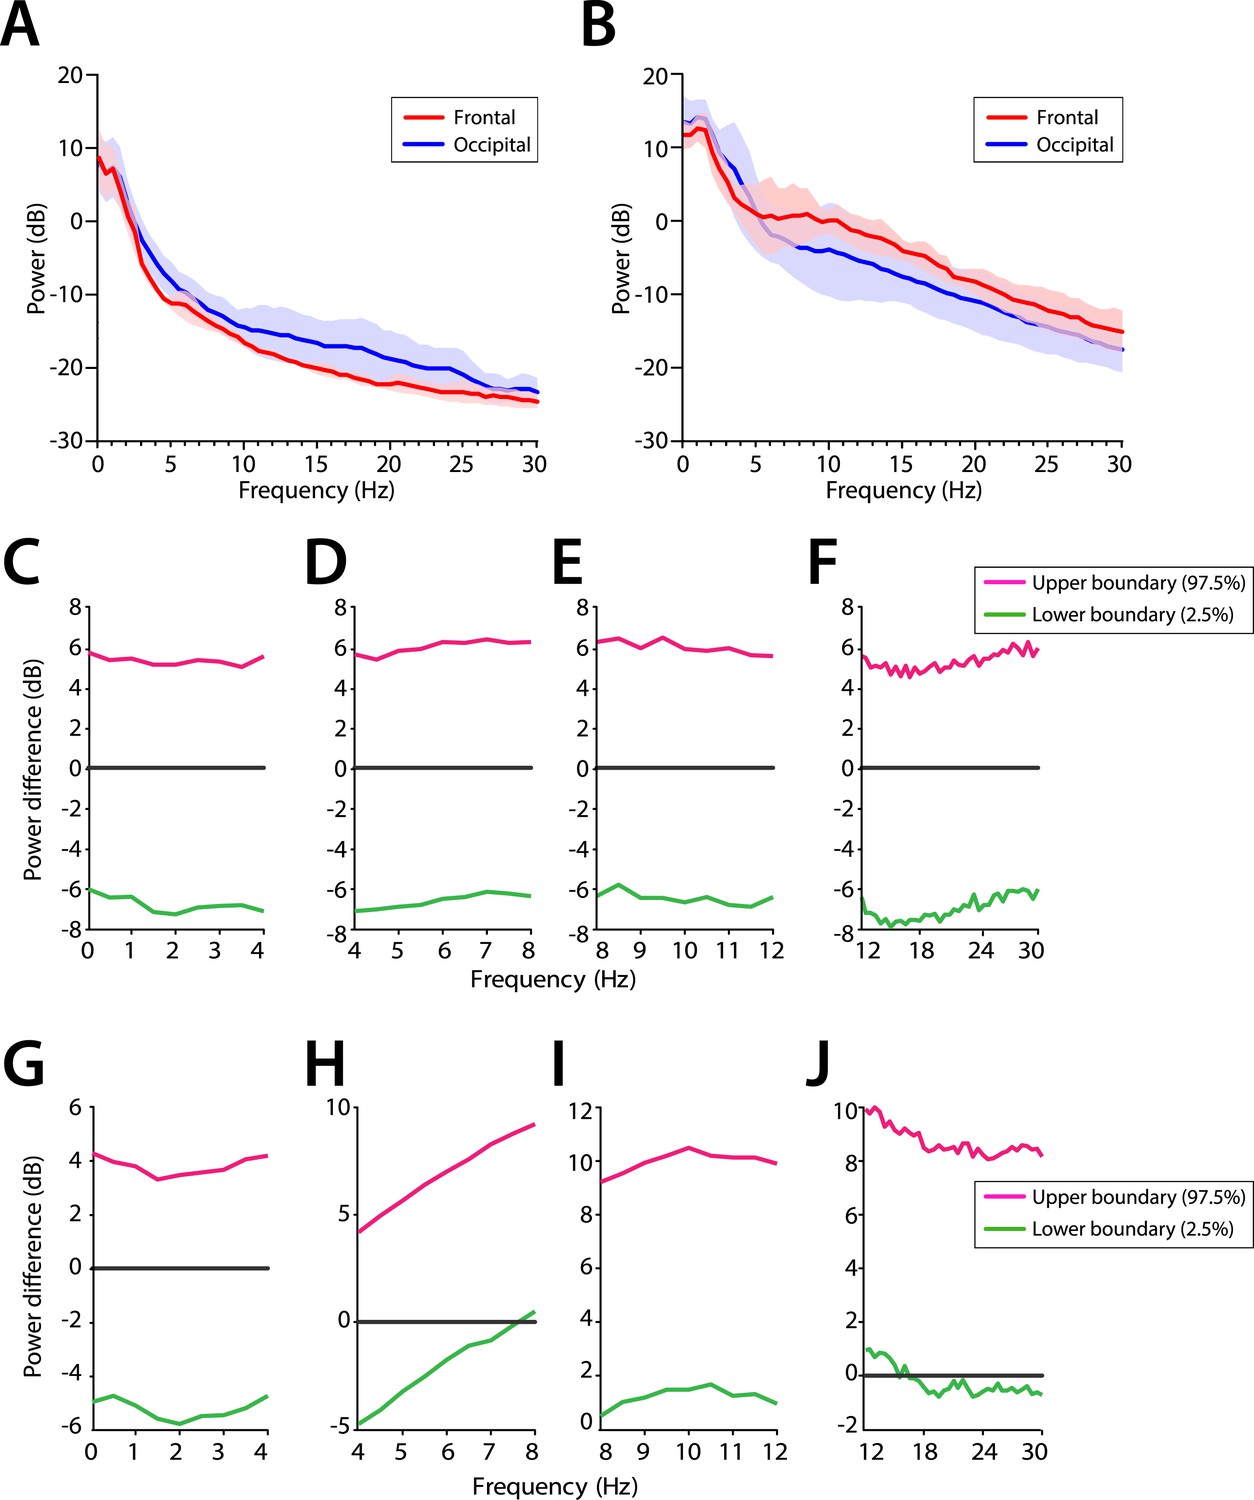
Frontal predominance of alpha power is low during MOSSA in infants 0–6 months of age.
Frontal group-median power spectra (solid line, median; shaded area, 25th–75th percentile) showing similar EEG power across all frequencies in frontal and occipital channels in infants aged (A) 0–3 months (n = 11) and (B) 4–6 months (n = 19). Differences in frontal group-median power spectra presented with 95% CI from bootstrap analysis (pink line, 97.5th percentile; green line, 2.5th percentile) between frontal and occipital channels during MOSSA in infants aged (C–F) 0–3 months and (G–J) 4–6 months. A small but significant increase in frontal alpha power compared to occipital alpha power begins to emerge at 4–6 months of age. FPz and Oz electrodes presented using nearest neighbor Laplacian referencing.
Figure 8
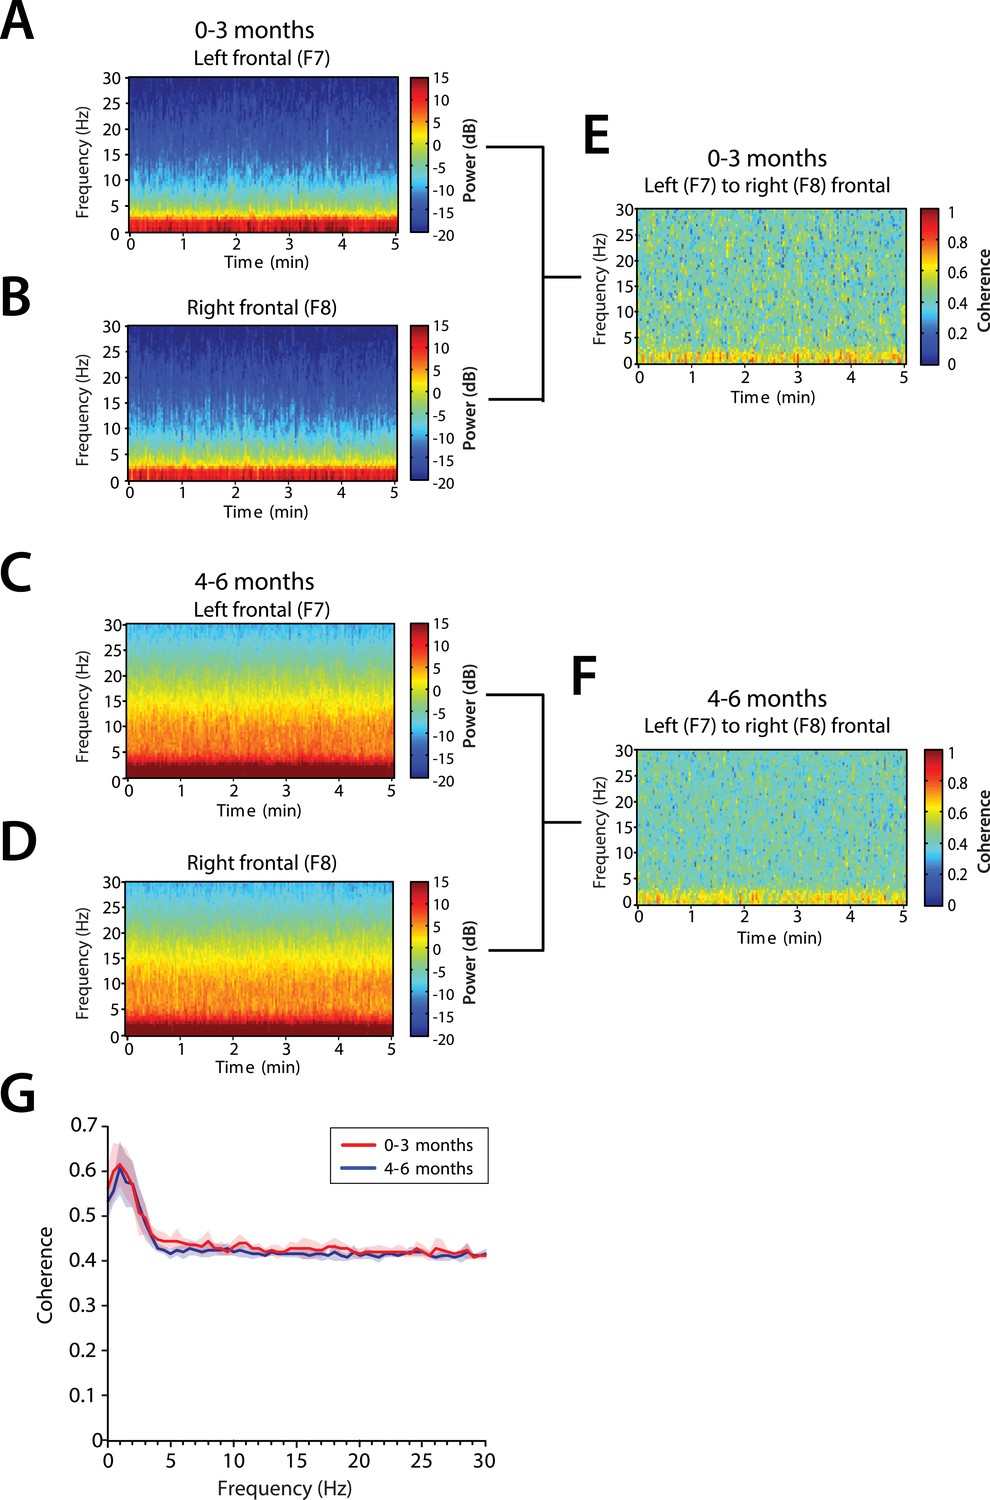
Frontal alpha coherence is absent during MOSSA in infants from 0 to 6 months postnatal age.
Group-averaged frontal spectrograms in infants aged 0–3 months at (A) Left—F7, and (B) Right—F8, and infants aged 4–6 months (C) F7, and (D) F8. Relative group-averaged frontal coherogram (F7–F8) for infants aged (E) 0–3 months and (F) 4–6 months age. (G) Frontal group-median coherence (solid line, median) showed similar coherence across 0.1–30 Hz frequency bands at all postnatal ages.
Figure 9
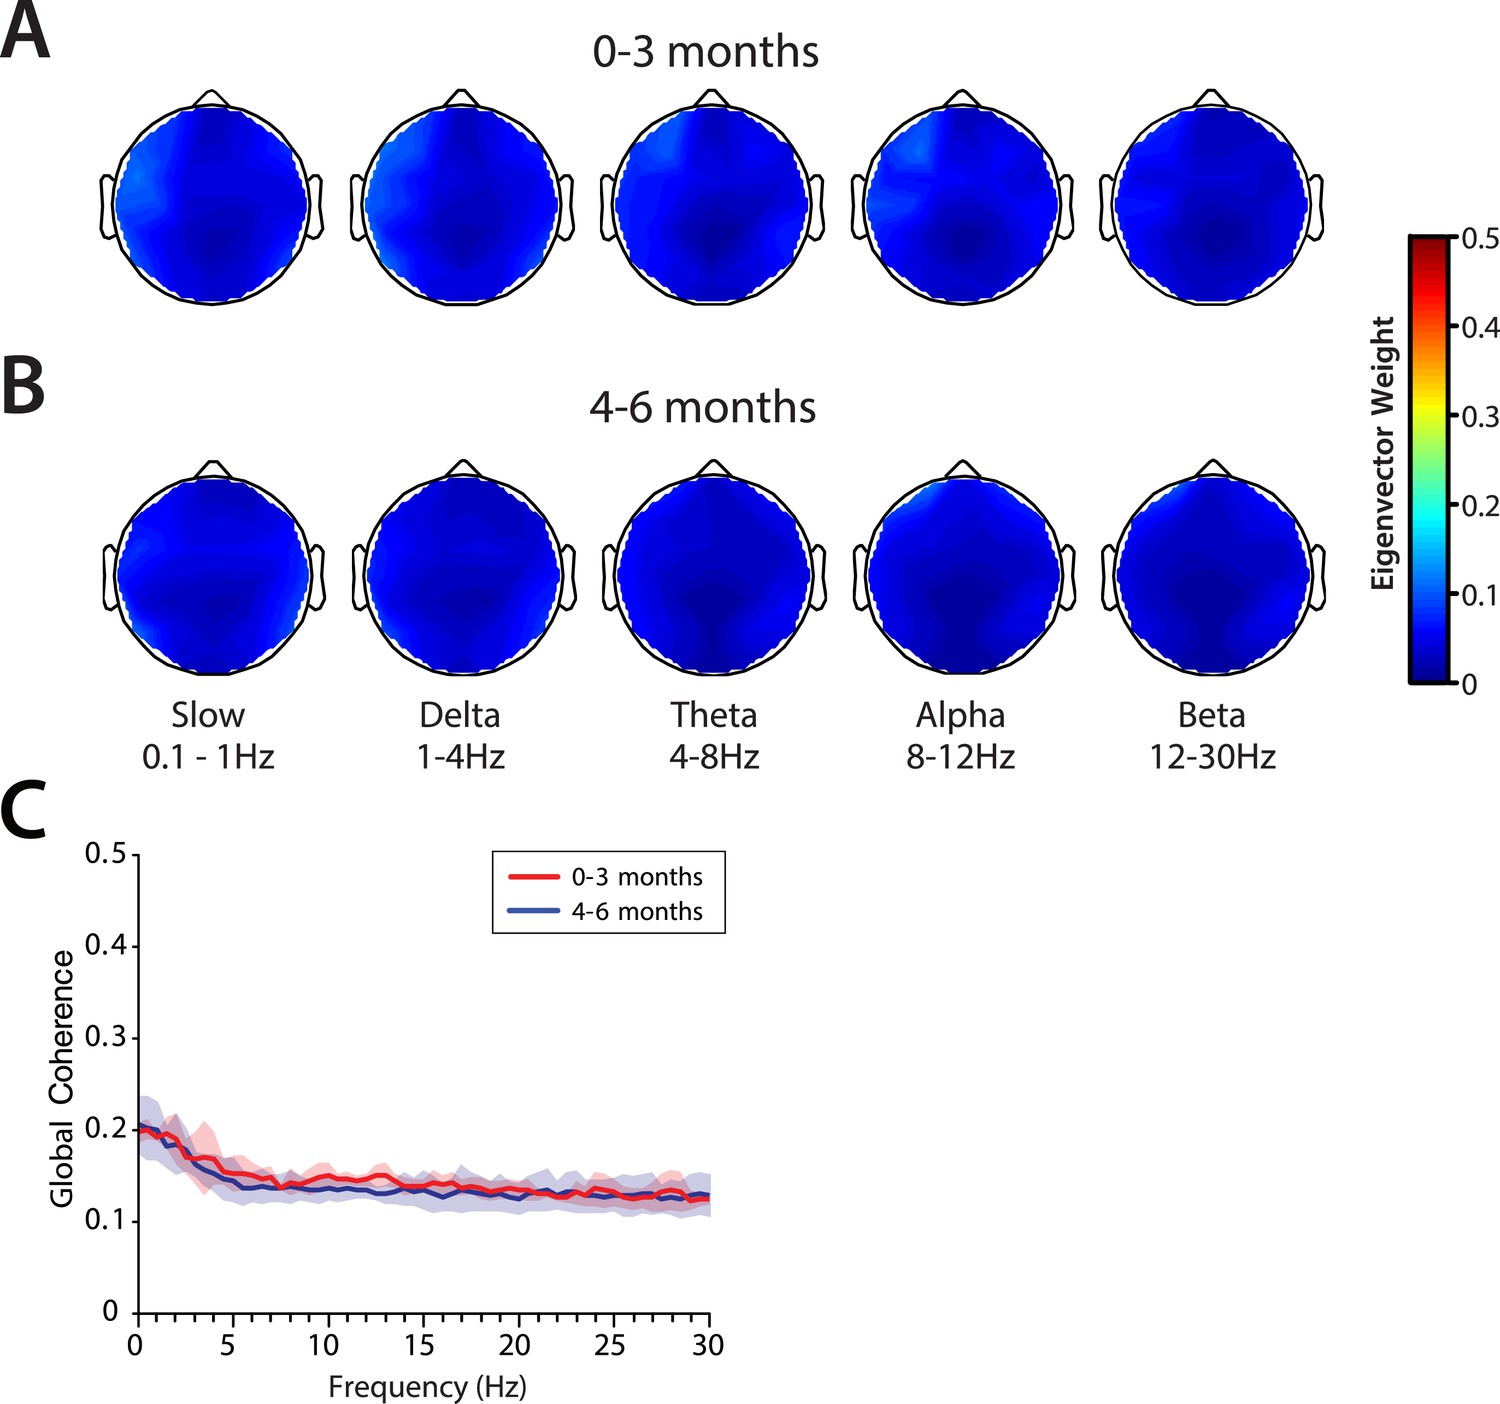
Global coherence is low across all frequencies during MOSSA in infants from 0 to 6 months of age.
Topographic EEG maps detailing group-averaged global coherence for each EEG frequency band in infants (A) 0–3 months (n = 11) and (B) 4–6 months (n = 19) of age. (C) Group-median global coherence spectra (solid line, median; shaded area, IQR) show similar low coherence across 0–30 Hz frequency bands at all ages during MOSSA.
Figure 10 with 1 supplement
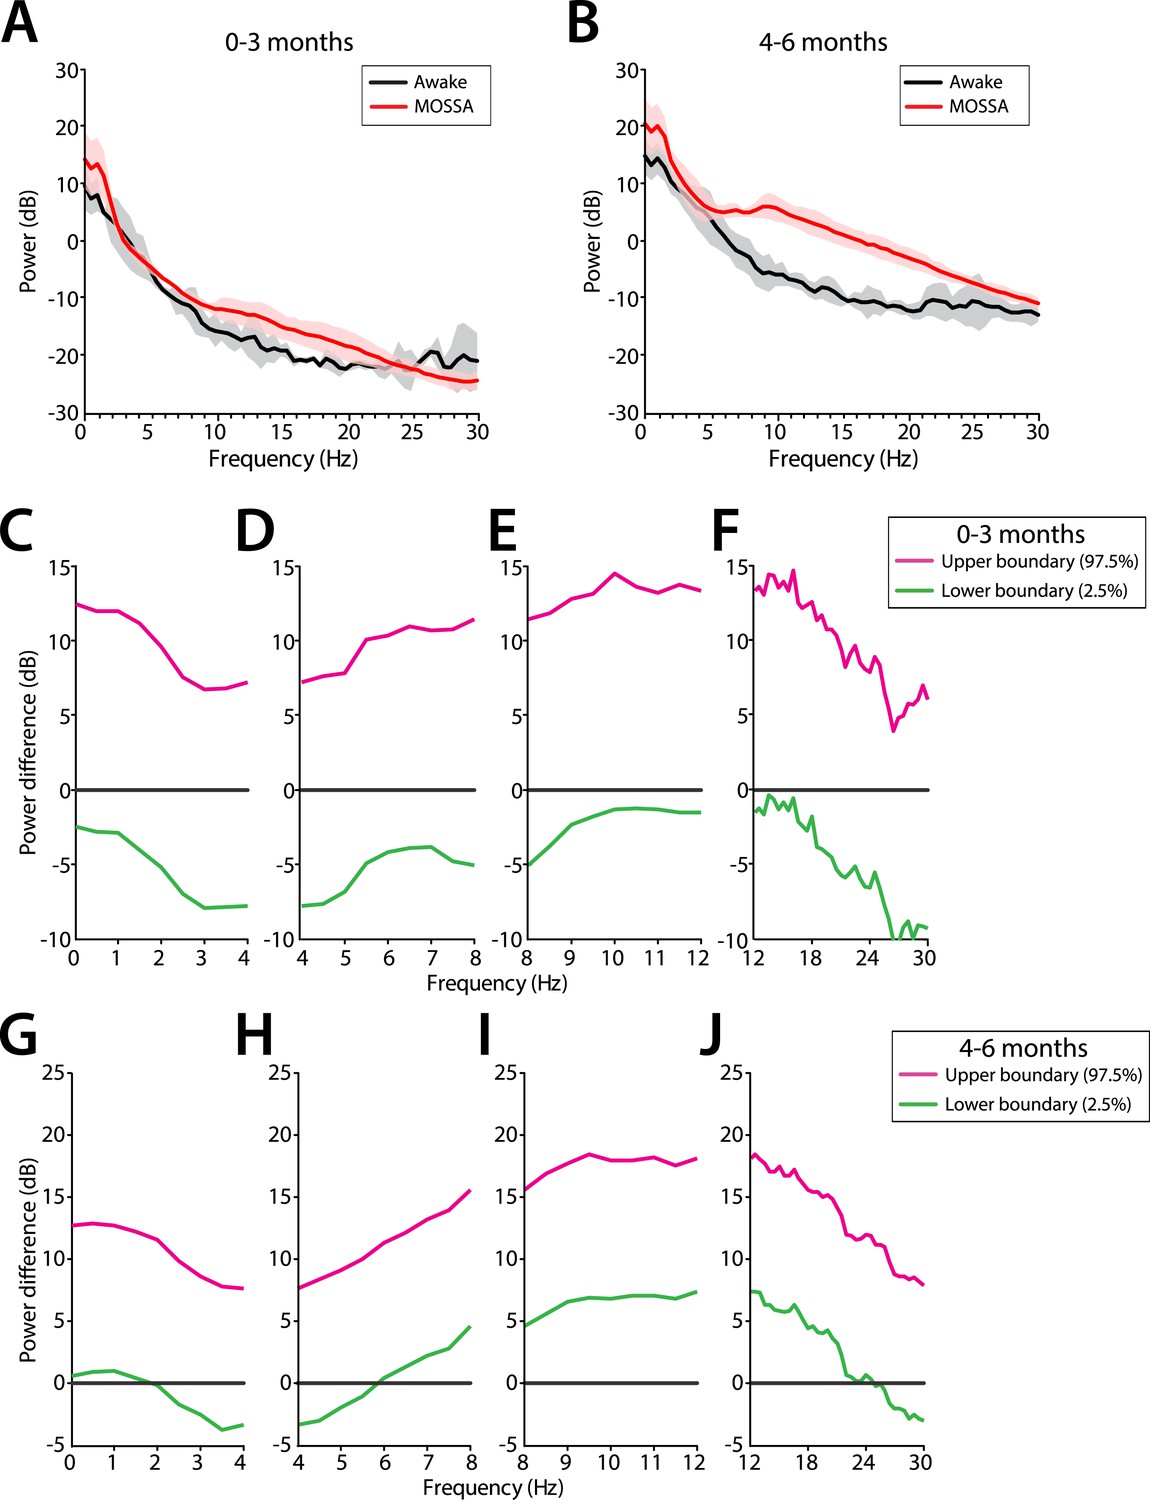
Frontal EEG power changes between the awake state and MOSSA.
(A) Group-averaged frontal power spectra (solid line, median; shaded area, 25th–75th percentile) show similar EEG power during the awake state (prior to anesthesia) and MOSSA in infants aged 0–3 months across all frequencies (n = 7). (B) Group-averaged frontal power spectra show increased theta, alpha, and gamma oscillations during MOSSA in infants 4–6 months of age (n = 12). Differences in group-averaged frontal power spectra presented with 95% CI from paired bootstrap analysis (pink line, 97.5th percentile; green line, 2.5th percentile) between Awake and MOSSA in infants (C–F) 0–3 months and (G–J) 4–6 months of age. F7 electrode presented using nearest neighbor Laplacian referencing. Epoch size of 11 s is used for awake and MOSSA states.
Figure 10—figure supplement 1
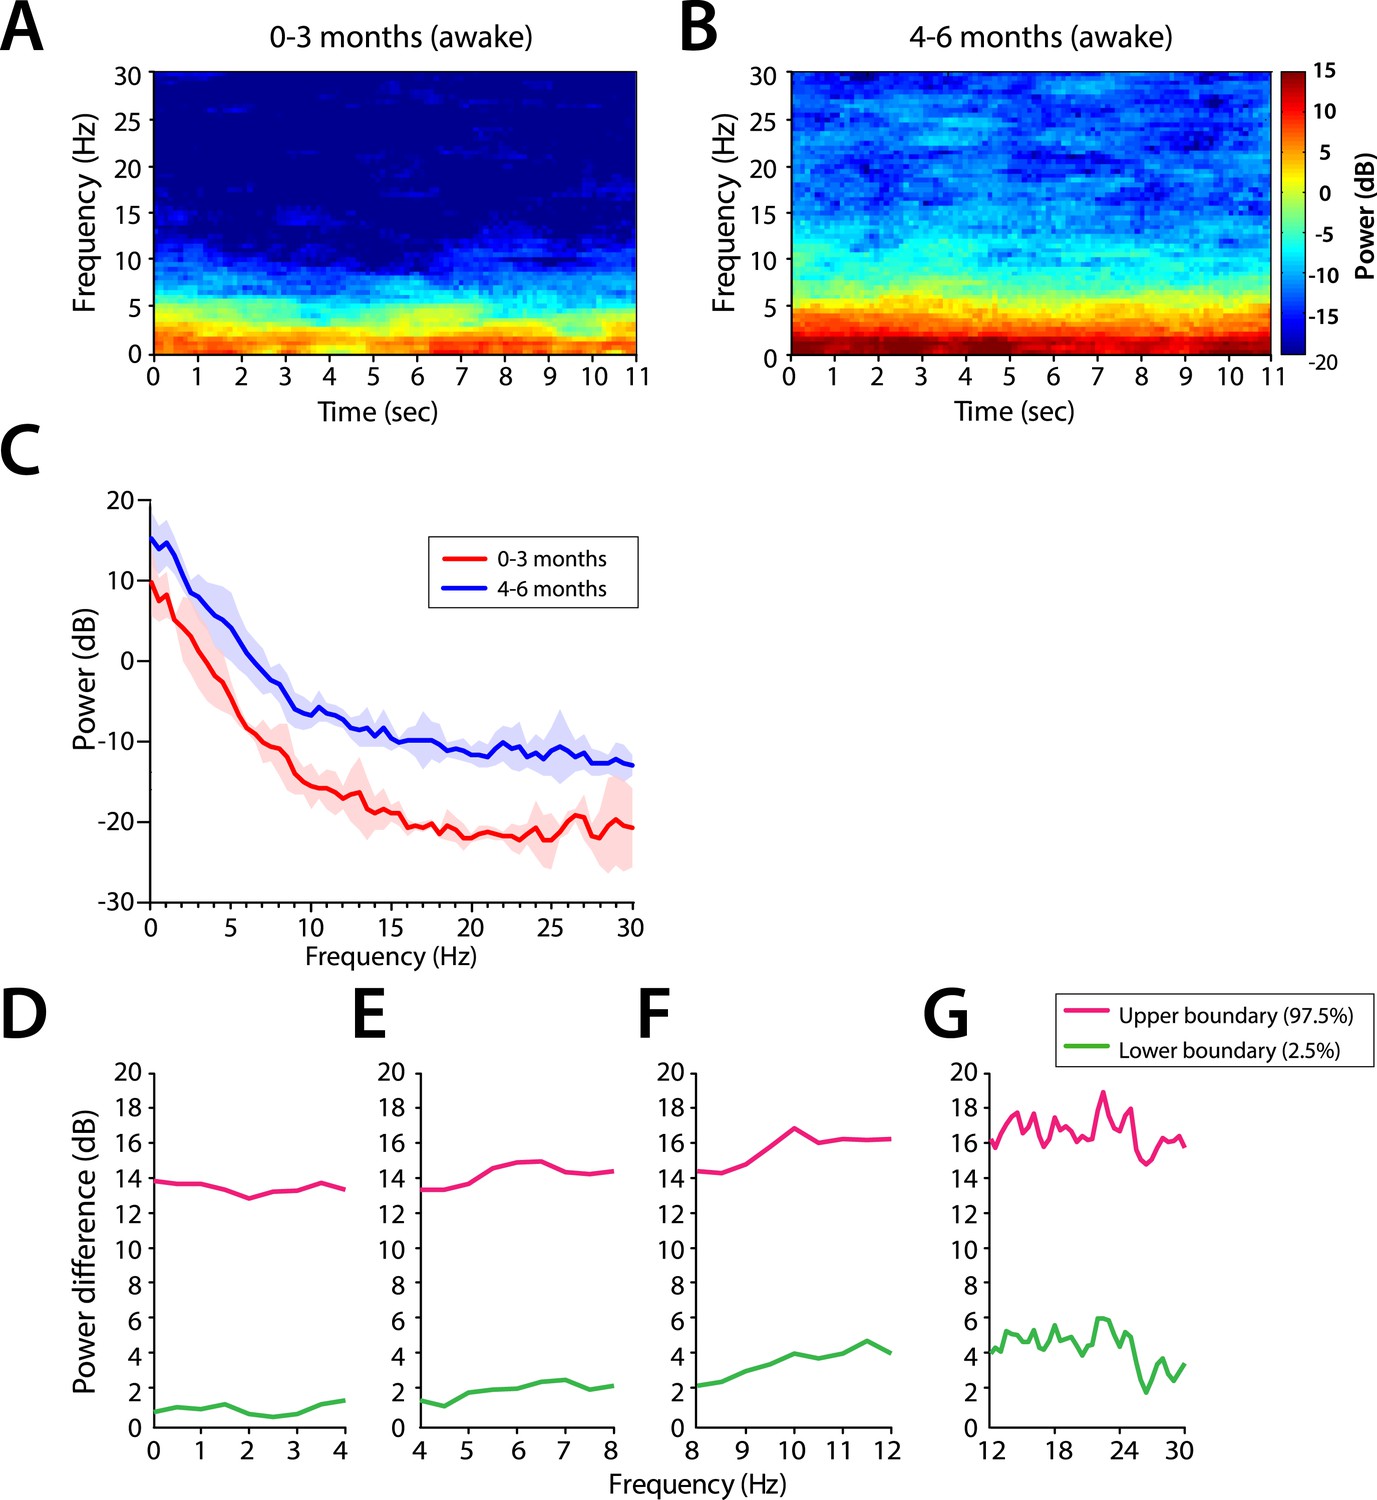
Frontal EEG spectral properties in awake infants.
Frontal group-median spectrograms in infants (A) 0–3 months, and (B) 4–6 months of age. (C) Frontal group-median power spectra (solid line, median; shaded area, 25th–75th percentile) across 0–30 Hz frequencies. (D–G) Differences in frontal group-median power spectra presented wtih 95% CI from bootstrap analysis (pink line, 97.5th percentile; green line, 2.5th percentile) comparing infants aged 0–3 months to infants 4–6 months of age. F7 electrode presented using nearest neighbor Laplacian referencing. Epoch size of 11 s is used.
Figure 11
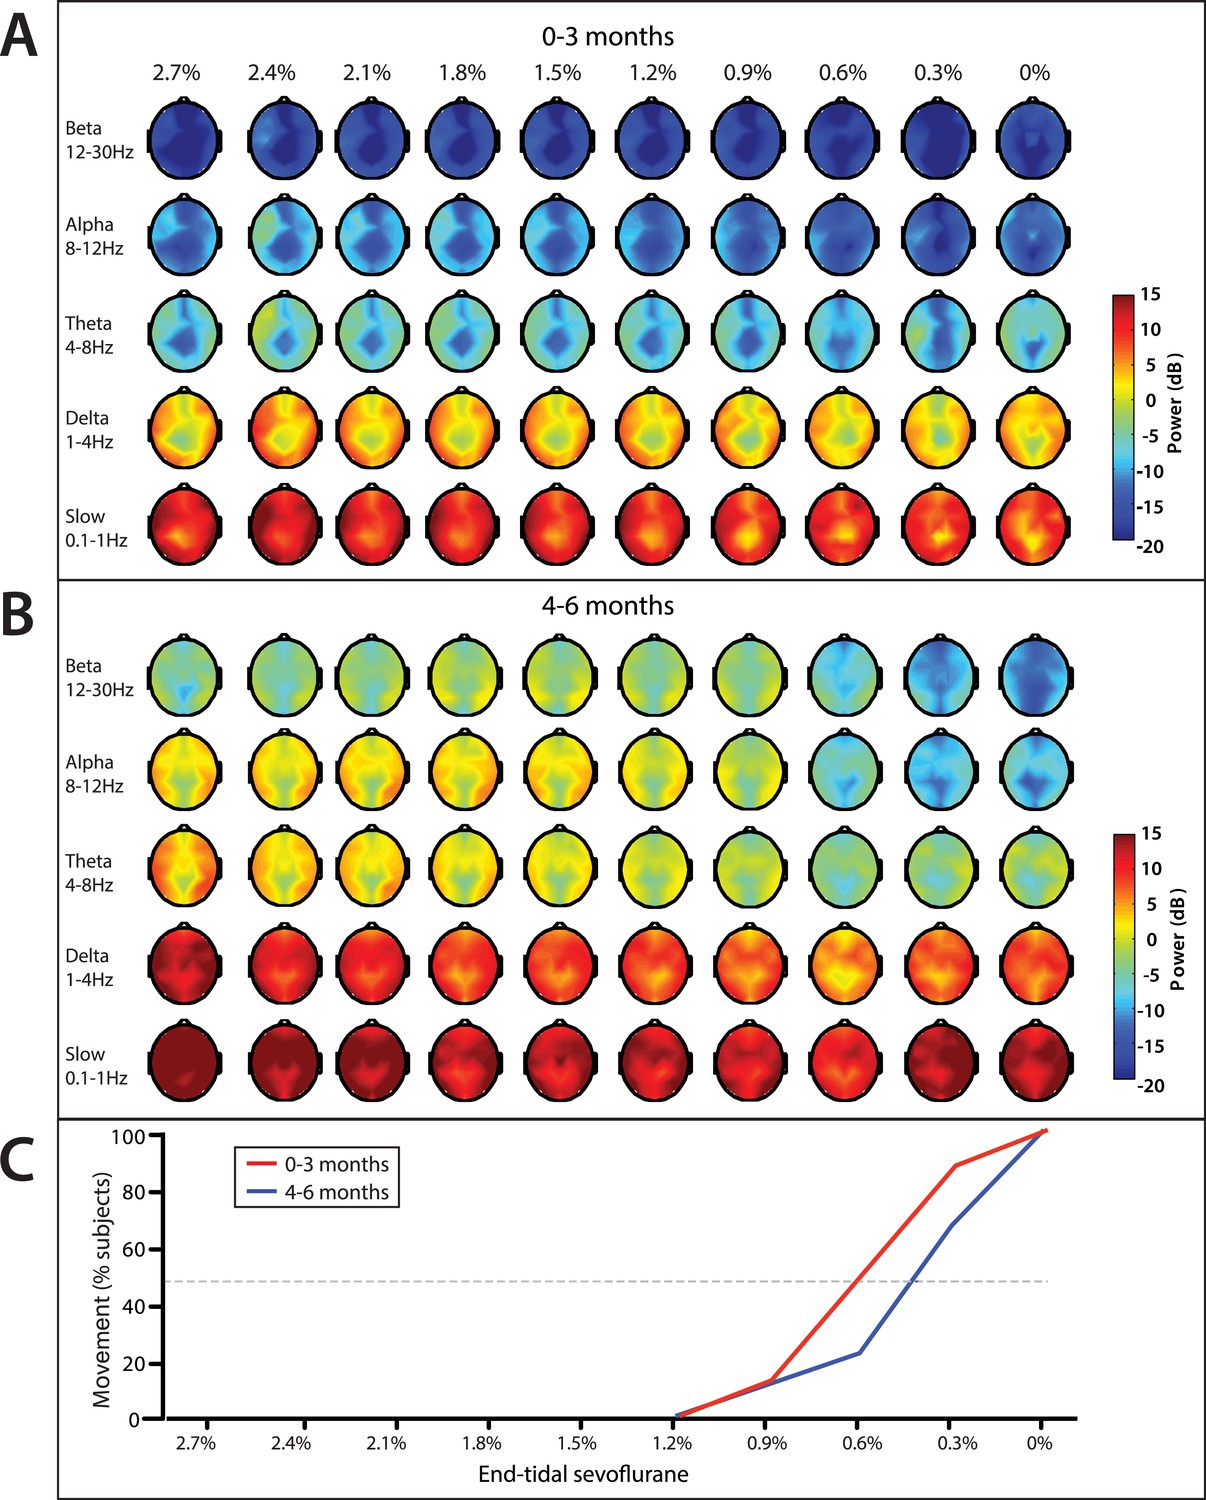
End-tidal sevoflurane concentration associated spatial EEG power and body movement during emergence from sevoflurane general anesthesia.
(A) End-tidal sevoflurane concentration increments from MOSSA to emergence from general anesthesia for infants 0–3 months (n = 8), and (B) 4–6 months of age (n = 16), and (C) the corresponding percentage of infants who displayed gross body movement MOSSA.
Figure 12
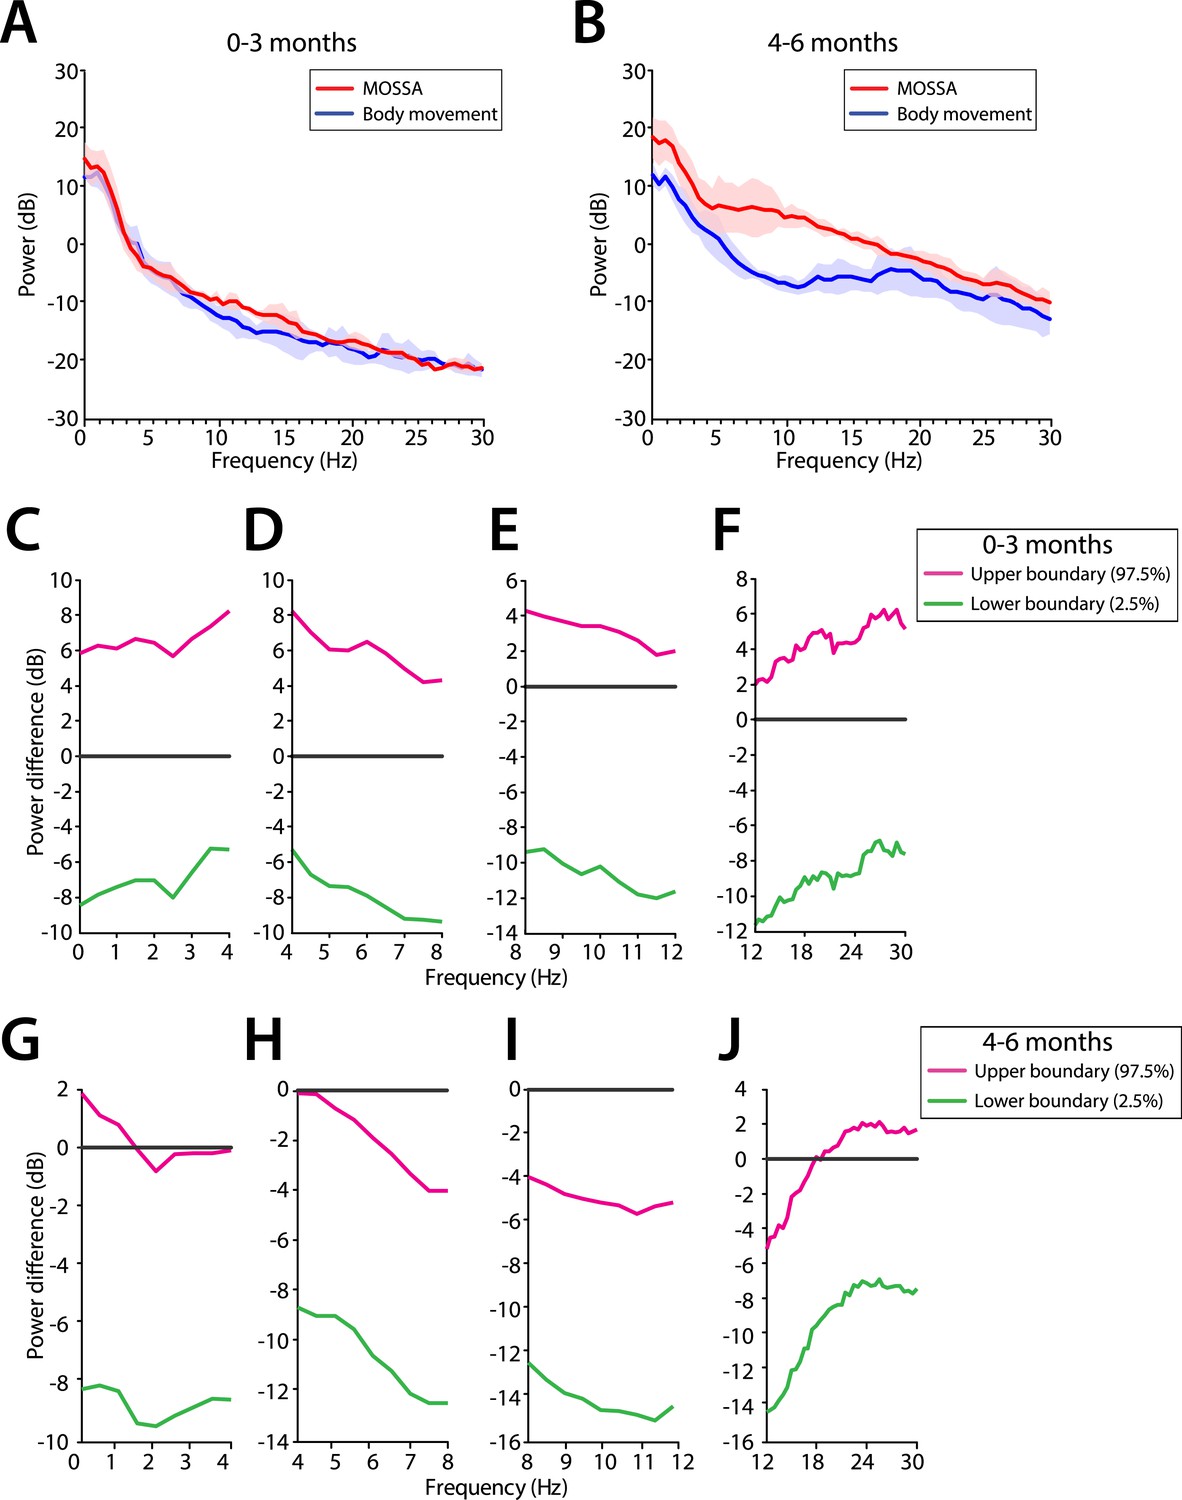
Frontal EEG power changes between MOSSA and body movement.
(A) Frontal group-median power spectra (solid line, median; shaded area, 25th–75th percentile) show similar EEG power during MOSSA and after first body movement in infants aged 0–3 months across all frequencies. (B) Frontal group-median power spectra show increased theta and alpha oscillations during MOSSA in infants aged 4–6 months. Differences in frontal group-median power spectra presented with 95% CI from bootstrap analysis (pink line, 97.5th percentile; green line, 2.5th percentile) between MOSSA and emergence after first body movement in infants (C–F) 0–3 months and (G–J) 4–6 months of age. F7 electrode presented using nearest neighbor Laplacian referencing.
Author response image 1
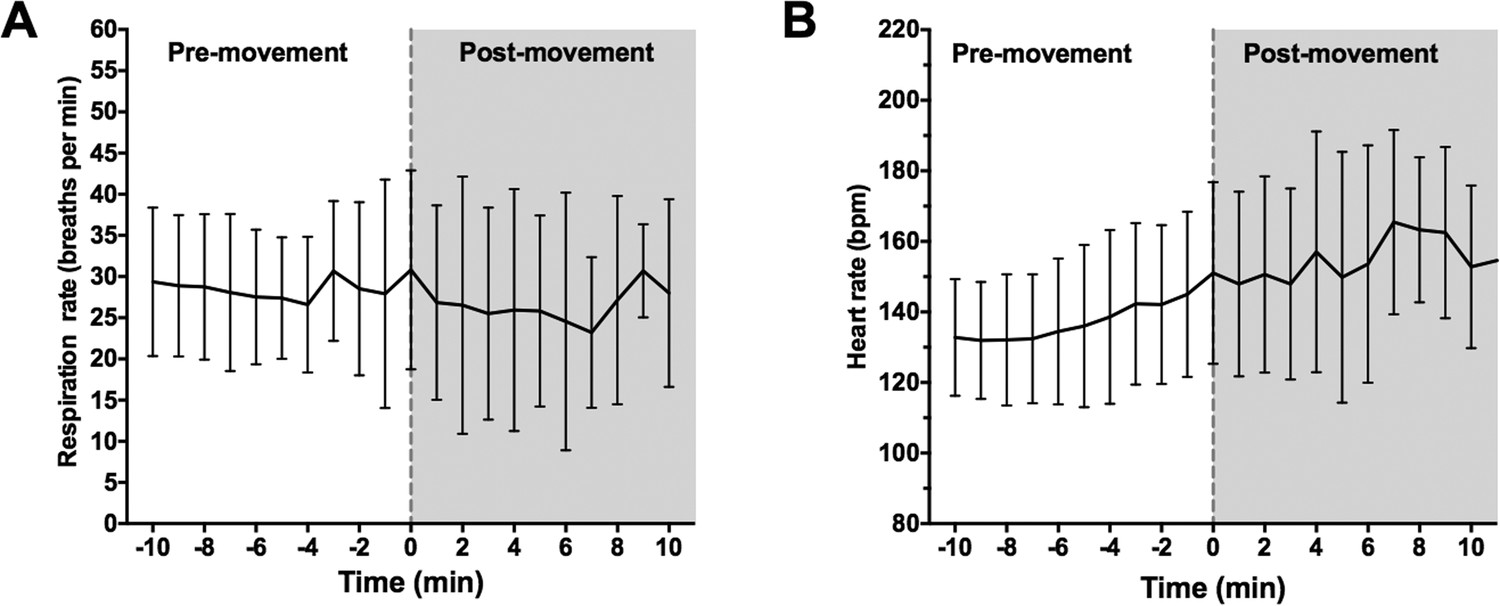
Onset of body movement is not associated with changes in respiration rate.
(A) Mean respiration rate (breaths per min) and (B) heart rate were calculated for all infants over a 20 minute period: 10-min prior to first visible body movement, and 10min after. Time 0 (grey dashed line) indicates where first body movement was observed. Data represented as mean (+/- SD).
Author response image 2
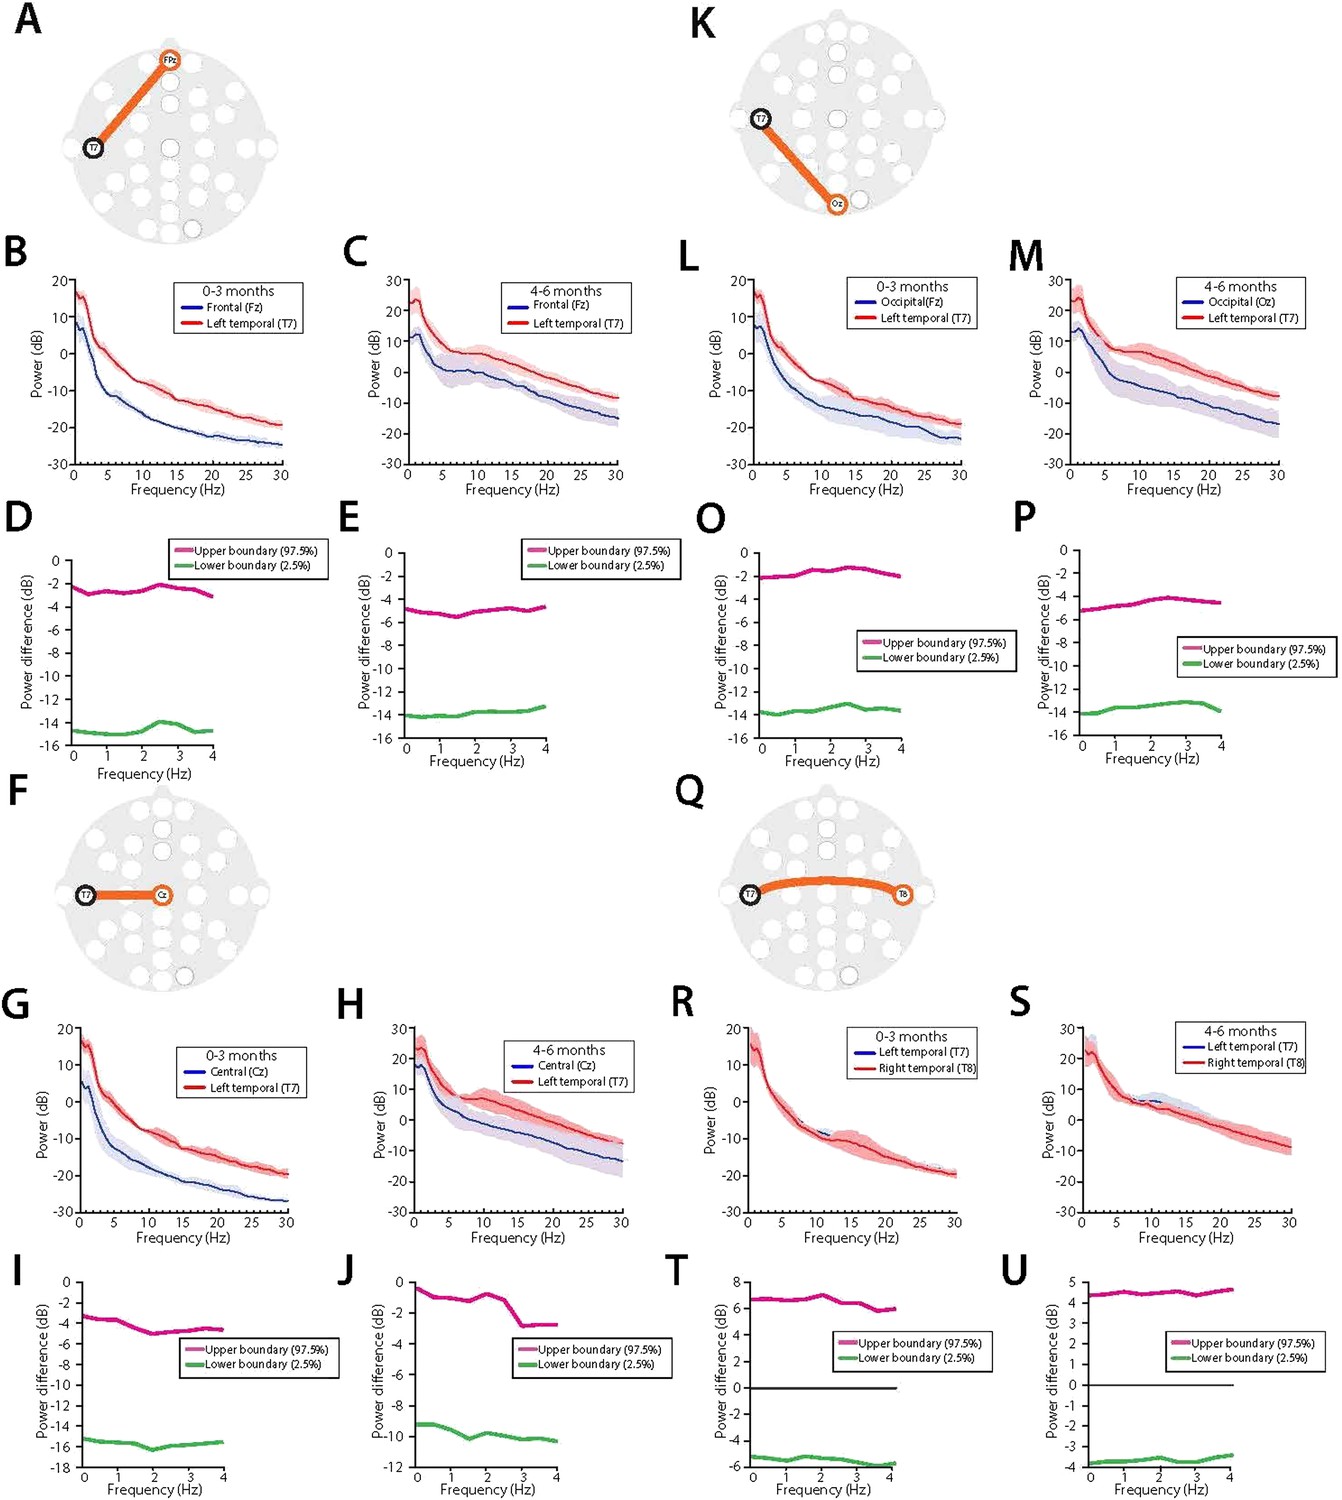
Midline EEG spectral power is lower compared to temporal regions during MOSSA in all infants.Temporal (T7) electrode comparisons are shown for (A-E) vs. frontal midline (FPz); (F-J ), vertex (Cz); (K-P), occipital midline (Oz); and (Q- U) lateral temporal area (T8). For each electrode pair, a schematic of electrode locations ( A, F, K, Q) are shown with the respective analysis of power spectra in infants aged 0-3 months ( B, G, L, R), and 4-6 months (C, H, M, S), and 95% CI, paired bootstrap analysis for infants 0-3 months (D, I, O, T), and 4-6 months of age (E, J, P, U).
Tables
Table 1
Infant demographics and clinical characteristics
| All infants (N = 30) | 0–3 M (n = 11) | 4–6 M (n = 19) | Difference between medians in each age group | p-value | |
|---|---|---|---|---|---|
| Demographics | |||||
| PMA at birth (weeks)* | 39.0 (CI: 37.6–39.0) | 37.0 (CI: 34.0–39.0) | 39.0 (CI: 39.0–39.0) | 2.0 | 0.02 |
| PNA at study (months)* | 5.5 (CI: 3.6–6.1) | 2.8 (CI: 0.5–3.5) | 6.1 (CI: 5.5–6.1) | 3.3 | – |
| Weight at study (kg)* | 6.8 (CI: 6.1–7.6) | 5.0 (CI: 4.1–6.3) | 7.6 (CI: 6.7–8.2) | – | – |
| Male [%, (n)]† | 83.3 (25) | 72.7 (8) | 89.5 (17) | – | 0.24 |
| Procedure type | |||||
| General surgery [%, (n)] | 53.3 (16) | 90.9 (10) | 31.6 (6) | – | – |
| Urological [%, (n)] | 46.7 (14) | 9.1 (1) | 68.4 (13) | – | – |
| General anesthetic management | |||||
| Nitrous oxide for induction [%, (n)]* | 76.7 (23) | 54.5 (6) | 94.7 (17) | – | 0.07 |
| Propofol [%, (n)]* | 36.7 (11) | 27.3 (3) | 42.1 (8) | – | 0.47 |
| Propofol cumulative dose (mg/kg)* | 15 (CI: 10–20) | 10 (CI: 10-10) | 15 (CI: 10–20) | 5 | 0.08 |
| Median duration of anesthesia (min)* | 108.5 (CI: 87–145) | 118.0 (CI: 81–268) | 94.0 (CI: 76–160) | −24.0 | 0.18 |
| MOSSA epoch detail | |||||
| End-tidal sevoflurane (%)* | 2.6 (CI: 2.2–2.7) | 2.0 (CI: 0.8–2.6) | 2.6 (CI: 2.4–3.1) | 0.7 | 0.002 |
-
Data given as median with 95% Confidence Interval (CI) Limit, unless otherwise stated. All infants included in MOSSA analysis. Six infants were excluded from the emergence analysis due to anesthetic management or technical reasons (Figure 2); 3 infants aged 0–3 months and 3 infants aged 4–6 months. 95% CI limit of median.
-
MOSSA, Maintenance Of a Surgical State of Anesthesia.
-
*
Mann–Whitney U-test.
-
†
Fisher's exact test.
-
p < 0.05 considered statistically significant. Supplementary file 1 provides characteristics for individual infants included in the analysis.
Author response table 1
Factors that challenge use of non-behavioral measures during emergence
Influencing factors | Reason | Relation to our study |
Amount of painful stimulation from surgery affecting respiration & heart rate change | Variability in degree of suppression from nociceptive afferent drive by: • Local or regional anesthesia (e.g. field blocks for hernia repairs, or penile blocks for hypospadias repair) • Opioid dosing (dose and time course) | Supplementary File 1 provides details on the individual infant clinical data. |
Control of respiratory function | • Variability in tidal volume and rate delivered via mechanical ventilation during anesthesia according to individual anesthesiologist’s clinical decisions. Resulting pCO2 influences ventilatory drive during emergence. • Variability in anesthesiologist’s method to convert from controlled to assisted or spontaneous ventilation | Information unavailable. |
Pharmacologic effects on heart rate | Variability in use of neuromuscular blockade and need for reversal of neuromuscular blockade (case-dependent): • Reversal of NM blockade requires cholinesterase inhibitors (e.g. neostigmine), which produce bradycardia, and muscarinic antagonists (i.e. atropine or glycopyrrolate), which produce tachycardia. Heart rate during emergence can reflect individual differences in responses to these, along with other contributors to sympathetic and parasympathetic heart rate modulation. • Variability in timing of NM block reversal drug administration at the end of surgery, and effects on heart rate | Supplementary File 1 provides details on the individual infant clinical data. |
Author response table 2
Change in respiration rate and heart rate at the time of first body movement
Baseline (1min prior to first body movement) | Post-movement (1min after first body movement) | p-valueA | |
|---|---|---|---|
Respiration rate (breaths per min) | |||
All infants 0-3M 4-6M | 29.4 (13.4) 36.3 (14.7) 23.5 (11.5) | 30.8 (12.1) 39.1 (13.3) 25.7 (8.1) | 0.59 0.44 0.90 |
Heart rate (bpm) All infants 0-3M 4-6M | 145 (23) 156.4 (21.7) 139.6 (22.1) | 150 (25.3) 165 (22) 143.9 (24.4) | 0.0018 (**) 0.042 (*) 0.023 (*) |
Additional files
-
Supplementary file 1
Characteristics of individual infants. Subjects listed according to postnatal age. Data given for all infants included in the MOSSA analysis. M, months; MOSSA, Maintenance Of a Surgical State of Anesthesia; PNA, Postnatal Age; Wgt., weight. A–All infants were administered glycopyrrolate-neostigmine to reverse the neuromuscular blockade towards the end of surgery (except infants 1, 3, and 15). B–Infant was additionally administered clonidine for hypertension.
- https://doi.org/10.7554/eLife.06513.018
-
Source code 1
Custom-written MATLAB code (with simulated data) for computing global coherence.
- https://doi.org/10.7554/eLife.06513.019
-
Source code 2
Custom-written MATLAB code (with simulated data) for computing multitaper spectra and bootstrap CIs.
- https://doi.org/10.7554/eLife.06513.020
Download links
A two-part list of links to download the article, or parts of the article, in various formats.
Downloads (link to download the article as PDF)
Open citations (links to open the citations from this article in various online reference manager services)
Cite this article (links to download the citations from this article in formats compatible with various reference manager tools)
Age-dependent electroencephalogram (EEG) patterns during sevoflurane general anesthesia in infants
eLife 4:e06513.
https://doi.org/10.7554/eLife.06513


