Structure and functional properties of Norrin mimic Wnt for signalling with Frizzled4, Lrp5/6, and proteoglycan
- University of Oxford, United Kingdom
Figures
Figure 1
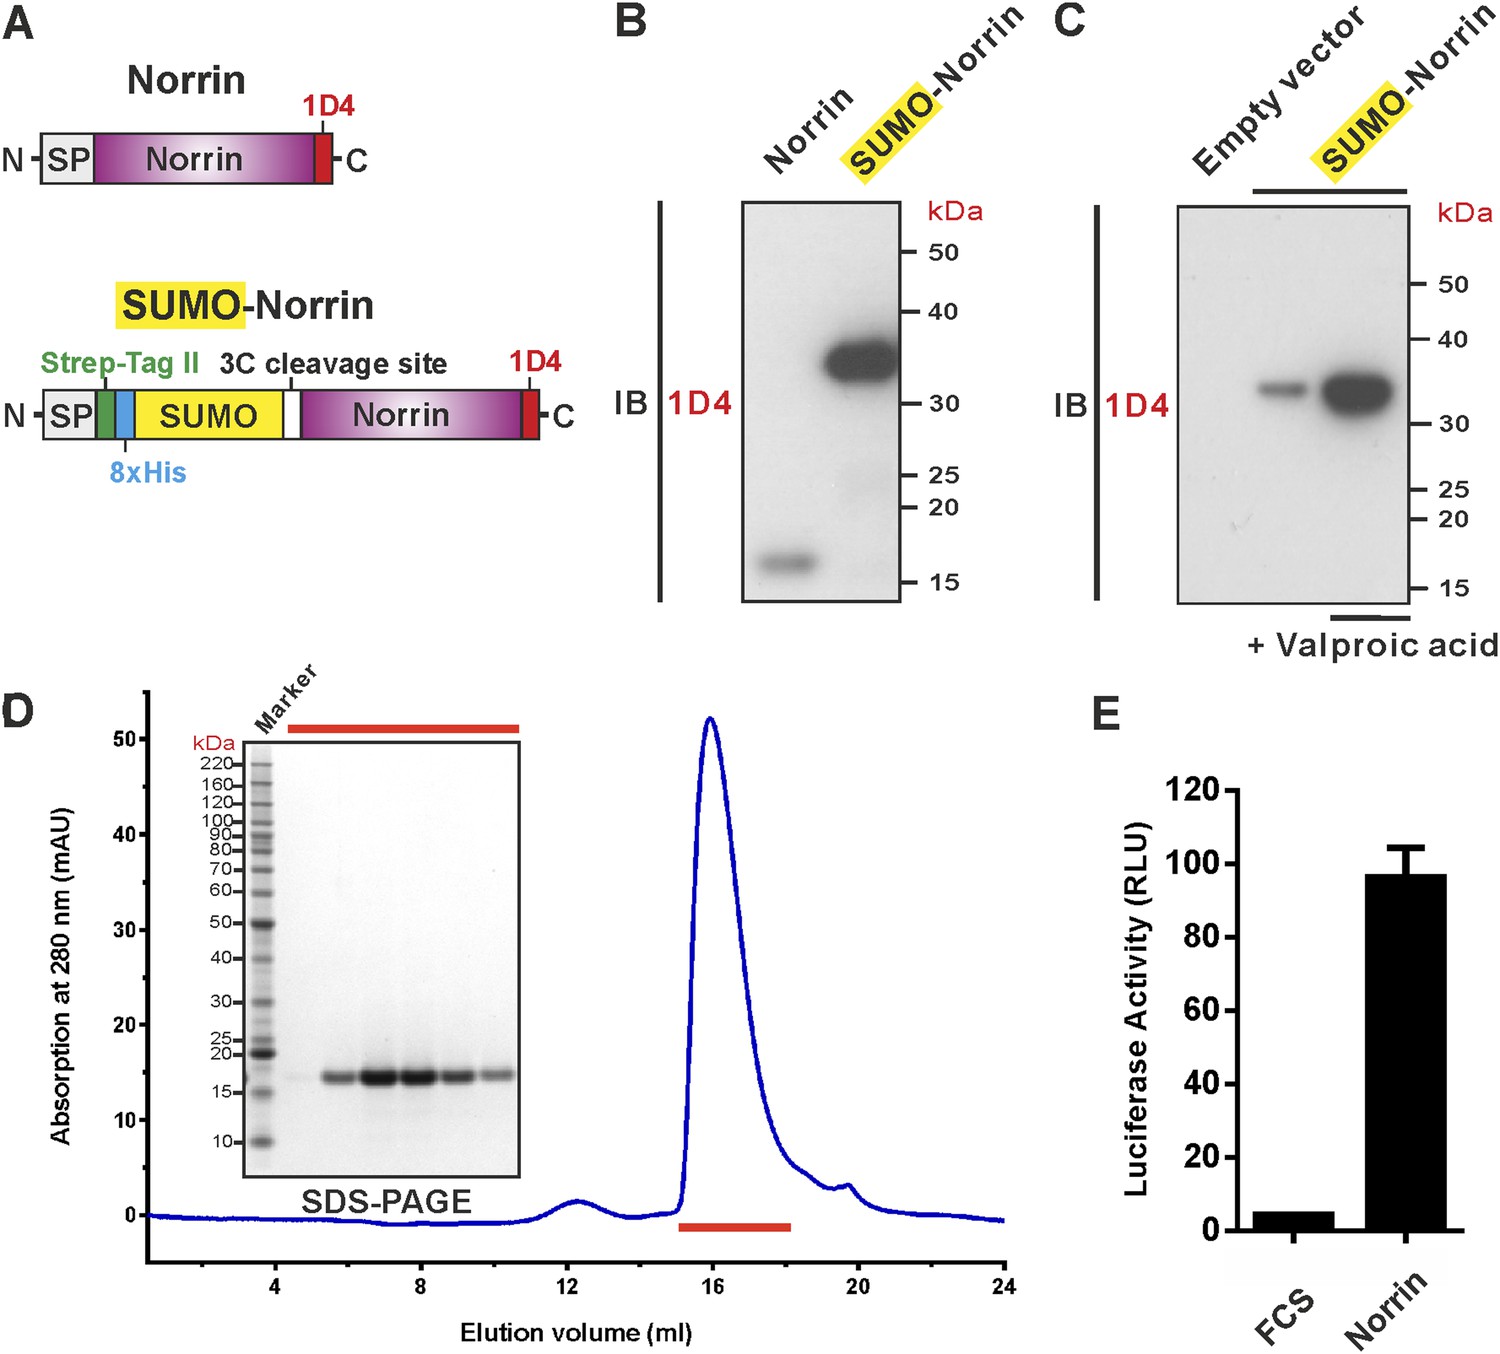
Expression and purification of biologically active recombinant Norrin.
(A) Schematic diagrams of the expression constructs including Norrin (a signal peptide, SP, followed by Norrin and Rho-1D4 tag at C-terminus) and SUMO-Norrin (a SP followed by a Strep-tag II, an octahistidine, SUMO, HRV 3C protease cleavage site, Norrin, and Rho-1D4 tag at C-terminus). (B and C) Conditioned media from transfected HEK293T cells were immunoblotted (IB) with the anti-Rho-1D4 antibody. (B) SUMO fusion improves Norrin secreted expression. (C) The expression level of SUMO tagged Norrin was further boosted for HEK-293T cells treated with valproic acid. (D) SEC elution profile and SDS-PAGE under reducing conditions with fractions analysed marked by red lines. (E) Purified recombinant untagged Norrin actives the canonical Wnt/β-catenin pathway in the luciferase reporter assay. RLU: relative light unit. Error bars indicate standard deviations (n = 3).
Figure 2 with 3 supplements
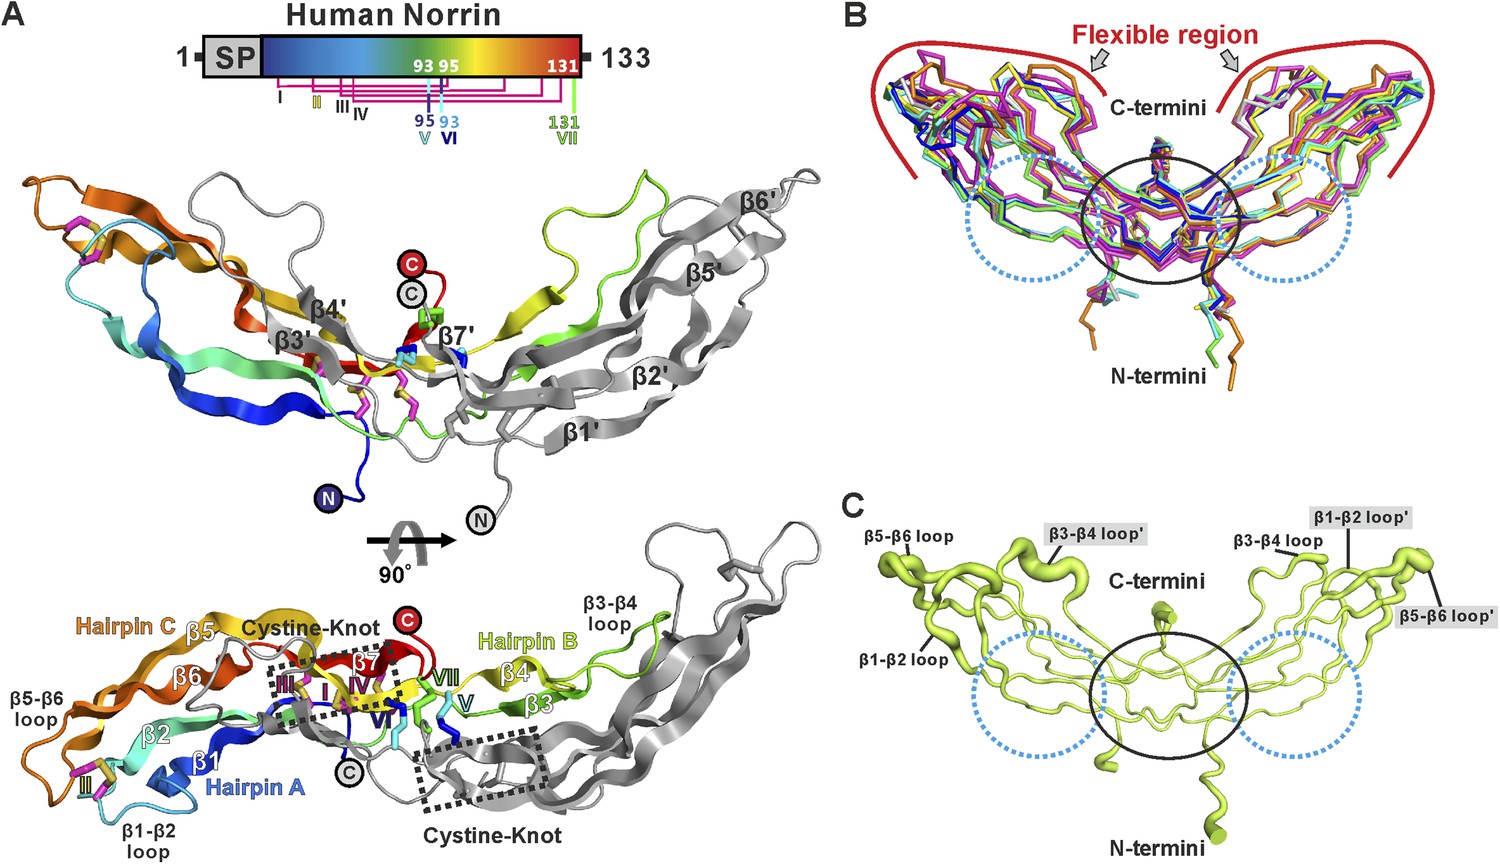
Crystal structure and structural analysis of apo Norrin.
(A) Schematic diagram of Norrin is rainbow coloured and disulphide bonds are drawn as lines. Cartoon representation of dimeric Norrin. Four intramolecular disulphide bonds are shown as magenta sticks. Cys93, Cys95, and Cys131 (forming intermolecular disulphide bridges) are shown as cyan, blue, and green sticks, respectively. Two cystine-knot motifs are marked with dotted boxes and the filled circles denote the N- and C-termini. (B) Ribbon diagram of superpositions of Norrin molecules from the asymmetric unit of crystal form I (green, chain A and B; cyan, chain C and D; magenta, chain E and F), crystal form II (yellow, chain A and B; blue, chain C and D), crystal form III (grey, chain A and B; purple, chain C and D), and MBP-Norrin (cyan; PDB ID: 4MY2). The flexible regions are highlighted as red lines. Loop regions (β1-β2 loop, β3-β4 loop, and β5-β6 loop) show structural plasticity. The well ordered regions include the cystine-knot motifs plus intermolecular disulphide linked areas (black circle) and two Fz4 binding sites (cyan dotted circle). (C) Representative Norrin dimer displayed with the diameter of the Cα tube defined by Cα atom B factor (small tube means structural rigidity; large tube indicates structural flexibility).
Figure 2—figure supplement 1
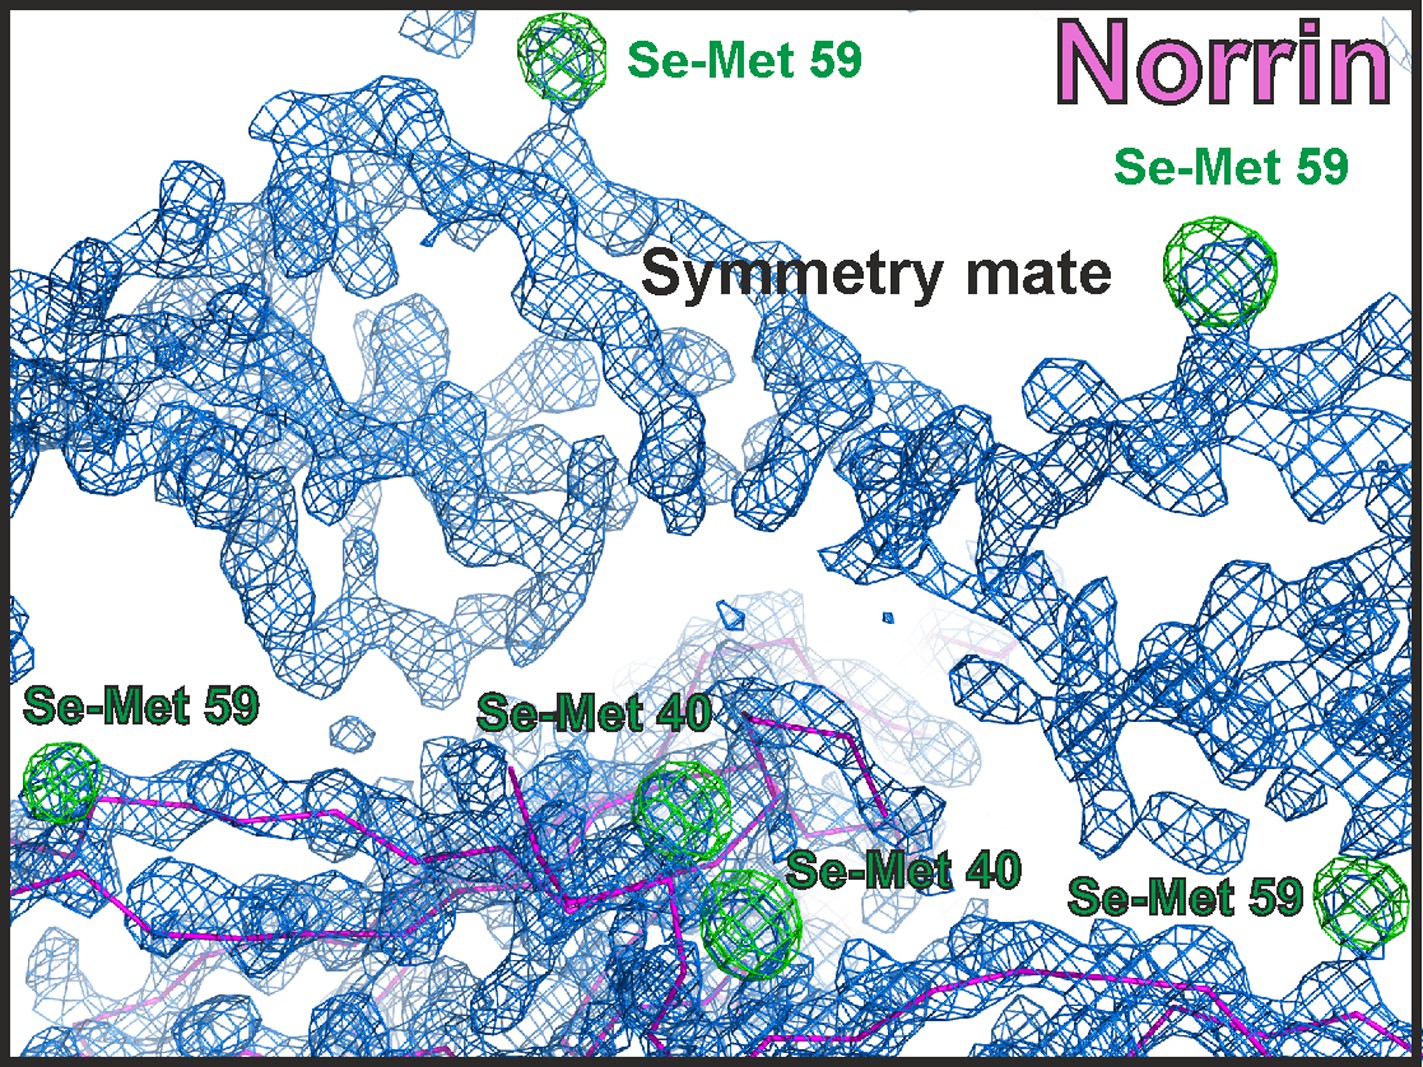
Electron density map of Norrin structure.
The initial density modified map from PHENIX AUTOSOL (Terwilliger, 2000, Terwilliger et al., 2009) calculated with experimental Se-Met SAD phases is contoured at 1.5 σ and shown as blue meshes. The initial model from BUCCANEER (Cowtan, 2006) is shown as magenta ribbon diagram. The anomalous difference map for Se-Met is contoured at 4 σ as green meshes with Se-Met residues labelled.
Figure 2—figure supplement 2
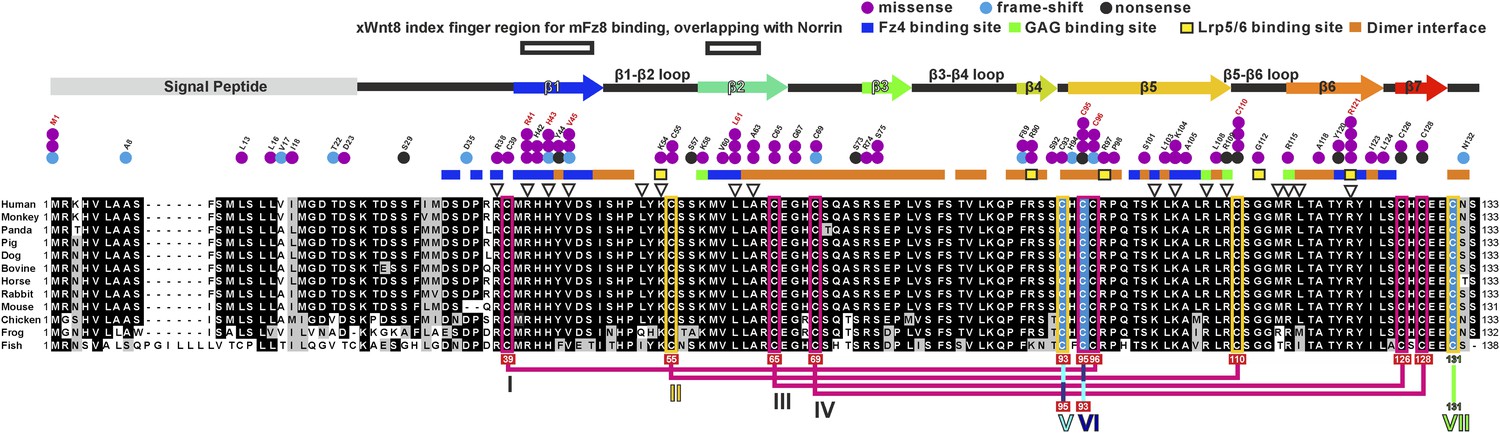
Multiple sequence alignment of Norrin.
Secondary structure element colouring corresponds to Figure 2A. The magenta boxes represent conserved cysteine residues in the cystine-knot growth factor superfamily, whereas the yellow boxes denote Norrin specific conserved cysteine residues. Disulphide bridges are numbered and are drawn in magenta lines for the intramolecular disulphide bonds. Three cysteine residues (highlighted in cyan) that form intermolecular disulphide bridges are drawn in cyan, blue and green lines. Triangles indicate the mutation sites for SPR binding and luciferase reporter assays. Residues involved in binding of Fz4, GAG, and Lrp5/6 are marked with blue, green, and yellow filled boxes, respectively. Residues involved in dimerization are highlighted with orange filled boxes. Black boxes denote the region of the Wnt8 index finger involved in Fz8CRD binding, which overlaps with Norrin for Fz4CRD binding (Figure 9). Disease-associated residues are marked by coloured dots according to the types of mutations (purple, missense; cyan, frame-shift; black, nonsense). Cysteine residues associated with diseases are marked below the sequence with red filled boxes. NCBI accession numbers: Human Norrin, NP_000257; Monkey Norrin, XP_528948; Panda Norrin, XP_002928194; Pig Norrin, NP_001106528; Dog Norrin, XP_855261; Bovine Norrin, AAI12739; Horse Norrin, XP_001490401; Rabbit Norrin, XP_002719919; Mouse Norrin, NP_035013; Chicken Norrin, XP_416765; Frog Norrin, NP_001154869; Fish Norrin, XP_001338820.
Figure 2—figure supplement 3
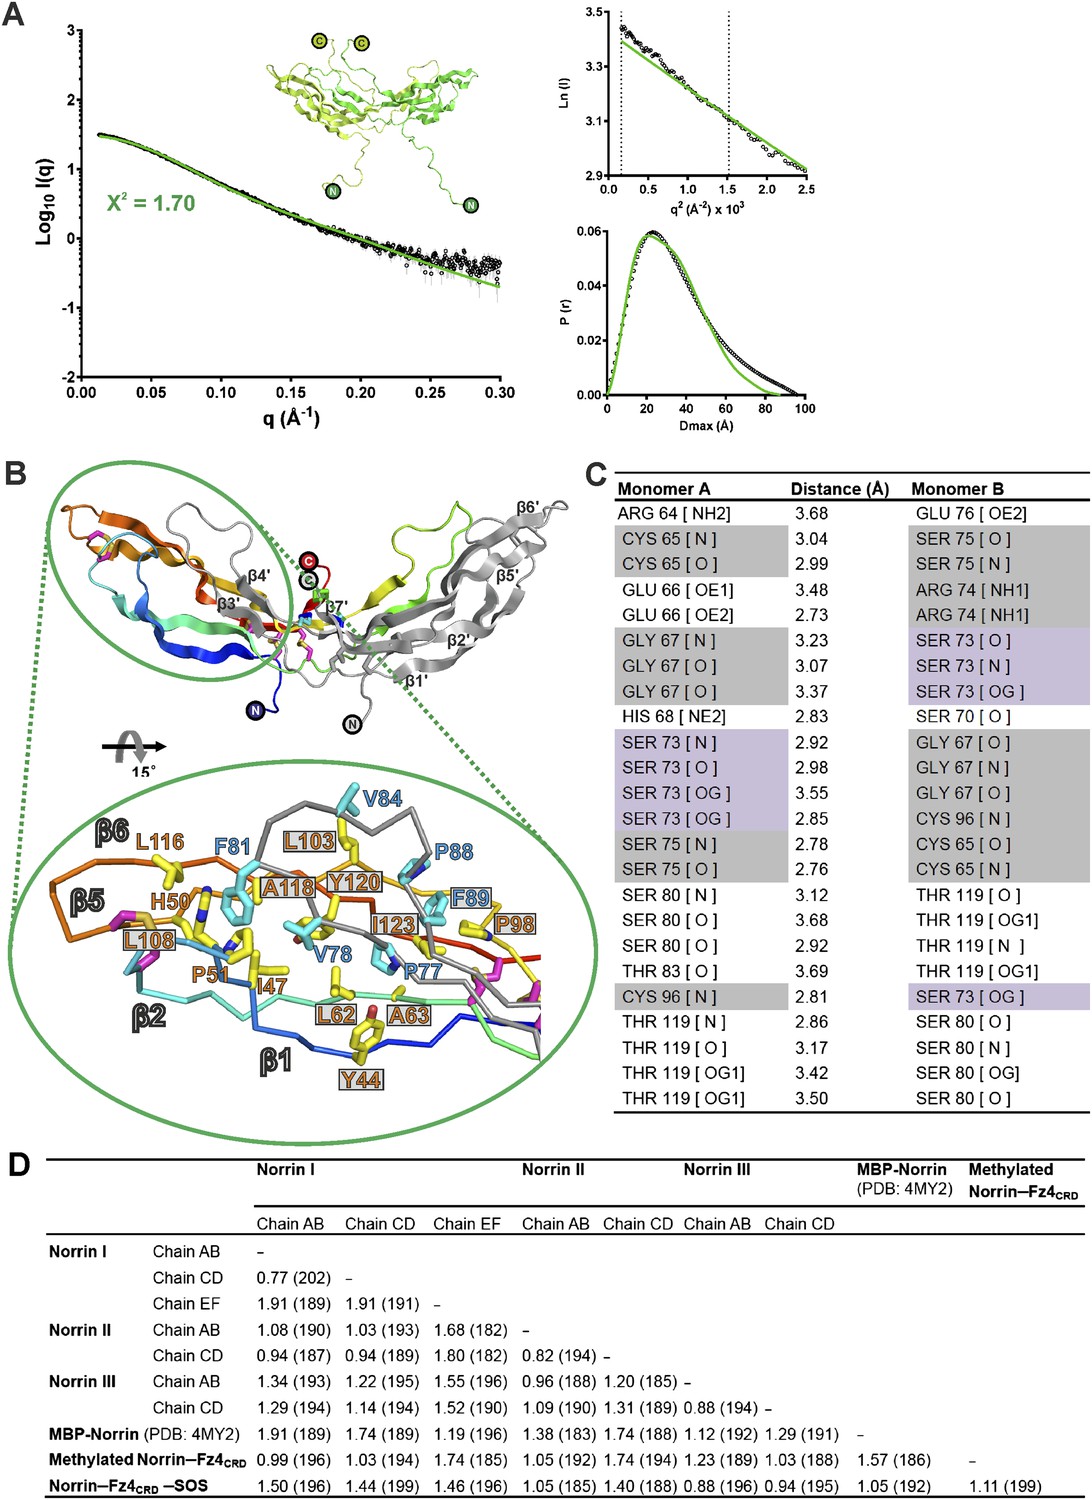
Norrin solution structure and structural analyses.
(A) SAXS analysis of Norrin. The experimental scattering data (black circles) and calculated scattering pattern (green line) are shown and the Norrin solution structure model is shown in cartoon representation. The upper right inset shows the experimental (black circles) and calculated (green line) Guinier region. The dashed lines delimit the range of fitting for Radius of gyration (Rg) analysis (Rg·S ≤ 1.3). The bottom right inset shows the experimental (black line) and calculated (green line) pair distance distribution P(r) curve. (B) Hydrophobic interactions for Norrin dimerization beyond the cystine-knot motif. Resides on hairpin A and C (yellow sticks) form hydrophobic contacts with the residues on hairpin B (cyan sticks) from another monomer. Residues associated with diseases are boxed. (C) Table of hydrogen bond and salt-bridge interactions in the Norrin dimer interface. Missense and nonsense mutations are highlighted as filled grey and purple backgrounds, respectively. (D) Detailed information of structural comparison shown as root mean square (r.m.s) deviation (Å) values and the number of aligned Cα atoms (in brackets).
Figure 3 with 2 supplements

Crystal and solution structures of unliganded Fz4CRD.
(A) Schematic domain organization (SP, signal peptide; TM. transmembrane domain; CD, cytoplasmic domain). Crystallization constructs are rainbow coloured. Disulphide bonds are drawn and blue hexagons denote N-linked glycosylation sites. Cartoon representation of Fz4CRD in rainbow colouring. N-linked N-acetyl-glucosamines (GlcNAc) and disulphide bonds are shown as blue sticks. (B) SEC-MALS experiments. The red line represents the molecular weight (left ordinate axis) and black lines show the differential refractive index (right ordinate axis) as well as SDS-PAGE (Inset). The numbers denote the corresponding molecular weights of each peak. (C and D) SAXS analyses of deglycosylated and glycosylated Fz4CRD solution structures. The experimental scattering data (black circles) and calculated scattering patterns (coloured lines) are shown and the Fz4CRD solution structure model is presented. The upper right inset shows the experimental (black circles) and calculated (coloured lines) Guinier region. The dashed lines delimit the range of fitting for Rg analysis (Rg·S ≤ 1.3). The bottom right inset shows the experimental (black circles) and calculated (coloured lines) pair distance distribution P(r) curve.
Figure 3—figure supplement 1
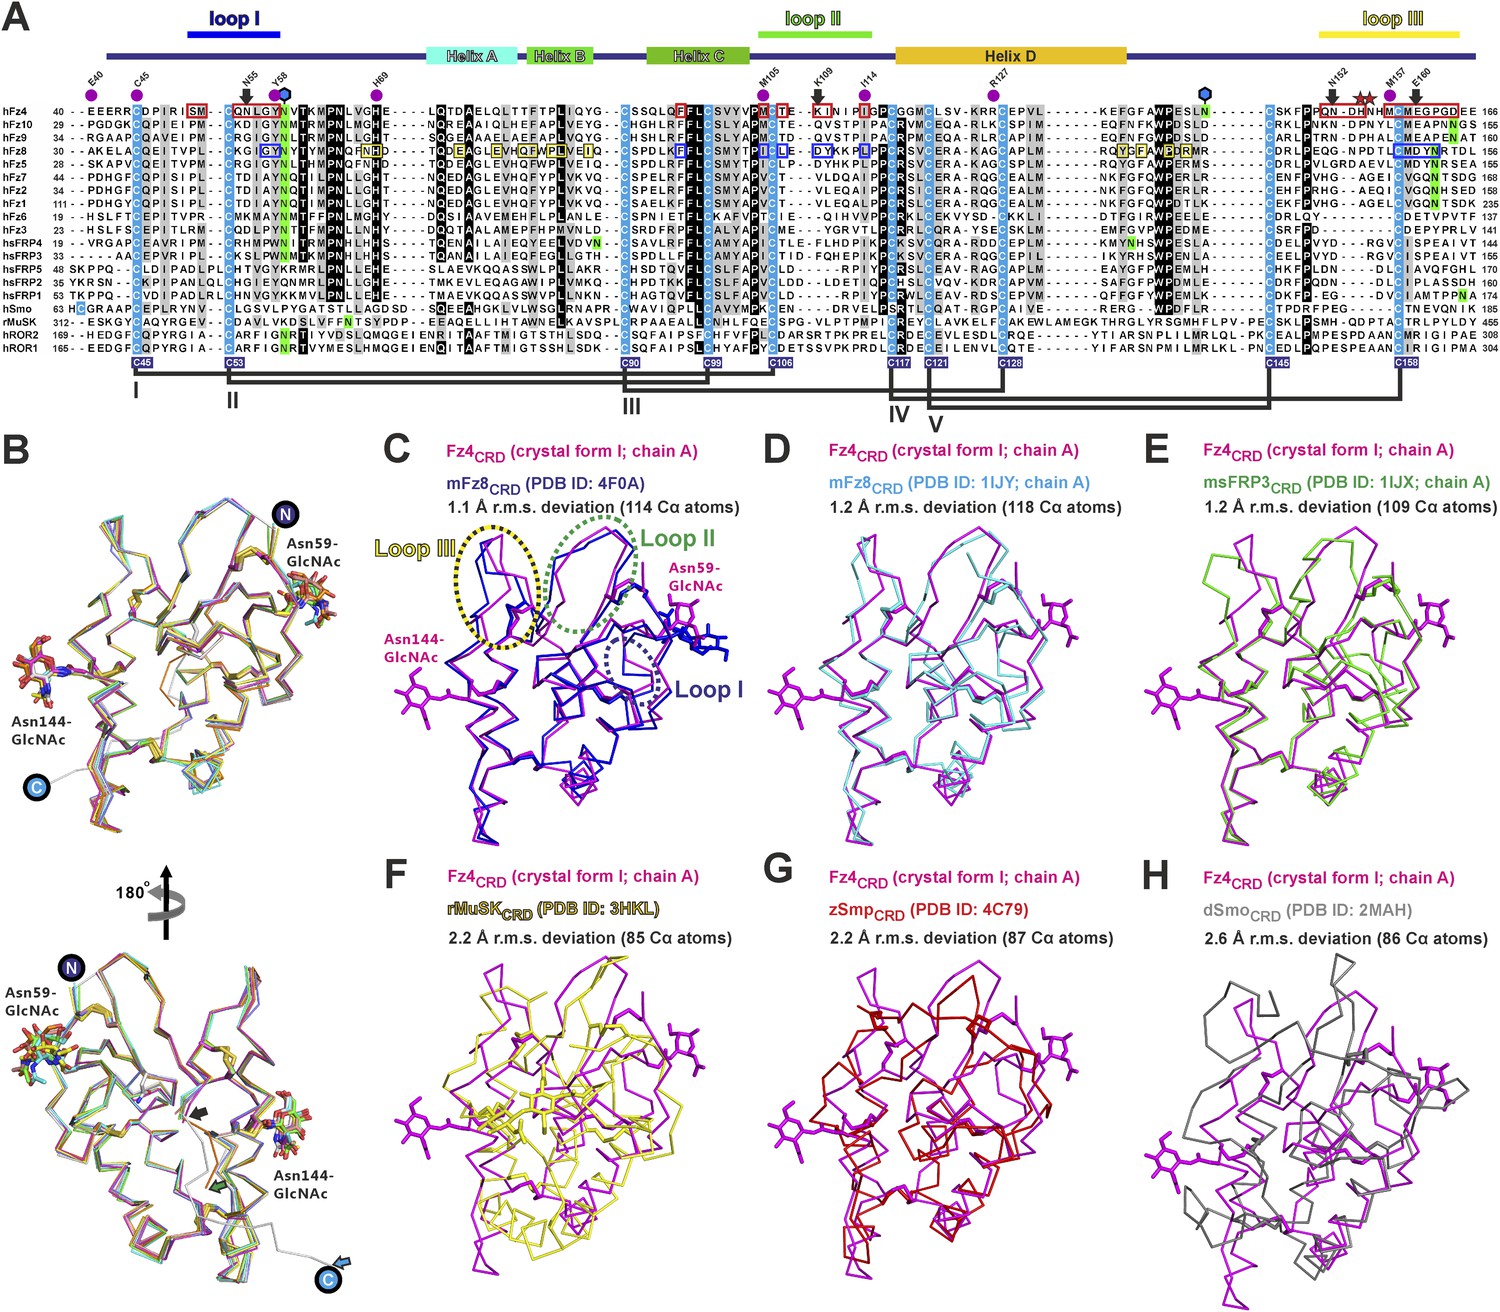
Multiple sequence alignment and structural analysis of cysteine-rich like domains.
(A) Secondary structure assignment colouring corresponds to Figure 3A. The conserved cysteine residues (highlighted in cyan) form five disulphide bridges, drawn in black lines and labelled as I–V. Notably, Smo has a different cysteine pair arrangement in disulphide bridge IV. Cysteine residues of Fz4 are numbered with blue filled boxes below the sequence alignment. The red boxes denote the residues of Fz4 that contact with Norrin, whereas residues of Fz8 are boxed in blue to indicate binding to Wnt8 index finger (site 2) and in yellow for interaction with Wnt8 PAM (site 1). Coloured lines indicate Fz4CRD loops that interact with Norrin. The N-glycosylation sites are highlighted in green and those of Fz4 are marked by blue hexagons. The purple dots mark residues associated with human retinal diseases (missense mutations; http://www.uniprot.org/uniprot/Q9ULV1). Red asterisks denote the residues of Fz4 involving in GAG binding. The black arrows indicate residues potentially determining ligand-binding specificity (Figure 9D-F). Sequences are from the following UniProt entries: hFz1, Q9UP38; hFz2, Q14332; hFz3, Q9NPG1; hfz4, Q9ULV1; hfz5, Q13467; hFz6, O60353; hFz7, O75084; hfz8, Q9H461; hfz9, O00144; hfz10, Q9ULW2; sfrp1 Q8N474; sfrp2, Q96HF1; sfrp3 Q92765; sfrp4, Q6FHJ7; sfrp5, Q5T4F7; hSmo, Q99835; rMuSk, Q62838; hROR1, Q01973; hROR2, Q01974. (B) Superimposition of all molecules of unliganded Fz4CRD (crystal form I and II) reveals no major conformational changes. The main difference between Fz4CRD structures is the point at which the C-terminal region becomes disordered (black, green, and cyan arrows indicate residue 162, 165, and 172, respectively). The N-linked glycans are shown as stick models. The encircled N and C indicate the N- and C- termini. (C–H) Structural comparison of Fz4CRD with CRDs of Fz-like proteins. Ribbon diagram of superposition of Fz4CRD crystal form I (magenta) with (C) complexed mouse Fz8CRD (cyan; PDB ID: 4F0A), (D) unliganded mouse Fz8CRD (cyan; PDB ID: 1IJY), (E) mouse sFRP3CRD (green; PDB ID: 1IJX), (F) rabbit MuSkCRD (yellow; PDB ID: 3HKL), (G) zebrafish SmoCRD (red; PDB ID: 4C79), and (H) drosophila SmoCRD (red; PDB ID: 2MAH). (sfrp = secreted frizzled related protein; Smo = Smoothened; MuSk = muscle-specific kinase; ROR = tyrosine-protein kinase transmembrane receptor).
Figure 3—figure supplement 2
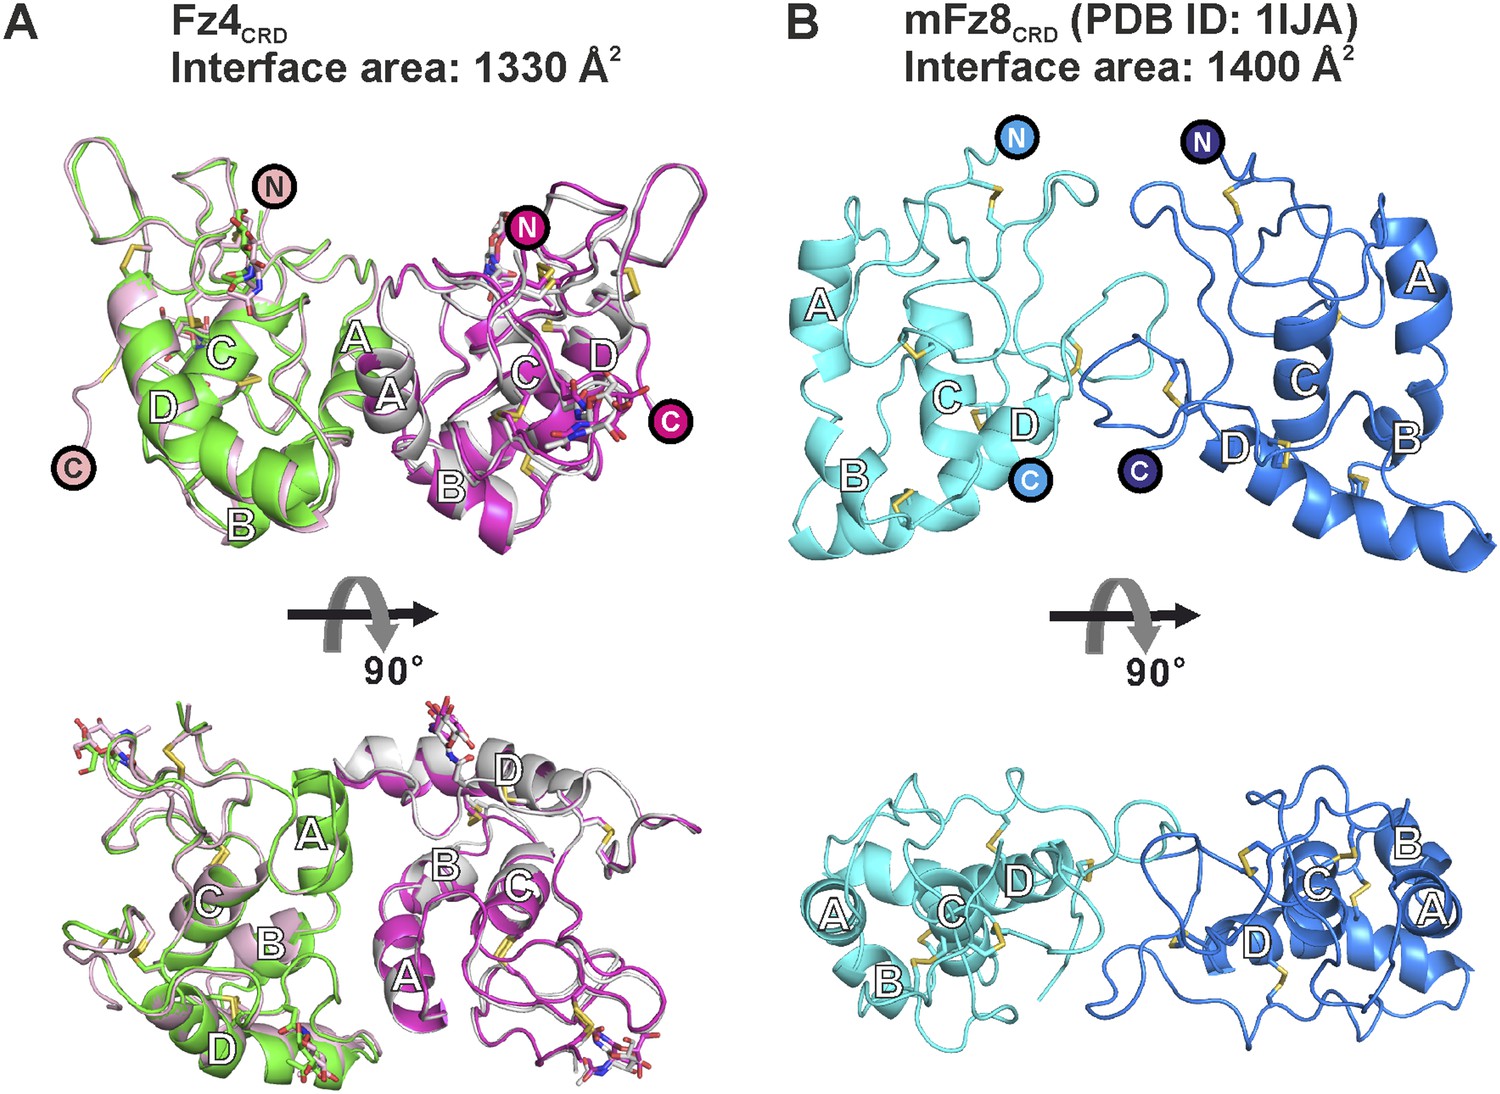
Distinct dimeric assembly of Fz4CRD and mouse Fz8CRD observed from crystal structures.
(A) The superimposition of Fz4CRD structures from two crystal forms, coloured as pink and magenta for crystal form I and green and gray for crystal form II. (B) The structure of dimeric mouse Fz8CRD (PDB: 1IJA) coloured as cyan and blue. The encircled N and C denote the N- and C-termini.
Figure 4 with 4 supplements
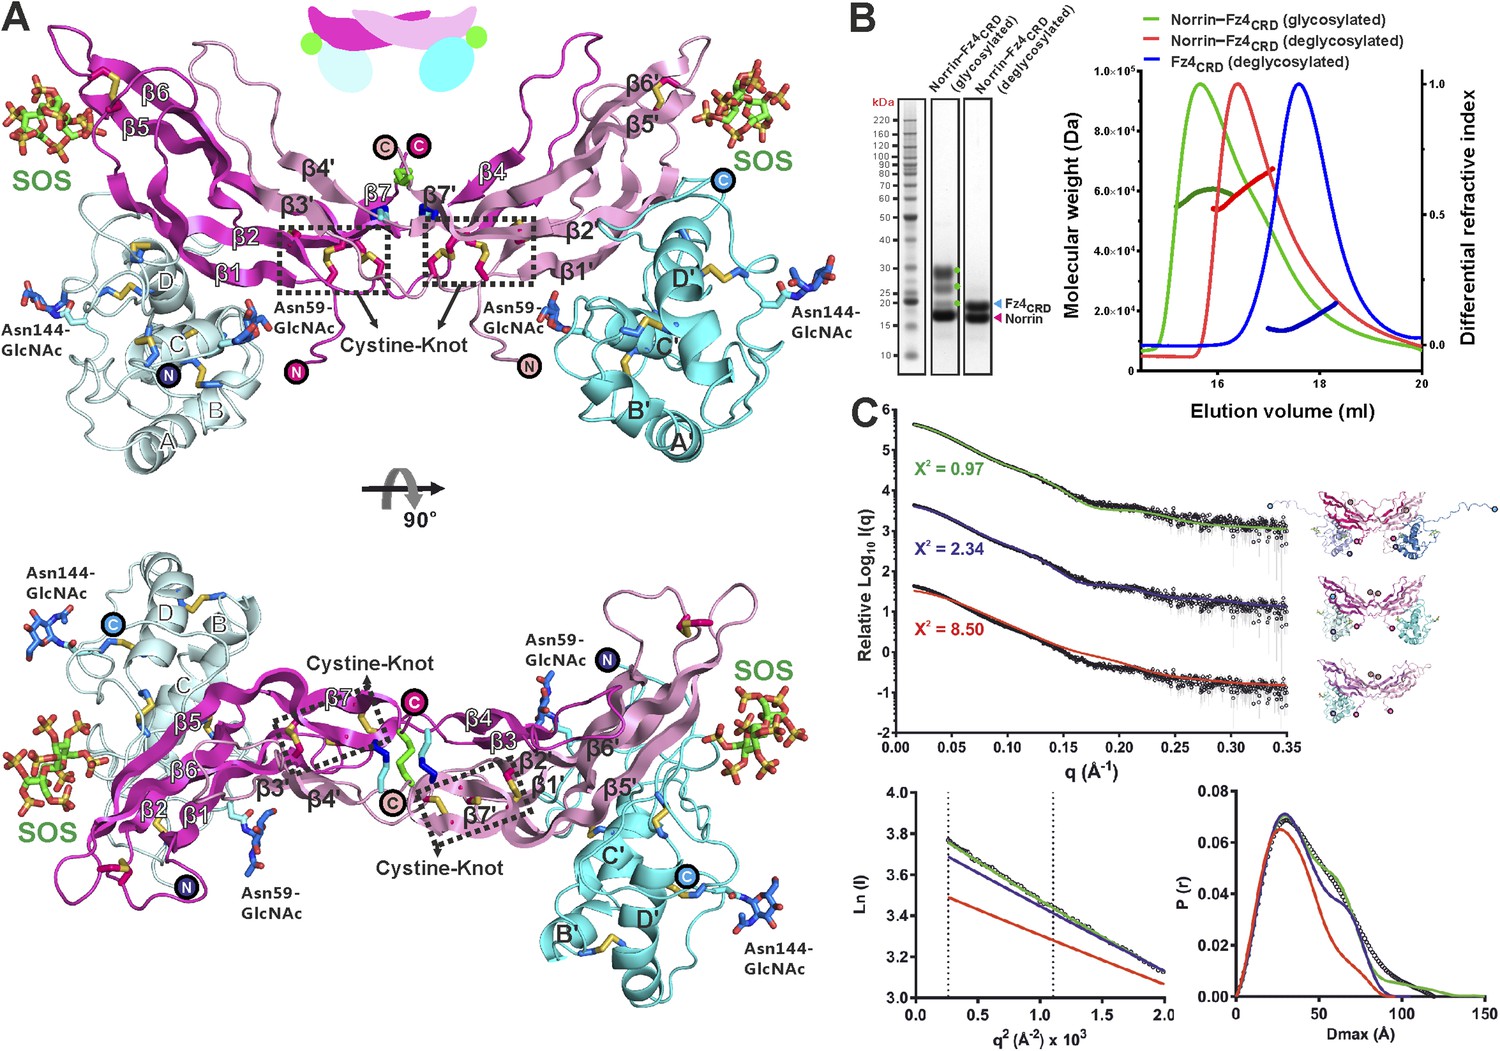
Crystal structure and solution behaviour of Norrin–Fz4CRD complex.
(A) Ribbon representation of Norrin (magenta and pink) in a 2:2:2 complex with Fz4CRD (cyan and pale cyan) and SOS (green). (B) SEC-MALS analyses. The profile of molecular weight (left ordinate axis) and differential refractive index (right ordinate axis) are shown as thick and thin lines, respectively. SDS-PAGE (Inset) shows Norrin in complex with Fz4CRD (triplet band for glycosylated Fz4CRD, marked as green circles, represents glycosylation heterogeneity). (C) SAXS experiments. Experimental scattering data (black circles) and calculated scattering patterns (coloured lines) are shown to a maximal momentum transfer of q = 0.35 Å−1. Individual data: fit pairs are displaced along an arbitrary y axis to allow for better visualization. Bottom curve: Norrin–Fz4CRD 1:2 complex crystal structure (red line). Middle curve: Norrin–Fz4CRD 2:2 complex crystal structure (blue line). Top curve: modelled Norrin–Fz4CRD 2:2 complex crystal structure (missing regions for Norrin and Fz4CRD N- and C-termini are modeled into the crystal complex structure; green line). Structural models are shown in cartoon representation. The bottom left inset shows the experimental (black circles) and calculated (coloured lines) Guinier region. The bottom right inset shows the experimental (black circles) and calculated (coloured lines) pair distance distribution P(r) curves.
Figure 4—figure supplement 1
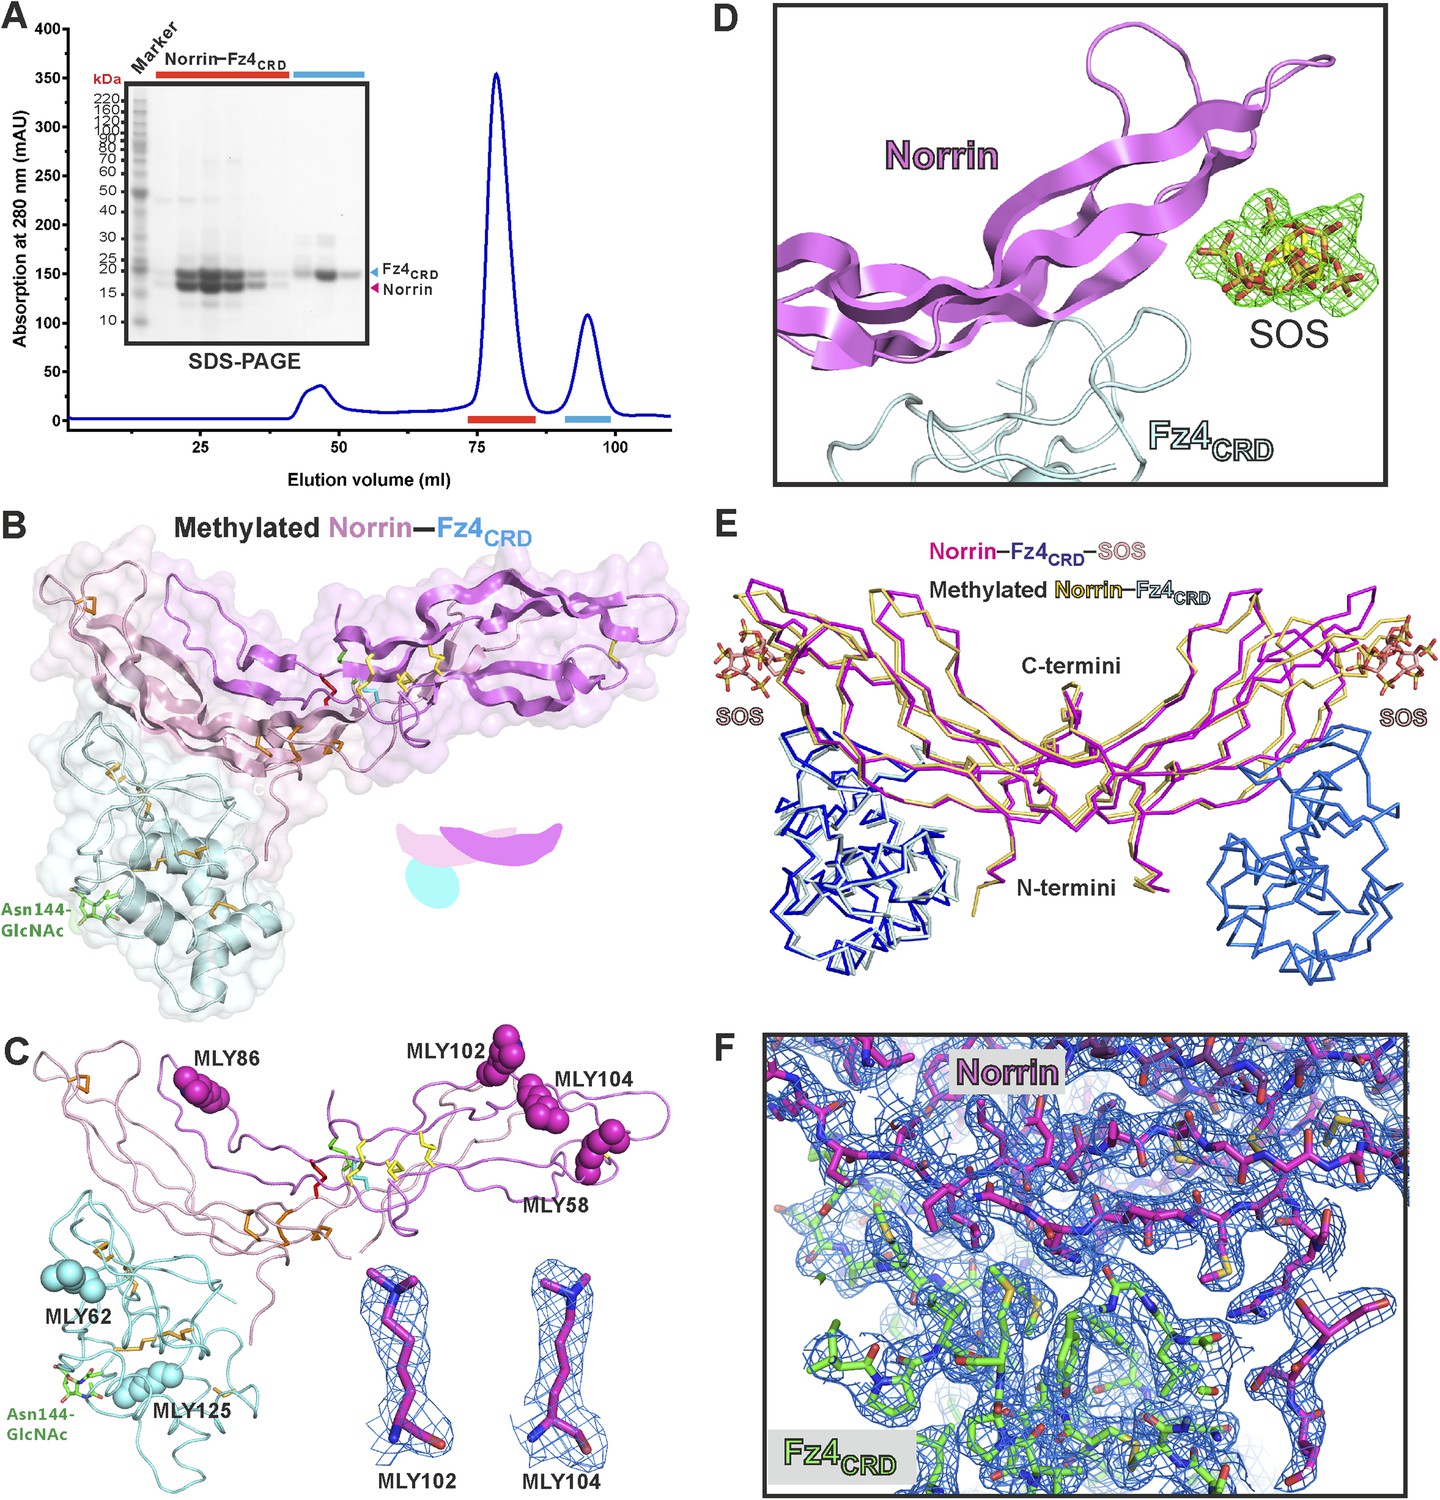
Protein complex production and structural properties of Norrin–Fz4CRD complex.
(A) Norrin forms a stable complex with Fz4CRD in solution. SEC elution profiles and SDS-PAGE under reducing condition are presented. SEC fractions analysed by SDS-PAGE are marked as red lines for Norrin–Fz4CRD complex and cyan lines for uncomplexed Fz4CRD. (B) The crystal structure of methylated Norrin (pink and magenta)–Fz4CRD (cyan) forms a 2:1 complex, which loses one molecule of Fz4CRD during crystal lattice formation. The N-linked glycans are coloured in green. (C) Dimethylated lysine (MLY) residues on the protein surface of methylated Norrin–Fz4CRD are shown as sphere models. Close-up view of sigmaA-weighted 2|FO| − |FC| electron density maps for MLY102 and MLY104 are contoured at 1.0 σ as blue meshes. (D) The sigmaA-weighted |FO| − |FC| electron density maps were calculated with omission of the SOS molecules from the refined model, followed by several cycles of refinement and contoured at 4 σ level as green meshes. (E) Methylated Norrin (yellow)–Fz4CRD (cyan) was superposed onto the Norrin (magenta)–Fz4CRD (blue)–SOS (wheat) complex using Norrin as a reference. (F) The overall sigmaA-weighted 2|FO| − |FC| electron density map after refinement is contoured at 1.0 σ level as blue meshes for the complex of methylated Norrin–Fz4CRD (stick model).
Figure 4—figure supplement 2
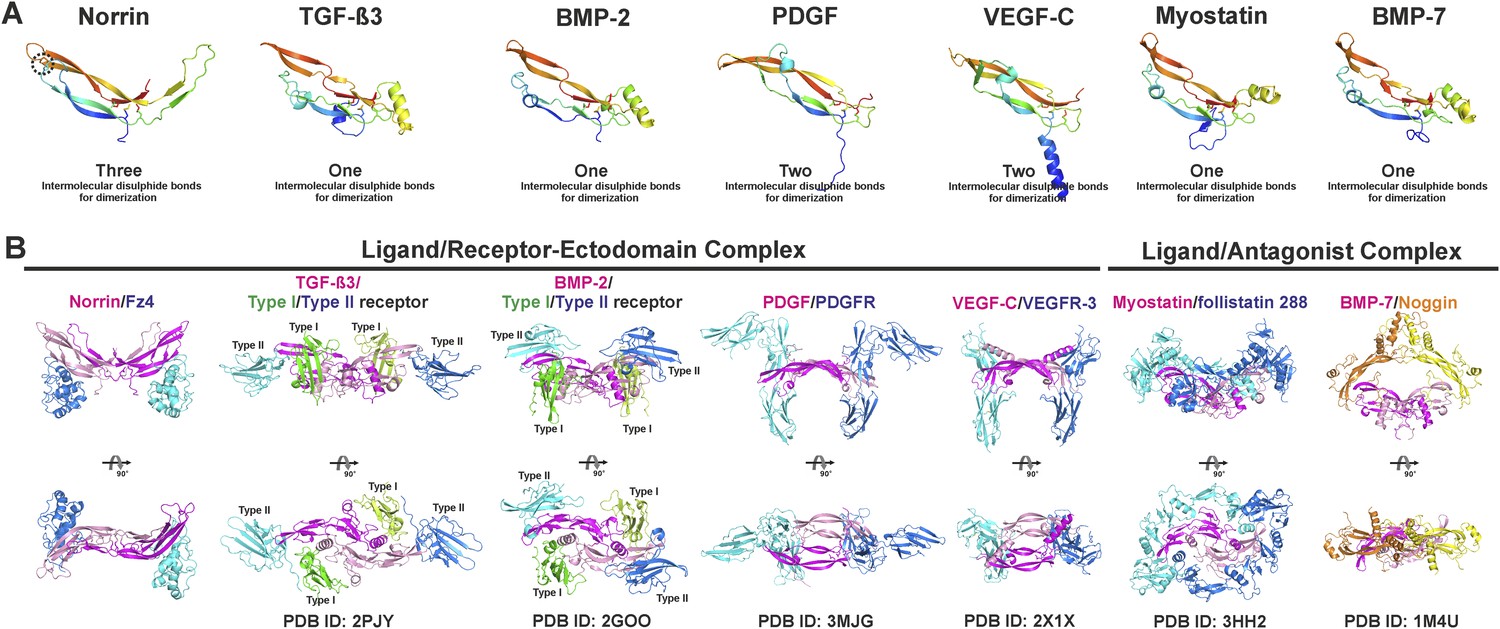
Structural comparison of cystine-knot growth factor monomers and their ternary complexes.
Norrin has a unique three intermolecular disulphide bonds arrangement and a specific intramolecular disulphide bond (black dotted circle). (A) Cartoon representation of a single chain of cystine-knot growth factors, coloured as rainbow from blue N-terminus to red C-terminus. Each structure was superposed with the Norrin monomer and presented in the same view. (B) Comparison of ternary complex formation is shown as ribbon diagrams, including Norrin (dimer, magenta and pink) and Fz4CRD (cyan and blue), TGF-β3 (dimer, magenta and pink) in complex with Type I (green and lemon) and Type II (blue and cyan) receptors, BMP-2 (dimer, magenta and pink) bound with Type I (green and lemon) and Type II (blue and cyan) receptors, PDGF (dimer, magenta and pink) in complex with its receptors (PDGFR; blue and cyan), VEGF-C (dimer, magenta and pink) in complex with its receptors (VEGFR-3; blue and cyan), myostatin (dimer, magenta and pink) and its antagonists (follistatin 288; blue and cyan), and BMP-7 (dimer, magenta and pink) bound with its antagonists (Noggin; orange and yellow). PDB identifiers are shown below the structural representations.
Figure 4—figure supplement 3
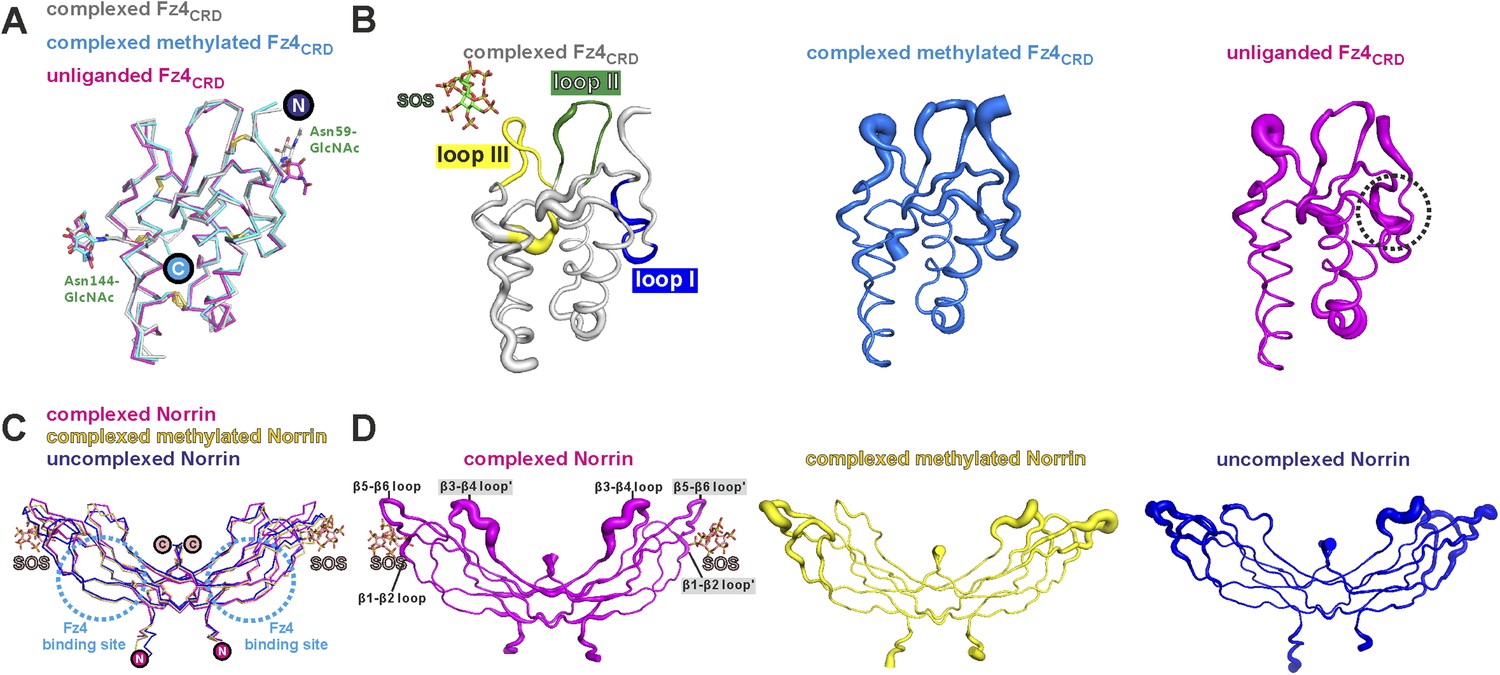
No large conformational changes upon complex formation.
(A) Structural comparisons Fz4CRD (gray) from Norrin–Fz4CRD–SOS complex with Fz4CRD (cyan) from methylated Norrin–Fz4CRD and unliganded Fz4CRD (magenta) crystal form II (chain D) are presented as a ribbon diagram. N-linked glycans are shown as stick models. The encircled N and C denote the N- and C-termini. (B) Representative Fz4CRD displayed with diameter of the Cα tube defined by the B factor of the Cα atoms (small tube means structural rigidity; large tube indicates structural flexibility). Fz4CRD loops for Norrin binding are highlighted as blue (loop I), green (loop II), and yellow (loop III). The flexibilities of loop I and III are reduced upon complex formation and SOS binding, respectively. (C) Structural comparisons of Norrin (magenta) from Norrin–Fz4CRD–SOS complex, Norrin (yellow) from methylated Norrin–Fz4CRD and uncomplexed Norrin (blue) crystal form I (chain A and B) are shown as ribbon diagram. The cyan dotted circles denote the Fz4 binding site on Norrin. (D) Representative Norrin displayed according to the B factor of the Cα atoms. The SOS binding site (mainly on β5-β6 loop) becomes rigid upon SOS binding (ligand induced fit).
Figure 4—figure supplement 4
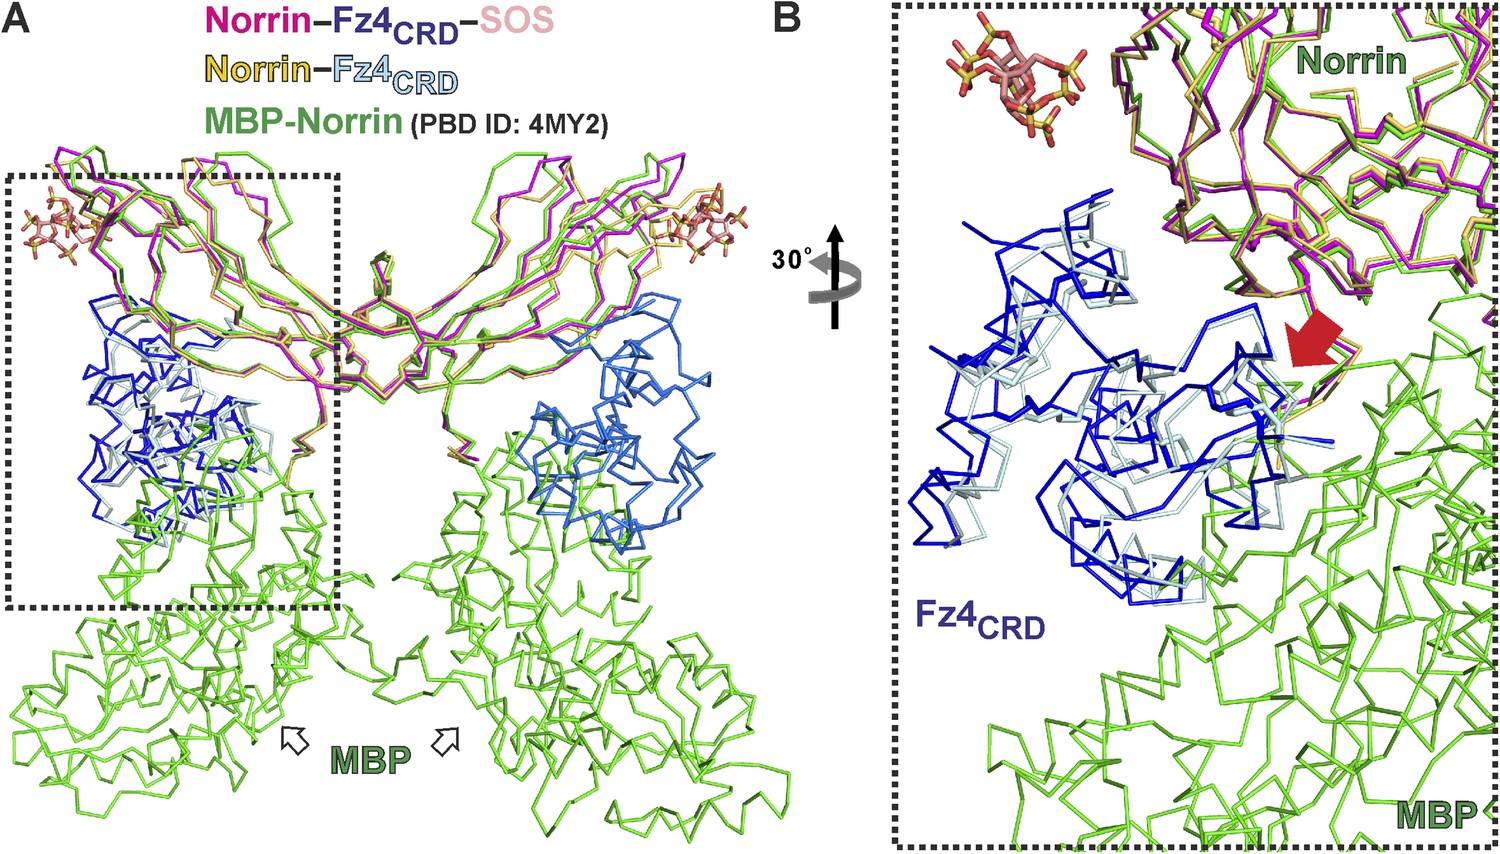
Structural comparison of Norrin–Fz4CRD complex with MBP-Norrin.
(A) Superposition of MBP-Norrin (green; PDB ID: 4MY2) onto Norrin in the Norrin (magenta)–Fz4CRD (blue)–SOS (wheat) and methylated Norrin (yellow)–Fz4CRD (cyan) complex structures. (B) Close-up view of steric clashes (indicated by a red arrow) between Fz4CRD and MBP.
Figure 5
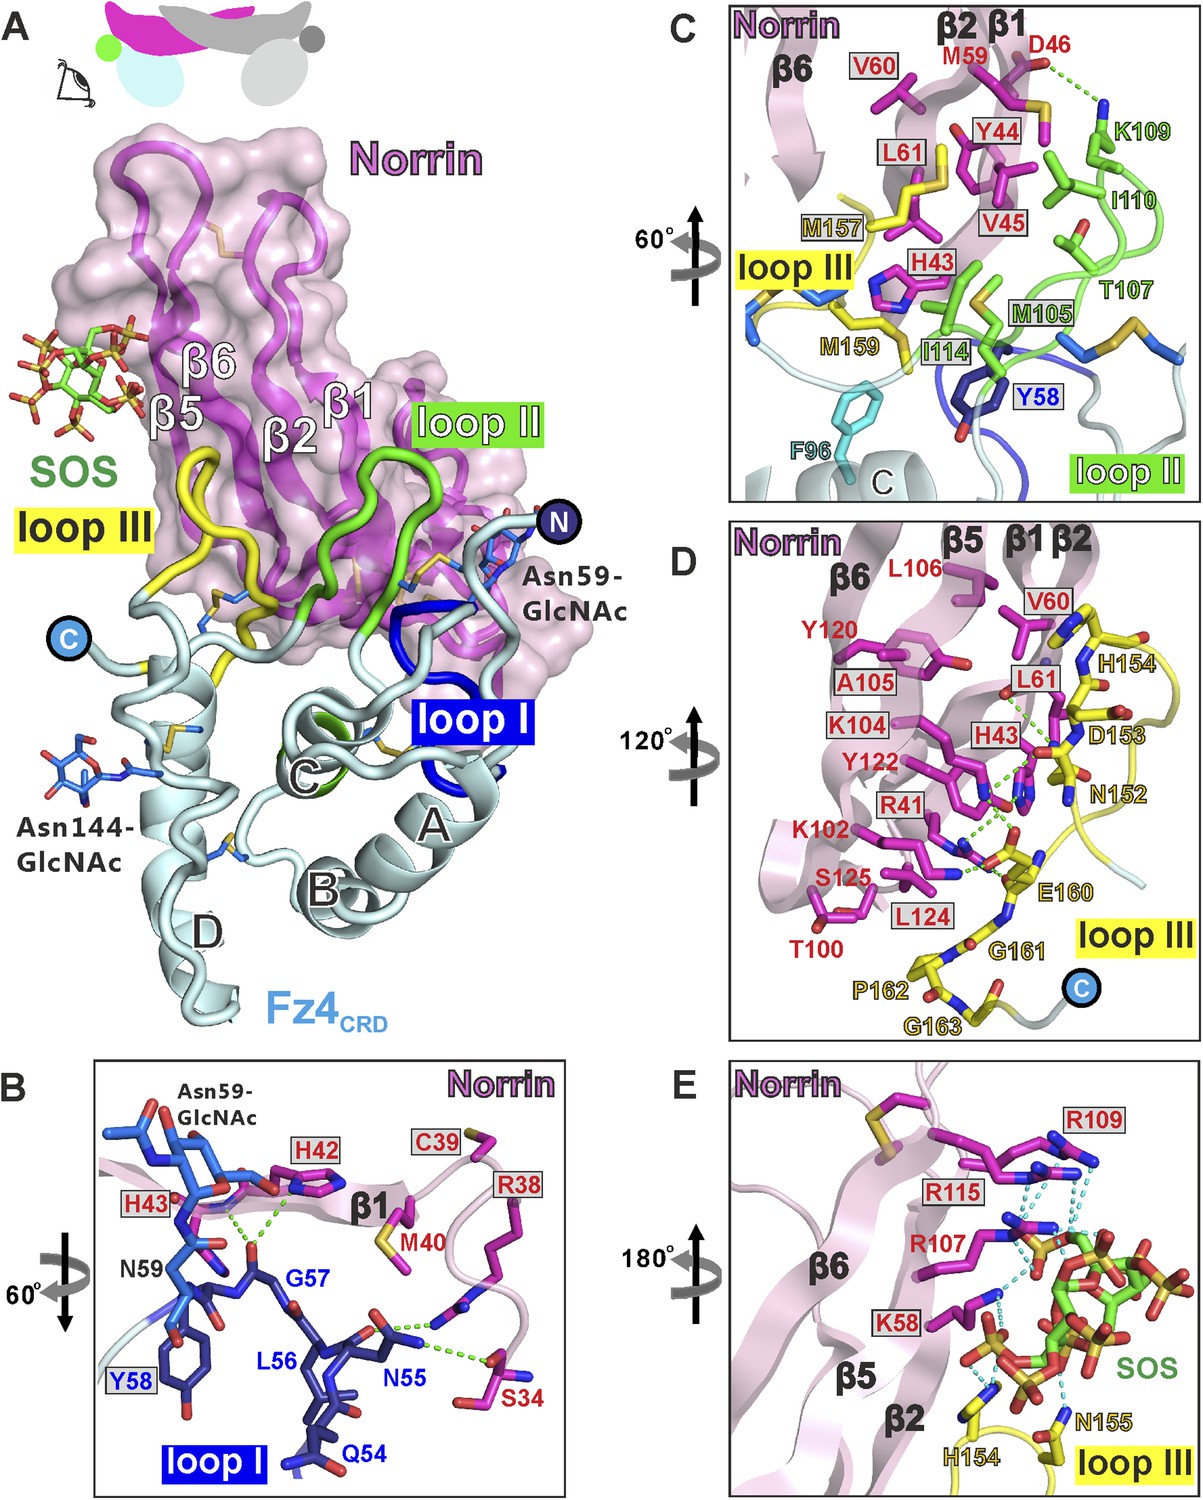
Structural details of binding sites in the Norrin–Fz4CRD–SOS complex.
(A) Side-view of complex. Fz4CRD loops involved in Norrin binding are coloured blue (loop I), green (loop II), and yellow (loop III). (B–E) Views detailing the interfaces. Selected residues involved in binding are shown as sticks and coloured magenta (Norrin), blue (loop I), green (loop II), yellow (loop III), and cyan (Phe96 of Fz4CRD) and those associated with disease mutations are highlighted in boxes. Dotted lines denote hydrogen bonds. (B) Interactions between Fz4CRD loop I and Norrin. (C) Hydrophobic interactions of Norrin with Fz4CRD loop II and part of loop III. (D) Interactions of Fz4CRD loop III with Norrin. (E) SOS binding to Norrin and Fz4CRD loop III.
Figure 6 with 1 supplement
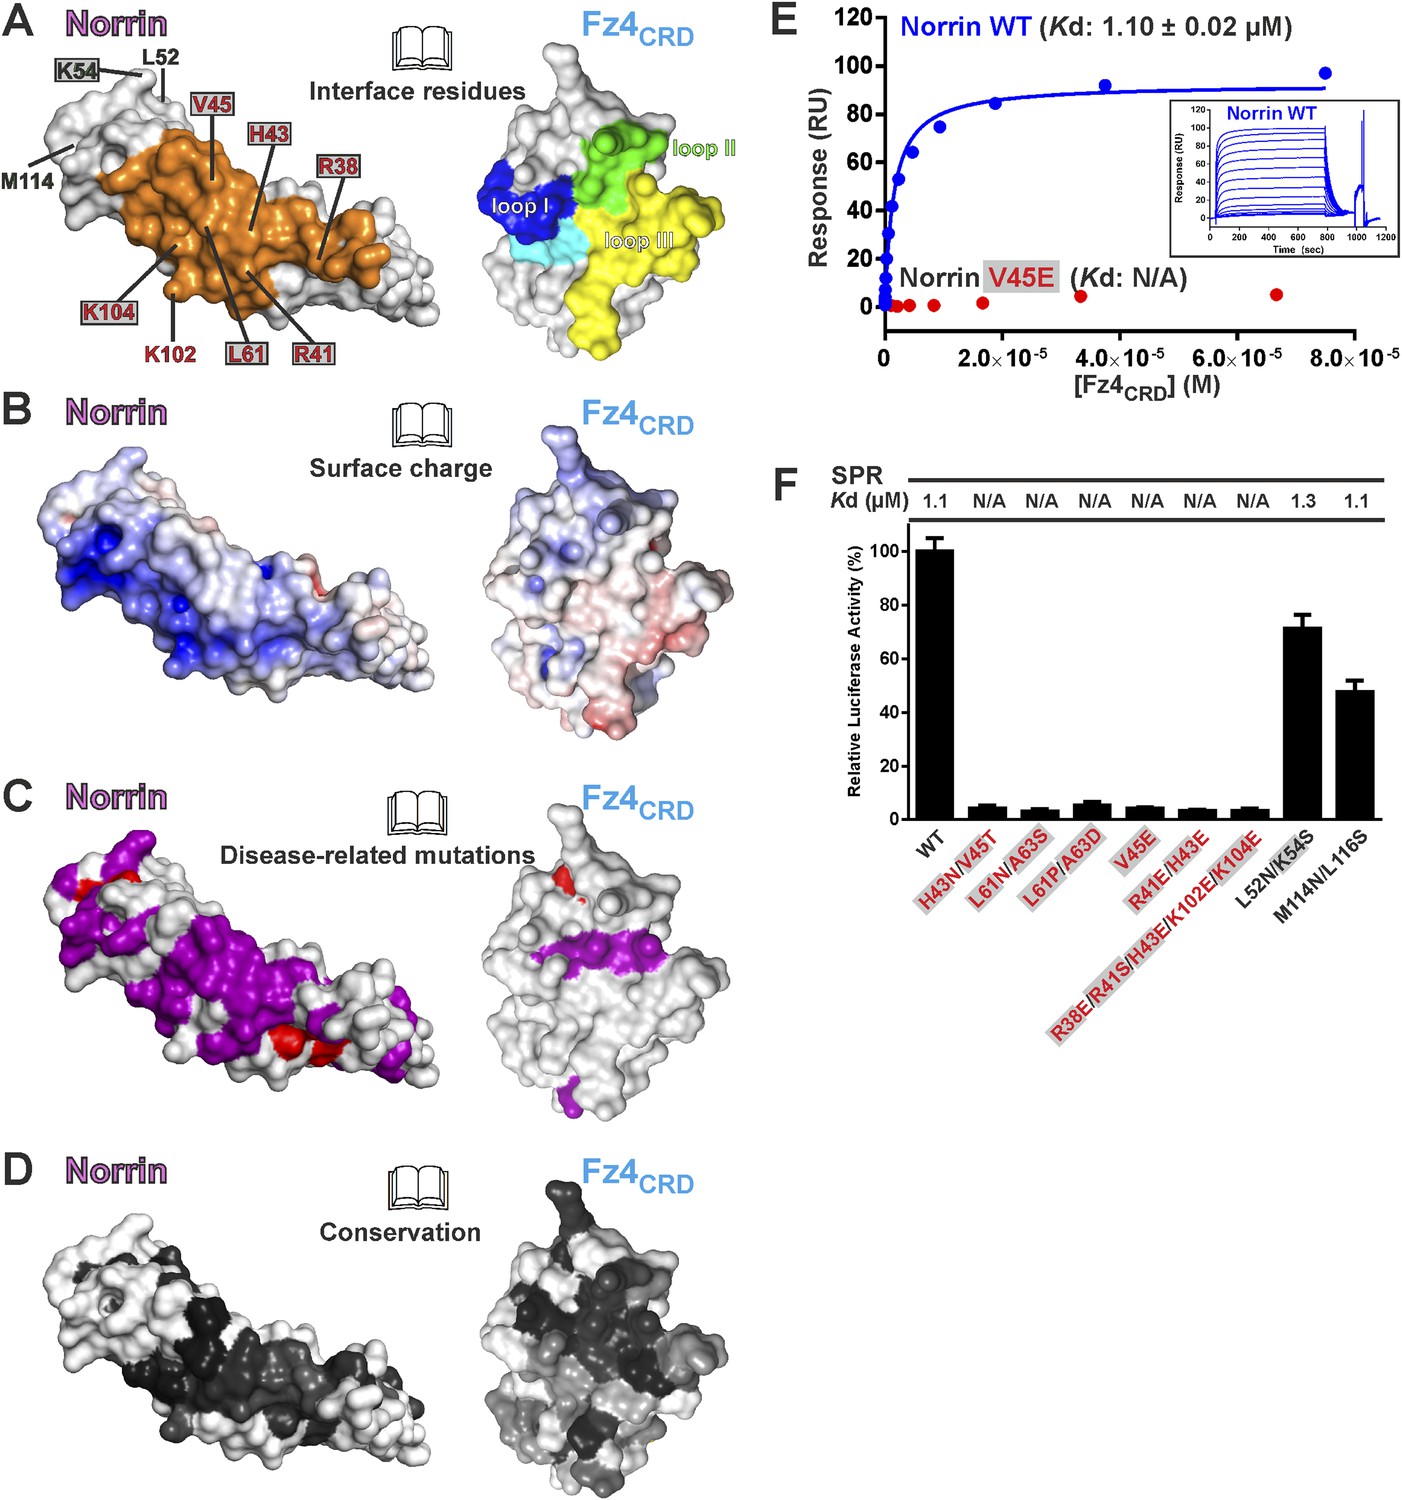
Biophysical and functional characterisation of Fz4 binding site.
Surface representation of Norrin–Fz4CRD complex in open book view. (A) Interface residues are coloured orange (Norrin) and blue (loop I), green (loop II), yellow (loop III), and cyan (Phe96) on Fz4CRD. Norrin mutation sites used in functional assays are labelled (red, residues involved in Fz4CRD binding; grey filled box, residues associated with diseases; black, residues located outside the Fz4 binding site). (B) Norrin and Fz4CRD coloured by electrostatic potential from red (acidic; −7 kbT/ec) to blue (basic; 7 kbT/ec). (C) Disease-associated mutations mapped onto the surface of Norrin and Fz4CRD (purple, missense mutations; red, missense mutations of cysteine residues). (D) Surfaces colour-coded according to sequence conservation from white (not conserved) to black (conserved). (E) SPR results for Fz4CRD binding to Norrin wild-type (WT) and Norrin V45E mutant. Inset SPR sensorgrams are of equilibrium-based binding assays with reference subtraction. (F) Luciferase reporter assays histograms with Kd values from SPR measurements (Figure 6—figure supplement 1) shown above. Residues involved in the Fz4CRD binding site are coloured red. Residues without contact with Fz4CRD are coloured black. Grey filled boxes highlight disease-associated residues (Figure 2—figure supplement 2). The luciferase activities were normalized to a maximum activity value (100%) for Norrin wild-type and error bars represent standard deviations (n = 3).
Figure 6—figure supplement 1
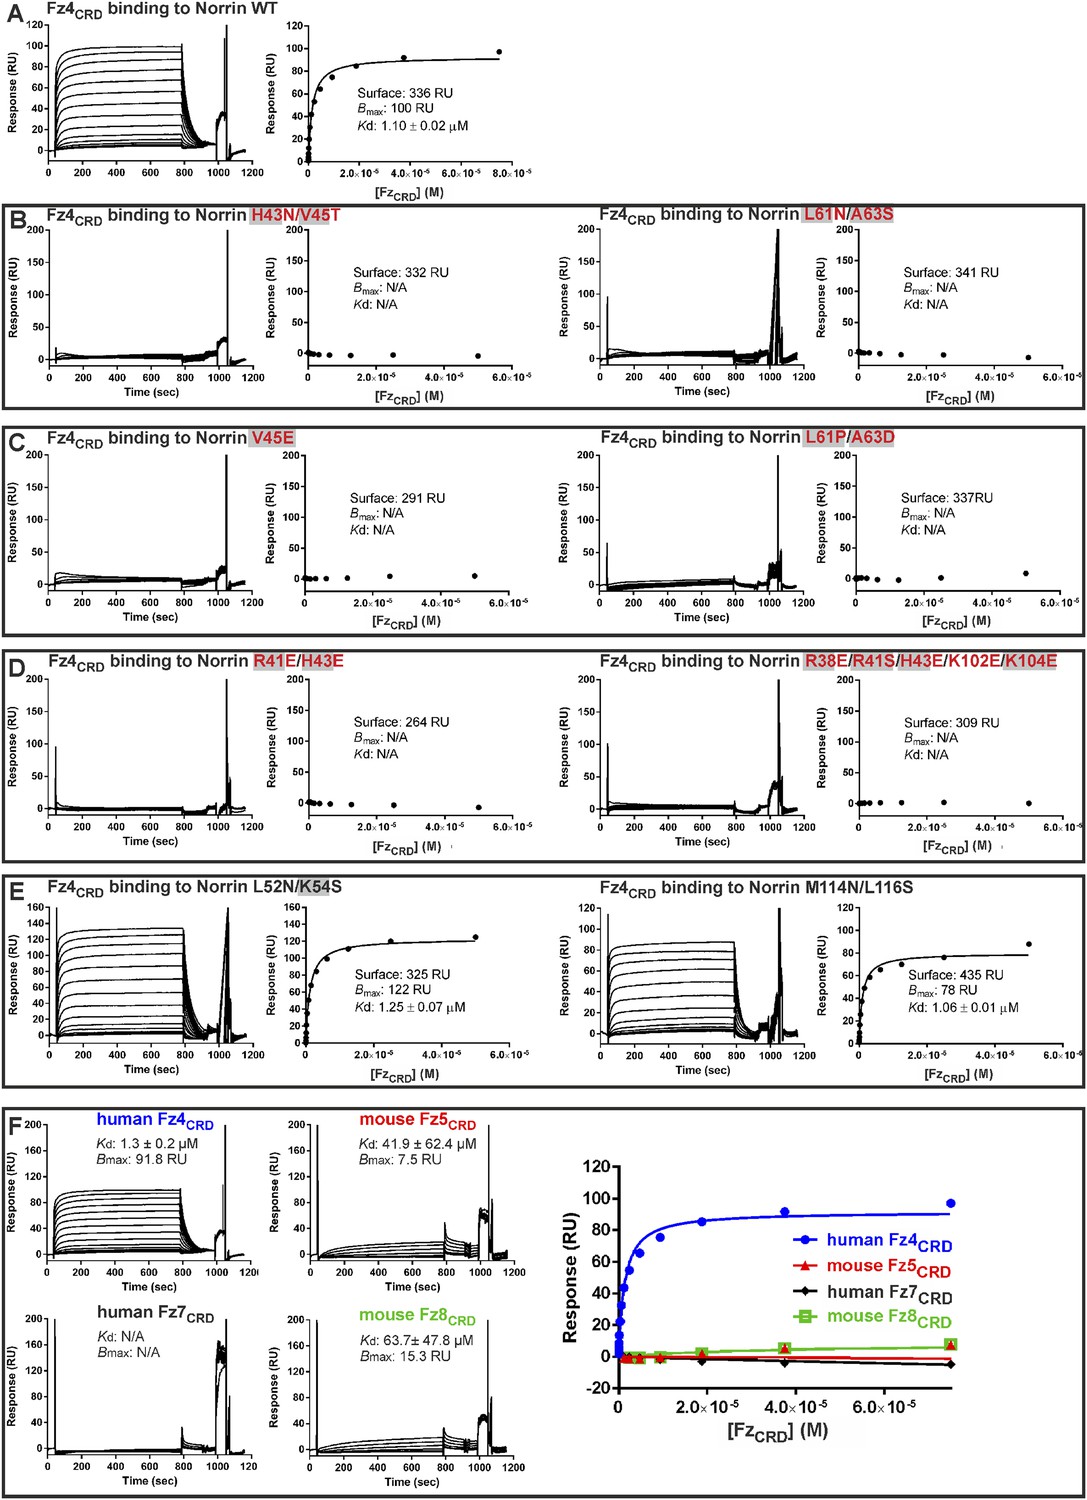
SPR equilibrium binding data.
SPR equilibrium binding experiments using Fz4CRD as analyte and biotinylated human Norrin wild-type (WT) and mutants as immobilized ligands on CM5 sensor chips. SPR sensorgrams (left panels) and fitted plots of equilibrium binding response (right panels; 1:1 Langmuir binding model) against a series of concentrations of Fz4CRD are shown. The binding parameters are shown as Surface (the amounts of biotinylated Norrin coated onto sensor chip), Bmax (the maximum response), Kd (binding constant), and RU (response unit). N/A indicates not applicable for calculation of Kd. Residues associated with diseases are highlighted as filled grey boxes. (A) The interaction of Norrin wild-type with Fz4CRD has a Kd of 1.1 μM. (B) Introduction of an N-linked glycosylation site on the Fz4 binding site of Norrin results in the complete loss of Fz4CRD binding. (C) Norrin mutants identified from diseases show no binding to Fz4CRD. (D) Mutations designed to disrupt the hydrogen bond and salt bridge interactions of the Fz4 binding site completely abolish binding to Fz4CRD. (E) Introduction of an N-linked glycosylation site on the Norrin surface locating outside the Fz4 binding site does not affect the binding affinity of Norrin to Fz4CRD. (F) Norrin discriminates between different FzCRD proteins. Biotinylated human Norrin was immobilized onto a CM5 sensor chip to give 410 response units (RU) and different FzCRD proteins were used as analytes. The injected human Fz4CRD proteins have a concentration ranging from 2.3 nM to 75 μM. Other FzCRD concentrations ranged from 0.3 μM to 150 μM (mouse Fz5CRD) or 0.2 μM–100 μM (human Fz7CRD and mouse Fz8CRD). Because of the limitations of detection, the Kd values of Fz5CRD and Fz8CRD are too low to measure accurately, resulting in variable standard deviations. The binding affinity of Fz7CRD to Norrin is not sufficient to calculate a Kd.
Figure 7 with 1 supplement

Verification of Norrin GAG binding site.
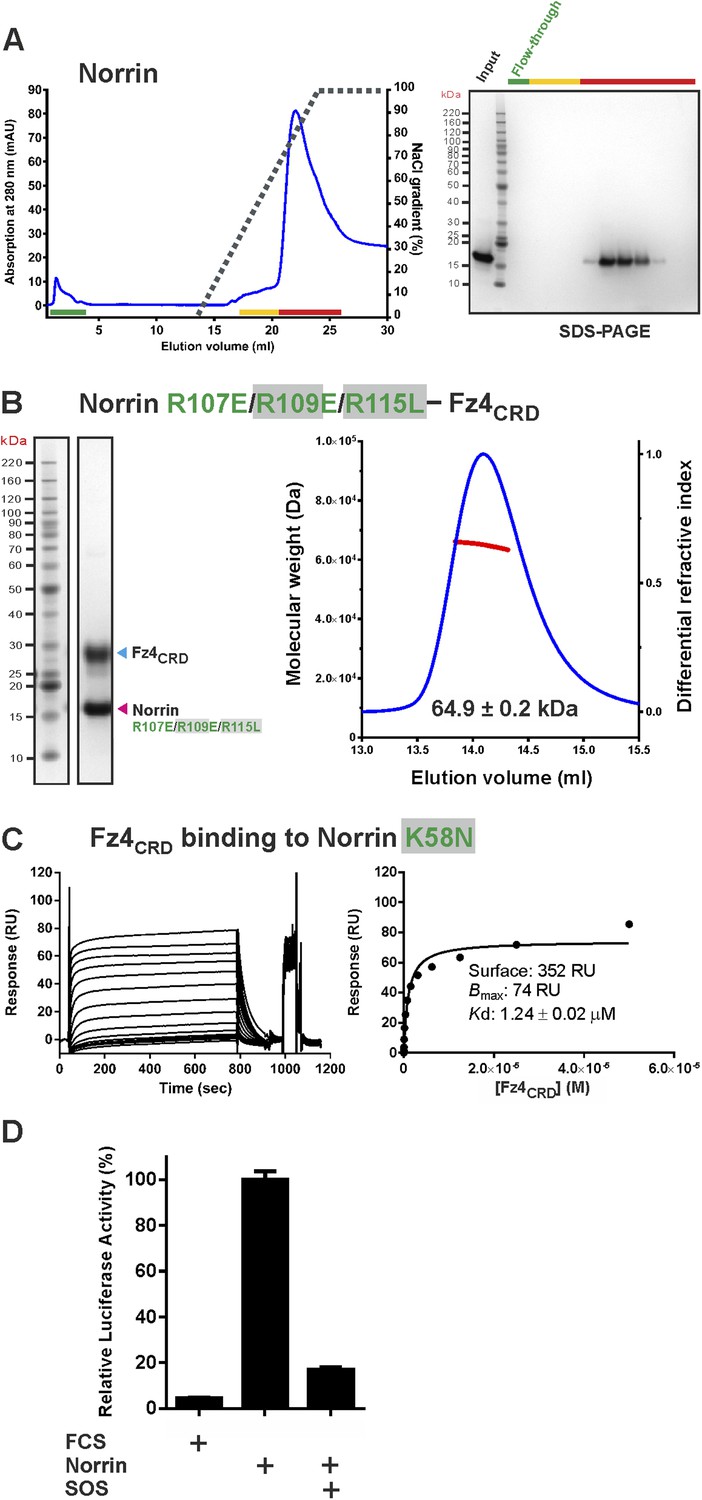
Heparin affinity chromatography of (A) Norrin–Fz4CRD complex and (B) Norrin R107E/R109E/R115L–Fz4CRD complex. Protein elution profiles (left panel) were monitored by absorbance at 280 nm (blue curves) for a NaCl gradient (0.25–2 M; black dashed lines). Input sample, flow-through (green line) and peak fractions (red line) were analysed on SDS-PAGE (right panel). Norrin-Fz4CRD complex was eluted at 1.3 M NaCl concentration. (C) Luciferase reporter assays for Norrin mutations (coloured green) in the GAG binding site. Grey filled boxes highlight disease-associated residues (Figure 2—figure supplement 2). (D) SPR binding assay of Norrin R107E/R109E/R115L mutant and Fz4CRD interaction. Sensorgrams (top panel) and fitted plots of equilibrium binding response (bottom panels) for a series of concentrations of Fz4CRD are shown. (E and F) SPR equilibrium binding experiments of Lrp6P1E1P2E2 binding to Norrin wild-type and R107E/R109E/R115L mutant, respectively. Biotinylated Norrin proteins were immobilized on a CM5 chip and Lrp6P1E1P2E2 as analyte was injected over the chip. Sensorgrams (top panel) and fitted plots (bottom panels) for a series of concentrations of Lrp6P1E1P2E2 are presented.
Figure 7—figure supplement 1
Supporting experiments for GAG binding site.
(A) Heparin affinity chromatography of Norrin wild-type. Protein elution profiles (left panel) were monitored by absorbance at 280 nm (blue curves) for a NaCl gradient (0.25–2 M; black dashed lines). An input sample, flow-through (green line) and peak fractions (yellow and red lines) are analysed on SDS-PAGE (right panel). Norrin wild-type was eluted with 1.6 M NaCl concentration. (B) SEC-MALS experiments for Norrin R107E/R109E/R115L–Fz4CRD complex. The red line represents the molecular weight (left ordinate axis) and blue lines show the differential refractive index (right ordinate axis). (C) In SPR equilibrium binding experiments, biotinylated human Norrin K58N proteins were coated onto a CM5 sensor chip and a series of concentrations of Fz4CRD were injected over the chip as analyte. Graphs show sensorgrams (left panels) and fitted plot (right panels). (D) Luciferase reporter assay of SOS inhibition. The luciferase reporter activities were normalized to a maximum activity value of 100%, using Norrin wild-type as reference. Error bars indicate standard deviations (n = 3).
Figure 8 with 1 supplement
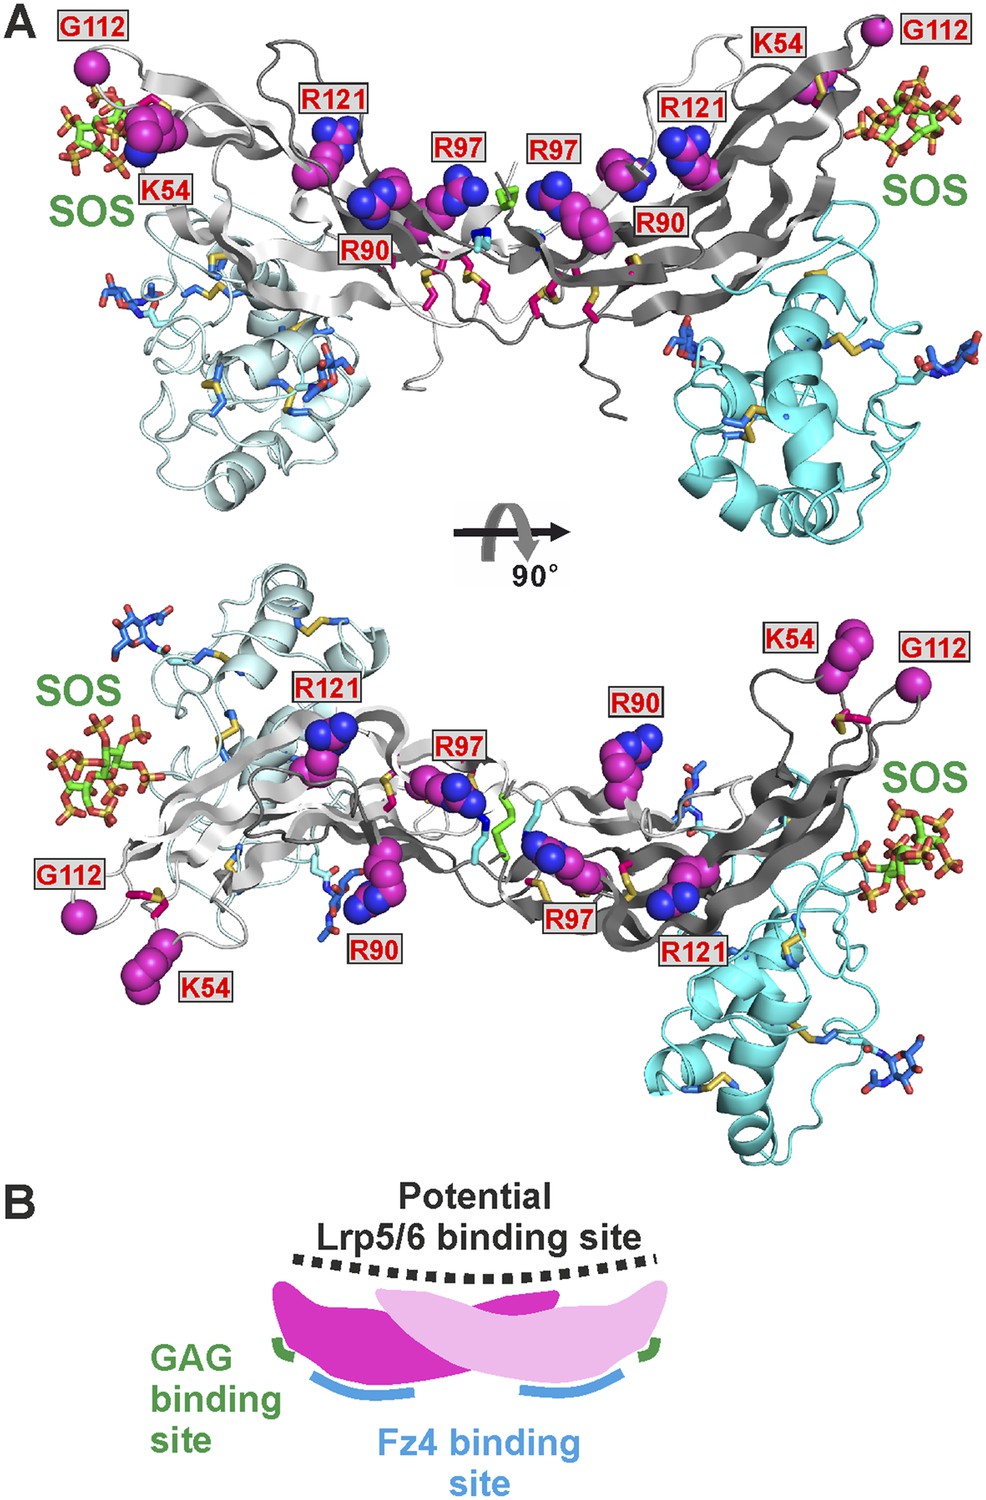
The potential Lrp5/6 binding site on Norrin.
(A) Cartoon representation of Norrin (grey) in complex with Fz4CRD (cyan). Residues in the potential Lrp5/6 binding site are shown as spheres (atom colouring: magenta, carbon; blue, nitrogen; red, oxygen). The boxes highlight residues associated with disease mutations. (B) Cartoon model of Norrin showing three distinct binding sites.
Figure 8—figure supplement 1
Verification of Norrin potential Lrp5/6 binding site.
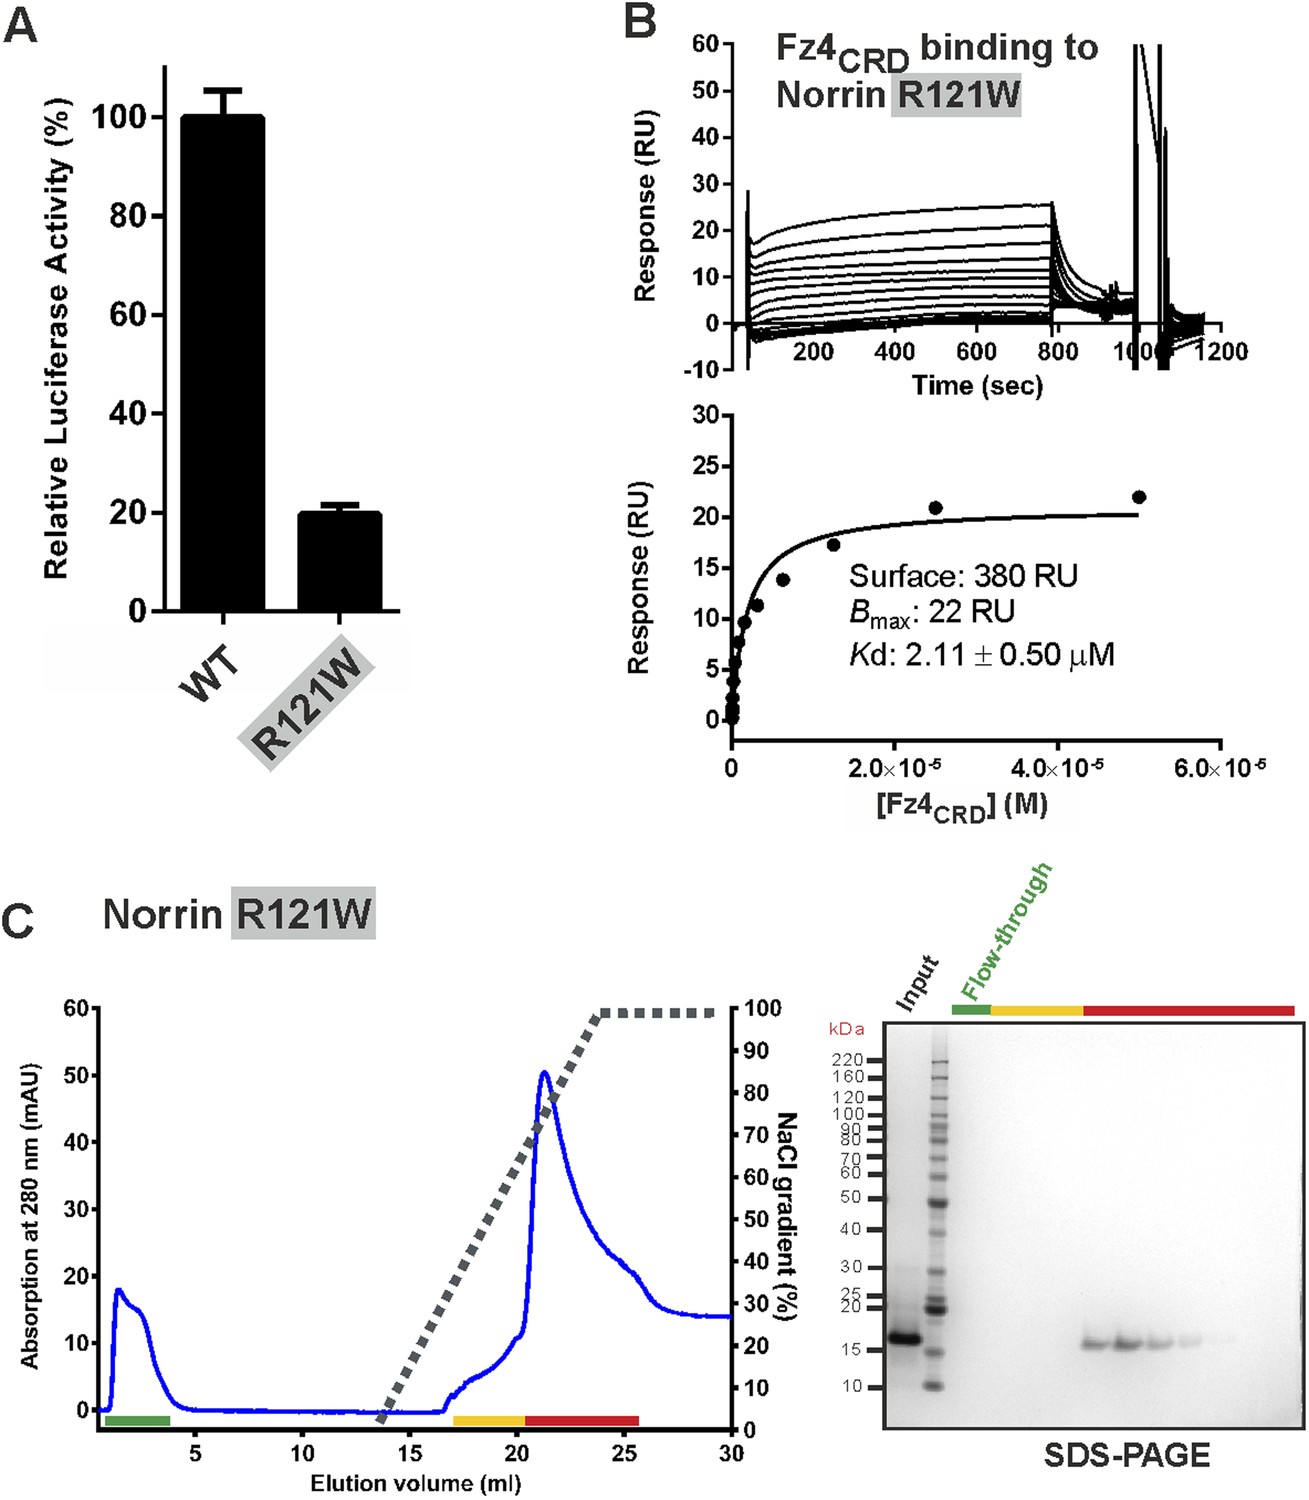
(A) Luciferase reporter assay. The luciferase activities were normalized to a maximum activity value (100%) for Norrin wild-type and error bars represent standard deviations (n = 3). (B) SPR binding assay of Norrin mutant R121W. Biotinylated Norrin mutant R121W was coated onto a CM5 sensor chip and a series of concentrations of Fz4CRD as analyte were injected over the chip. Graphs show sensorgrams (top panels) and fitted plot of equilibrium binding response (bottom panels). (C) Heparin binding assay of Norrin mutant R121W. Protein elution profiles (left panel) were monitored by absorbance at 280 nm (blue curves) for a NaCl gradient (0.25–2 M; black dashed lines). An input sample, flow-through (green line) and peak fractions (yellow and red lines) are analysed on SDS-PAGE (right panel). Norrin mutant R121W was eluted at 1.5 M NaCl concentration. Notably, we found almost 50% of the Norrin mutant R121W precipitated as the NaCl concentration was reduced before injection for heparin affinity chromatography (see ‘Materials and methods’ for detailed information).
Figure 9
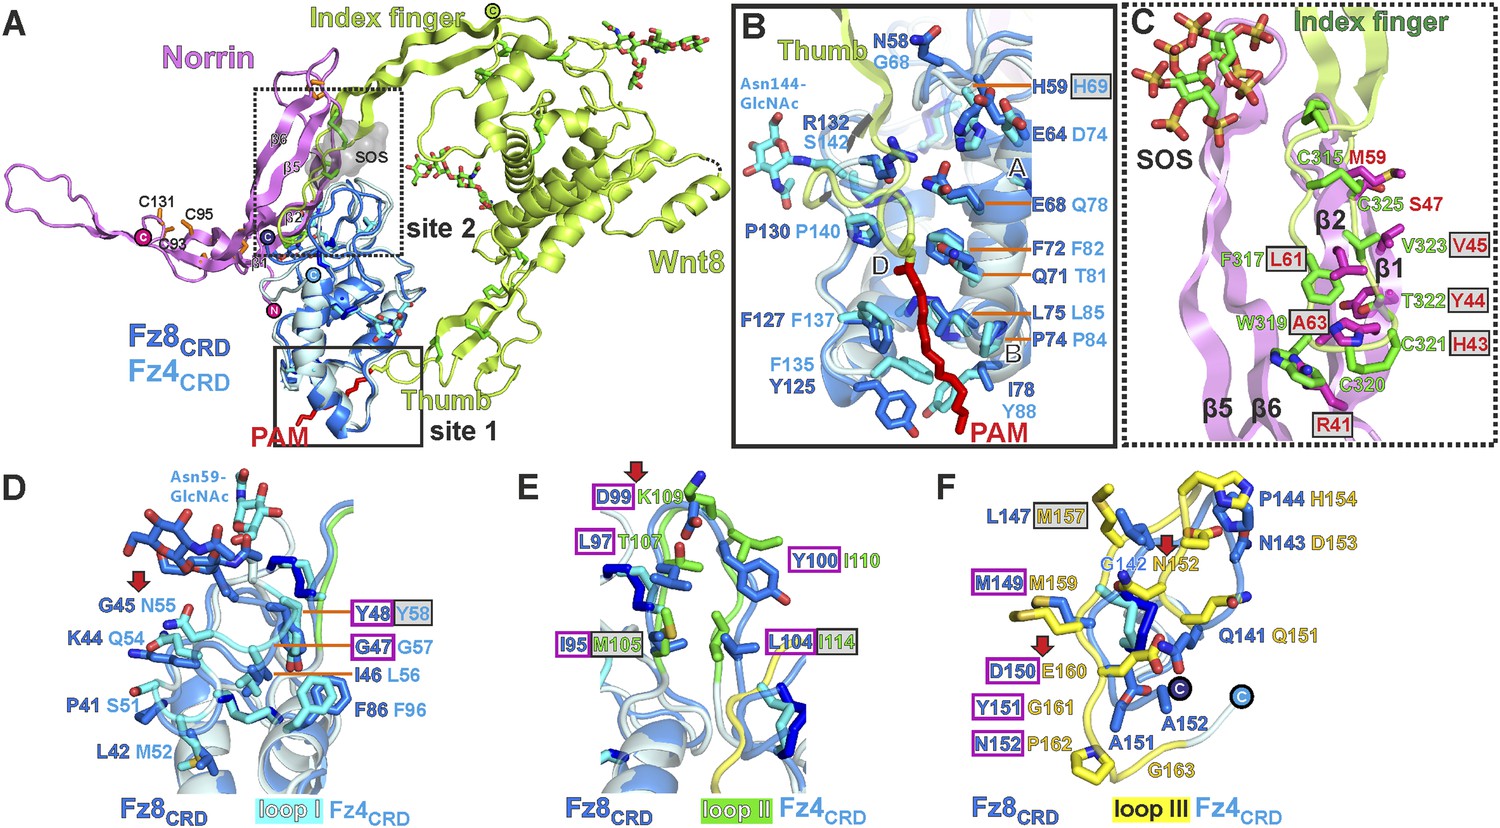
Structural comparison of Norrin–Fz4CRD with Wnt8–Fz8CRD.
(A) Superposition of Norrin (magenta)–Fz4CRD (cyan) with Wnt8 (green)–Fz8CRD (blue) (PDB ID: 4F0A). Disulphide bonds, N-linked glycans, and PAM (of Wnt8) are shown as sticks. SOS is shown as grey surface. (B) Comparison of site 1 (PAM binding) on Fz4CRD (cyan) and Fz8CRD (blue). Fz4 His69 is disease associated. (C) The Wnt8 index finger (site 2; green) structurally overlays Norrin (β1 and β2; magenta). Norrin residues associated with diseases are boxed. (D–F), Structural comparison of Fz4CRD and Fz8CRD for ligand binding. Loop I-III residues for Fz4CRD and Fz8CRD are shown as sticks. Fz8CRD residues for Wnt8 binding (site 2) are boxed in purple. Fz4 disease-associated residues are boxed. Red arrows indicate residue substitutions between Fz4CRD and Fz8CRD. Fz8CRD residues Tyr151 and Asn152 are modelled as alanines (PDB ID: 4F0A).
Tables
Table 1
Data collection, phasing and refinement statistics
| Norrin–Fz4CRD–SOS | Methylated Norrin–Fz4CRD | Norrin | Norrin Se-Met | Methylated Norrin | |
|---|---|---|---|---|---|
| Crystal form | I | I | II | ||
| Data collection | |||||
| Space group | P6122 | P4322 | P212121 | P212121 | P212121 |
| Cell dimensions | |||||
| a, b, c (Å) | 119.1, 119.1, 119.2 | 98.9, 98.9, 120.4 | 46.4, 79.1, 243.3 | 45.8, 78.8, 232.8 | 102.7, 53.1, 96.1 |
| α, β, γ (°) | 90, 90, 90 | 90, 90, 120 | 90, 90, 90 | 90, 90, 90 | 90, 90, 90 |
| Peak | |||||
| Wavelength | 0.9200 | 0.9795 | 0.9686 | 0.9795 | 0.9795 |
| Resolution (Å) | 47.34–3.00 (3.18– 3.00) | 49.46–2.30 (2.38–2.30) | 65.56–2.40 (2.49–2.40) | 116.39–3.18 (3.26–3.18) | 33.65–2.00 (2.05–2.00) |
| Rpim (%) | 3.1 (54.8) | 4.5 (56.1) | 6.1 (42.3) | 2.8 (23.4) | 4.1 (58.3) |
| I/σI | 14.6 (1.6) | 10.7 (1.4) | 7.8 (1.9) | 20.2 (3.0) | 9.1 (1.7) |
| Completeness (%) | 100 (100) | 98.9 (97.2) | 99.9 (100) | 99.9 (99.9) | 100 (100) |
| Redundancy | 19.6 (20.6) | 6.0 (5.6) | 5.6 (5.7) | 33.3 (9.9) | 5.6 (5.8) |
| Refinement | |||||
| Resolution (Å) | 47.34–3.00 (3.18–3.00) | 49.46–2.30 (2.38–2.30) | 65.56–2.40 (2.49–2.40) | 33.65–2.00 (2.05–2.00) | |
| No. reflections | 10,503 (1648) | 26,816 (2514) | 34,722 (3384) | 36,272 (2635) | |
| Rwork/Rfree | 21.5/26.7 | 19.7/22.1 | 21.6/26.2 | 23.3/24.8 | |
| No. atoms | |||||
| Protein | 1759 | 2557 | 4930 | 3187 | |
| Ligand/ion | 83 | 39 | 101 | 10 | |
| Water | 0 | 115 | 164 | 122 | |
| B-factors | |||||
| Protein | 113 | 63 | 70 | 57 | |
| Ligand/ion | 133 | 71 | 92 | 73 | |
| Water | 0 | 57 | 55 | 51 | |
| R.m.s deviations | |||||
| Bond lengths (Å) | 0.005 | 0.004 | 0.009 | 0.005 | |
| Bond angles (°) | 1.18 | 0.93 | 1.08 | 1.07 | |
| Ramachandran plot | |||||
| Favored (%) | 95.5 | 97.0 | 96.7 | 97.2 | |
| Allowed (%) | 4.5 | 3.0 | 3.3 | 2.8 | |
| PDB code | 5BQC | 5BQE | 5BPU | 5BQ8 | |
| Norrin | Fz4CRD | Fz4CRD | |
|---|---|---|---|
| Crystal form | III | I | II |
| Data collection | |||
| Space group | C121 | P212121 | P61 |
| Cell dimensions | |||
| a, b, c (Å) | 86.8, 38.1, 177.2 | 72.6, 102.1, 116.5 | 76.1, 76.1, 204.5 |
| α, β, γ (°) | 90, 94, 90 | 90, 90, 90 | 90, 90, 90 |
| Wavelength | 0.9795 | 0.9686 | 0.9686 |
| Resolution (Å) | 44.19–2.30 (2.38–2.30) | 41.77–2.20 (2.27–2.20) | 47.37–2.40 (2.49–2.40) |
| Rpim (%) | 2.8 (36) | 4.1 (49.5) | 2.6 (33.9) |
| I/σI | 16.7 (2.0) | 12.8 (2.0) | 14.5 (2.2) |
| Completeness (%) | 99.2 (97.7) | 99.2 (99.7) | 99.5 (99.4) |
| Redundancy | 5.8 (6.0) | 4.3 (4.4) | 4.0 (4.1) |
| Refinement | |||
| Resolution (Å) | 44.19–2.30 (2.38–2.30) | 41.77–2.20 (2.27–2.20) | 47.37–2.40 (2.49–2.40) |
| No. reflections | 26,073 (2538) | 44,268 (3802) | 25,975 (2724) |
| Rwork/Rfree | 22.1/25.0 | 17.7/22.3 | 20.3/24.3 |
| No. atoms | |||
| Protein | 3104 | 3866 | 3877 |
| Ligand/ion | 72 | 70 | 99 |
| Water | 54 | 148 | 69 |
| B-factors | |||
| Protein | 91 | 47 | 76 |
| Ligand/ion | 72 | 67 | 72 |
| Water | 142 | 43 | 68 |
| R.m.s deviations | |||
| Bond lengths (Å) | 0.006 | 0.01 | 0.005 |
| Bond angles (°) | 1.03 | 1.35 | 0.94 |
| Ramachandran plot | |||
| Favored (%) | 96.0 | 99.0 | 97.0 |
| Allowed (%) | 4.0 | 1.0 | 3.0 |
| PDB code | 5BQB | 5BPB | 5BPQ |
-
All structures were determined from one crystal.
-
Values in parentheses are for highest-resolution shell.
Table 2
Molecular properties of the proteins determined by SAXS
| Proteins | N-Glyc state | Rg (nm)* | Dmax (nm)† | Volume porod (Vp [nm3]) | MWTheoretical (kDa)‡ | MWMeasured (KDa)§ | MWMeasured (KDa)# |
|---|---|---|---|---|---|---|---|
| Fz4CRD | deglyc¶ | 1.98 | 6.93 | 33.0 | 17.1 (monomer) | 15.9 | 19.9 |
| Fz4CRD | glyc** | 2.24 | 7.84 | 41.1 | 21.4 (monomer) | 23.7 | 24.7 |
| Norrin | 2.74 | 9.18 | 37.4 | 27.2 (dimer) | 33.5 | 22.5 | |
| Norrin–Fz4CRD | deglyc¶ | 3.41 | 11.92 | 93.8 | 61.3 (2:2 complex) | 57.9 | 56.5 |
-
*
Rg is Radius of gyration, calculated from Guinier plot using AutoRg (Petoukhov et al., 2012).
-
†
Dmax is the maximum dimension of the particle, calculated by GNOM (Svergun, 1992).
-
‡
The theoretical molecular weight (MWTheoretical) is predicated from amino acid sequence plus the molecular weight of N-linked glycans (see ‘Materials and methods’, SEC-MELS analysis for detailed information of calculation).
-
§
The measured molecular weight (MWMeasured) is calculated from forward scattering of sample (I(0)) by comparison with reference bovine serum albumin (BSA).
-
#
The measured molecular weight (MWMeasured) is obtained by dividing the Volume Porod (Vp [nm3]) by 1.66 (Rambo and Tainer, 2011).
-
¶
The proteins were produced from HEK293T cells in the presence of kifunensine with limited glycosylation and treated with endoglycosidase-F1.
-
**
The proteins were produced from HEK293T cells with full glycosylation.
Table 3
Molecular properties of the proteins determined by SEC-MALS
| Protein | Number of N-glyc sites | N-Glyc state | MWTheoretical (kDa)‡ | MWMeasured (KDa) |
|---|---|---|---|---|
| Fz4CRD | 2 | deglyc* | 17.1 (monomer) | 15.7 ± 0.4 |
| Fz4CRD | 2 | glyc† | 21.4 (monomer) | 23.6 ± 0.3 |
| mFz5CRD | 2 | glyc† | 22.2 (monomer) | 23.9 ± 0.9 |
| mFz8CRD | 2 | glyc† | 22.1 (monomer) | 23.7 ± 0.2 |
| Norrin–Fz4CRD | 4 (2:2 complex) | deglyc* | 61.3 (2:2 complex) | 60.1 ± 0.4 |
| Norrin–Fz4CRD | 4 (2:2 complex) | glyc† | 69.9 (2:2 complex) | 61.3 ± 0.5 |
-
*
The proteins were produced from HEK293T cells in the presence of the N-glycosylation processing inhibitors, kifunensine resulting in limited glycosylation and were treated with endoglycosidase-F1.
-
†
The proteins were produced from HEK293T cells with full glycosylation.
-
‡
The measured molecular weight (MWMeasured) is in general agreement with theoretical molecular weight (MWTheoretical) predicated based on the primary sequence plus the molecular weight of N-linked glycans (see ‘Materials and methods’, SEC-MELS analysis for detailed information of calculation).
Download links
A two-part list of links to download the article, or parts of the article, in various formats.
Downloads (link to download the article as PDF)
Open citations (links to open the citations from this article in various online reference manager services)
Cite this article (links to download the citations from this article in formats compatible with various reference manager tools)
Structure and functional properties of Norrin mimic Wnt for signalling with Frizzled4, Lrp5/6, and proteoglycan
eLife 4:e06554.
https://doi.org/10.7554/eLife.06554


