The mucosal adjuvant cyclic di-GMP enhances antigen uptake and selectively activates pinocytosis-efficient cells in vivo
- Albany Medical College, United States
Figures
Figure 1
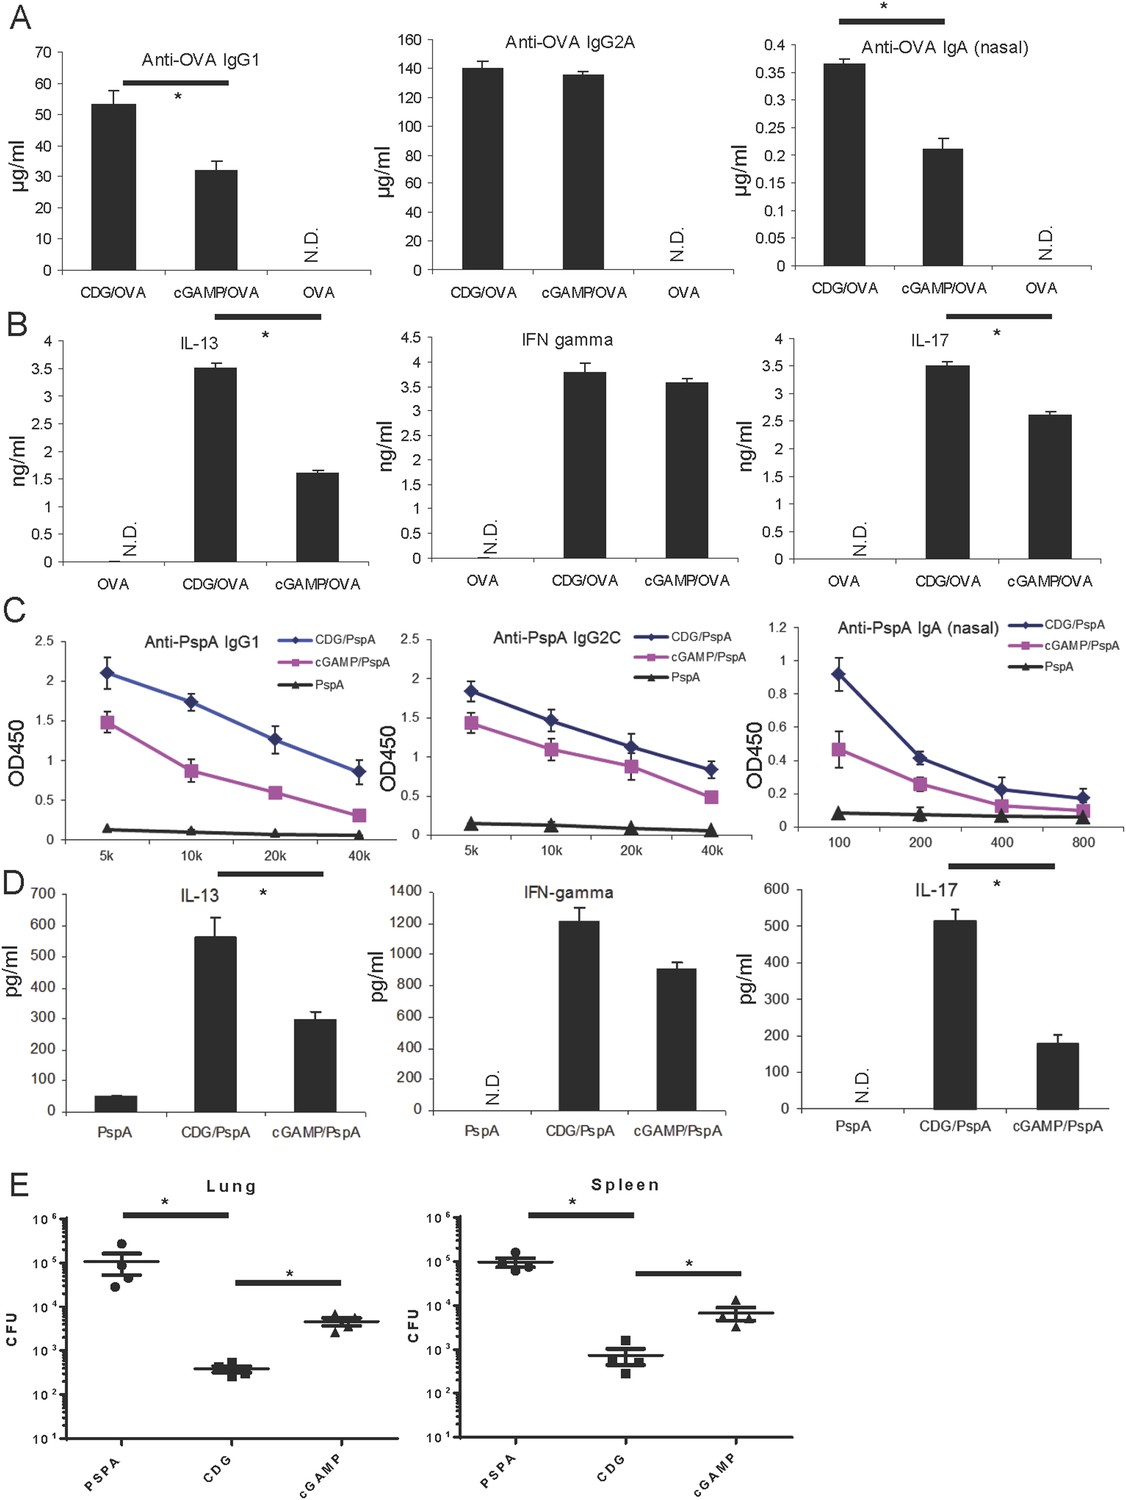
Cyclic di-GMP (CDG) is a better mucosal pneumococcal vaccine adjuvant than the mammalian cyclic dinucleotide 2′3′-cyclic GMP-AMP (cGAMP) in mice.
(A) BALB/c mice were intranasally (i.n.) immunized with three doses (14 days apart) of OVA (20 μg) alone or together with 5 μg CDG or 5 μg 2′3′-cGAMP. Each group consisted of four mice. Sera or nasal washes from the 4 mice in the same group were pooled. Blood and nasal washes samples were collected 14 days after the last immunization. Anti-OVA IgG1, IgG2A, and IgA were quantified by ELISA. n = 3. (B) Splenocytes from immunized BALB/c mice were stimulated with 50 μg/ml OVA for 4 days in culture. Supernatants from the same group were pooled together. Cytokines were measured in the supernatant by ELISA. n = 3. (C) C57BL/6 mice were immunized with 3 doses of pneumococcal surface protein A (PspA) (2 μg) alone or together with 5 μg CDG or 5 μg 2′3′-cGAMP as in A. Blood and nasal washes were collected 14 days after the last immunization. Anti-PspA IgG1, IgG2C, and IgA were measured by ELISA as in A. n = 3. (D) Splenocytes from immunized C57BL/6 mice were stimulated with 5 μg/ml PspA for 4 days in culture. Cytokines were measured in the supernatant by ELISA as in B. n = 3. (E) Immunized mice were infected (i.n.) with S. pneumoniae (∼5.0 × 10⁶ c.f.u.). At 48 hr post infection, lung and spleen bacterial burden were determined. n = 2. Graph present means ± standard error from three independent experiments. Significance is represented by an asterisk, where p < 0.05.
Figure 2
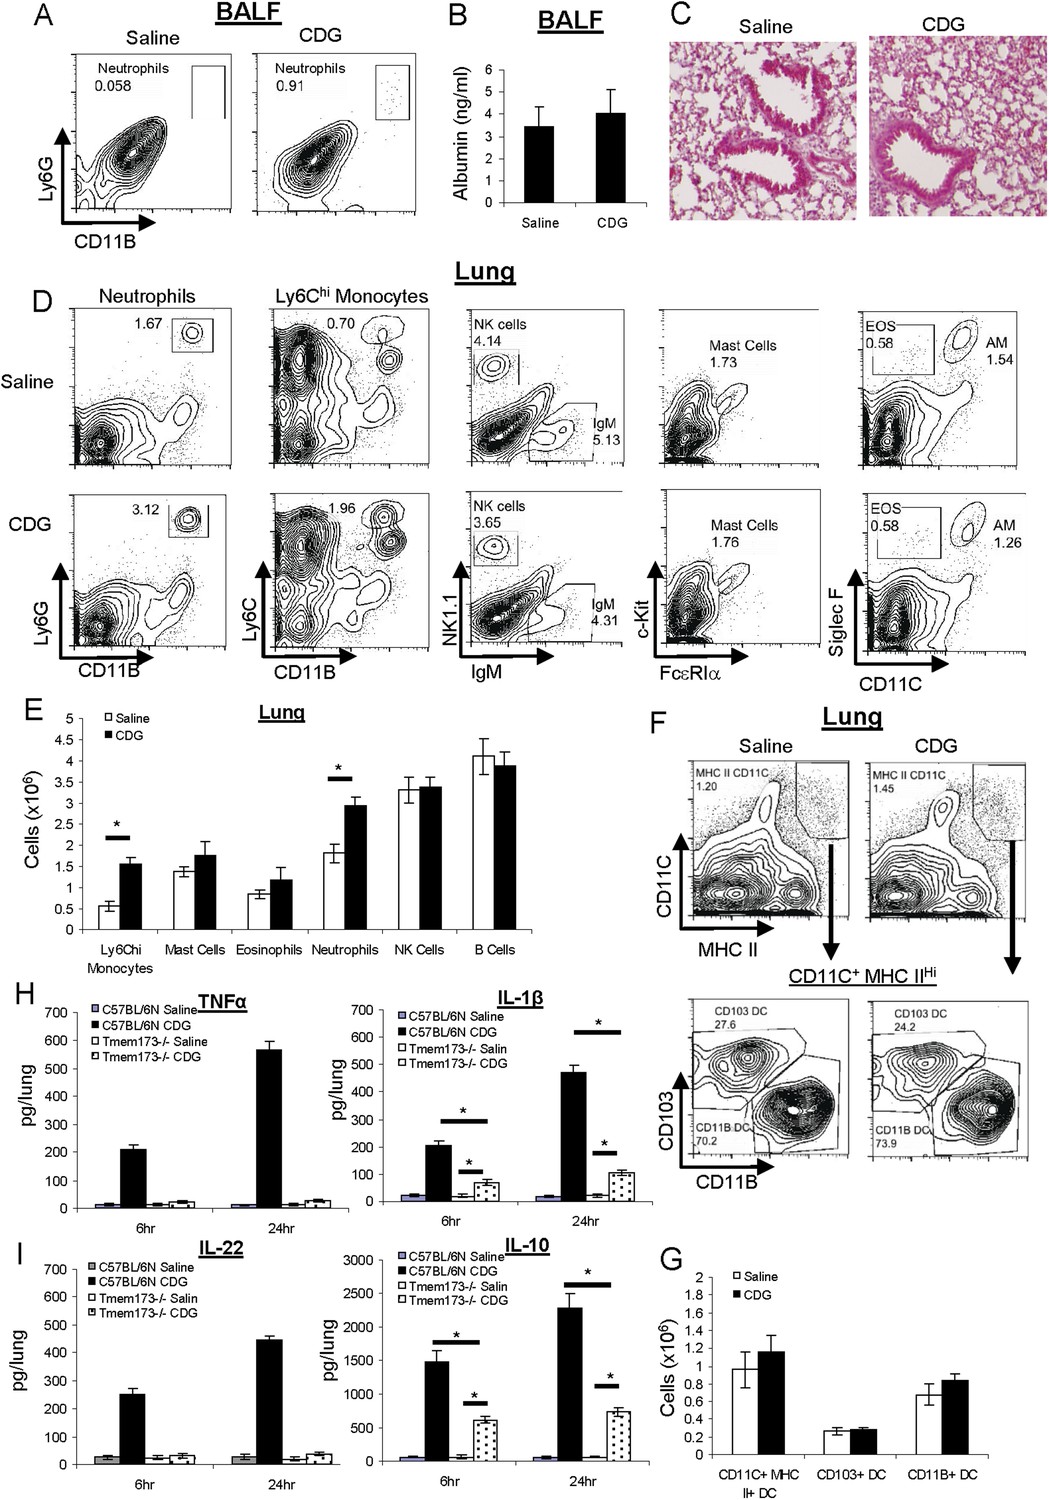
CDG does not cause lung injury or excess inflammatory responses in vivo.
(A) C57BL/6 mice were treated (i.n.) with saline or CDG (5 μg) for 20 hr. Cells in Bronchoalveolar lavage fluid (BALF) were analyzed by FACScan with indicated Abs. Live cells were gated. n > 3. (B) Serum albumin level in the collected BALF was measured by ELISA (#GWB-282C17; GenWay). n = 3. (C) Lung sections from treated mice were fixed and histology was determined by Hematoxylin and eosin stain. n = 3. (D–G) Mice were treated as in A. Lung cells were analyzed by FACScan with indicated Abs and quantified. Live cells were gated. n = 3. (H–I) C57BL/6 and MPYS−/− mice were treated (i.n.) with saline or CDG (5 μg) for the indicated time. Cytokines were determined in lung homogenates by ELISA. n > 3. Graph present means ± standard error from three independent experiments. Significance is represented by an asterisk, where p < 0.05.
Figure 3 with 1 supplement
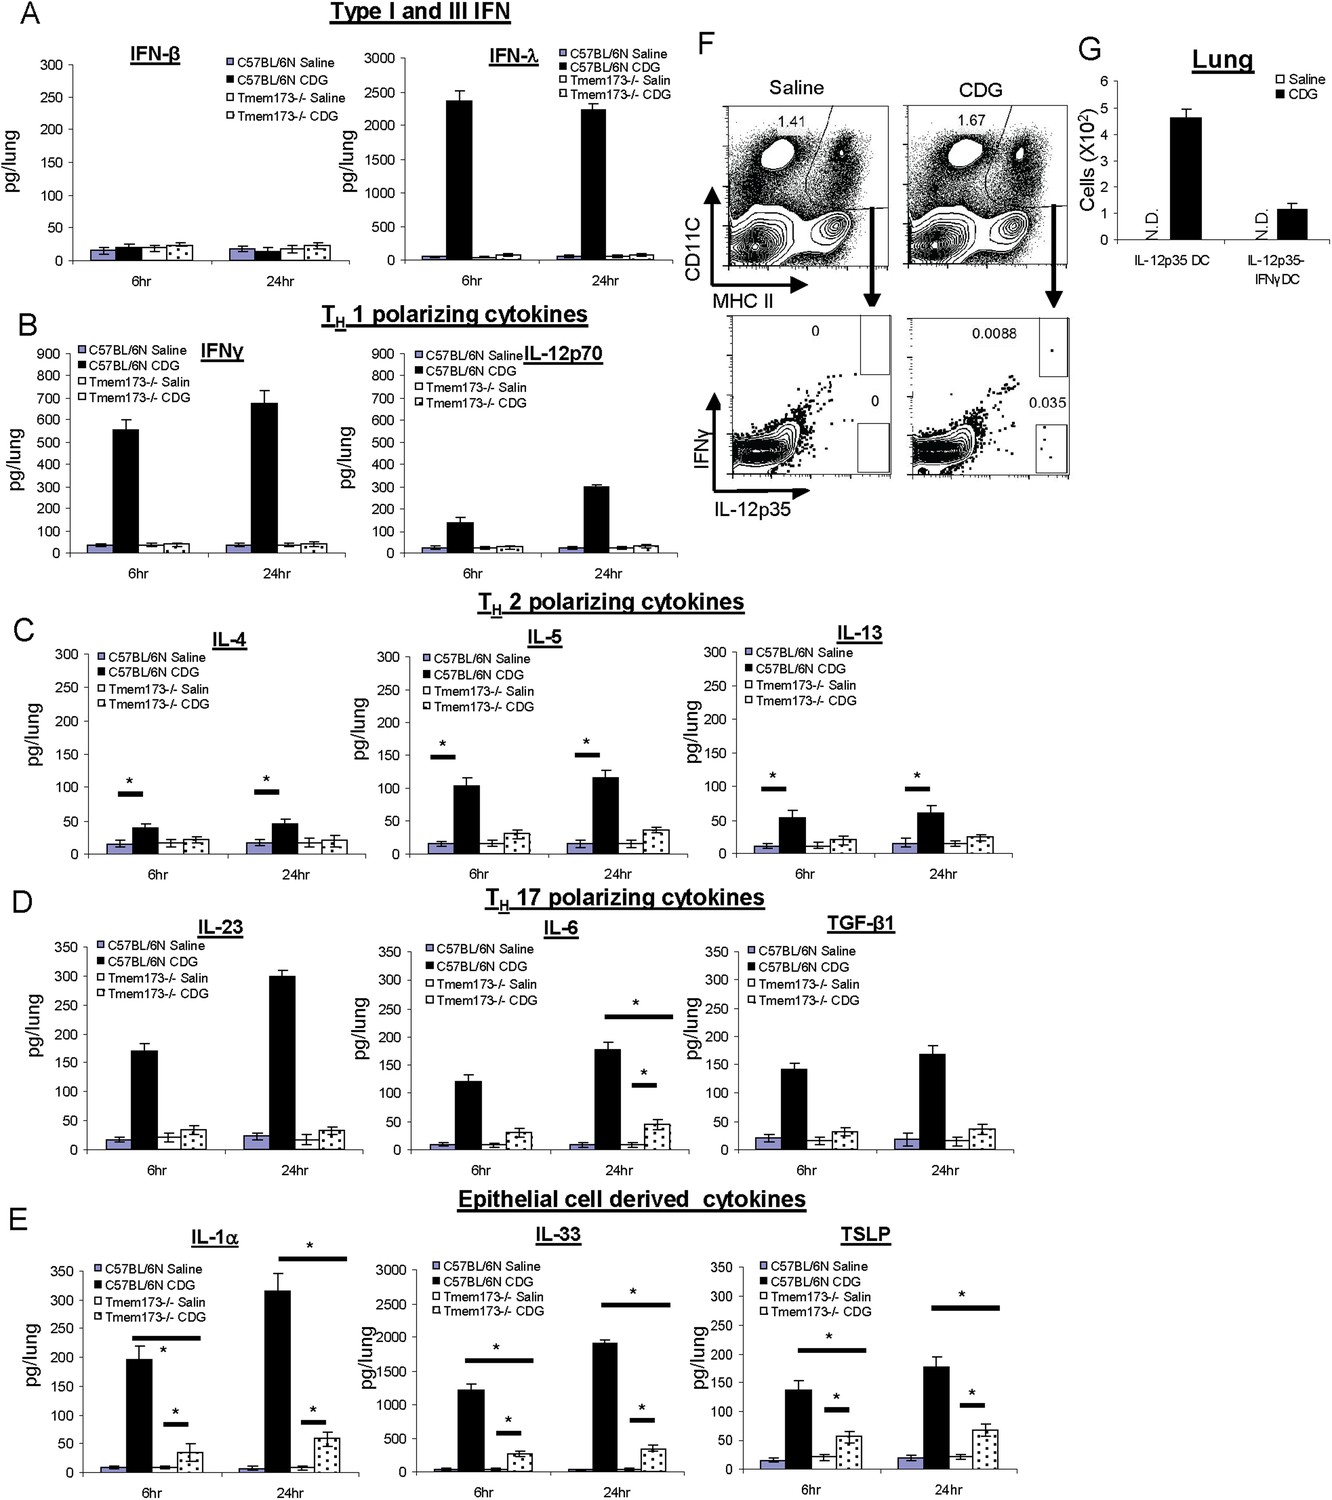
CDG induces a variety of cytokines in lung that is dependent on the expression of MPYS.
(A–E) C57BL/6 and Tmem173−/− mice were treated (i.n.) with saline or CDG (5 μg) for the indicated time. Cytokines were determined in lung homogenates by ELISA. n > 3. (F–G) C57BL/6 mice were treated (i.n.) with saline or CDG (5 μg) for 5 hr. IL-12-p35 and IFNγ positive dendritic cells (DCs) were identified by intracellular cytokine stains and quantified. n = 3. Graph present means ± standard error from three independent experiments. Significance is represented by an asterisk, where p < 0.05.
Figure 3—figure supplement 1
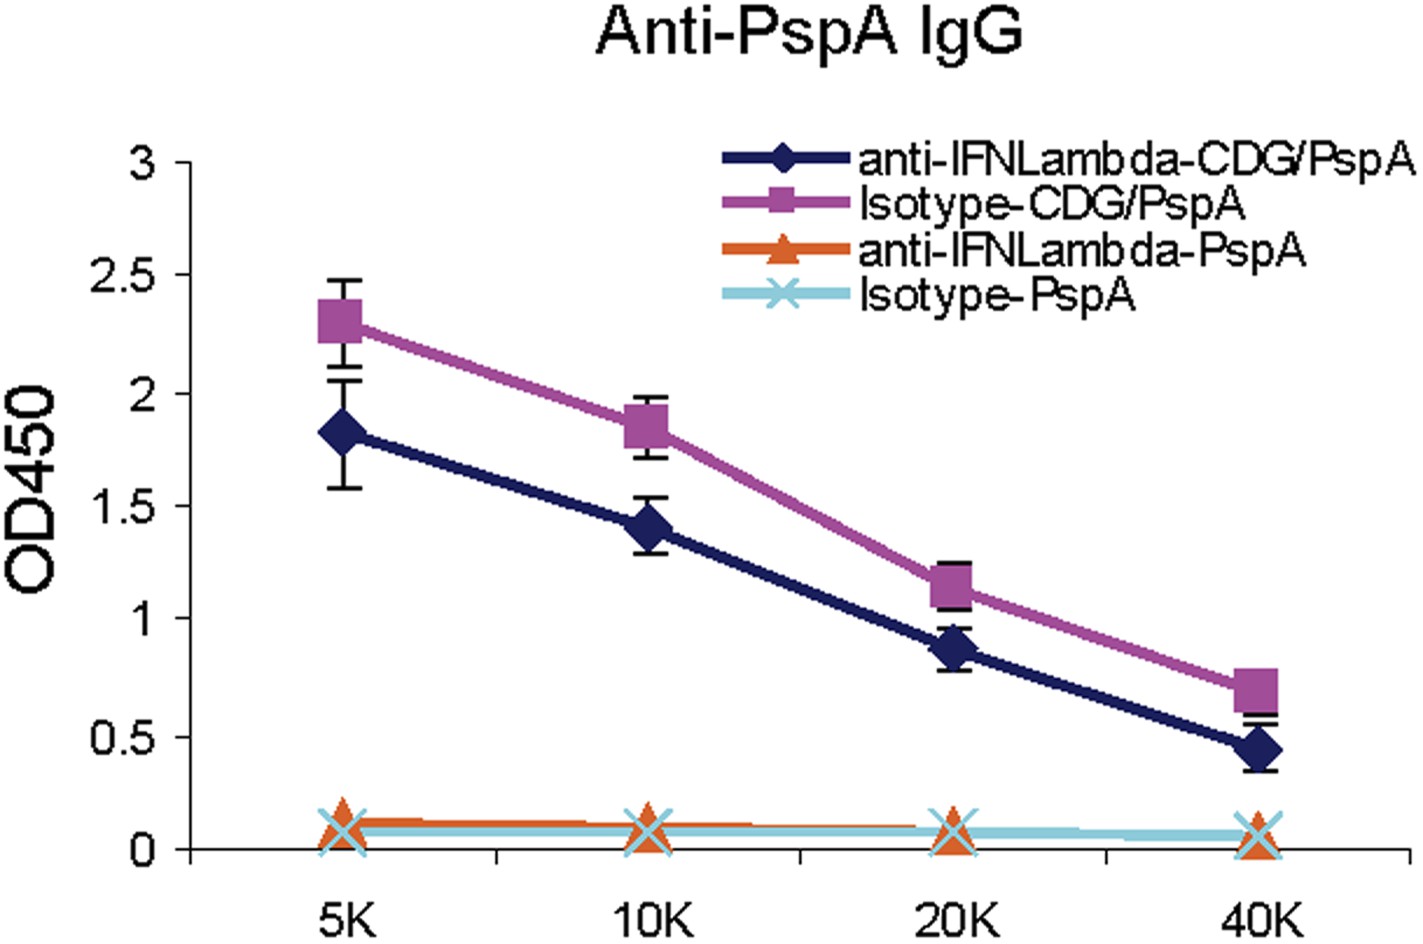
IFNλ production is dispensable for the mucosal adjuvant activity of CDG.
https://doi.org/10.7554/eLife.06670.006
Figure 4
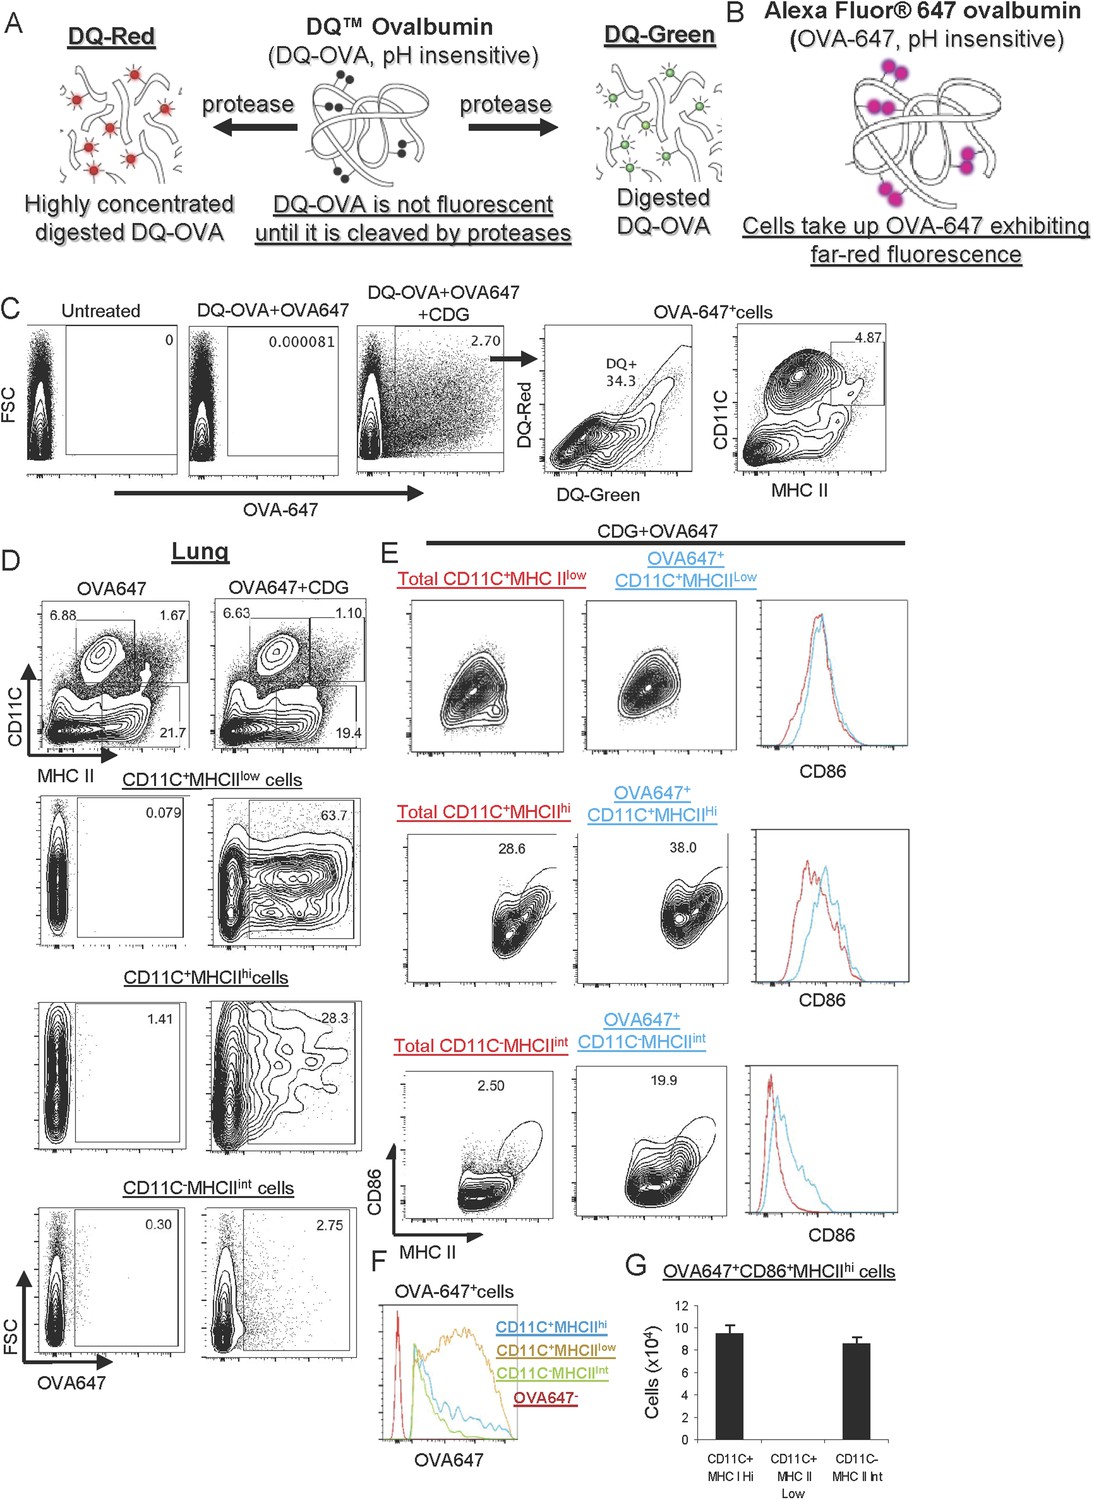
CDG enhances Ag uptake and activates pinocytosis-efficient antigen presenting cells (APCs) in vivo.
(A–B) A cartoon showing mechanism of action of DQ-OVA (A) and OVA-647 (B). (C) Flow cytometry analysis of lung cells from C57BL/6 mice treated with saline, DQ-OVA(20 μg) + OVA-647(20 μg) or 5 μg CDG + DQ-OVA(20 μg) + OVA-647(20 μg) for 20 hr. Live cells were gated. n > 3. (D) Flow cytometry analysis of lung cells from C57BL/6 mice treated with OVA-647(20 μg) or 5 μg CDG + OVA-647(20 μg) for 20 hr. Live cells were gated. n > 3. (E) Flow cytometry analysis of lung APCs from C57BL/6 mice treated with 5 μg CDG + OVA-647(20 μg) for 20 hr. Live cells were gated. n > 3. (F) Histogram of OVA-647 signals from OVA-647+ APCs. n > 3. (G) Cell numbers of activated OVA-647+ APCs were quantified. n > 3. Graph present means ± standard error from three independent experiments.
Figure 5
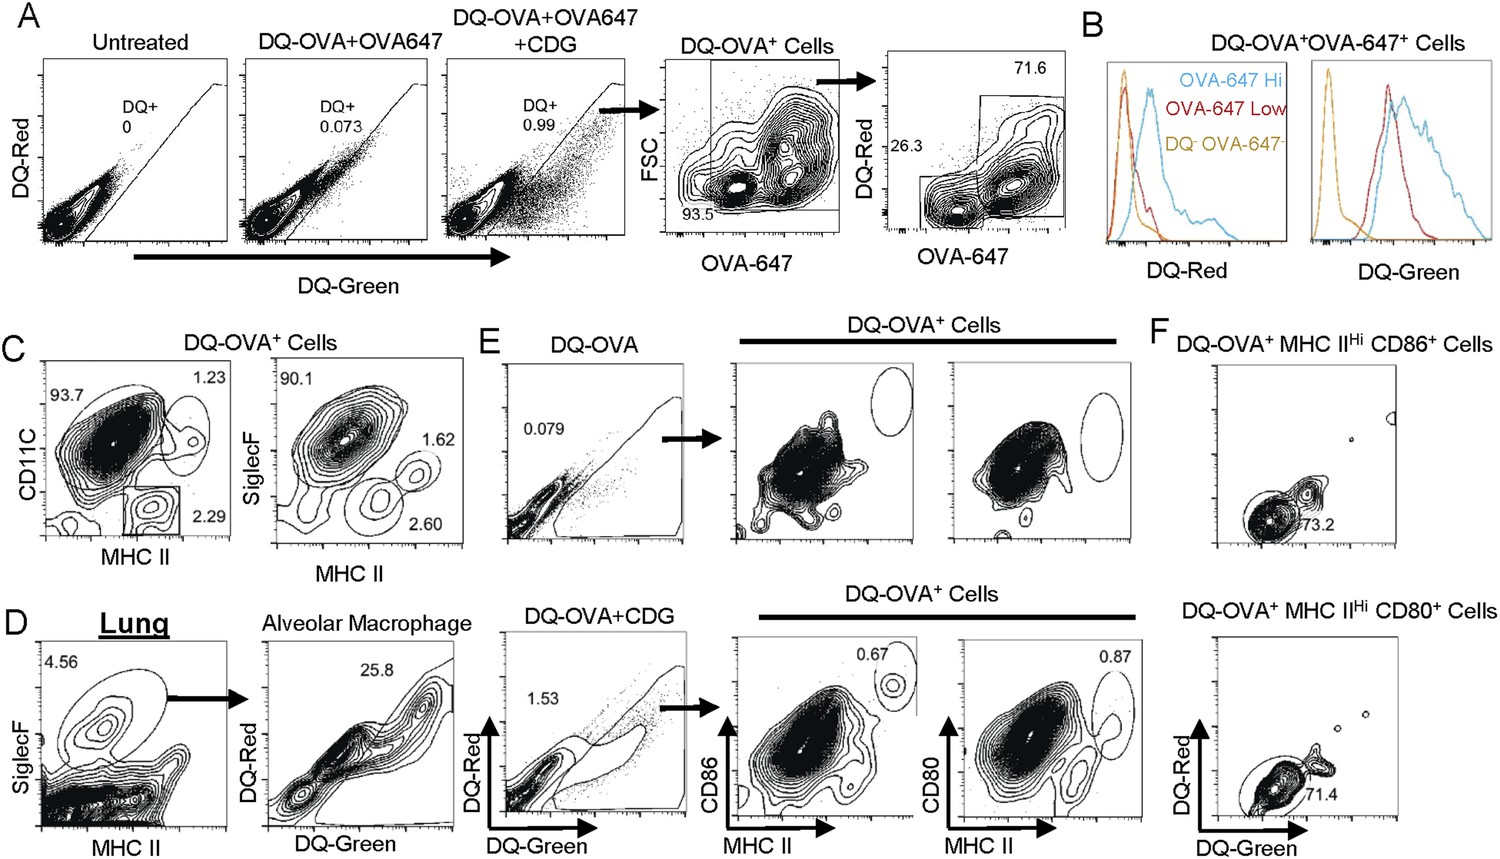
CDG generates mature DCs in vivo.
(A) Flow cytometry analysis of lung cells from C57BL/6 mice treated with saline, DQ-OVA(20 μg) + OVA-647(20 μg) or 5 μg CDG + DQ-OVA(20 μg) + OVA-647(20 μg). Live cells were gated. n > 3. (B) Histogram of DQ-Red and DQ-Green signals from indicated populations. n > 3. (C) Flow cytometry analysis of DQ+ lung cells from CDG + DQ-OVA treated (i.n.) C57BL/6 mice. Live DQ+ cells were gated. n > 3. (D) Flow cytometry analysis of lung cells from CDG + DQ-OVA treated (i.n.) C57BL/6 mice. Live cells were gated. n = 3. (E) Flow cytometry analysis of DQ+ lung cells from DQ-OVA or CDG + DQ-OVA treated (i.n.) C57BL/6 mice. Live were gated. n > 3. (F) Flow cytometry analysis of the indicated population from lung cells of CDG + DQ-OVA treated (i.n.) C57BL/6 mice. Gated on live DQ+ CD80+MHC II+ or live DQ+ CD86+MHC II+ cells. n > 3.
Figure 6
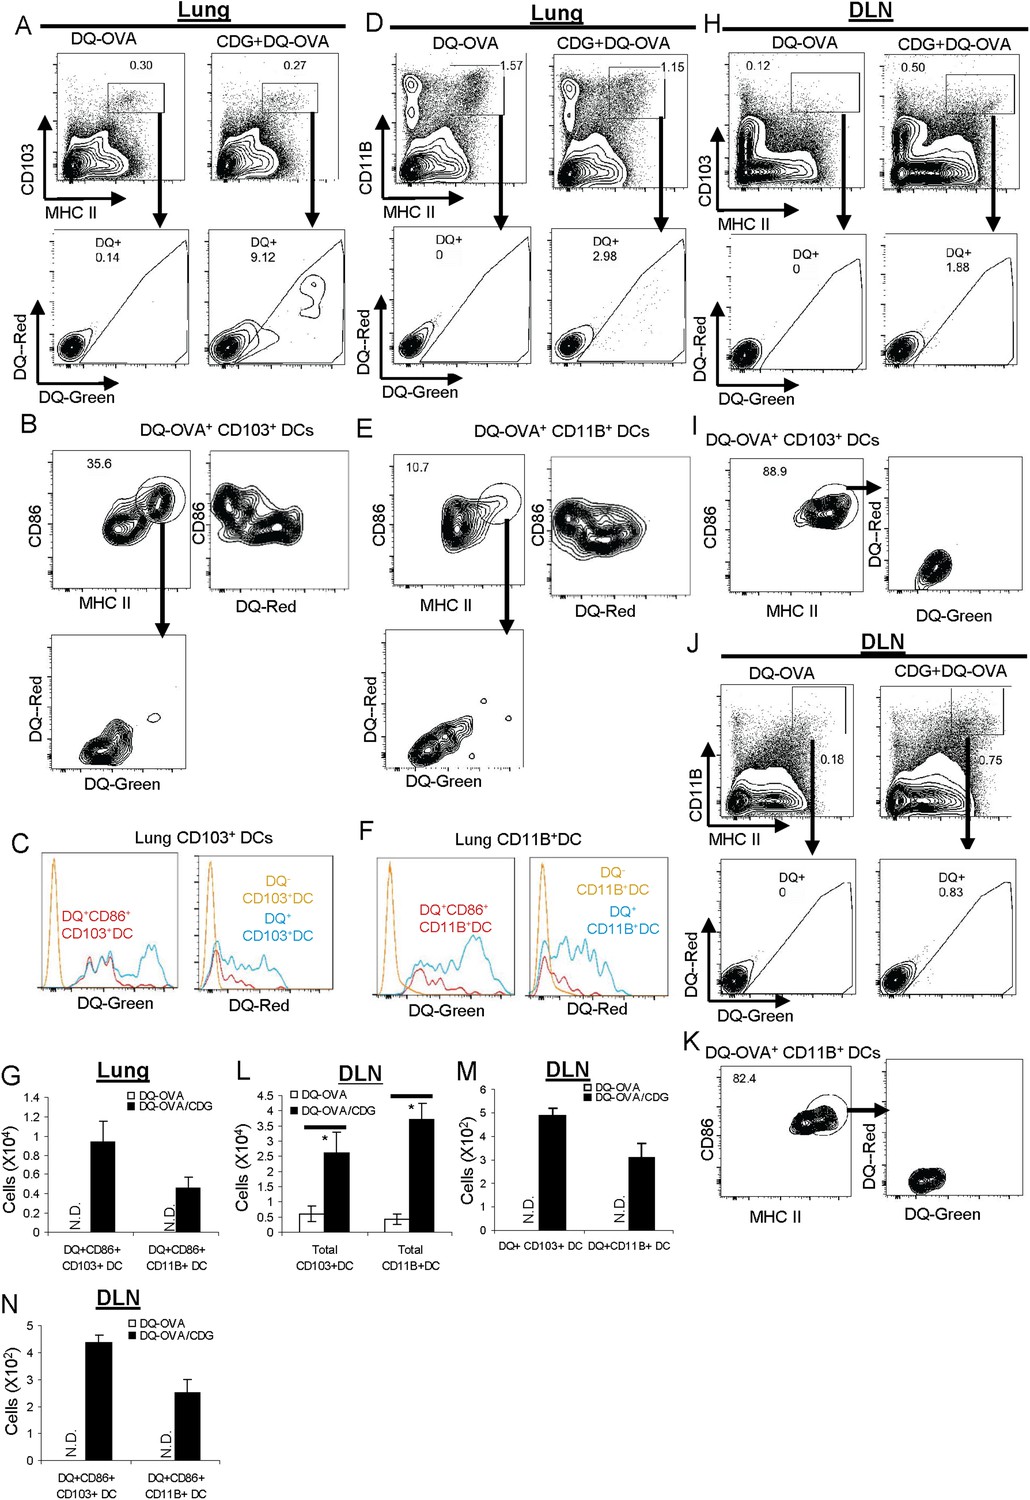
CDG activates pinocytosis-efficient CD103+ and CD11B+ DCs in vivo.
(A and D) Flow cytometry analysis of lung cells from C57BL/6 mice treated (i.n.) with DQ-OVA (20 μg) or CDG (5 μg) + DQ-OVA (20 μg) for 20 hr. Live cells were gated. n > 3. (B and E) Flow cytometry analysis of DQ+ DCs from lung of CDG + DQ-OVA treated C57BL/6 mice. Cells were gated on live DQ+CD103+MHC II+ or live DQ+CD11B+MHC II+ cells. n > 3. (C and F) Histogram of DQ-Green and DQ-Red signals from cell populations in B and E. n > 3. (G) Total cell number of CD86+DQ+ DCs in lung. n = 3. (H and J) Flow cytometry analysis of lung draining lymph nodes (DLN) from DQ-OVA or CDG + DQ-OVA treated C57BL/6 mice. Live cells were gated. n = 3. (I and K) Flow cytometry analysis of DQ+ DCs in DLN of CDG + DQ-OVA treated C57BL/6 mice. Cells were gated on live DQ+CD103+MHC II+ or live DQ+CD11B+MHC II+ cells. n = 3. (L–N) Total cell numbers of DCs, DQ+DCs, and CD86+DQ+DCs in DLN from DQ-OVA or CDG + DQ-OVA treated mice. n = 3. Graph present means ± standard error from three independent experiments. Significance is represented by an asterisk, where p < 0.05.
Figure 7
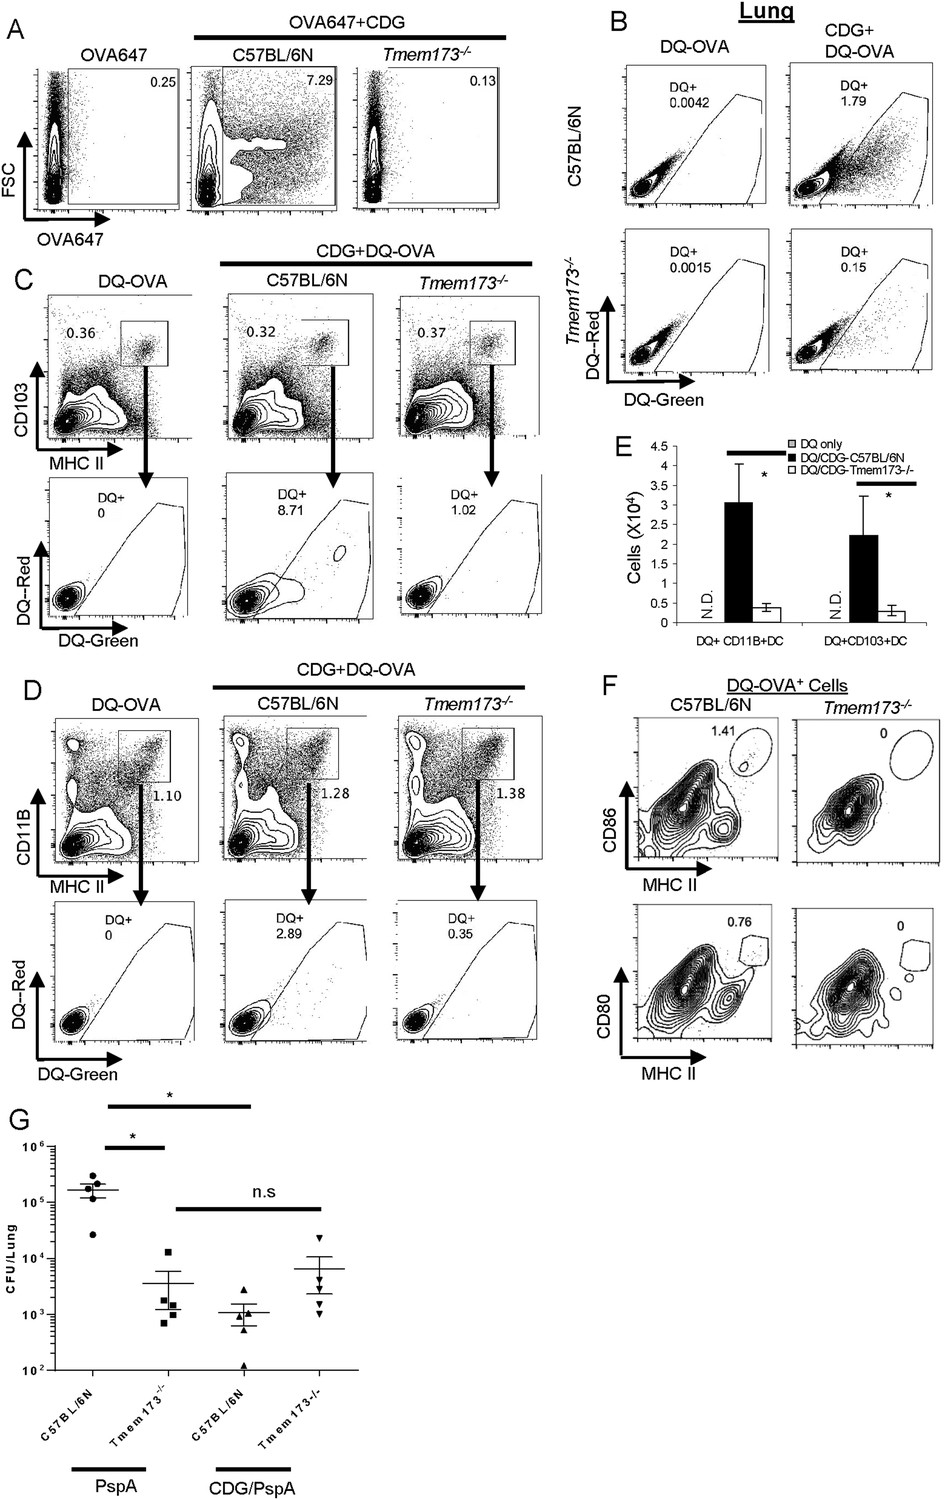
MPYS is critical for CDG induced Ag uptake and activation in vivo.
(A) Flow cytometry analysis of lung cells from OVA-647(20 μg) or OVA-647(20 μg) + CDG(5 μg) treated (i.n.) C57BL/6 or Tmem173−/− mice. Live cells were gated. n > 3. (B) Flow cytometry analysis of lung cells from DQ-OVA (20 μg) or DQ-OVA(20 μg) + CDG(5 μg) treated (i.n.) C57BL/6 or Tmem173−/− mice. Live cells were gated. n > 3. (C and D) Flow cytometry analysis of lung cells from C57BL/6 or Tmem173−/− mice treated with saline, DQ-OVA(20 μg) or 5 μg CDG + DQ-OVA(20 μg). Live cells were gated. n > 3. (E) DQ+CD103+DCs and DQ+CD11B+DCs numbers from DQ-OVA or CDG + DQ-OVA treated C57BL/6 and Tmem173−/− mice. n = 3. (F) Flow cytometry analysis of DQ+ lung cells from DQ-OVA(20 μg) + CDG(5 μg) treated (i.n.) C57BL/6 or Tmem173−/− mice. Live DQ+ cells were gated. n > 3. (G) One month after the last immunization, CDG/PspA or PspA immunized WT and Tmem173−/− mice were infected (i.n.) with S. pneumoniae (D39 strain, ∼5.0 × 10⁶ c.f.u.). At 48 hr post infection, lung bacterial burden was determined. n = 2. Graph present means ± standard error from three independent experiments. Significance is represented by an asterisk, where p < 0.05.
Figure 8 with 1 supplement
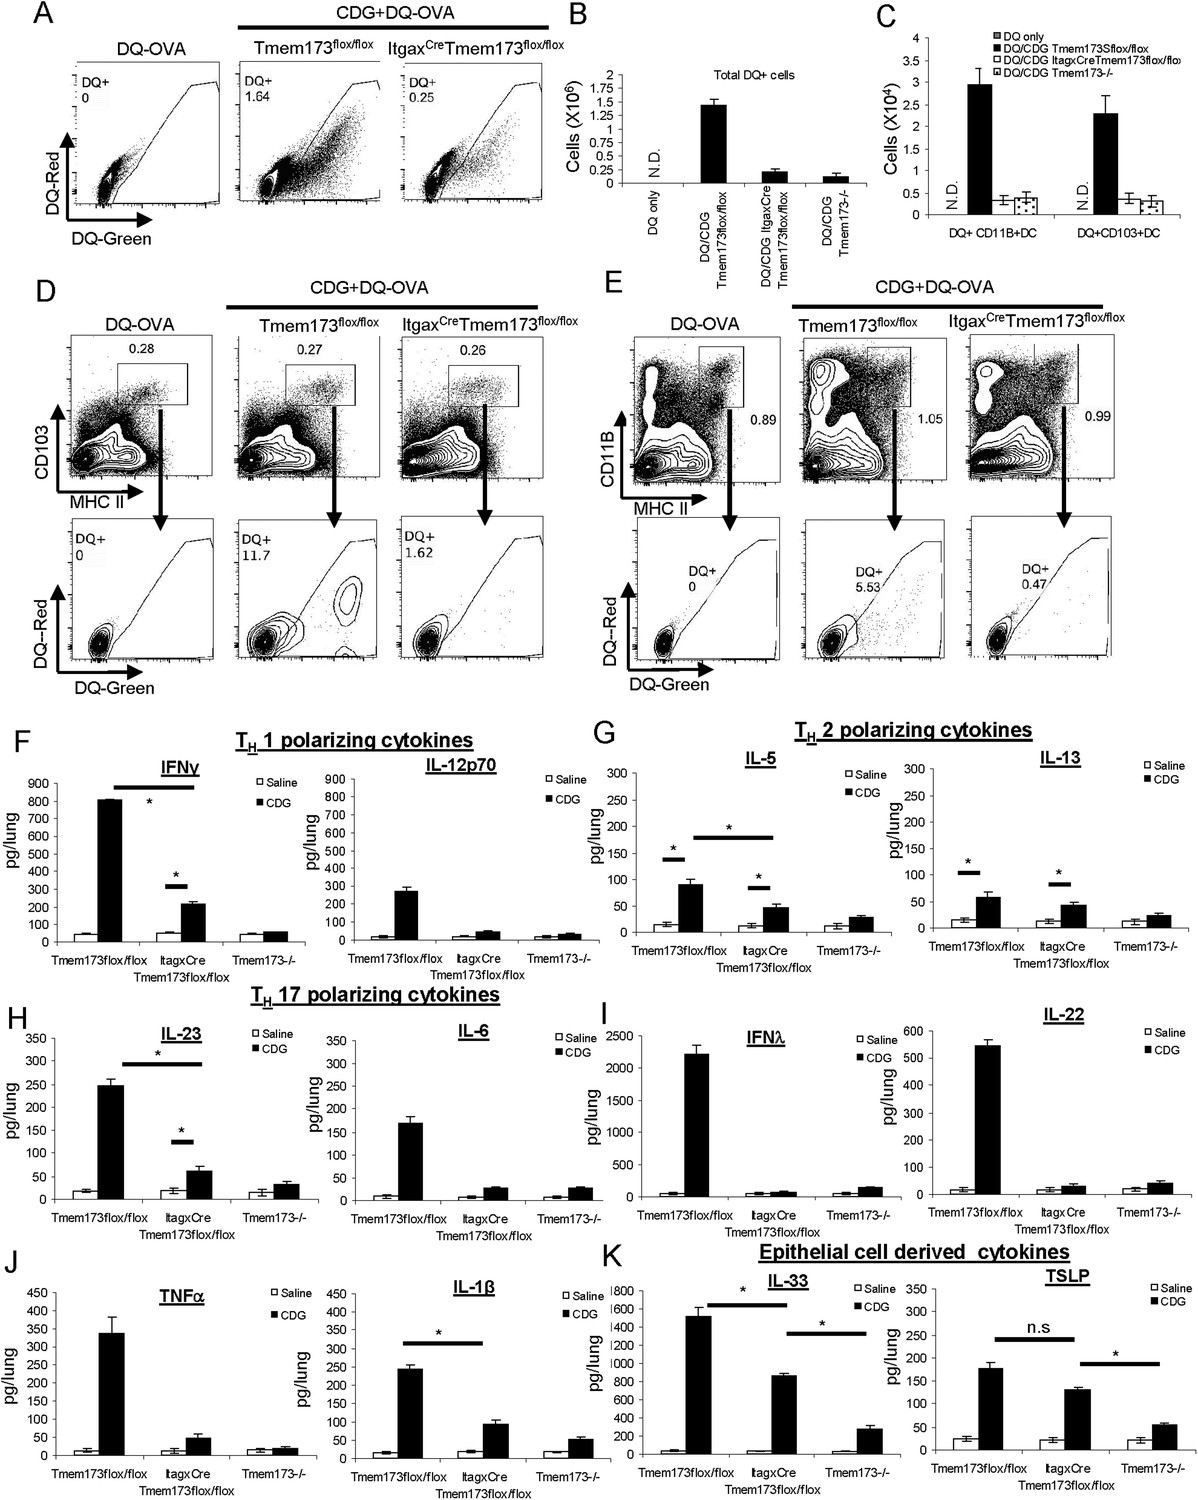
CDG induced DC Ag uptake and activation requires MPYS expression in CD11C+ cells.
(A) Flow cytometry analysis of lung cells from DQ-OVA (20 μg) or DQ-OVA(20 μg) + CDG(5 μg) treated (i.n.) Tmem173Flox/Flox or ItgaxCre Tmem173Flox/Flox mice. Live cells were gated. n = 3. (B) Total DQ+ lung cells from DQ-OVA or CDG + DQ-OVA treated Tmem173Flox/Flox, ItgaxCre Tmem173Flox/Flox, and Tmem173−/− mice. n = 3. (C) DQ+ DCs numbers from DQ-OVA or CDG + DQ-OVA treated Tmem173Flox/Flox, ItgaxCre Tmem173Flox/Flox and Tmem173−/− mice. n = 3. (D and E) Flow cytometry analysis of DQ+ DCs from lung of DQ-OVA or CDG + DQ-OVA treated mice Tmem173Flox/Flox, ItgaxCre Tmem173Flox/Flox. Live cells were gated. n = 3. (F–K) Tmem173Flox/Flox, ItgaxCreTmem173Flox/Flox or Tmem173−/− mice were treated with saline or CDG (5 μg) for 20 hr. Indicated cytokines were measured in lung homogenates by ELISA. n = 3. Graph present means ± standard error from three independent experiments. Significance is represented by an asterisk, where p < 0.05.
Figure 8—figure supplement 1
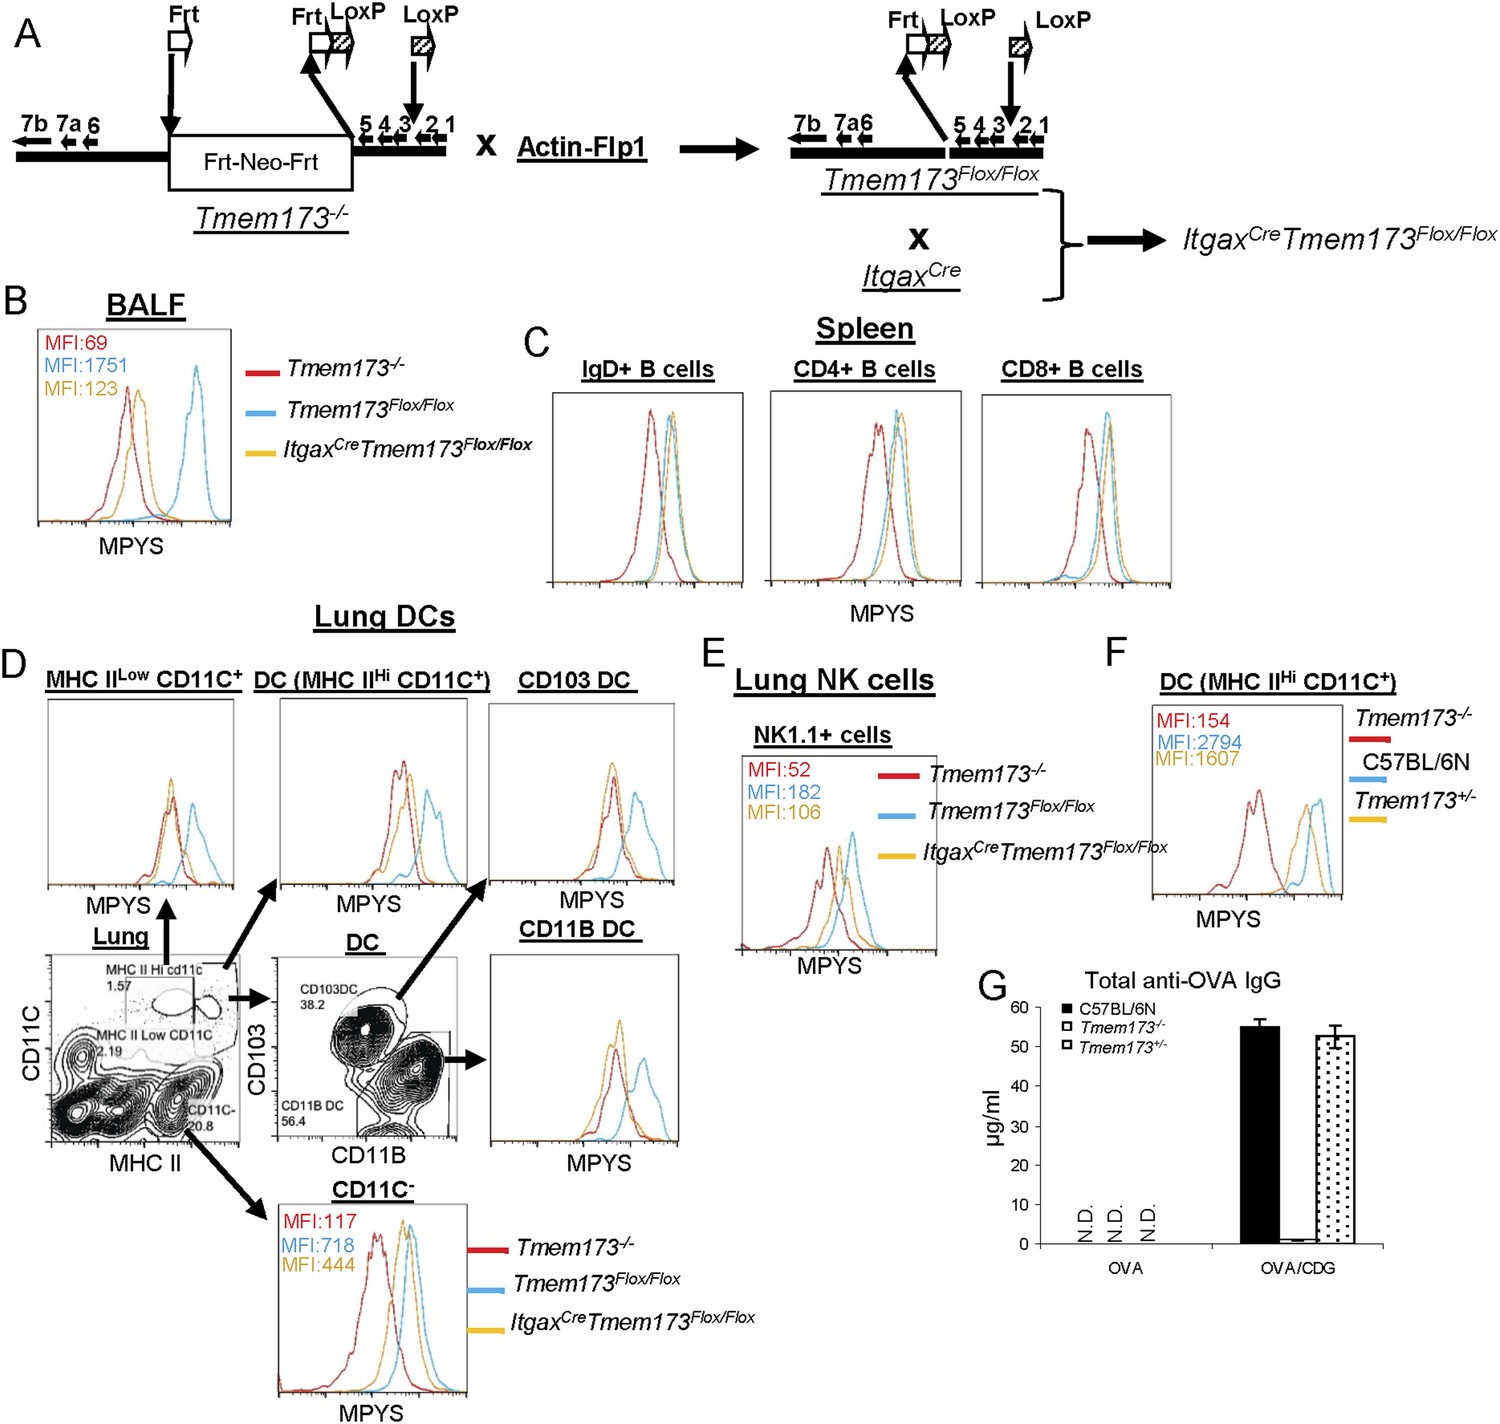
Generation of ItgaxCreTmem173Flox/Flox mouse.
https://doi.org/10.7554/eLife.06670.012
Figure 9 with 1 supplement
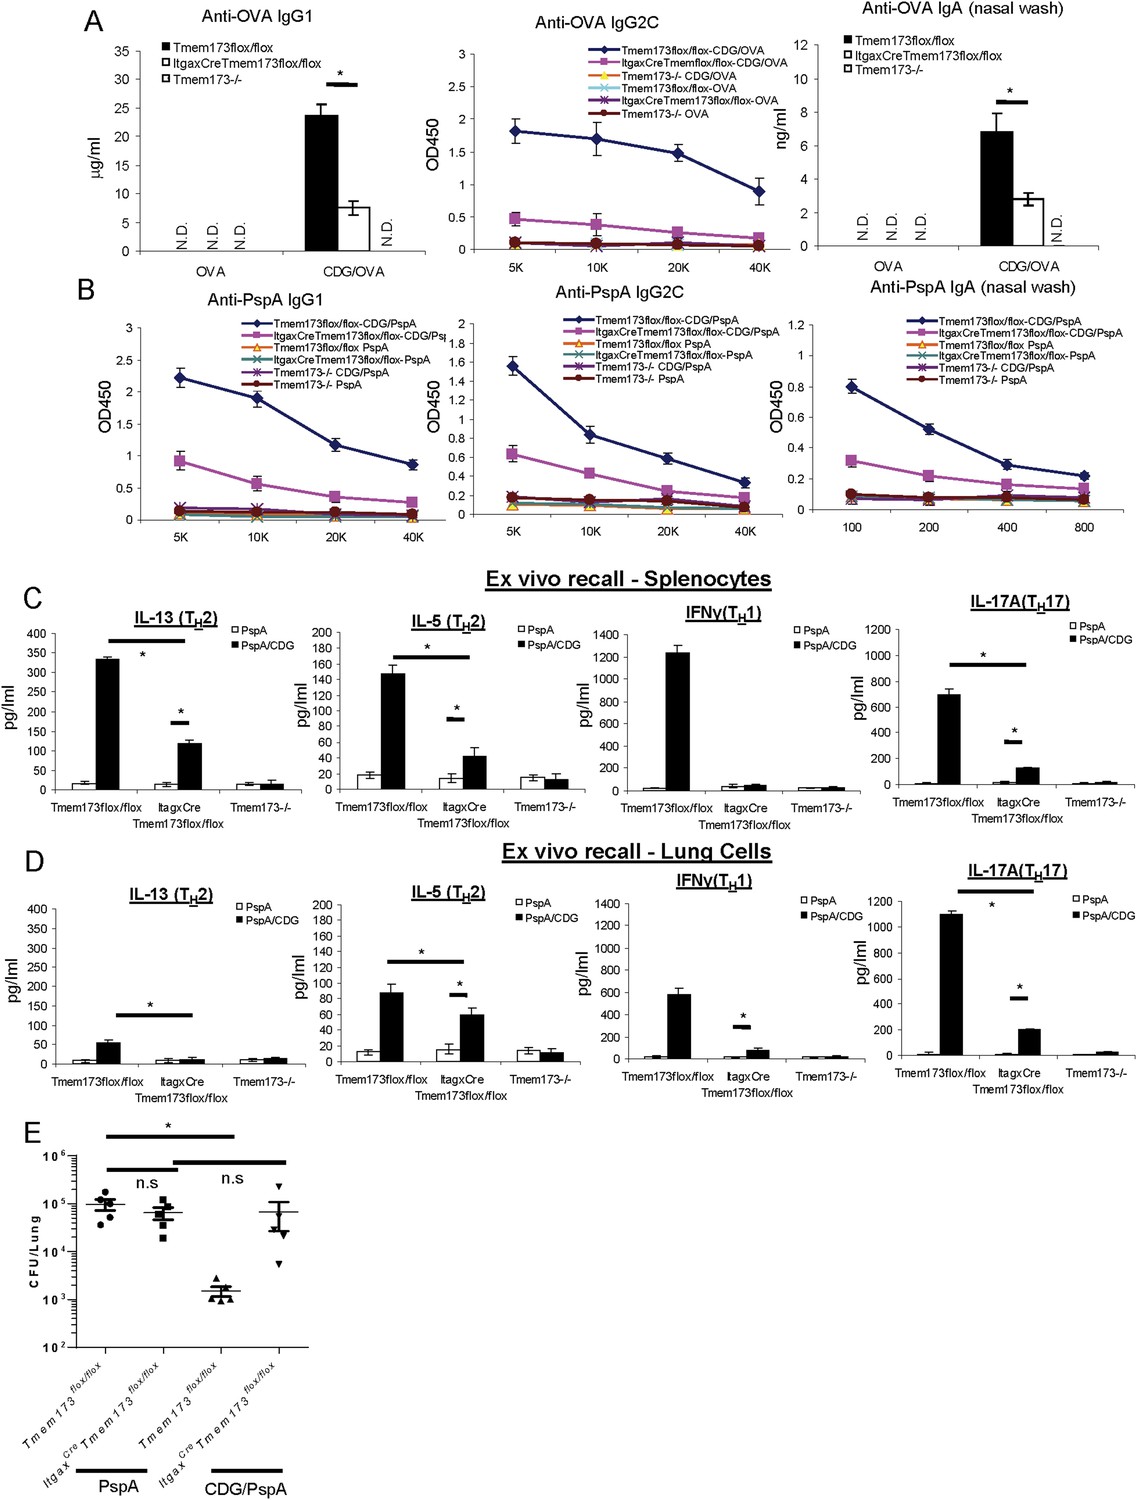
MPYS expression in CD11C+ cells is required for the optimal mucosal adjuvant activity of CDG.
(A) Tmem173Flox/Flox, ItgaxCreTmem173Flox/Flox or Tmem173−/− mice were intranasally administered OVA (20 μg) alone or together with 5 μg CDG as in Figure 1A. Anti-OVA IgG1, IgG2C and IgA were determined by ELISA. n = 3. (B) Tmem173Flox/Flox, ItgaxCreTmem173Flox/Flox or Tmem173−/− mice were immunized with PspA (2 μg) alone or together with 5 μg CDG as in Figure 1C. Anti-PspA IgG1, IgG2C, and IgA were measured by ELISA. n = 3. (C–D) Splenocytes and lung cells from PspA or CDG + PspA immunized Tmem173Flox/Flox, ItgaxCreTmem173Flox/Flox or Tmem173−/− mice were stimulated with 5 μg/ml PspA for 4 days in culture. Cytokines were measured in the supernatant by ELISA as in Figure 1D n = 3. (E) 1 month after the last immunization, CDG/PspA or PspA immunized Tmem173Flox/Flox and ItgaxCreTmem173Flox/Flox mice were infected (i.n.) with S. pneumoniae (D39 strain, ∼5.0 × 10⁶ c.f.u.). At 48 hr post infection, lung bacterial burden were determined. n = 2. Graph present means ± standard error from three independent experiments. Significance is represented by an asterisk, where p < 0.05.
Figure 9—figure supplement 1
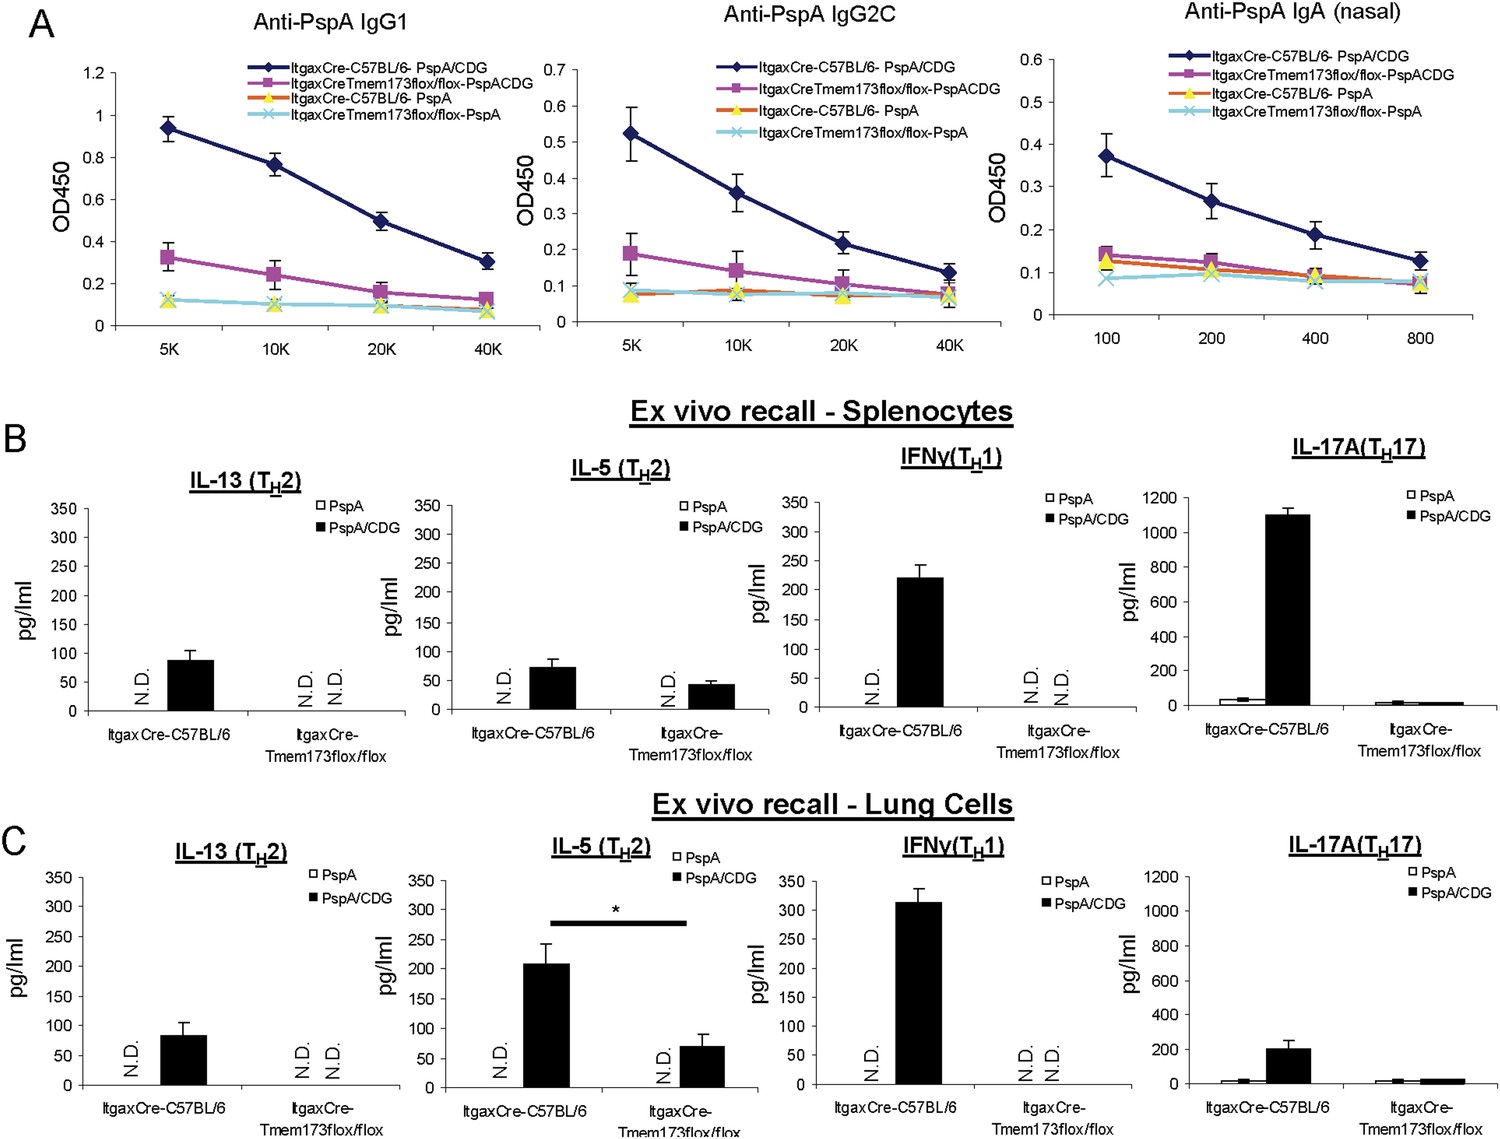
The impaired CDG response in ItgaxCreTmem173Flox/Flox mice is not due to the over-expression of Cre in CD11C+ cells.
https://doi.org/10.7554/eLife.06670.014
Figure 10

In vivo mechanisms of the mucosal vaccine adjuvant CDG.
(A) The formula of CDG. Red arrows indicate the phosphate groups that prevent CDG from directly crossing the cell membrane. (B) Mechanism I: CDG enhances Ag uptakes in APCs and non-APCs. Among OVA647+APCs, only a portion of MHC IIhiCD11C+ (DCs) and MHC IIint CD11C− cells up-regulate CD86 expression in vivo. They are mainly OVA647low cells, which take up Ag by pinocytosis. The activation of these cells generate a cytokine milieu that acts on other cells leading to enhanced Ag uptake (OVA647hi cells) but not cell activation. CDG also activates lung epithelial cells (LEC), leading to TSLP and IL-33 production. But this is only partially dependent on MPYS and is not sufficient to enhance Ag uptake in vivo (Figure 8). (C) Mechanism II: CDG selectively activates pinocytosis-efficient DCs in vivo. After administering DQ-OVA together with CDG, the DQ+MHC IIhiCD11C+ Ag-loading DCs can be separated into two distinct populations: DQ-Green+DQ-Red−CD86+ and DQ-Green+DQ-Red+CD86−. DQ-Green+DQ-Red− cells are OVA-647low cells, while DQ-Green+DQ-Red+ cells are OVA-647hi cells. Only the DQ-Green+DQ-Red−CD86+ cells migrated to lung DLNs.
Author response image 1
Author response image 2

Download links
A two-part list of links to download the article, or parts of the article, in various formats.
Downloads (link to download the article as PDF)
Open citations (links to open the citations from this article in various online reference manager services)
Cite this article (links to download the citations from this article in formats compatible with various reference manager tools)
The mucosal adjuvant cyclic di-GMP enhances antigen uptake and selectively activates pinocytosis-efficient cells in vivo
eLife 4:e06670.
https://doi.org/10.7554/eLife.06670


