Geminivirus-encoded TrAP suppressor inhibits the histone methyltransferase SUVH4/KYP to counter host defense
- Texas A&M University, United States
- Chinese Academy of Sciences, China
- Zhejiang University, China
- Yunnan Academy of Tobacco Agricultural Sciences, China
- Heilongjiang Bayi Agricultural University, China
- Jiangsu Academy of Agricultural Sciences, China
Figures
Figure 1 with 1 supplement
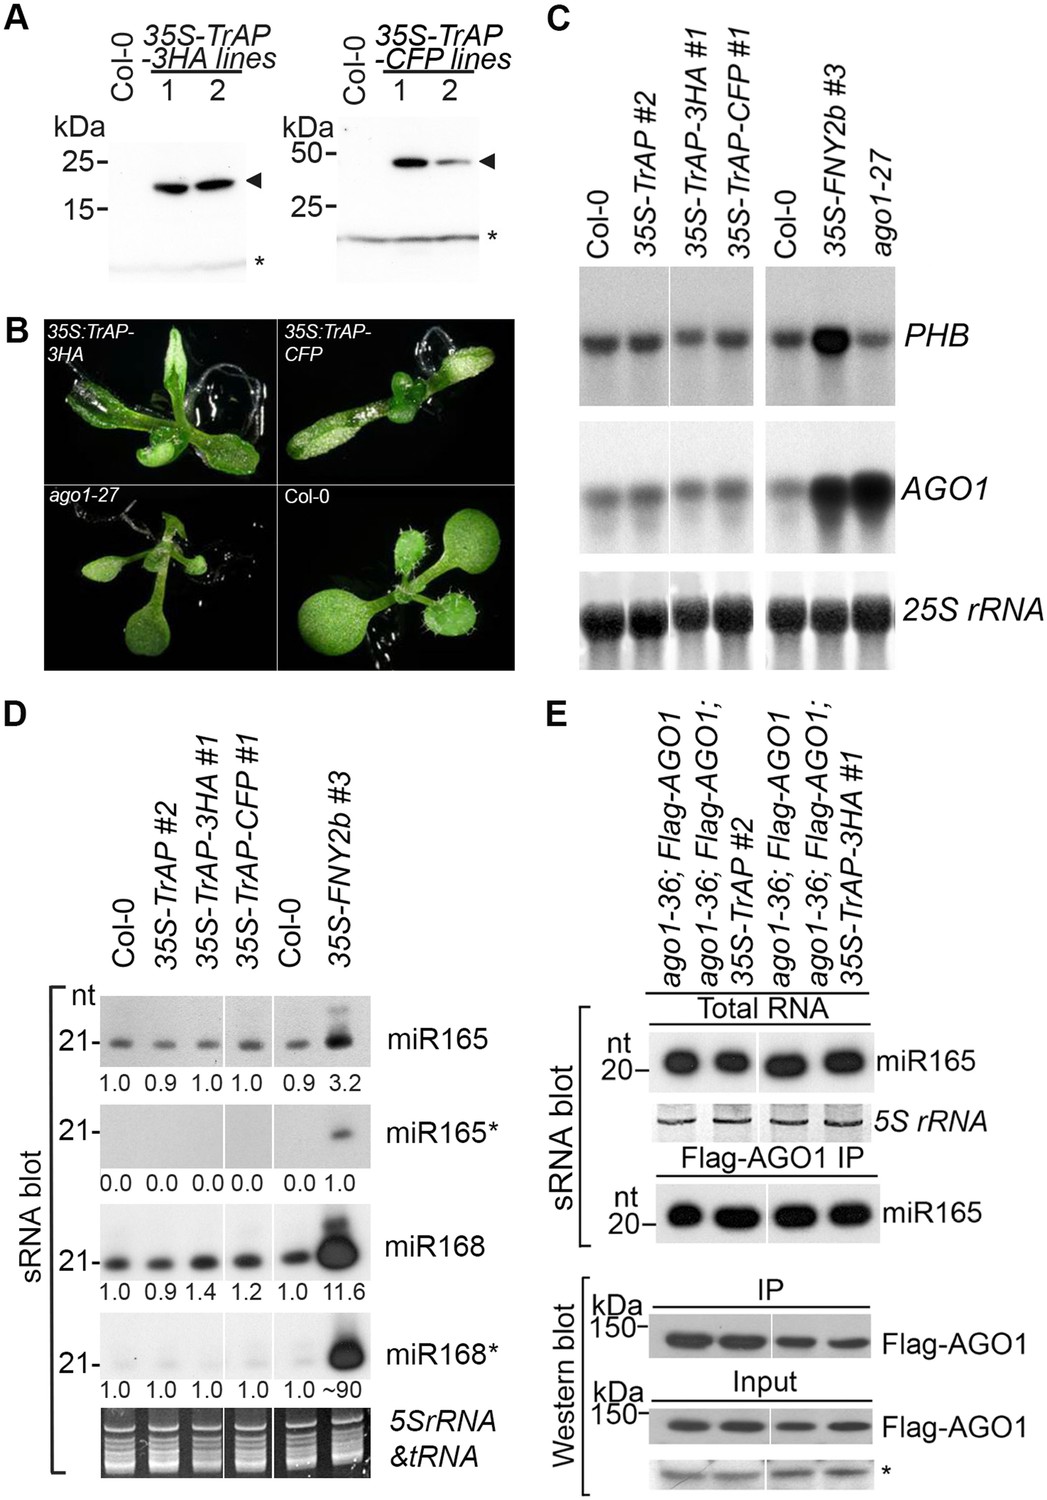
TrAP caused developmental abnormalities in Arabidopsis but not through miRNA pathway.
(A) Western blot analysis of 35S-TrAP-3HA and 35S-TrAP-CFP transgenic lines. Arrows indicate the locations of the tagged TrAP proteins; * Cross-reaction band serves a loading control. (B) Morphological defects of Arabidopsis transgenic plants expressing 35S-TGMV TrAP. Photographs were taken of 10-day seedlings. (C) RNA blot analysis of PHB and AGO1 transcripts in the TrAP overexpression transgenic plants using gene-specific random-labeled probes. 25S rRNA is a loading control. (D) sRNA blot analysis of miRNA and miRNA* in the TrAP overexpression transgenic plants. Total RNA was prepared from a pool of T2 transgenic plants (n > 50 for each line). sRNA blots were probed using 5′ end 32P-labeled oligonucleotide probes complementary to the indicated miRNA or miRNA*. 5S rRNA and tRNA are a loading control. All the samples were run in the same gel; but the lane order of miRNA*s was rearranged to match that of miRNAs. (E) sRNA blot analysis of miR165 loading into Arabidopsis RNA-induced silencing complexes (RISCs). RNA was extracted from flowers or Flag-AGO1 immunoprecipitates of transgenic plants harboring 35S-TrAP or 35S-TrAP-3HA in ago1-36; PAGO1-Flag-AGO1 background and ago1-36; PAGO1-Flag-AGO1 control plants (Baumberger and Baulcombe, 2005). Top panel, total RNA; middle panel, each lane contained sRNA associated with Flag-AGO1 immunoprecipitated from 0.4 g of flowers. Bottom panel, the input and immunoprecipitate of Flag-AGO1 were analyzed by Western blot assays in the same samples for sRNA blots. A cross-reacting band (*) was used as a loading control.
Figure 1—figure supplement 1

sRNA blot analysis of additional miRNAs and siRNA in the TrAP overexpression transgenic plants.
Total RNA was prepared from a pool of T2 transgenic plants (n > 50 for each line). sRNA blots were probed using 5′ end 32P-labeled oligonucleotide probes complementary to the indicated miRNAs or siRNA. U6 serves as a loading control.
Figure 2
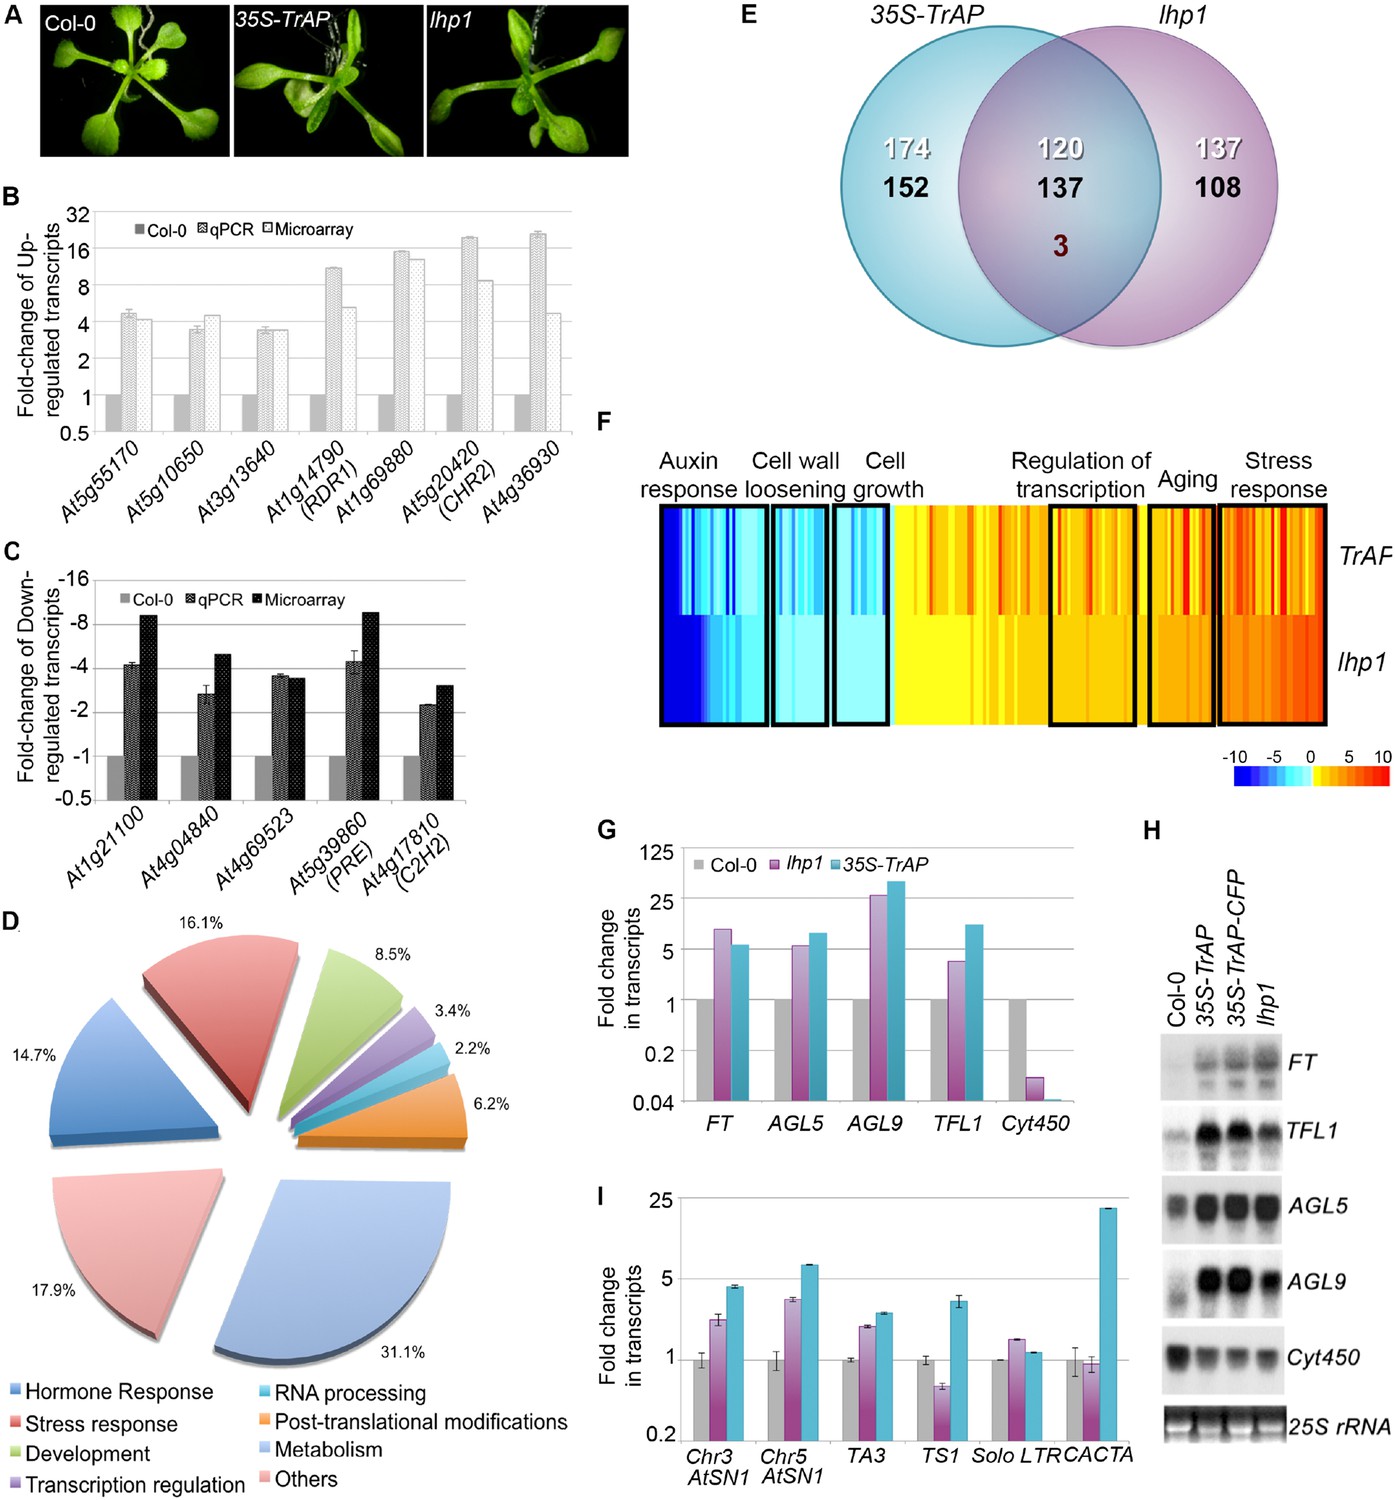
TrAP is genetically involved in the TGS pathway.
(A) 35S-TrAP transgenic plants phenocopied lhp1 mutants. Photographs were taken of 15-day seedlings. (B, C) Microarray results were validated by qRT-PCR analysis. Only 12 randomly selected loci were shown. (D) Gene ontology analysis of the TrAP-regulated DEGs. The numbers adjacent to the pies represent the ratio of genes in each category over the total DEGs. (E) Genome-wide overlapping of the genes regulated by TrAP and loss-of-function lhp1. White and black numbers correspond to upregulated and downregulated genes, respectively. Maroon number indicates the genes that are differentially deregulated in both genotypes. (F) Heatmap of the commonly deregulated genes in the 35S-TrAP and lhp1 lines. The typical gene-ontology categories are shown on top. (G, H) Microarray and RNA blot analyses of epigenetically regulated flowering genes in the TrAP transgenic lines and lhp1 mutants. Cyt450 is a control. (I) qRT-PCR analysis of TEs in heterochromatic regions in the lhp1 mutant and TrAP transgenic lines.
Figure 3 with 1 supplement
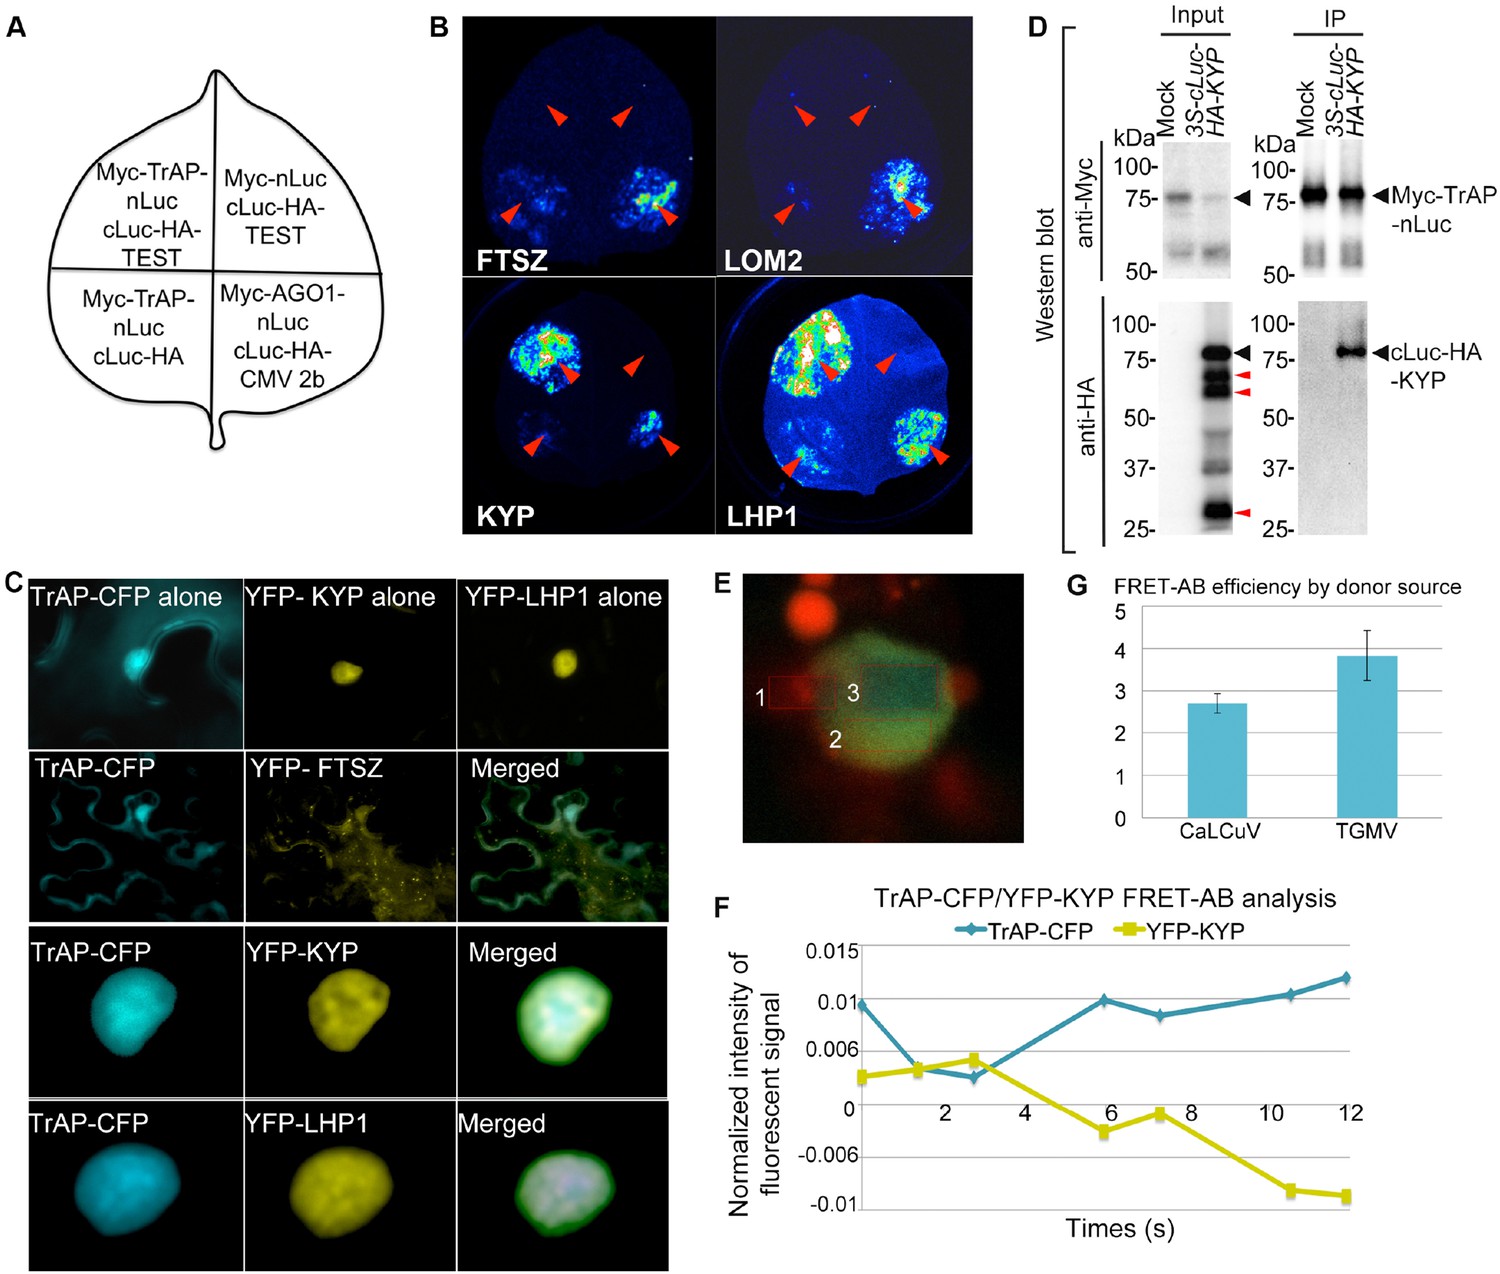
TrAP interacts with KYP in vivo.
(A) Schematic representation of the luciferase complementation imaging assay shows the different combinations of infiltrated constructs that were fused either to N-terminal (NLuc) and C-terminal (CLuc) regions of luciferase. (B) Screening of host factors targeted by TrAP. The infiltration positions of the constructs (red arrows) and luminescence signal resulting from the protein–protein interaction in a leaf are shown. FTSZ and LOM2 serve as negative controls. (C) Confocal imaging assays show the co-localization of TrAP-CFP with YFP-KYP and YFP-LHP1 in the nuclei in Nicotiana benthamiana. FTSZ serves as a negative control. (D) Specific interaction between KYP and TrAP was confirmed in N. benthamiana by co-immunoprecipitation (Co-IP). Constructs harboring 35S-Myc-TrAP-nLuc and cLuc-HA-KYP were co-infiltrated in N. benthamiana leaves. IP was conducted using anti-Myc antibody. Western blot analyses were done with the crude extract (input) and the IP products using anti-Myc or -HA antibodies. Truncated versions (red arrows) serve as an internal control. (E) Exemplary imaging of FRET assays of TrAP-CFP and YFP-KYP co-expressed in a nucleus. The nucleus is irradiated with 458 nm laser to excite the CFP fluorophore. Three regions were selected for the assay: #1, autofluorescence control, #2 fluorophore decay control, and #3, FRET-acceptor bleaching test. Regions #1 and #3 were treated with pulses of 514 nm laser to bleach the YFP fluorophore. The CFP signal is then visible in region #3 when the emission of CFP is dequenched. (F) Quantification of the signals from each fluorophore observed during FRET-AB experiment in E. (G) FRET is positive for YFP-KYP paired with the CFP-tagged TrAPs from either CaLCuV or TGMV.
Figure 3—figure supplement 1
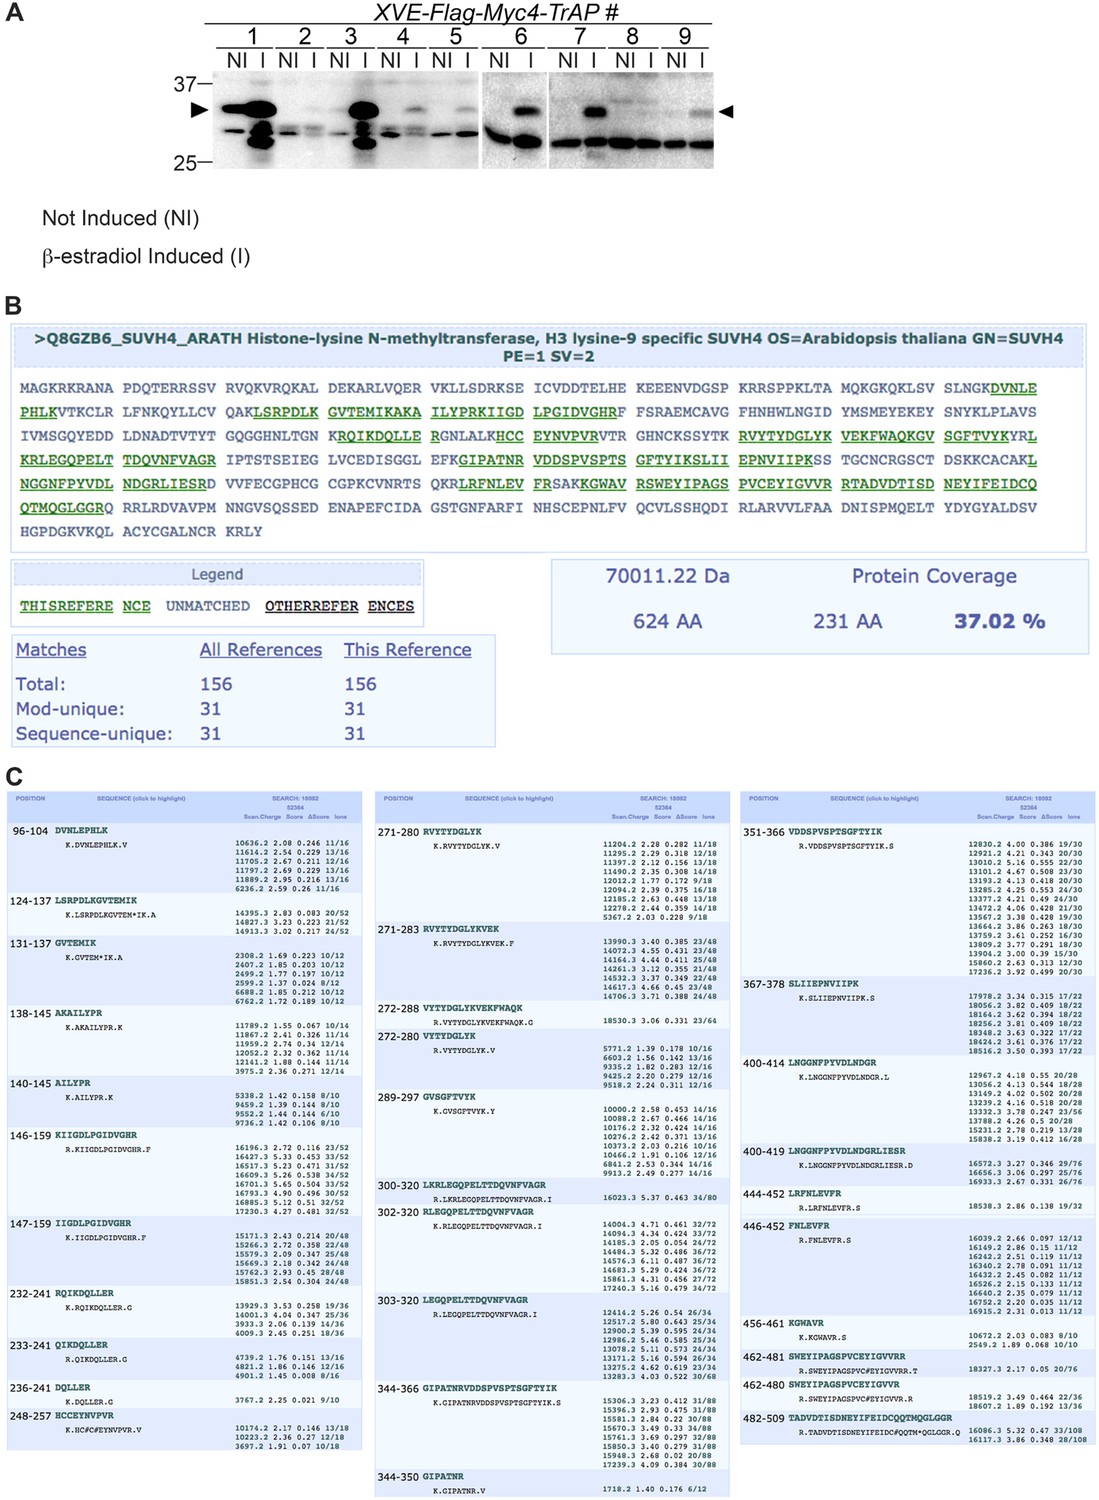
Mass spectrometry analyses confirmed endogenous KYP as a bona fide TrAP-interacting partner.
(A) β-estradiol Inducible expression of Flag-4Myc-TrAP protein in Arabidopsis transgenic lines (B) 31 peptides (green) uniquely match to the KYP sequence. (C) Description of recovered peptides matching KYP/SUVH4.
Figure 4 with 2 supplements

TrAP interacts directly with KYP through the SET domain.
(A, B) In vitro pull-down assays showed that KYP specifically interacted with TGMV TrAP (A) and CaLCuV TrAP (B). Left panel, Coomassie brilliant blue R250 staining of the proteins shows their mobility. Right panel, output of in vitro pull-down assays. All His-MBP-tagged bait proteins and His-GST-tagged prey proteins were purified from Escherichia coli using Ni-NTA columns. In all assays, 2.5 μg of prey proteins were pulled down with the indicated bait proteins (2.5 μg each) using amylose resin. The recovered MBP-tagged bait proteins were monitored by Coomassie brilliant blue R250 staining. All the experiments were done at the same time, and the samples were run in the same gels. The spacers in the images indicate digital rearrangements of the pictures. The output of the GST-tagged prey proteins was analyzed by western blot using a monoclonal anti-GST antibody. (C) Schematic diagram of full-length and truncated forms of KYP. The numbers on the left refer to the amino acid residues in KYP protein. Locations of SRA, pre-SET, SET, and post-SET domains are shown. (D) In vitro pull-down assays of truncated KYP proteins and TrAPs. The experiments were done as in (A, B). The GST negative control was loaded in the lanes marked with (*). (E) Summary of interaction between the truncated KYP proteins and TrAP encoded by TGMV and CaLCuV. (F) Model of possible KYP-TrAP interaction based on the experimental results from panels D and E. KYP structure was generated in Chimera from PDB: 4QEN data set (Du et al., 2014b), domains are color coded and indicated.
Figure 4—figure supplement 1
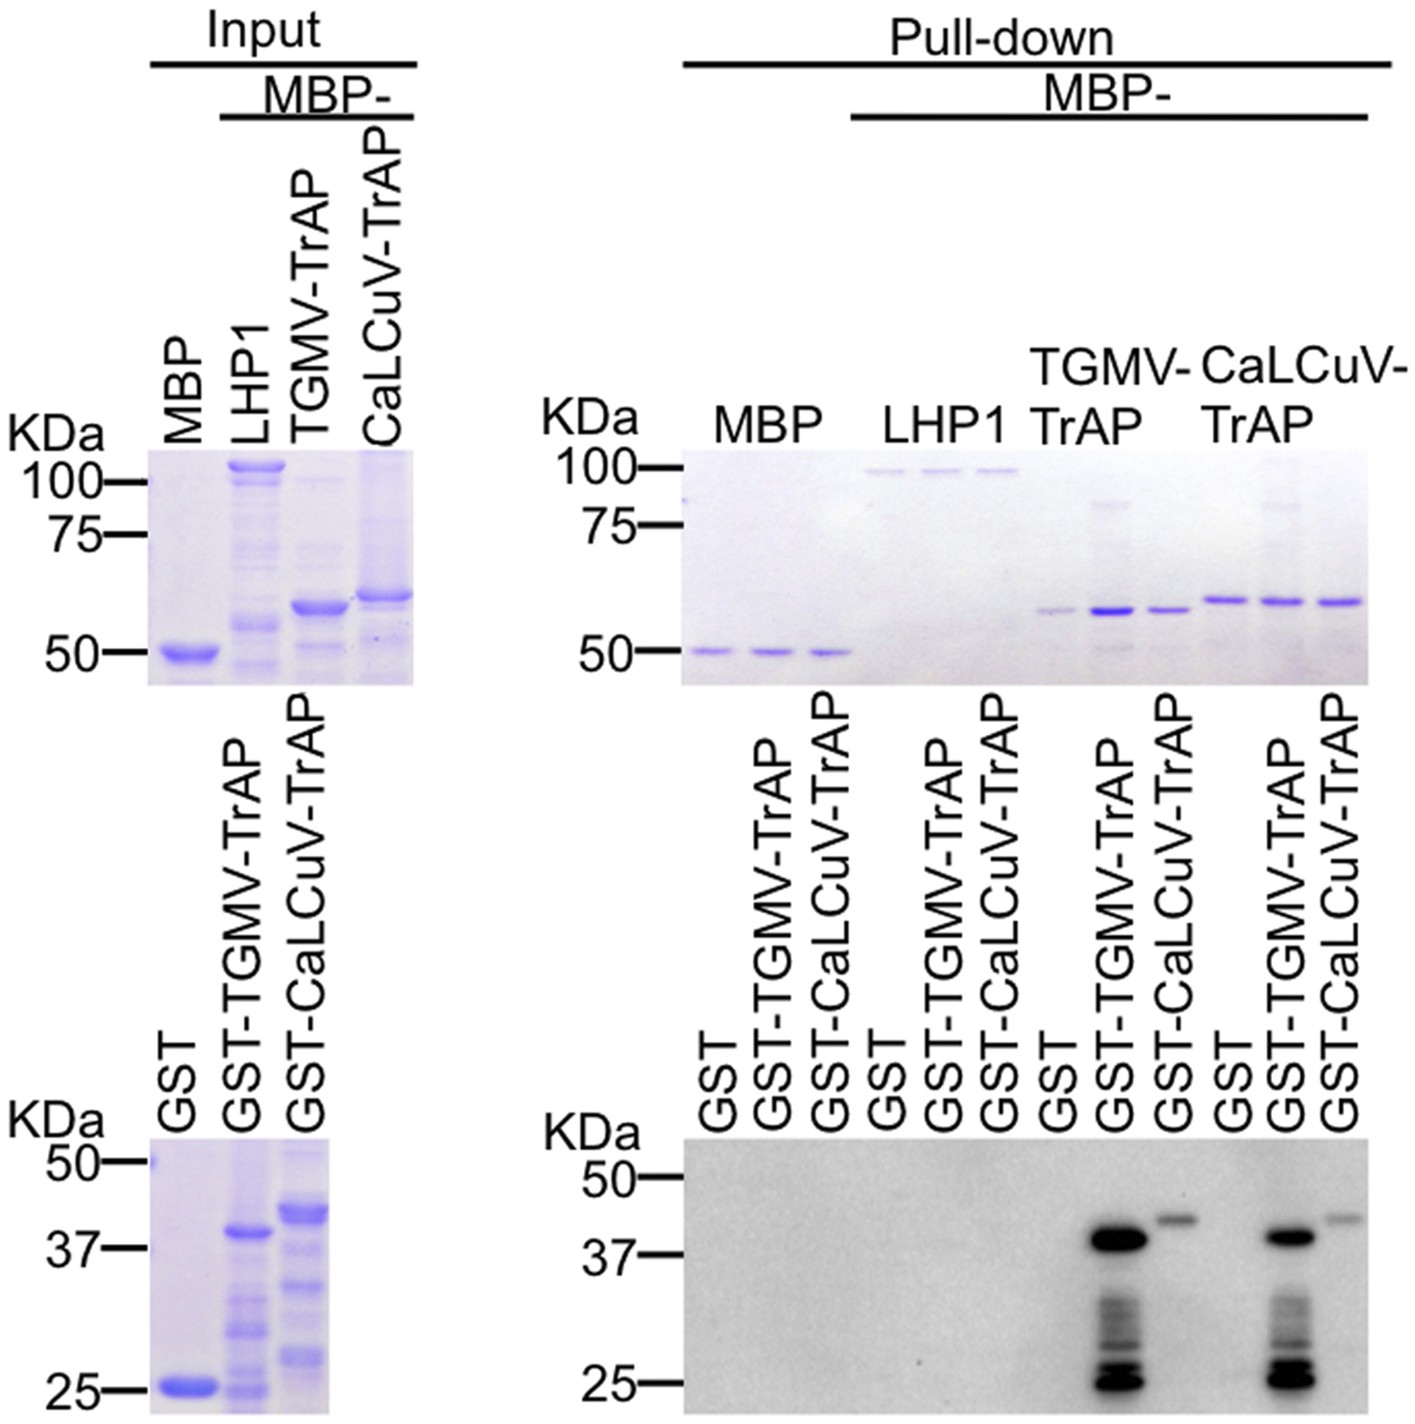
TrAP does not interact with LHP1 in vitro.
In vitro pull down assays of GST-TrAP by MBP-LHP1 is shown. Left panel, Coomassie brilliant blue R250 staining of the proteins shows their mobility. Right panel, output of in vitro pull-down assays. The recovered MBP-tagged bait proteins were monitored by Coomassie brilliant blue R250 staining. The output of the GST-tagged prey proteins was analyzed by western blot using a monoclonal anti-GST antibody. TrAP dimerization is shown as positive control. 2.5 μg of prey proteins were pulled down with the indicated bait proteins (2.5 μg each).
Figure 4—figure supplement 2
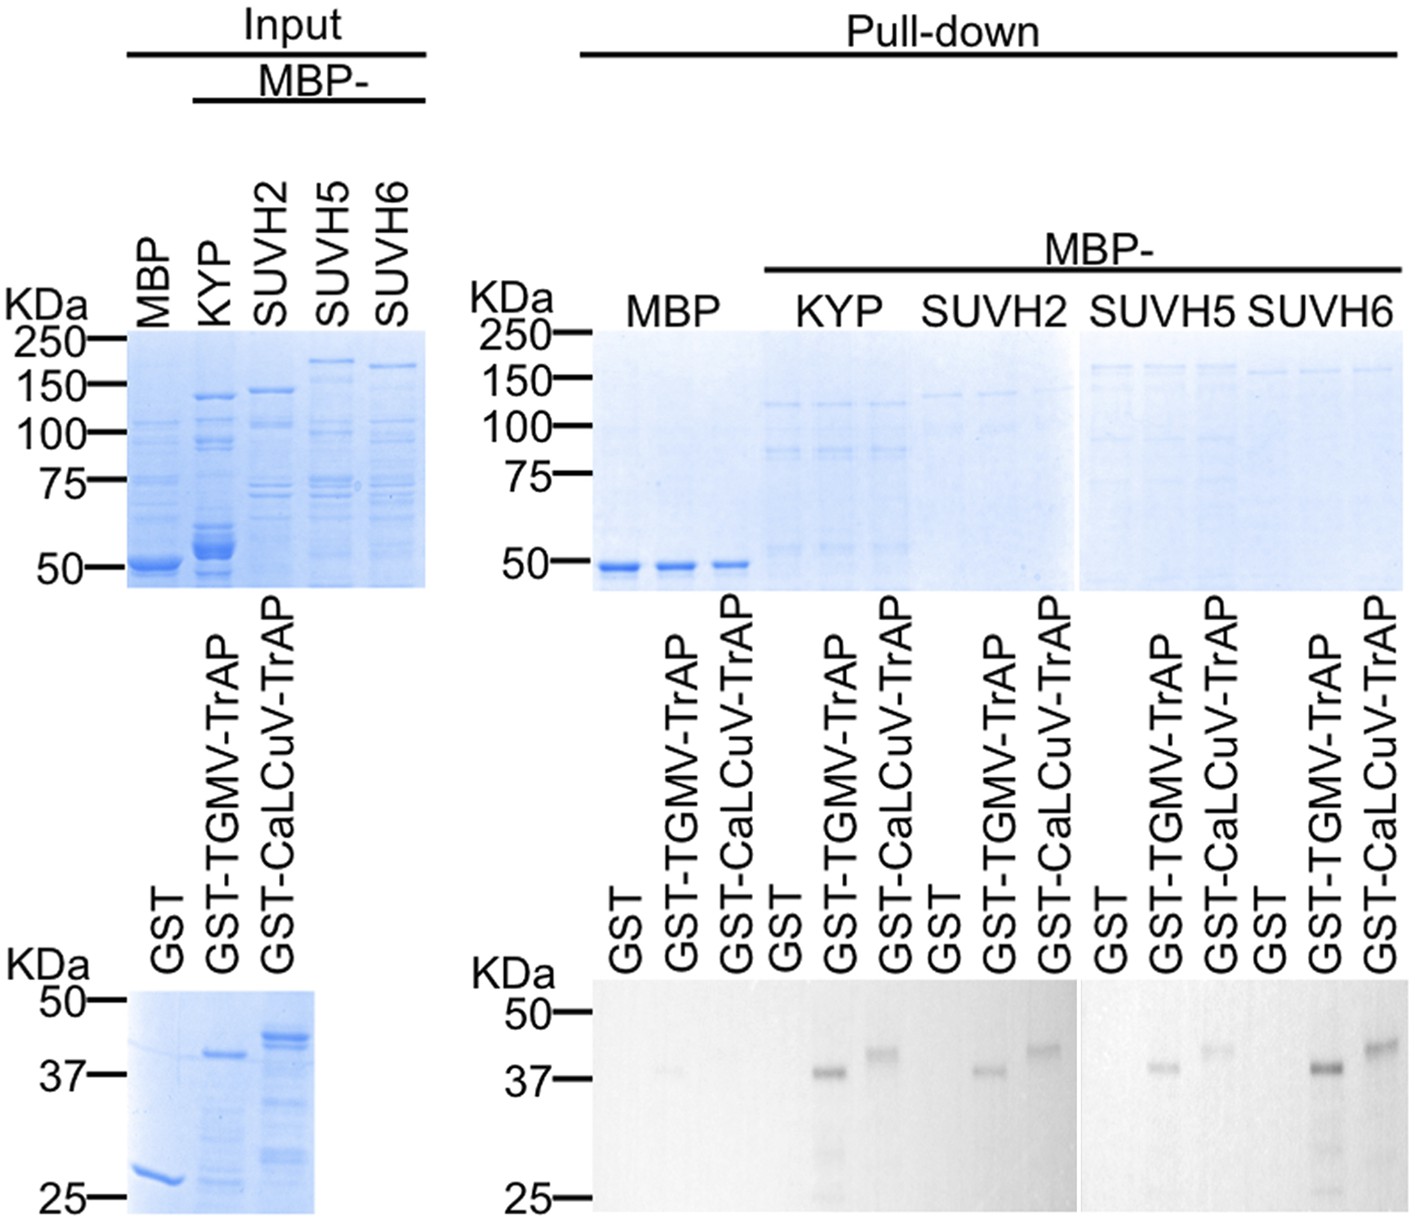
TrAP directly interacts with KYP paralogs SUVH2, 5, and 6.
In vitro pull down assays. Left panel, coomassie brilliant blue R250 staining of the proteins shows their mobility. Right panel, output of in vitro pull-down assays. The recovered MBP-tagged bait proteins were monitored by Coomassie brilliant blue R250 staining. The output of the GST-tagged prey proteins was analyzed by western blot using a monoclonal anti-GST antibody. SUVH4/KYP was used as a positive control. 2.5 μg of prey proteins were pulled down with the indicated bait proteins (2.5 μg each). All the experiments were performed simultaneously and run in two separate gels.
Figure 5
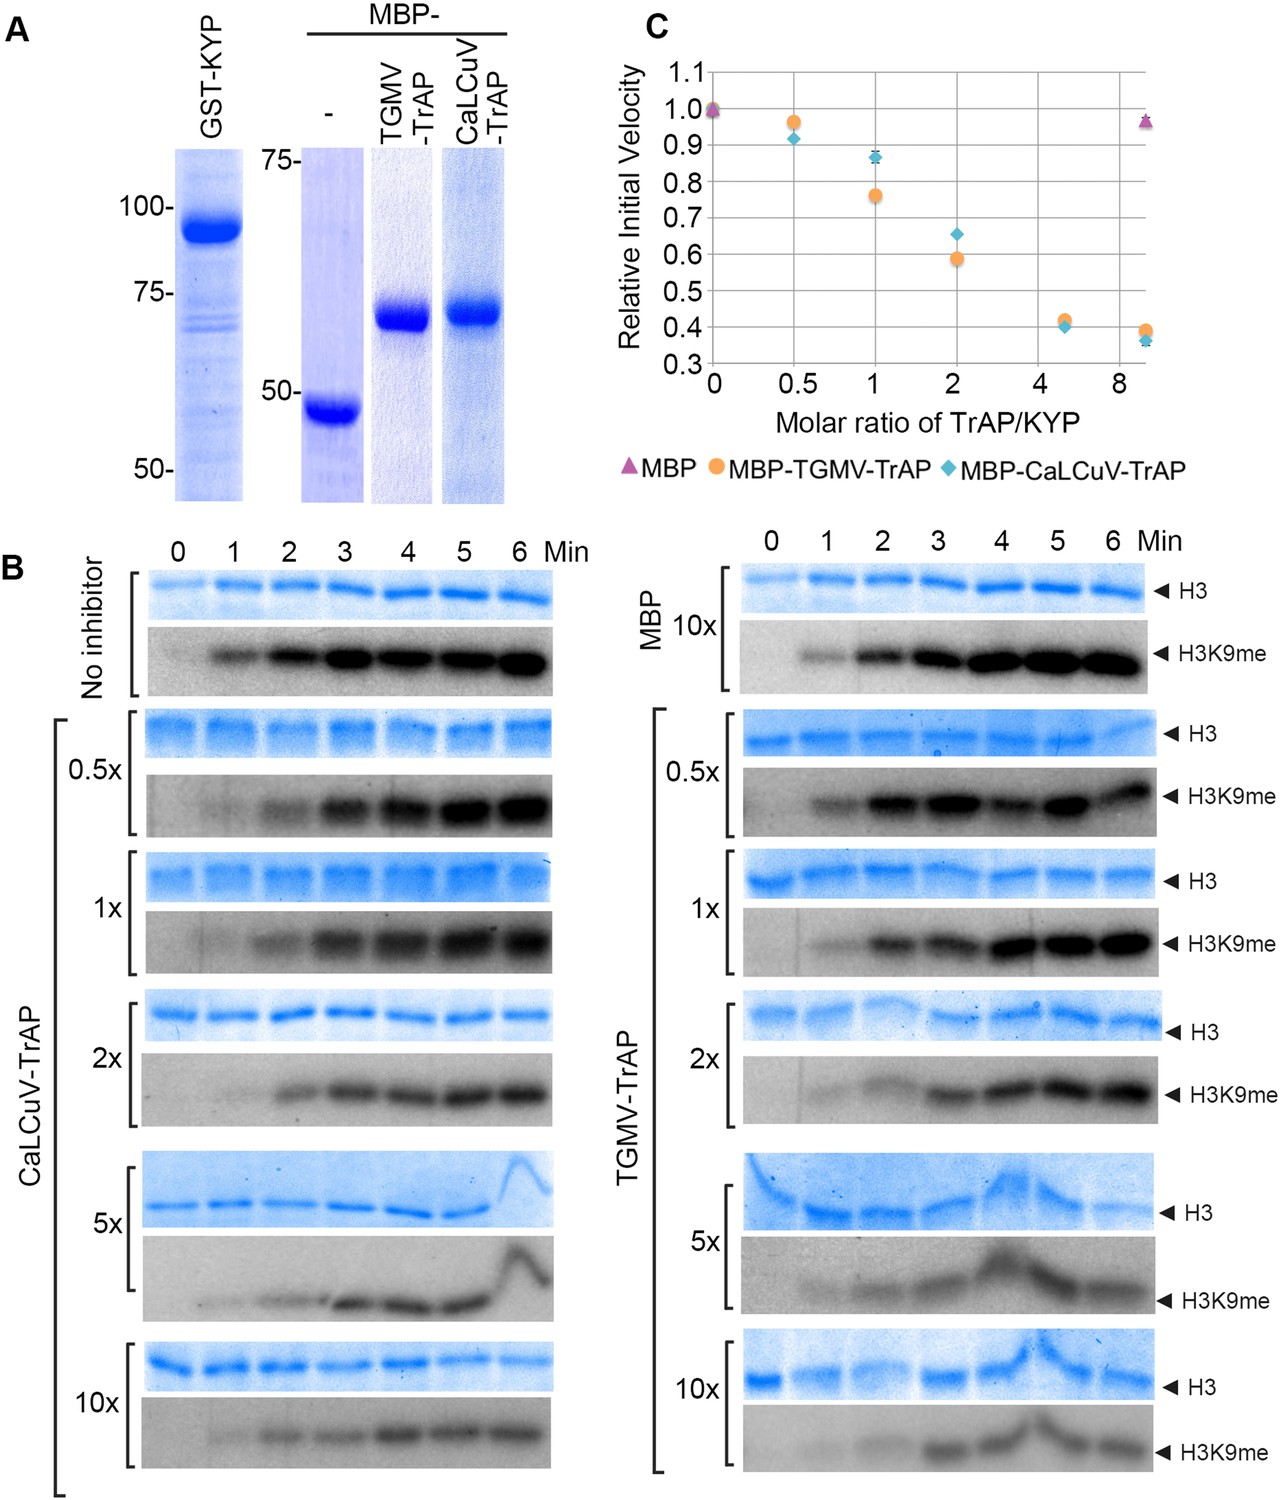
TrAP inhibited HMTase activity of KYP in vitro.
(A) Coomassie staining of purified proteins uses for the assays. (B) In vitro HMTase reconstitution assays with different molar ratio of MBP and MBP-TrAP proteins (0–10×) relative to GST-KYP. The recombinant KYP was incubated without (buffer only) or with the indicated proteins before addition of histone 3 and C14-SAM. The reactions were done in a 6-min time course; aliquots were resolved in 18% SDS PAGE and stained with Coomassie blue R250 to show histone 3 input (top panels). The dried gels were auto-radiographed to detect 14C-methylated histone 3. (C). Plotting of KYP initial velocity vs TrAP/KYP molar ratio. The initial velocity was calculated from the slope of the linear range in the signal vs time plot for each assay, and then the values were normalized using the non-inhibitor control as a standard of 1 to obtain the relative initial velocity with standard deviation (SD) from at least three biological repeats. The relative initial velocity is plotted as a function of inhibitor:enzyme molar ratio in a logarithmic scale of base 2.
Figure 6 with 2 supplements
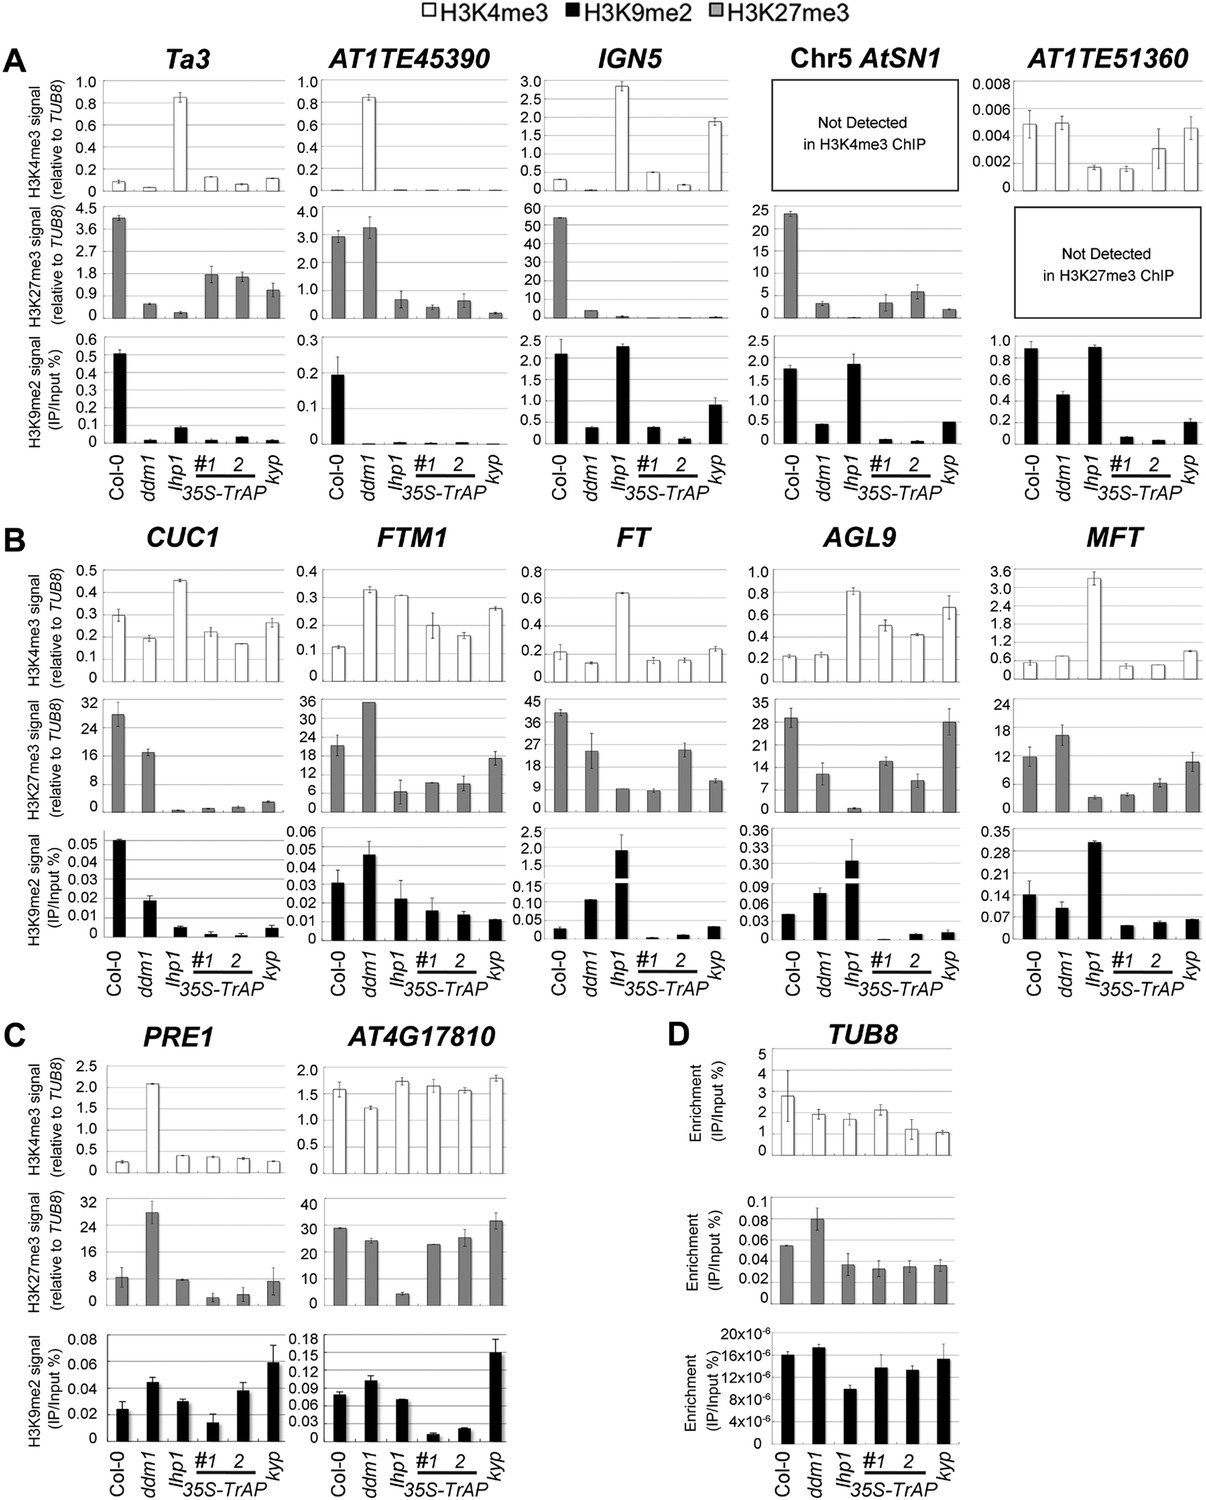
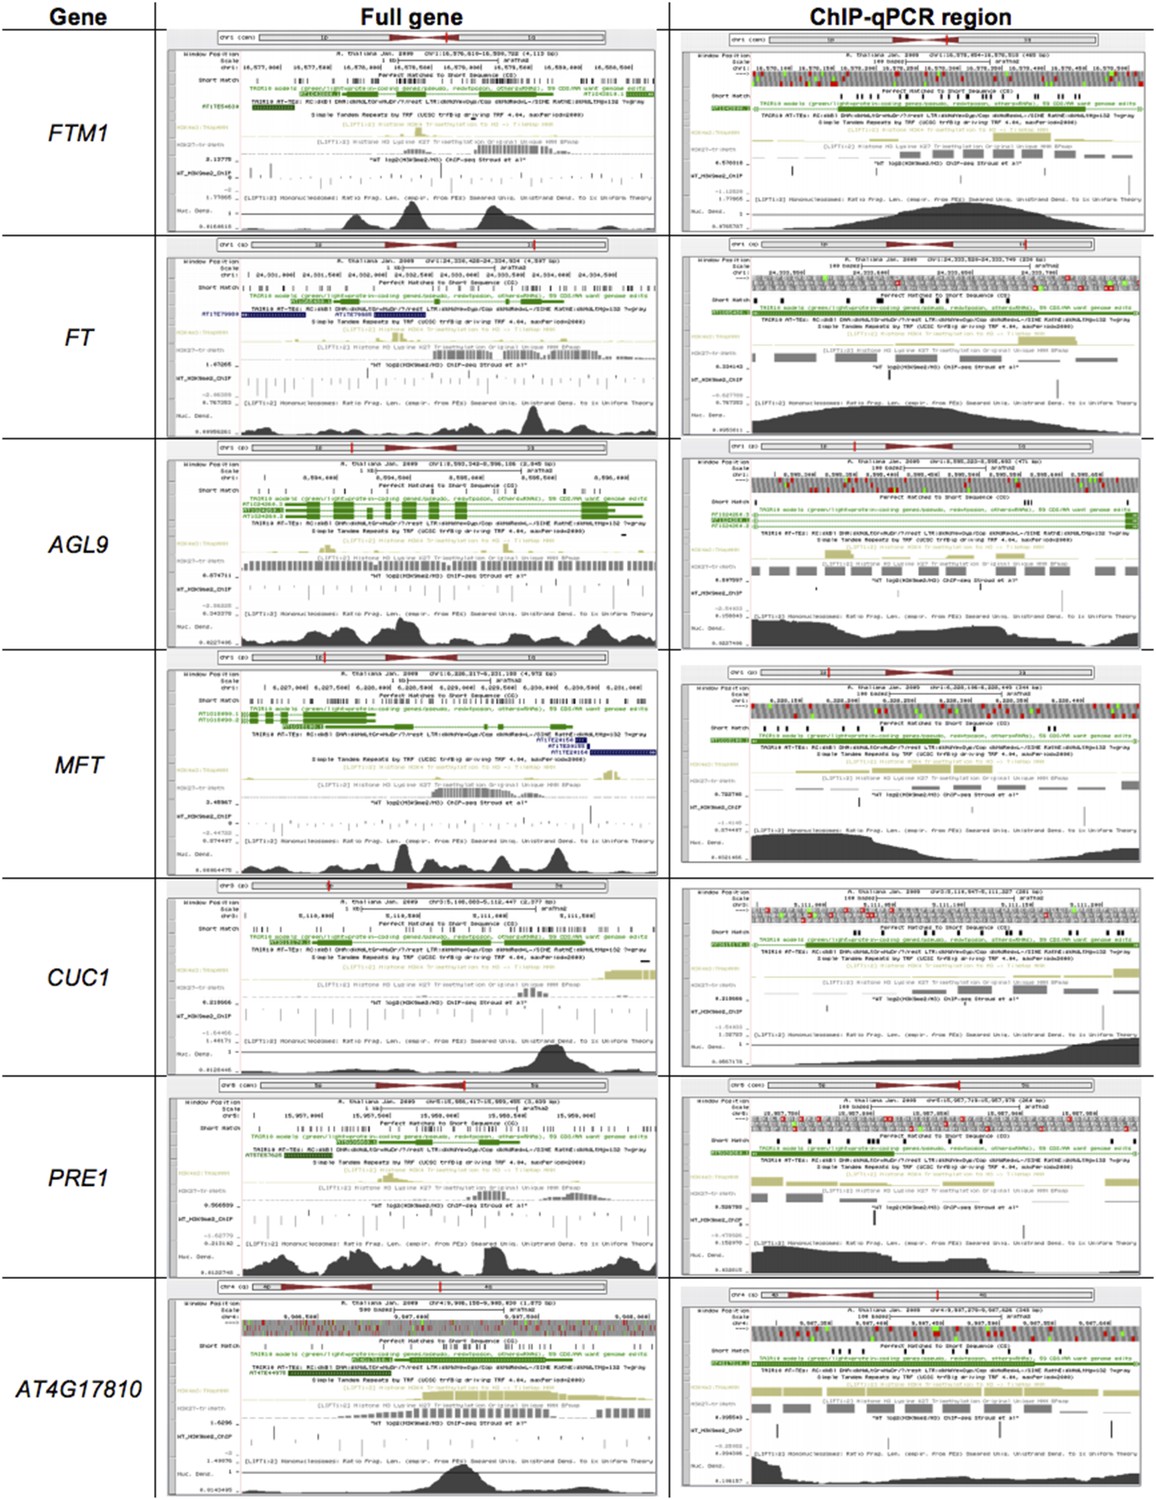
ChIP-qPCR analyses of H3K4me3, H3K9me2, and H3K27me3 in TrAP-regulated loci in vivo.
(A) TrAP-activated transposons in heterochromatic regions contained reduced H3K9me2 and H3K27me3 but did not show consistent variation in H3K4me3 marks. (B) TrAP-upregulated flowering genes showed consistently reduced H3K9me2 and H3K27me3 marks compared to wild-type Col-0. (C) TrAP-downregulated genes displayed variable changes of H3K9me2 and H3K27me3 marks and no obvious changes of H3K4me3 mark. (D) Tubulin (TUB8) was used as internal control for all the ChIP experiments; the percentage enrichment vs input is shown. ChIP assays were conducted on 11-day-old seedlings using antibodies specific for H3K9me2 (Abcam, Cat# ab1220), H3K27me3 (Millipore, Cat# 07-449), and H3K4me3 (Millipore, Cat# 04-745). Enrichment of H3K4me3 and H3K27me3 in each locus is normalized to that of TUB8; H3K9me2 enrichment is plotted as percentage of input. The standard deviation (SD) was calculated from at least three biological repeats.
Figure 6—figure supplement 1
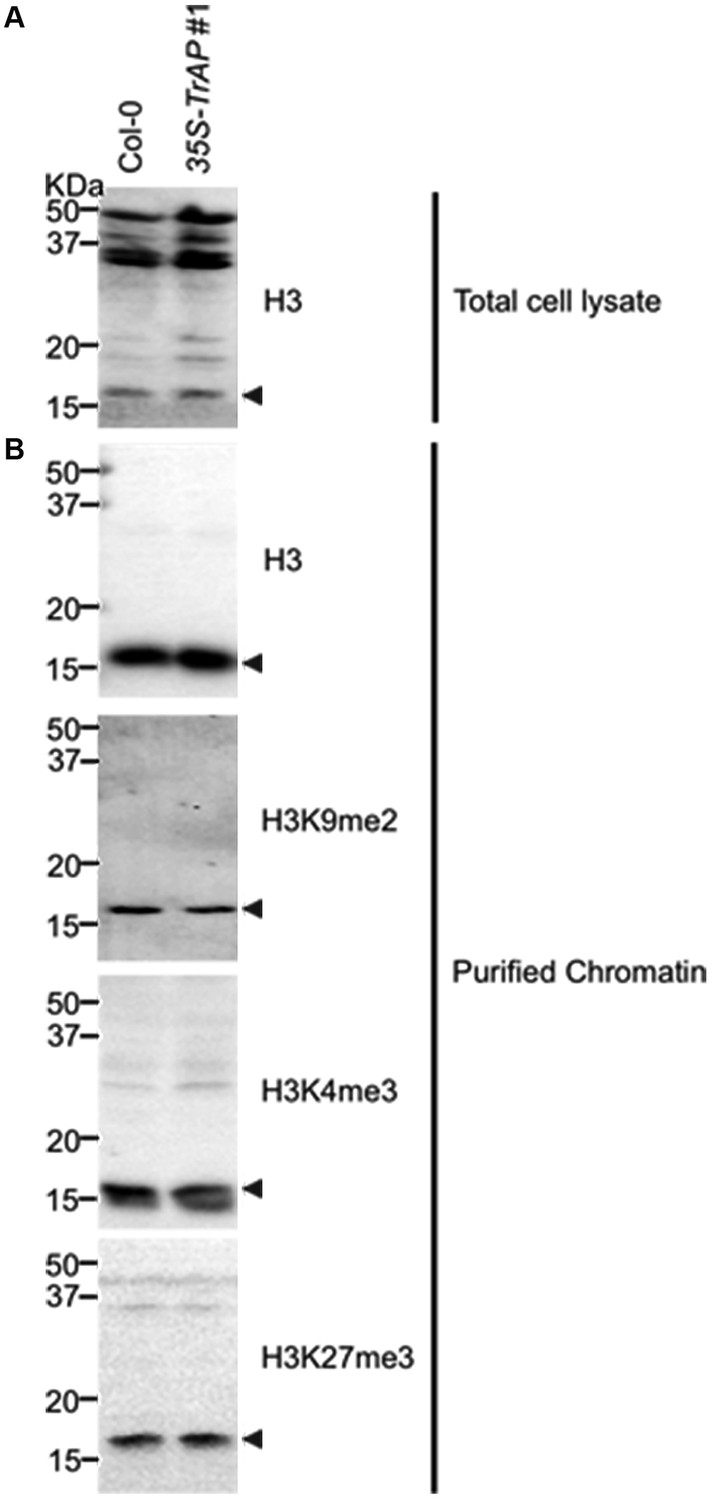
Western blot analysis to show specificity of antibodies used for ChIP assays in the study.
Crude extract (A) and isolated nuclei (B) were probed with antibodies against histone 3, H3K9me2 (Abcam Cat# ab1220), H3K27me3 (Millipore Cat# 07-449) and H3K4me3 (Millipore Cat# 04-745), respectively.
Figure 6—figure supplement 2
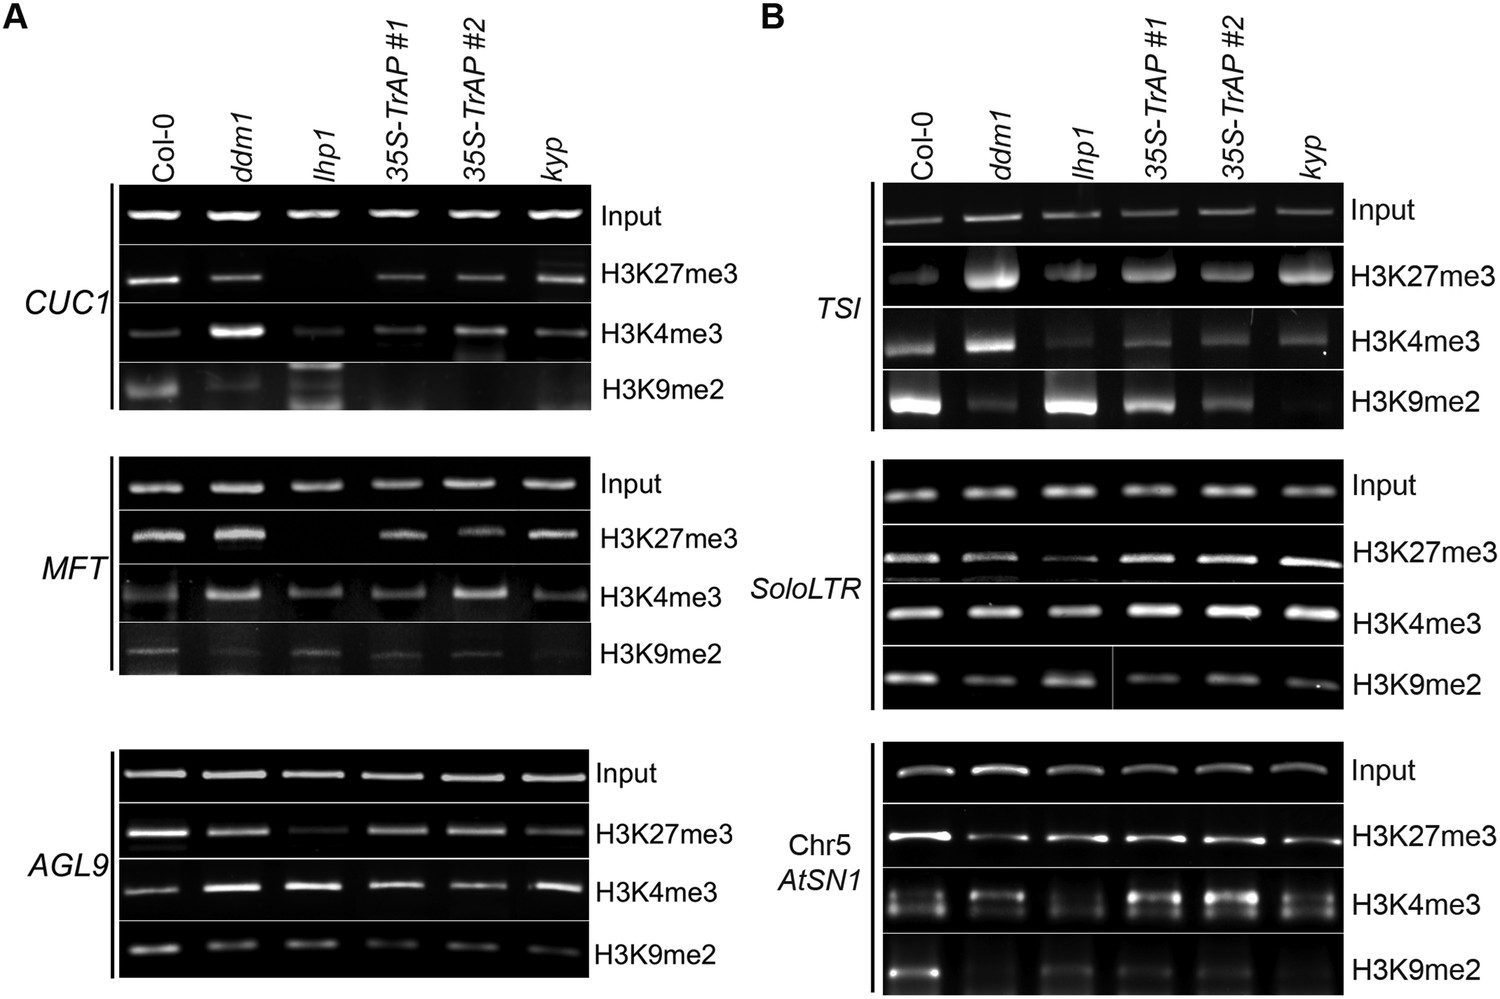
ChIP-PCR assays for selected flowering genes and heterochromatic loci confirm ChIP-qPCR.
(A) ChIP-PCR analysis of various histone 3 modifications in flowering genes in different genetic backgrounds. (B) ChIP-PCR analysis of various histone 3 modifications in TEs in different genetic backgrounds. ChIP assays were conducted on 9-day-old seedlings using antibodies specific for H3K9me2 (Abcam Cat# ab1220), H3K27me3 (Millipore Cat# 07-449), and H3K4me3 (Millipore Cat# 04-745). The PCRs were done with 22 cycles for the input samples and with 30 cycles after ChIP.
Figure 7 with 1 supplement
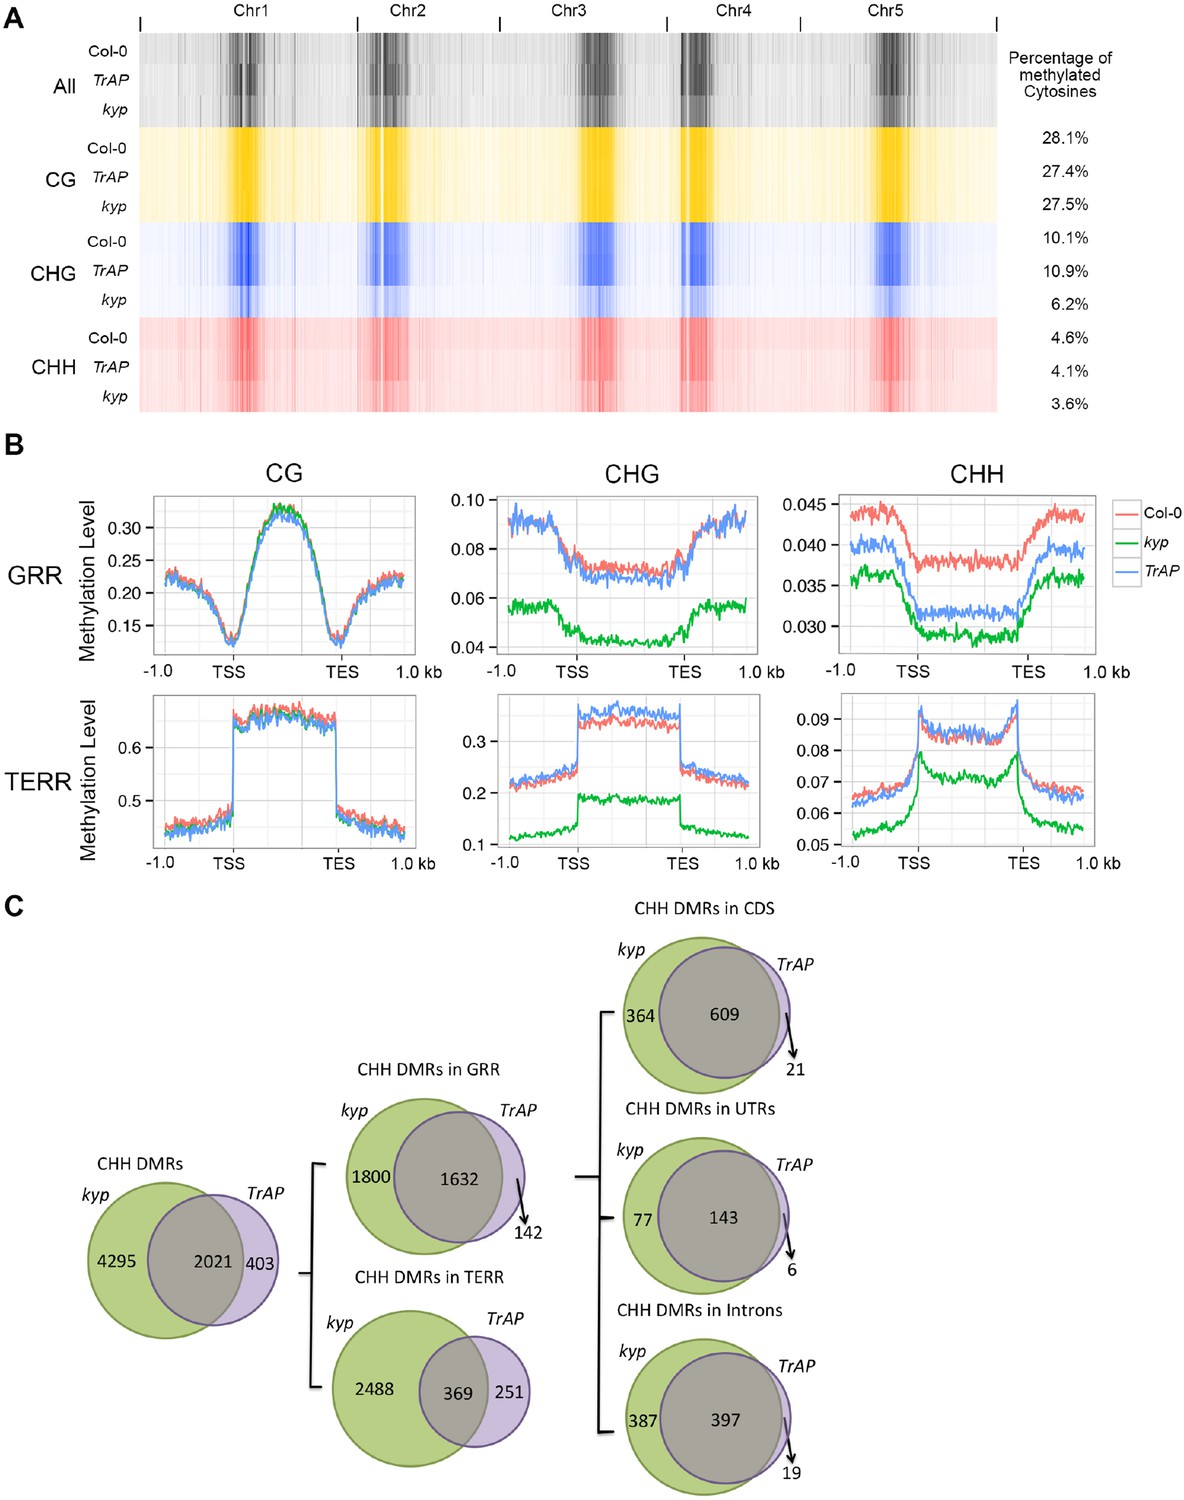
TrAP reduces CHH DNA methylation in vivo.
(A) Genome-wide heatmap of DNA methylation levels in Col-0, kyp mutant, and TrAP transgenic plants (Left). Sequence context of all cytosine, CG, CHG, and CHH methylation was depicted as black, yellow, blue, and red, respectively. The percentage of cytosine methylation is shown for each genotype (Right). (B) Average distribution of context-specific DNA methylation in Gene- and TE-rich regions in Col-0 (red), kyp mutants (green), and TrAP transgenic plants (blue). (C). Overlap of CHH DMRs between TrAP transgenic plants and kyp mutant.
Figure 7—figure supplement 1
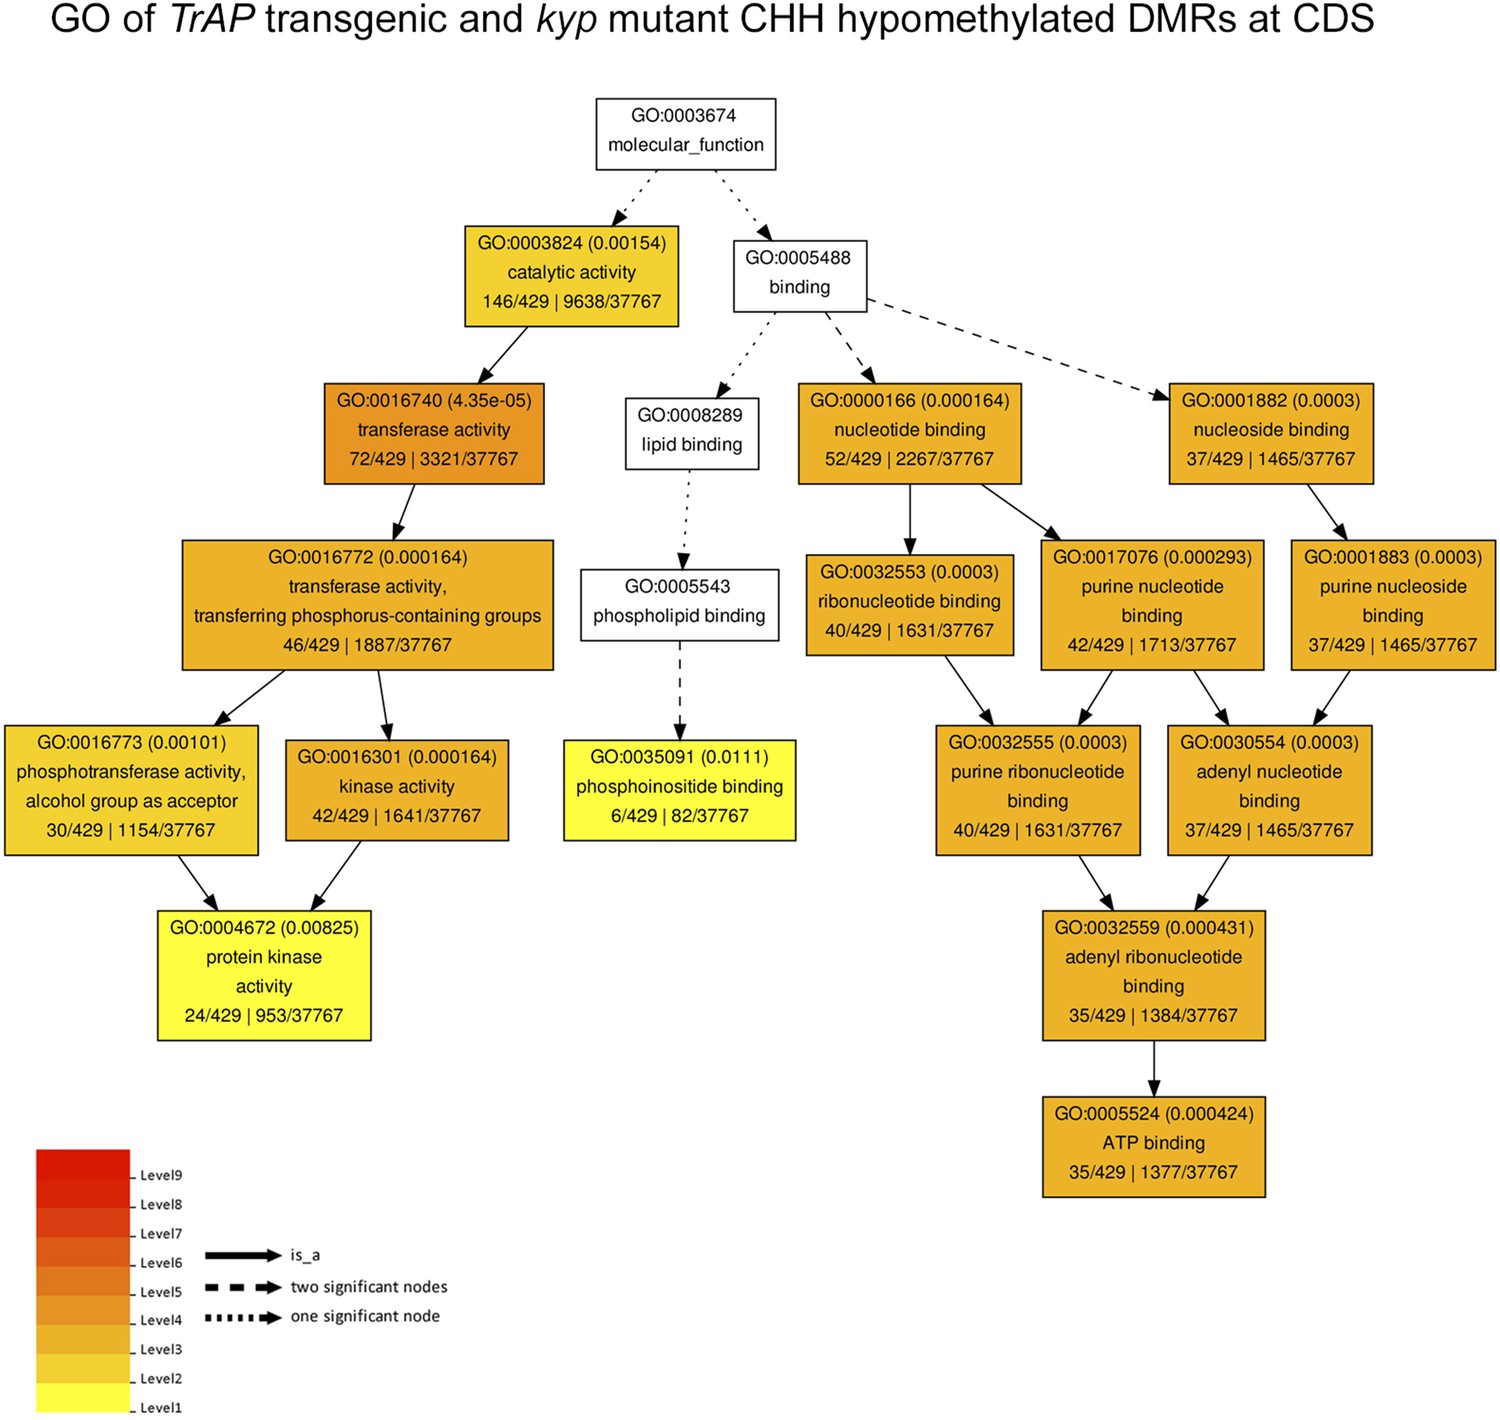
Gene ontology of CHH hypomethylated genes in TrAP transgenic plants and kyp mutant.
The genes associated to the CHH hypomethylated DMRs in both TrAP transgenic and kyp mutant plants underwent Gene Ontology analysis using AgriGo tool with TAIR10 as reference.
Figure 8 with 1 supplement
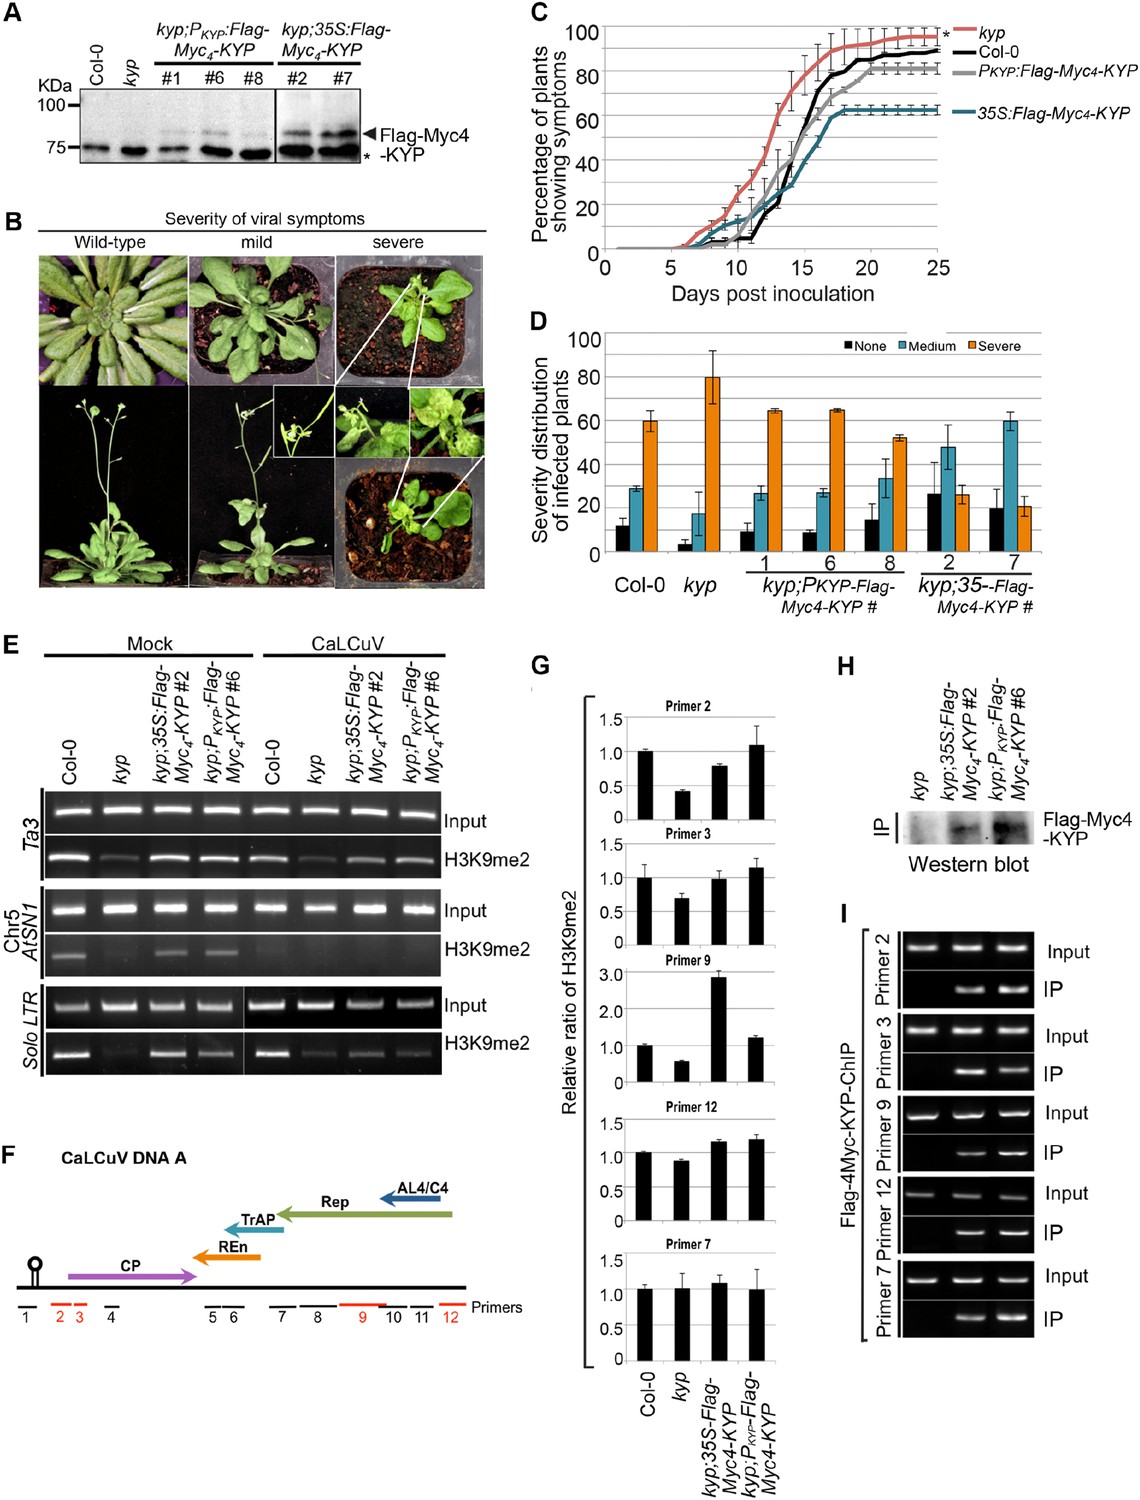
KYP methylates Geminivirus chromatin as a host defense.
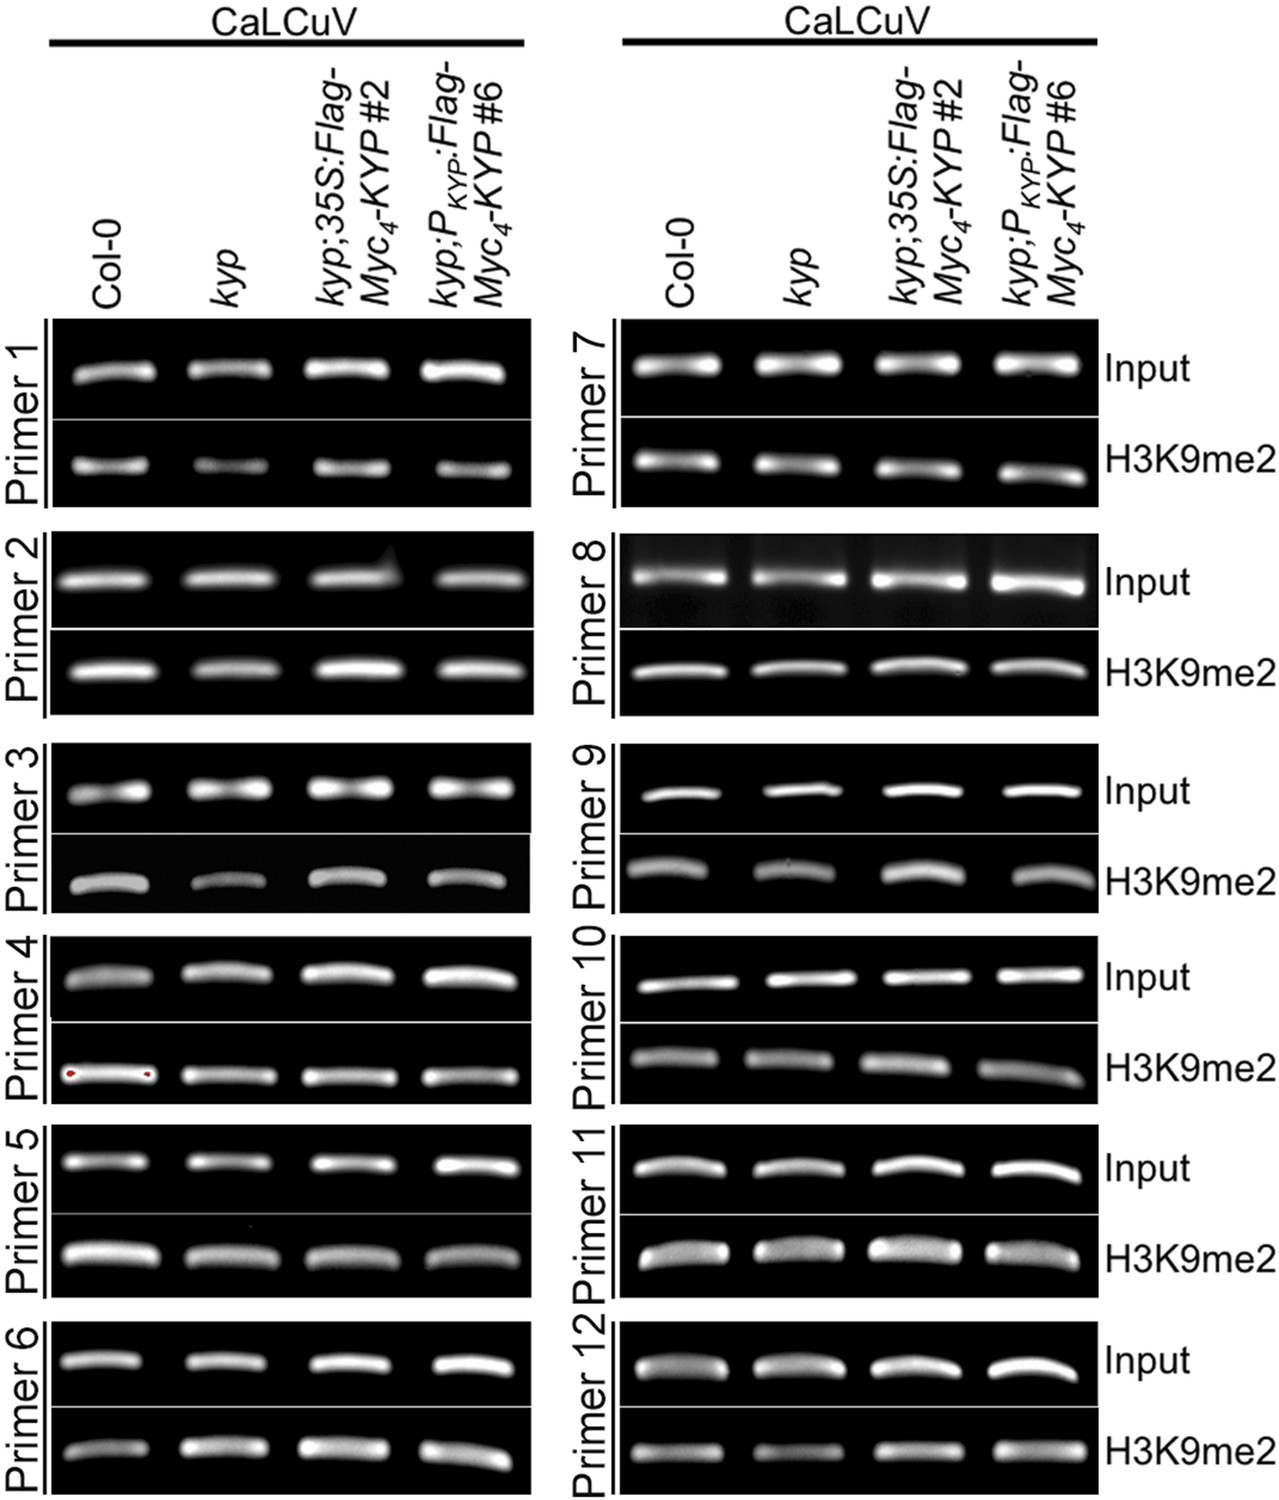
(A) Western blot analysis of kyp complementation lines expressing PKYP- or 35S-Flag-4Myc-KYP using anti-myc antibody. *, a cross-reaction band serves as a loading control. (B) Representative CaLCuV symptoms with different severities. (C) Time course of CaLCuV symptom development in kyp mutant and the complementation lines. The mean values were calculated with SD from at least three experiments (>30 plants/line). (D) CaLCuV symptom severity in Col-0, kyp mutant, and the complementation lines. The mean values were calculated with SD from at least three experiments (>30 plants/line). (E) ChIP-PCR of H3K9me2 marks in heterochromatic loci in kyp mutant and complementation lines inoculated with mock or CaLCuV. Note: CaLCuV infection largely removed H3K9me2 marks from heterochromatic loci. (F) Schematic linearized representation of the regions of viral genome A selected for ChIP assays. (G) ChIP-qPCR assays showed KYP-dependent enrichment of H3K9me2 in several tested loci in the viral chromatin. The relative value of histone methylation in each sample was normalized to that of wild-type control where the signal was arbitrarily assigned a value of 1 with standard deviation (SD) from at least three biological repeats. Note: the region defined by # Primer 7 serves as a negative control. (H) Western blot analysis to detect Flag-Myc4-KYP in the ChIP (IP) samples using anti-myc antibody. (I) ChIP-PCR assays showed that KYP binds to the viral minichromosome. The ChIP assays were done with a monoclonal anti-Flag antibody.
Figure 8—figure supplement 1
Virus chromatin contains H3K9me2 marks.
ChIP-PCR assays of H3K9me2 marks on the CaLCuV DNA A. ChIP assays were conducted on 9-day-old seedlings using antibodies specific for H3K9me2 (Abcam Cat# ab1220), H3K27me3 (Millipore Cat# 07-449), and H3K4me3 (Millipore Cat# 04-745). The PCRs were done with 22 cycles for the input samples and with 28 cycles after ChIP.
Figure 9 with 1 supplement
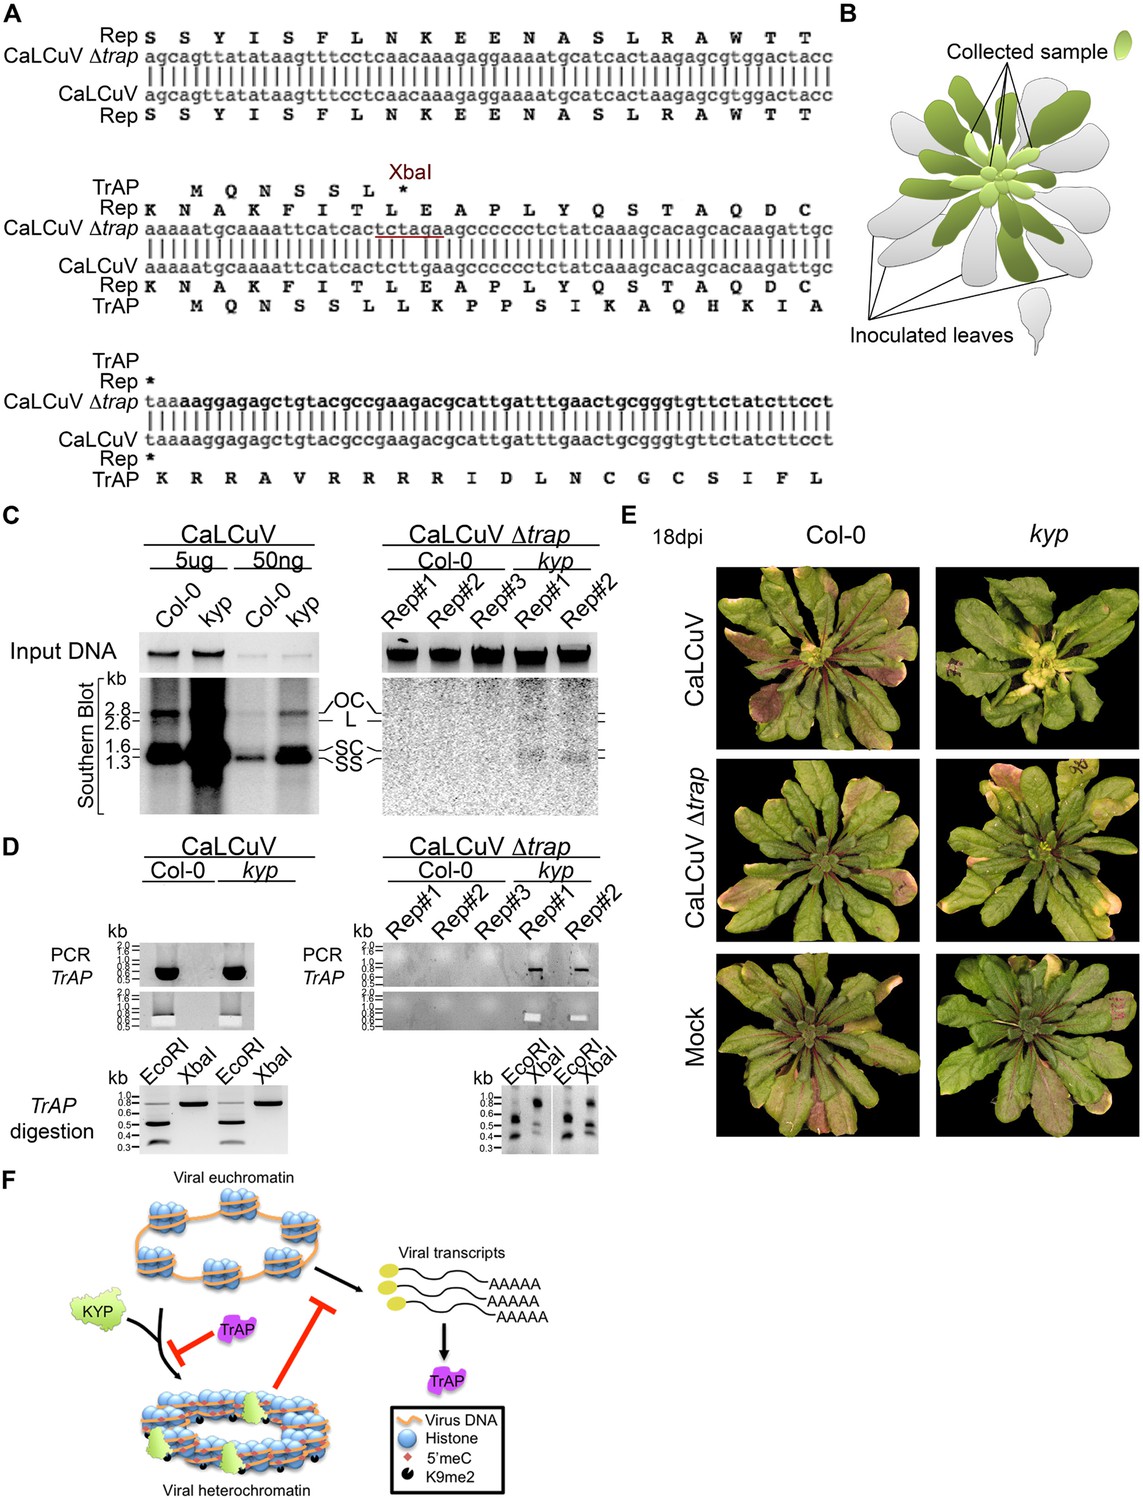
Infectivity of CaLCuV lacking functional TrAP protein.
(A) Sequence alignment of CaLCuV Δtrap and CaLCuV sequences. The translated amino acids are shown for each sequence, and the XbaI restriction site resulting from the T to A point mutation is highlighted. (B) Schematics of the systemic infection experiment. Plants with eight true leaves (depicted in gray) were inoculated with the begomovirus, and 18 days post inoculation nine to 11 newly emerged, not inoculated, rosetta leaves (depicted in bright green) were collected to test for virus systemic infection. (C) Southern blot analysis of viruses in non-inoculated leaves of infected plants. Ethidium bromide staining of total genomic DNA serves as a loading control (top panels). Southern blots were probed against CaLCuV DNA A common region (CR) (bottom panels); the viral populations are indicated as the replicative intermediate open circle (OC), linear (L), super coiled (SC) and the infective particle ss DNA. (D) Genotypic confirmation of the systemically amplified viruses. Top panels show PCR amplification of a TrAP-containing region; bottom panels show EcoRI and XbaI digestions of PCR products to examine the presence of the amber mutation in the gene. (E) Exemplary phenotypes of wild-type and kyp mutant plants inoculated with mock, CaLCuV and CaLCuV Δtrap. (F) Model of TrAP suppression of KYP activity to prevent epigenetic silencing of the viral chromatin. Geminivirus genome is packed on histone octamers to form a minichromosome. The minichromosome undergoes extensive H3K9me2 modification deposited by host-encoded KYP, and this modification could be further reinforced by DNA methylation, leading to formation of viral heterochromatin. As a counter-defense strategy, Geminivirus-encoded TrAP protein inhibits KYP activity to maintain the euchromatic status of the minichromosome to allow active replication and transcription of viral genes and correspondingly to escape host surveillance.
Figure 9—figure supplement 1
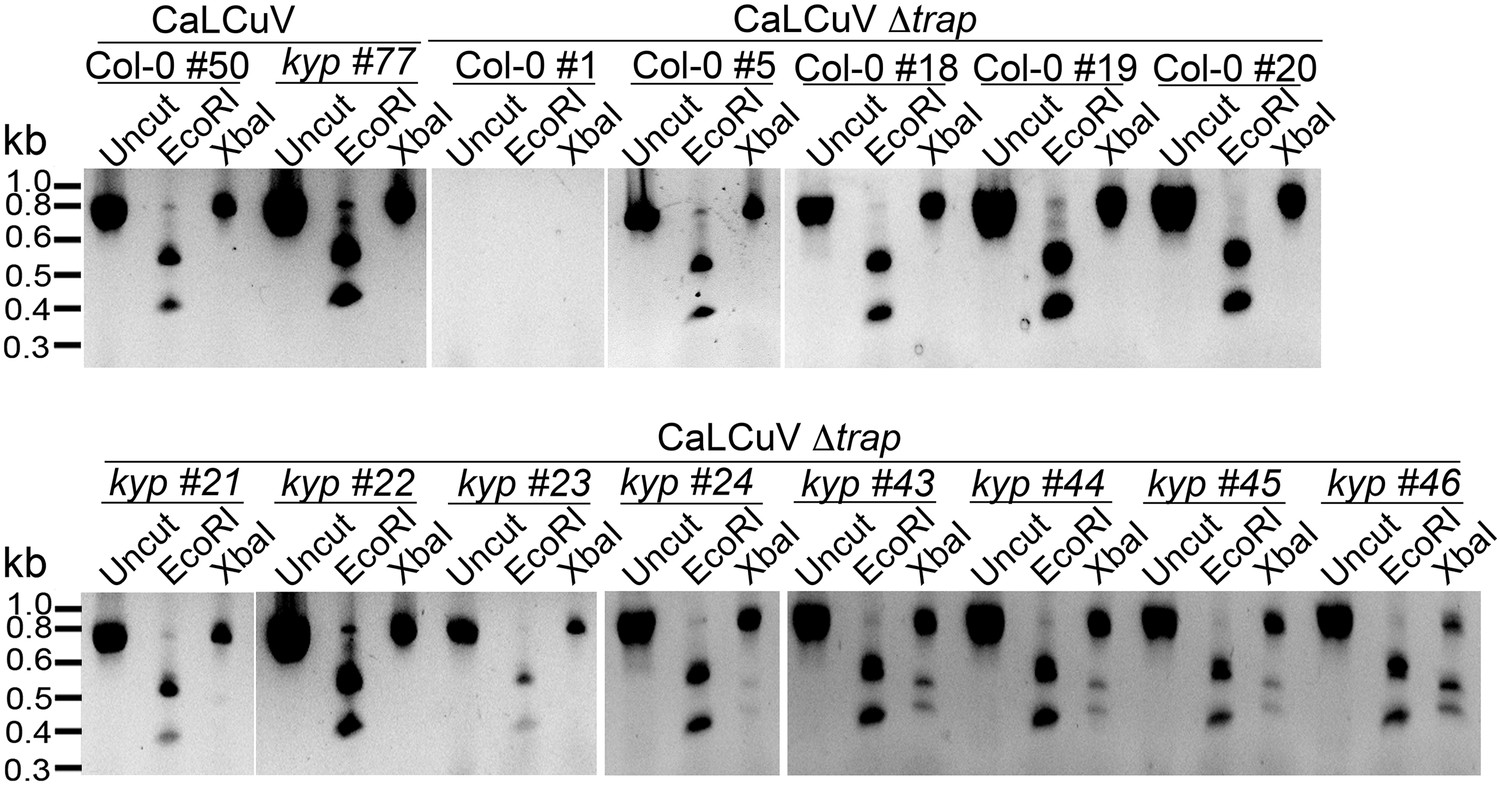
CaLCuV lacking functional TrAP protein cannot cause systemic infection in wild-type plants.
The region corresponding to TrAP gene was amplified by PCR using the primers AL3_cterm_F and AL1_cterm_R (Supplementary file 8) from total DNA extracted from plants infected with CaLCuV or CaLCuV Δtrap. 5 μl of the PCR products were run, and 3 μl were used for digestion with EcoRI or XbaI to examine the presence of the amber mutation in all the amplified products.
Author response image 1
Additional files
-
Supplementary file 1
Microarray analysis of 35S-TrAP transgenic plants.
- https://doi.org/10.7554/eLife.06671.021
-
Supplementary file 2
Transcriptome comparison of the genes deregulated by TrAP overexpression and lhp1 loss-of-function mutant.
- https://doi.org/10.7554/eLife.06671.022
-
Supplementary file 3
Expression levels of genes encoding for TGS components in TrAP transgenic plants.
- https://doi.org/10.7554/eLife.06671.023
-
Supplementary file 4
List of proteins tested for interaction with TrAP.
- https://doi.org/10.7554/eLife.06671.024
-
Supplementary file 5
CG methylation analysis of Col-0 wild type, kyp mutant, and TrAP transgenic plants.
- https://doi.org/10.7554/eLife.06671.025
-
Supplementary file 6
CHG methylation analysis of Col-0 wild type, kyp mutant, and TrAP transgenic plants.
- https://doi.org/10.7554/eLife.06671.026
-
Supplementary file 7
CHH methylation analysis of Col-0 wild type, kyp mutant, and TrAP transgenic plants.
- https://doi.org/10.7554/eLife.06671.027
-
Supplementary file 8
List of primers used in this article.
- https://doi.org/10.7554/eLife.06671.028
Download links
A two-part list of links to download the article, or parts of the article, in various formats.
Downloads (link to download the article as PDF)
Open citations (links to open the citations from this article in various online reference manager services)
Cite this article (links to download the citations from this article in formats compatible with various reference manager tools)
Geminivirus-encoded TrAP suppressor inhibits the histone methyltransferase SUVH4/KYP to counter host defense
eLife 4:e06671.
https://doi.org/10.7554/eLife.06671


