MutS/MutL crystal structure reveals that the MutS sliding clamp loads MutL onto DNA
- Netherlands Cancer Institute, Netherlands
- Justus-Liebig-University, Germany
- Erasmus Medical Center, Netherlands
- MRC Laboratory of Molecular Biology, United Kingdom
Figures
Figure 1 with 2 supplements
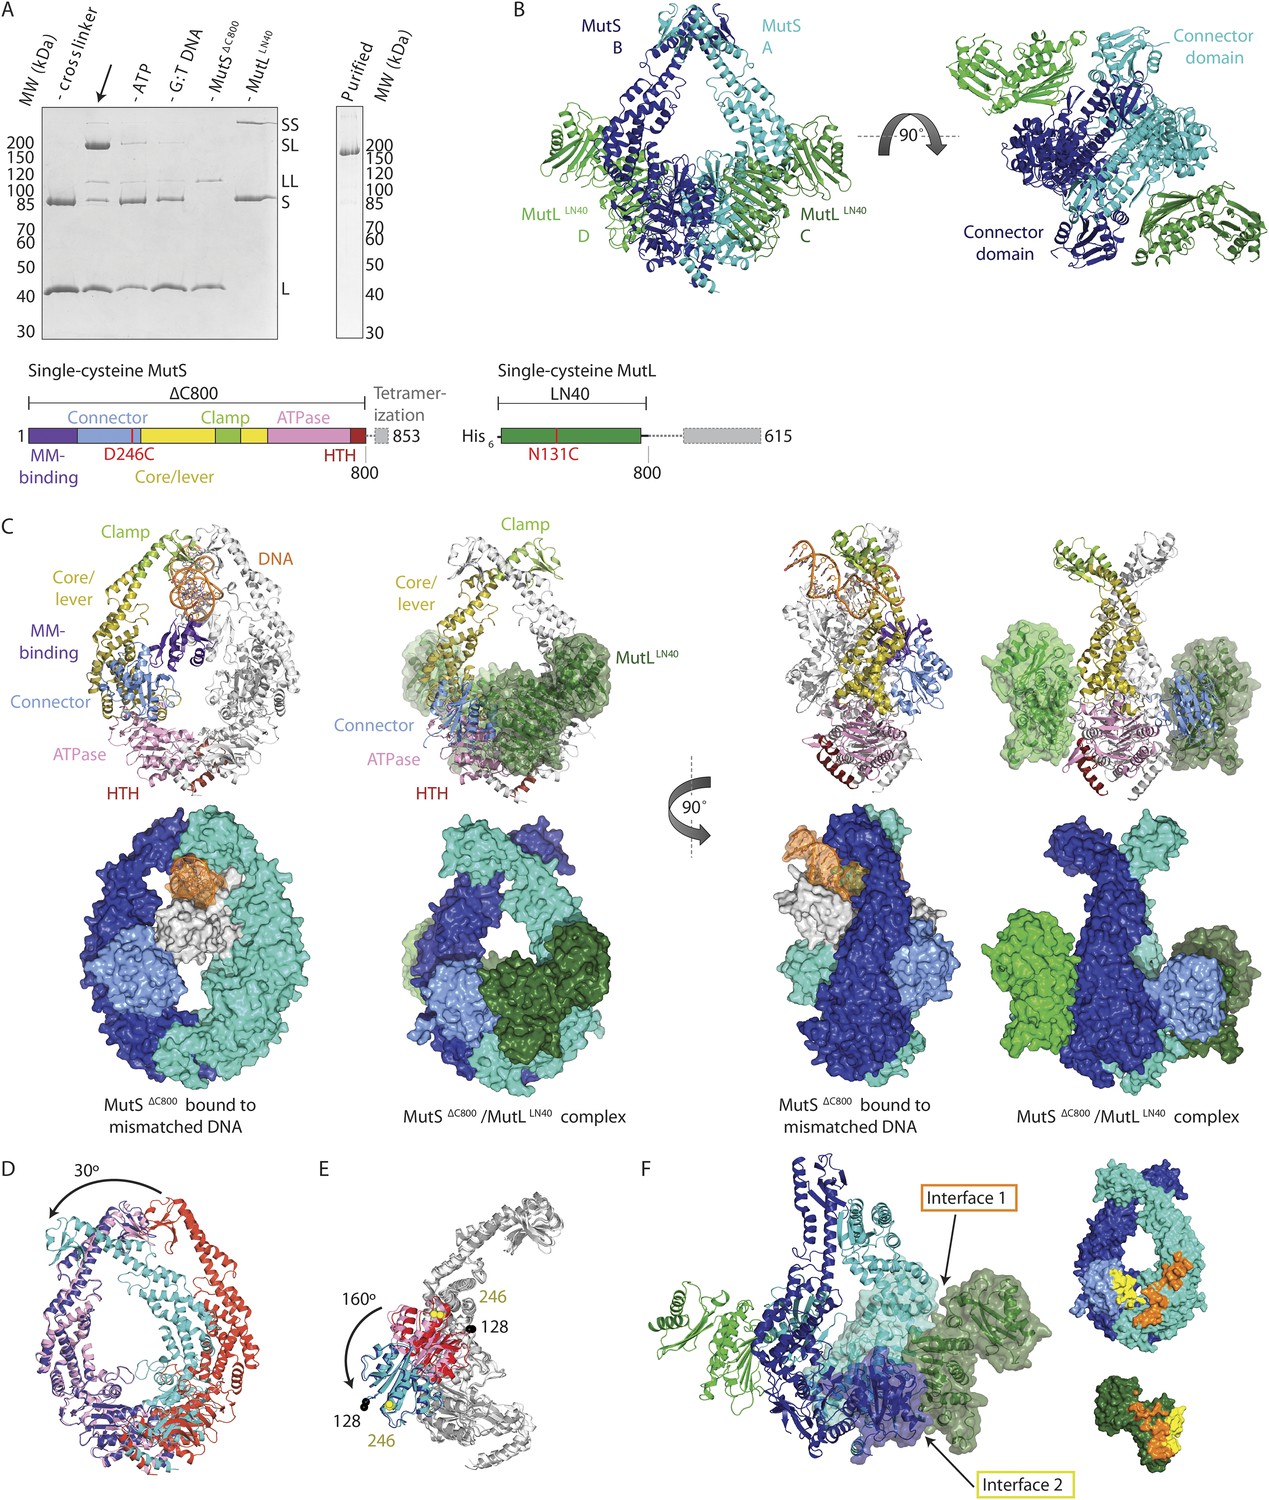
Crystal structure of the crosslinked MutSΔC800/MutLLN40 complex.
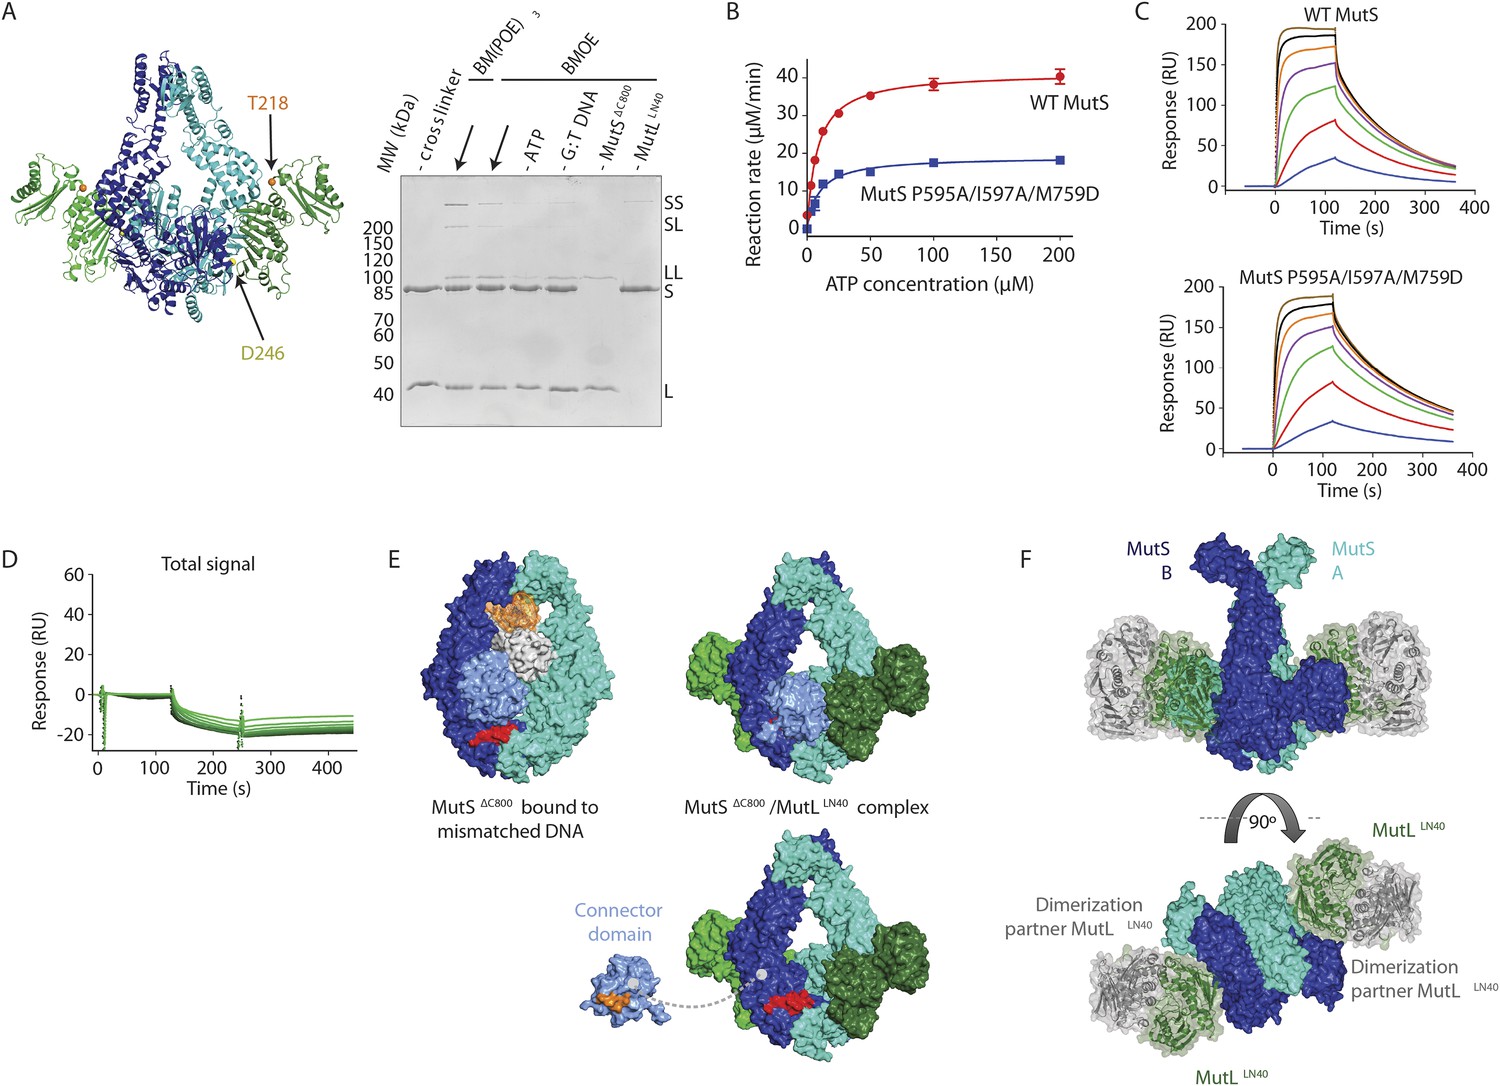
(A) DNA and ATP-dependent crosslinking of MutSΔC800 D246C (S) and MutLLN40 N131C (L) and large-scale purification. Constructs and domain definitions are shown. (B) Crystal structure of the trapped transient complex of MutSΔC800 dimer (blue/cyan) with MutLLN40 (green). (C) Comparison between MutSΔC800 in mismatch-recognition state (1E3M.pdb) and the MutSΔC800/MutLLN40 complex, with MutS subunit B colored as in (A). (D) The dimer subunits (blue/cyan) tilt across each other (connector and mismatch-binding domains not shown for clarity) compared to the mismatch-bound state (red/pink). (E) The connector domain (blue/cyan) rotates around residues 265–266 compared to the mismatch-bound state (red/pink) relative to other domains. Reorientation of residues 128 and 246 indicated. (F) Each MutLLN40 subunit (green) interacts via two interfaces (orange/yellow) with the MutSΔC800 dimer (blue/cyan).
Figure 1—figure supplement 1
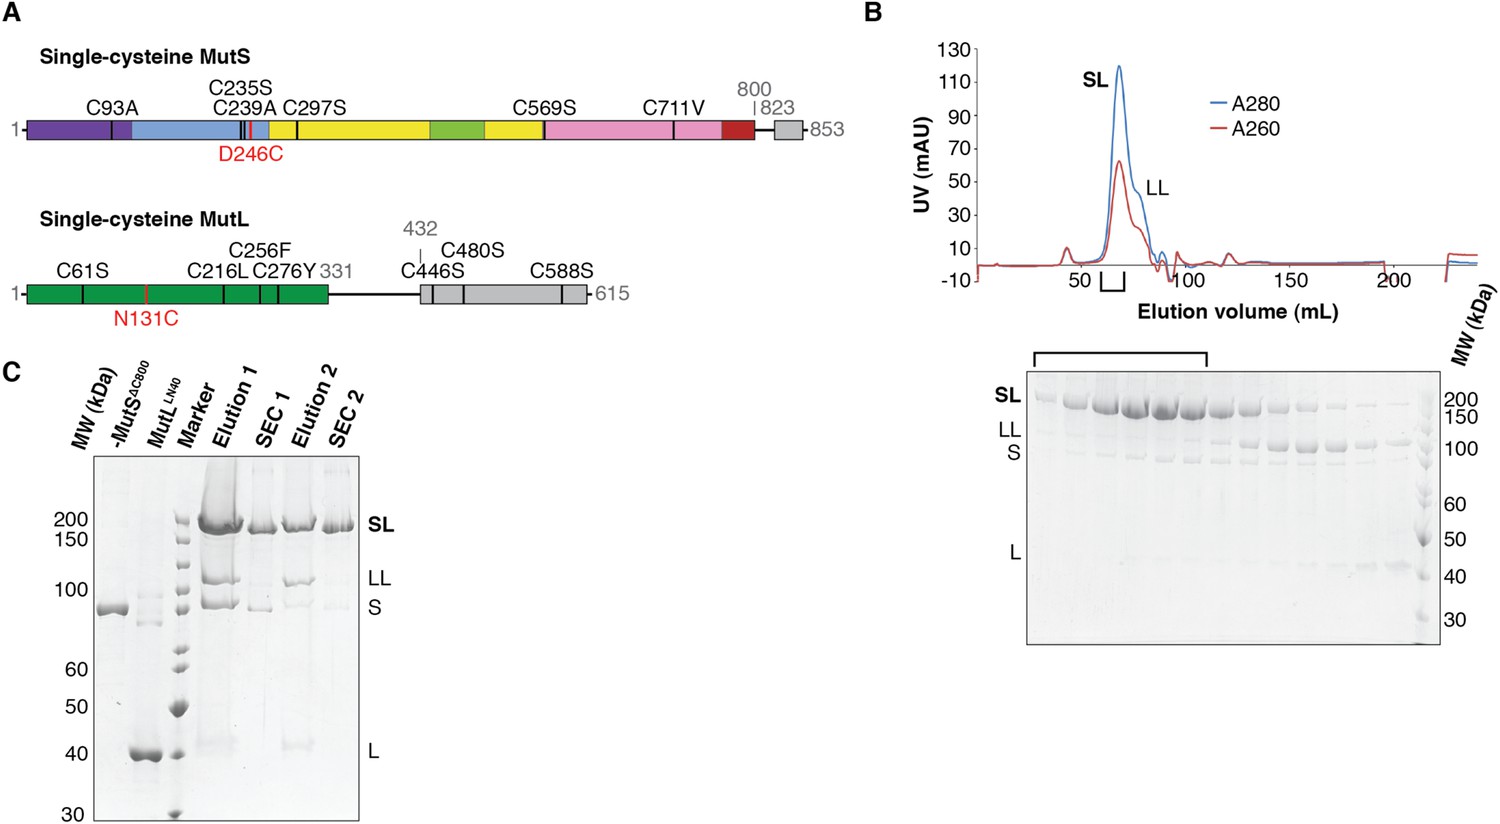
Crosslinking, purification and crystal structure of the 856 MutSΔC800/MutLLN40 complex.
(A) Single-cysteine MutS D246C and single-cysteine MutL 857 N131C constructs with replaced and introduced cysteine positions are shown, and colored 858 according to domain definitions in main text Figure 1. (B) Final size-exclusion 859 chromatography profile and corresponding SDS-PAGE gel for the purification of the 860 MutSΔC800/MutLLN40 complex (SL). Pooled fractions are indicated. (C) Two rounds of 861 crosslinking and purification of MutSΔC800 D246C and MutLLN40 N131C result in almost all 35 MutSΔC800 subunits crosslinked to MutLLN40, as shown on SDS-PAGE (862 elutions from Talon 863 beads and size-exclusion chromatography [SEC] are indicated).
Figure 1—figure supplement 2
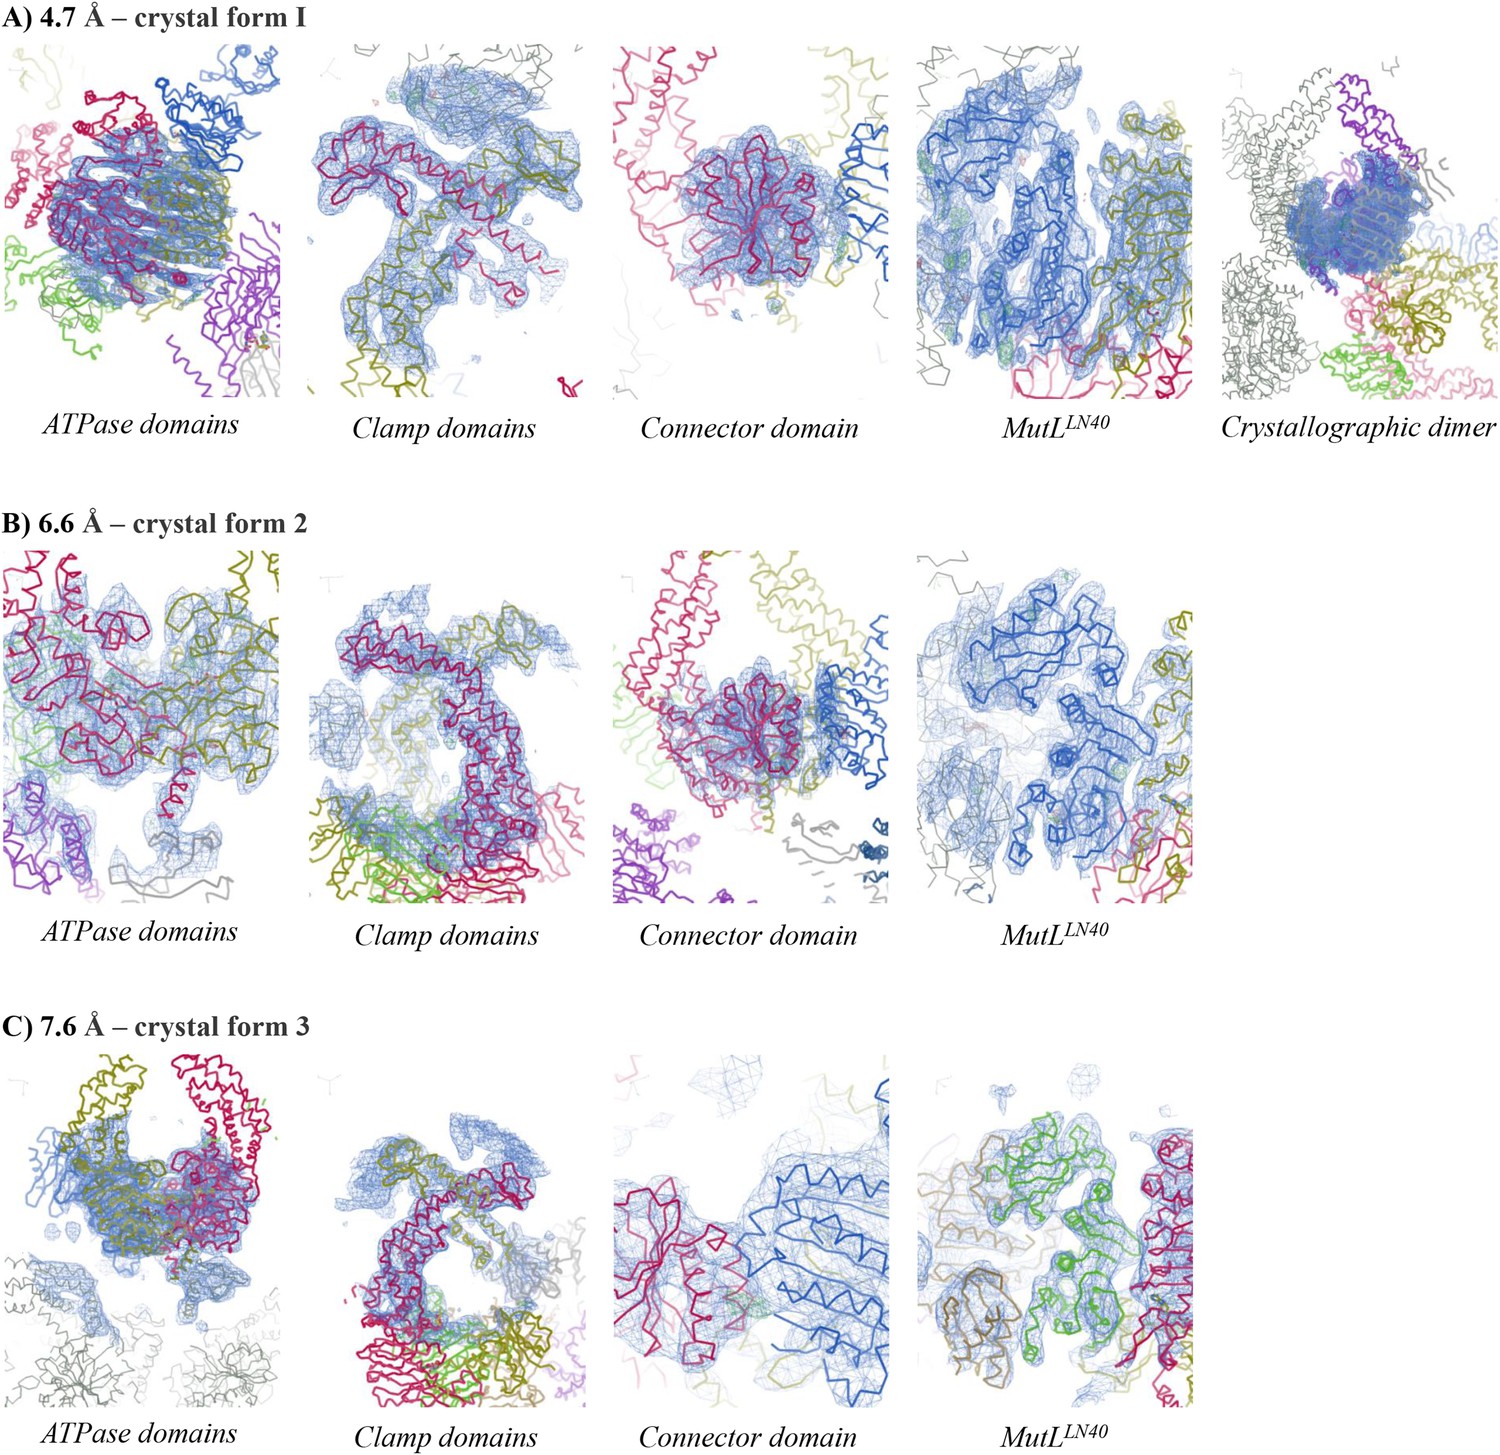
Electron density for different crystal forms of the MutSΔC800/MutLLN40 complex.
Electron density shown in region around the domain indicated at contour level 1.0 rmsd and 3.50 rmsd for the difference density map. (A) Crystal form 1, (B) Crystal form 2, (C) Crystal form 3.
Figure 2 with 2 supplements

The structure of the MutSΔC800/MutLLN40 complex reveals the MutS sliding clamp conformation.
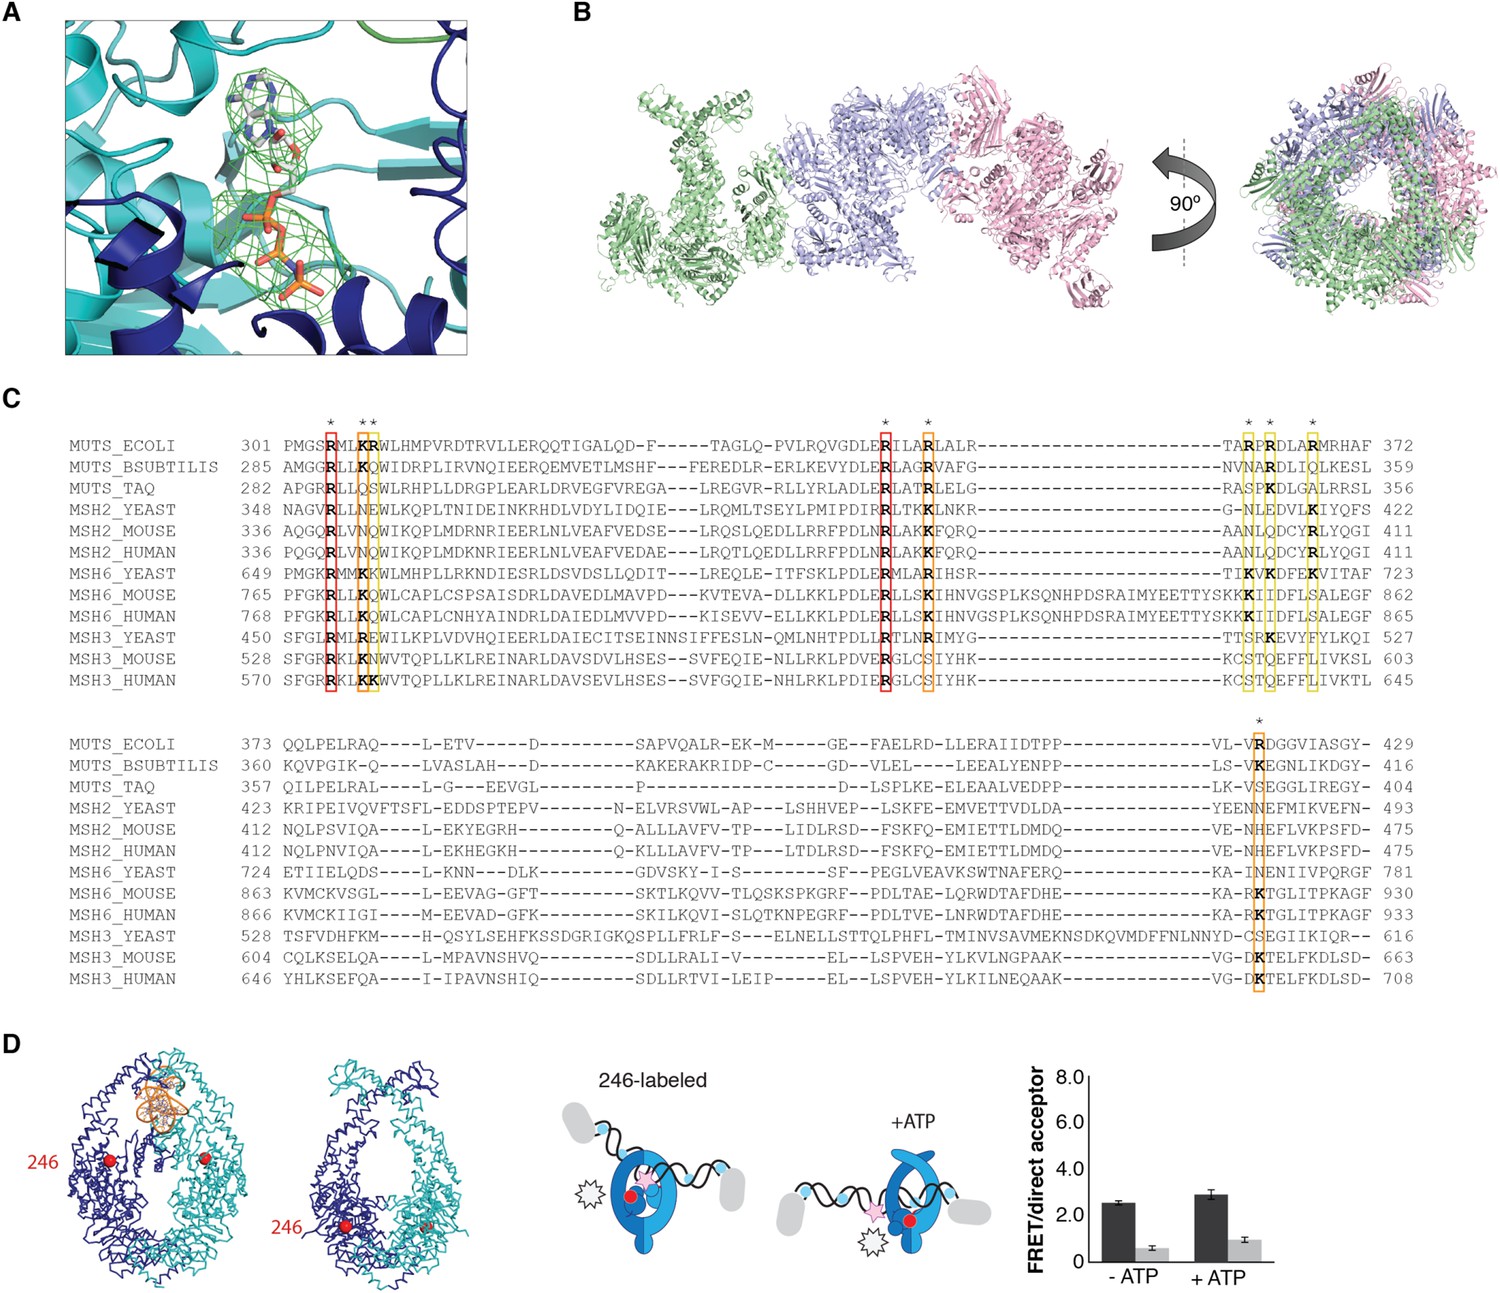
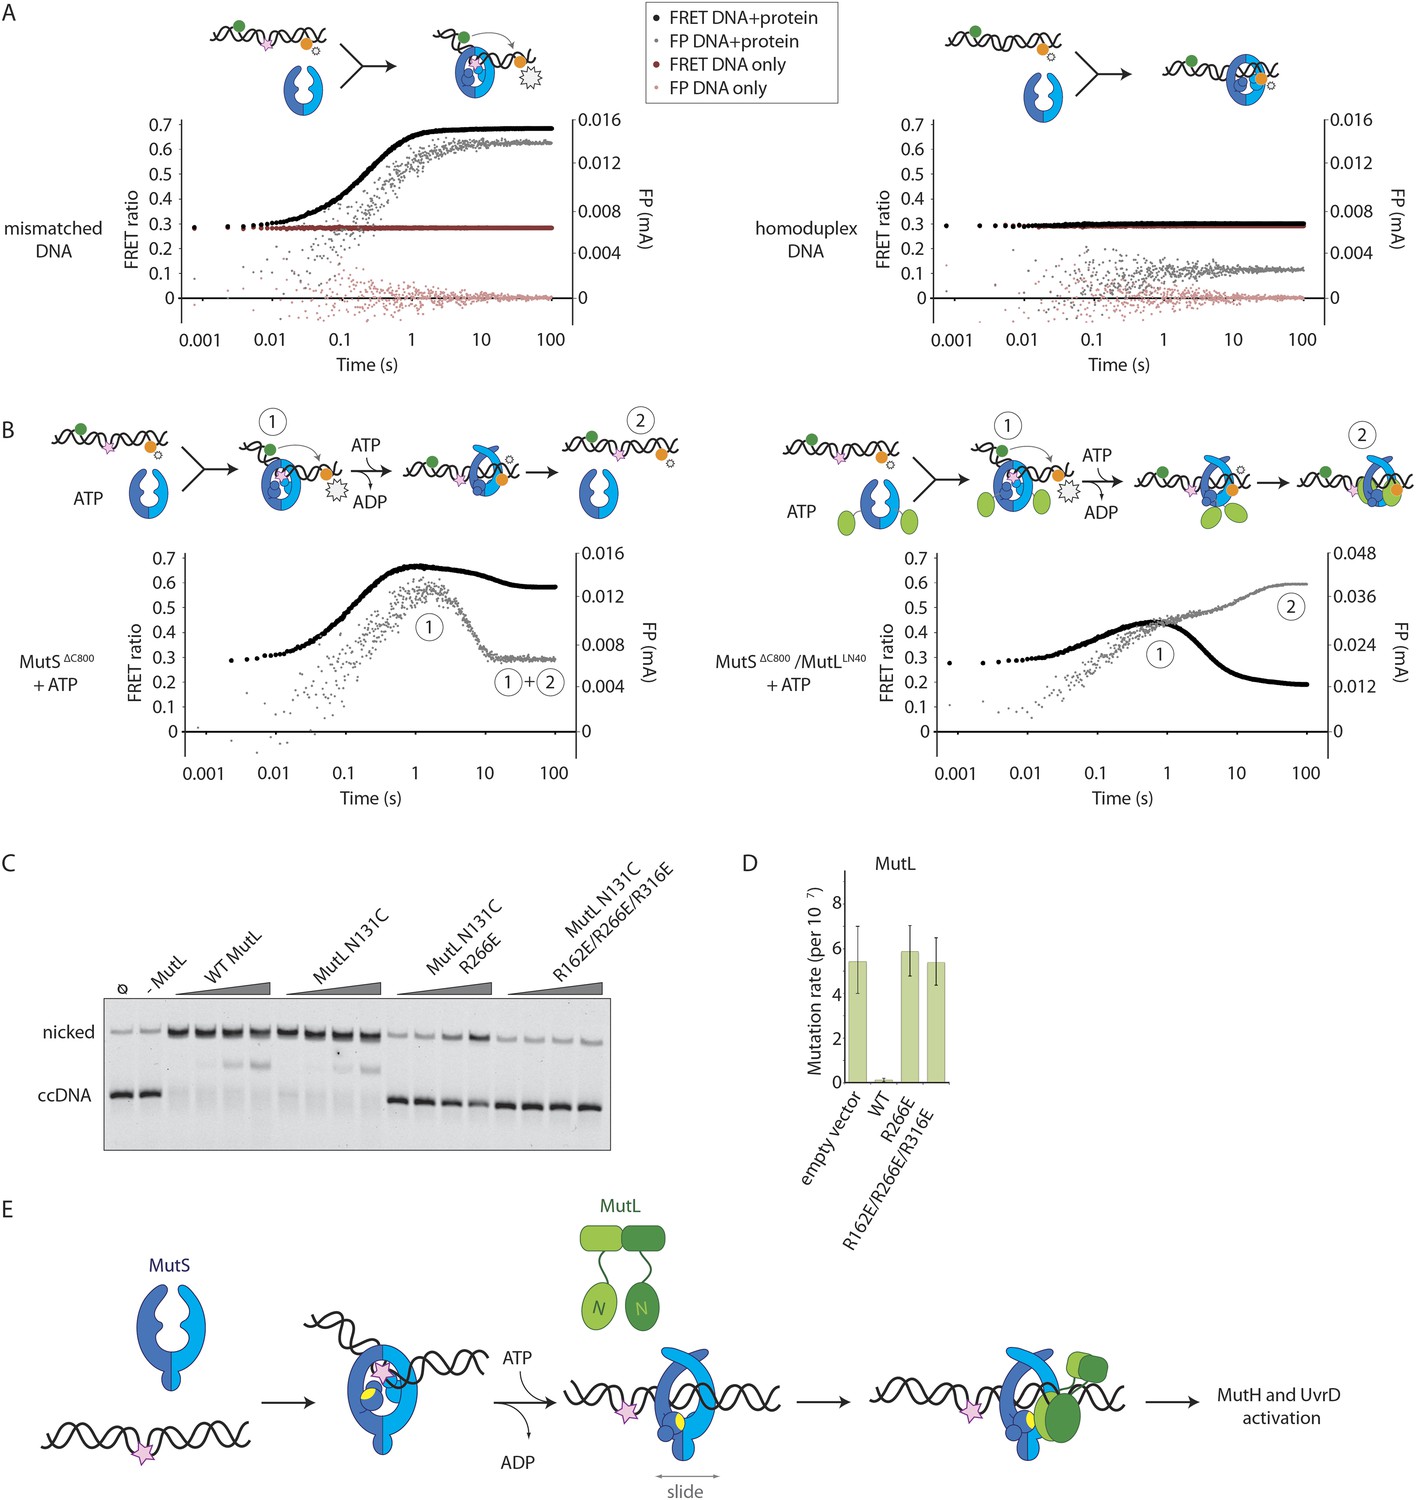
(A) FRET within MutS dimers (normalized for unbound protein) reveals residues 449 coming closer together upon ATP addition. Error bars depict mean ± SD, n = 3. (B) FRET assay agrees with residue 246 on the connector domain of MutS moving towards residue 798 upon ATP addition after mismatch recognition. (C) Mismatch and ATP-induced conformational changes open a channel lined by positively charged residues (left: arginines and lysines as red sticks, middle: electrostatic surface), which would fit a DNA helix (right). (D) FRET assay agrees with movement of DNA away from residues 449 in MutS, while approaching residues 336 upon ATP addition as schematically depicted (DNA mismatch represented by pink star).
Figure 2—figure supplement 1
ATP-analog and DNA in the crystal structure.
(A) Difference density map for AMP-PNP (mFo-DFc at 2.8σ) after refinement without the nucleotide is shown for MutS subunit A in the 4.7 Å crystal structure. (B) The asymmetric unit in the P21 crystal form that diffracted to 7.6 Å, which was crystallized with 100-bp DNA aligns the channels in the three MutSΔC800 dimers (green, violet and pink cartoon representations) such that a DNA strand would fit through all complexes simultaneously. (C) Sequence conservation of the positively charged residues (indicated by asterisks) in the DNA channel of the MutS sliding clamp. Red: positive charge fully conserved; orange: conserved in >50% of the species shown; yellow: conserved in <50% of the species shown. (D) No change in FRET between labeled residue 246 on MutS and labeled DNA is observed upon addition of ATP, in agreement with reorientation of the connector domain concomitant with repositioning of the DNA to the new channel.
Figure 2—figure supplement 2
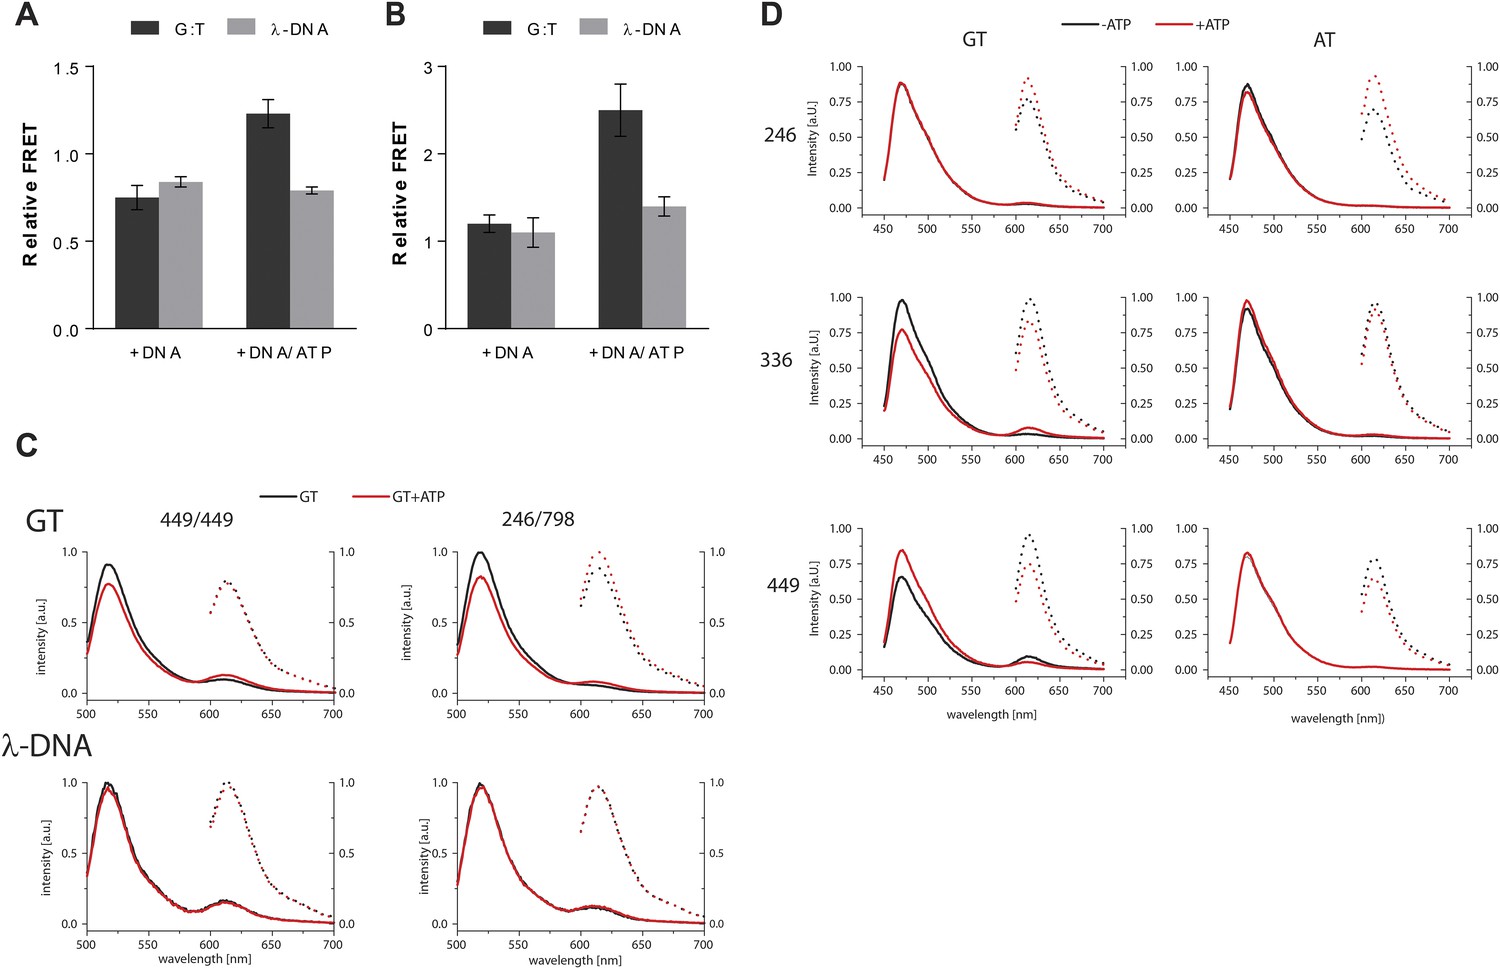
FRET assay – controls and raw data.
(A) FRET (normalized for unbound protein) within MutS D835R heterodimers (449-AF488/449-AF594) reveals residues 449 coming closer together upon ATP addition when bound to mismatch DNA. Bars depict mean +/− SD, n = 3. (B) FRET assay within MutS D835R heterodimers (246-AF594/798-AF488) shows that residue 246 on the connector domain of MutS moving towards residue 798 upon ATP addition when bound to mismatch DNA. Bars depict mean +/− SD, n = 3 (C) Example of emission spectra with excitation at 485 nm (solid lines) or 590 nm (dashed lines) of MutS D835R heterodimers (449-AF488/449-AF594 (left) or 246-AF594/798-AF488) (right) (in the presence of the indicated DNA (GT-59 or homoduplex DNA λ-DNA) in the absence (black) or presence of ATP (red). (D) Example of emission spectra with excitation at 435 nm (solid lines) or 590 nm (dashed lines) of MutS D835R variants 246 (top) that corresponds to bar graph in Figure 2—supplement 1D, 336 (middle) or 449 (bottom) that correspond to bar graph in Figure 2D. The proteins labeled with Alexa Fluor 594 in the presence of the indicated DNA (GT30 or AT30) stained with Sytox Blue in the absence (black) or presence of ATP (red). (see Materials and Methods for details).
Figure 3 with 2 supplements
Interaction of the MutSΔC800 sliding clamp with MutLLN40.
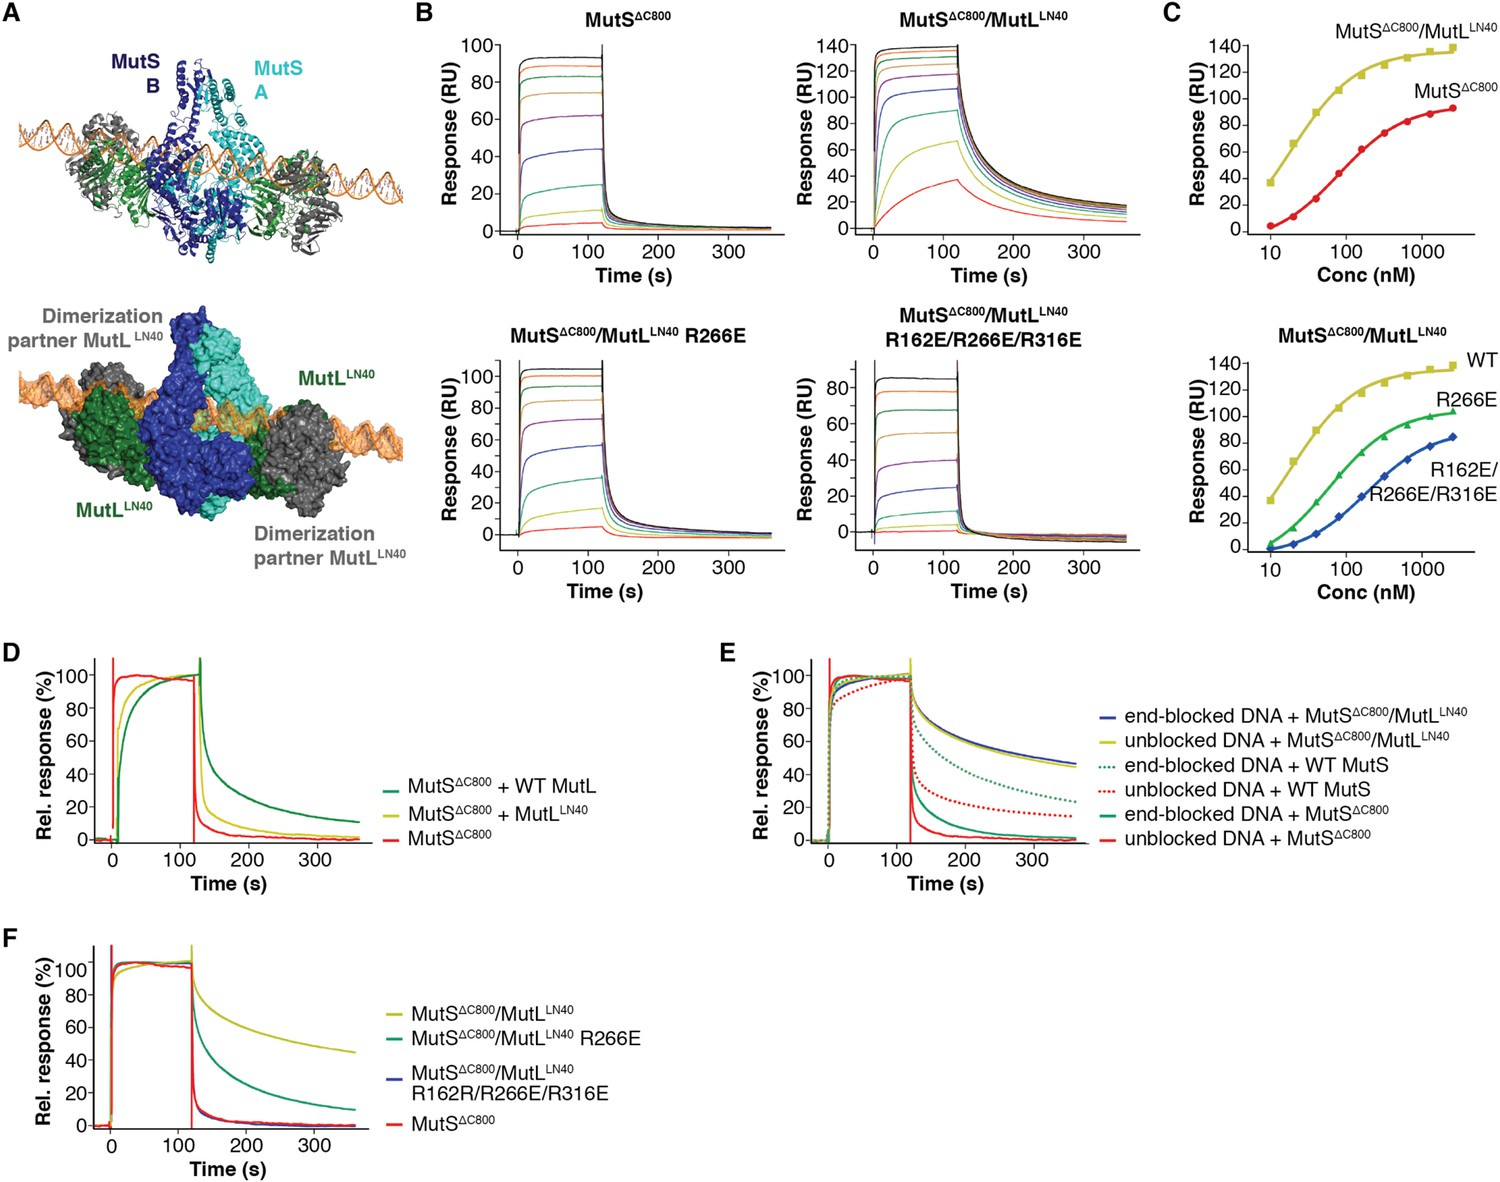
(A) Crosslinking occurs between MutSΔC800 A336C and MutLLN40 T218C using BMOE (right panel), as suggested by the structure (left panel). (B) Spontaneous mutation rates after complementing MutS or MutL-deficient cells with the indicated mutants. Error bars represent 95% confidence intervals. (C) SPR assay to measure MutL binding to pre-formed MutS sliding clamps on end-blocked DNA. MutL contribution (green dotted line) is approached by subtracting MutS-only contribution (blue line) from the total signal (solid line). Data normalized to maximum MutS response. (D) MutL and MutS mutants with deficiency in MMR show reduced MutS/MutL complex formation in SPR. Error bars represent SD for averages between two experiments. (E) The yellow patch of MutSΔC800 interacts with MutLLN40 in the new conformation after rearrangement of the connector domain. (F) Residues in MutSΔC800/MutLLN40 interfaces. Red: full MMR deficiency upon mutation; orange: deficiency upon combination; white: mild effect.
Figure 3—figure supplement 1
MutS–MutL interaction.
(A) MutSΔC800 D246C and MutLLN40 T218C do not crosslink efficiently with either a short (BMOE, 8 Å) or a long (BM[PEO]3, 18 Å) crosslinker, as e.g. seen by lack of MutS and MutL depletion. (B) MutS P595A/I597A/M759D shows ATPase activity with similar Km (9.5 ± 1 μM) as WT MutS (8.1 ± 0.7 μM) but differs in Kcat (mutant: 3.8 ± 0.1 min−1; WT 8.3 ± 0.2 min−1). Data points are averages between two measurements and error bars indicate standard deviations. (C) MutS P595A/I597A/M759D shows similar sliding clamp formation as WT MutS (assay on end-blocked 21-bp DNA with dT20 linker; Groothuizen et al., 2013). (D) Without preformed MutS sliding clamps, there is only little binding of MutL to DNA. (E) The region in the ATPase domain that is solvent exposed during mismatch recognition but showed reduced deuterium exchange upon MutL binding (red, residues 673–686) (Mendillo et al., 2009) is buried by the connector domain (light blue surface; orange patch is close to residues 673–686). (F) The association with the MutSΔC800 sliding clamp (blue/cyan) does not sterically hinder potential dimerization by the MutLLN40 domains (dimer modeled in green and grey as present in pdb entry 1NHJ).
Figure 3—figure supplement 2
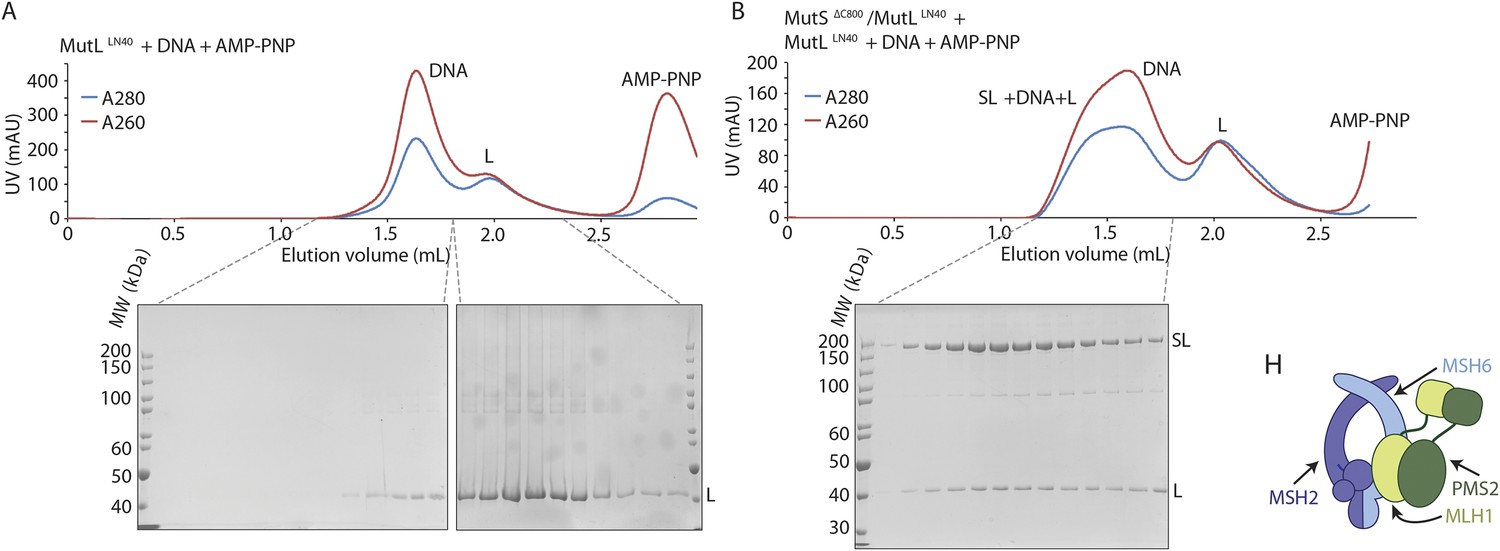
(A) MutLLN40 (L) coelutes with crosslinked MutSΔC800/MutLLN40 complex (SL) from size-exclusion chromatography (right), after incubation with 100-bp DNA with a G:T mismatch and AMP-PNP, indicating that MutL can still dimerize in this complex.
(B) Model for MSH2/MSH6 interaction with MLH1/PMS2, in which the N-terminus of MLH1 simultaneously binds to the connector domain of MSH2 and the APTase and core domains of MSH6.
Figure 4 with 1 supplement
The MutS sliding clamp positions MutL onto DNA.
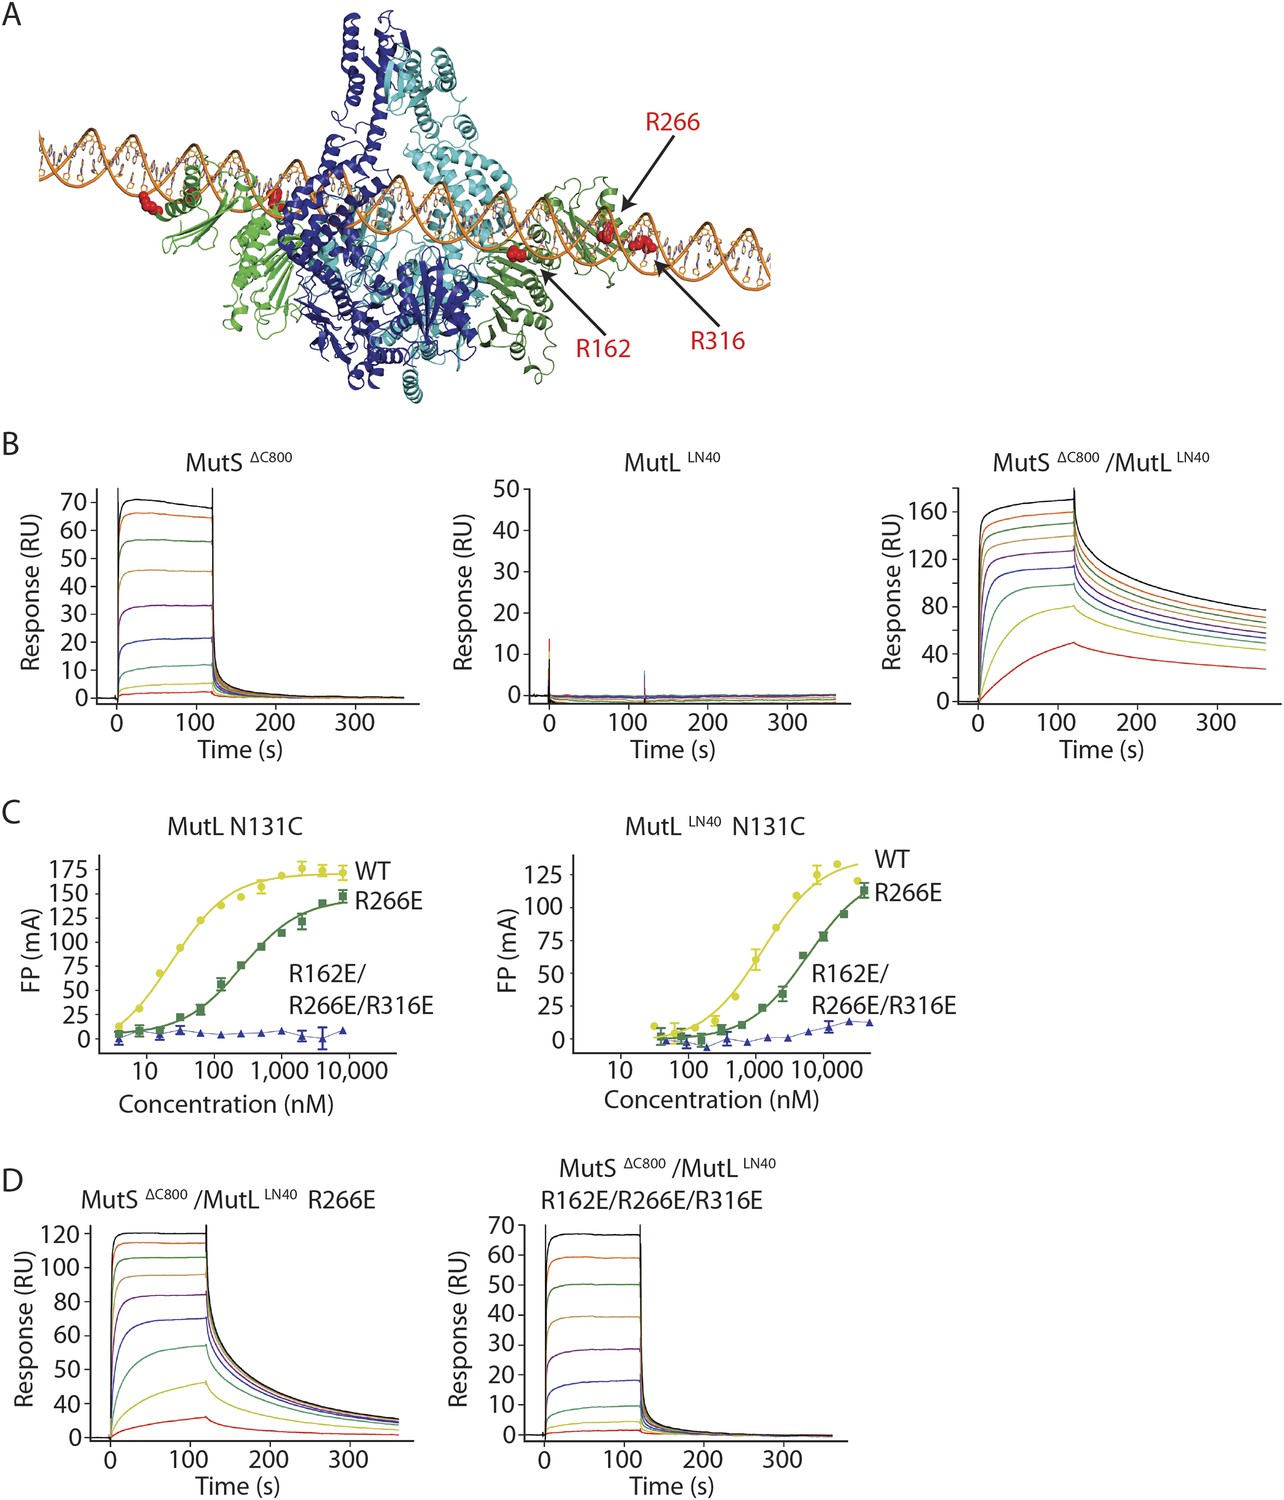
(A) Model of DNA binding by the MutSΔC800/MutLLN40 complex. Three arginines in the MutLLN40 DNA-binding groove are shown as red spheres. (B) In the presence of ATP, MutSΔC800 has a fast off-rate from 100-bp DNA and MutLLN40 alone does not bind DNA under physiological salt (150 mM KCl), while the crosslinked MutSΔC800/MutLLN40 complex releases slowly from DNA. (C,D) Mutations in the DNA-binding groove of MutL reduce its DNA-binding ability (observed in low salt, 50 mM KCl) (C) and affect release rates of the MutSΔC800/MutLLN40 complex in physiological salt conditions (D).
Figure 4—figure supplement 1
DNA binding by the MutSΔC800/MutLLN40 complex.
(A) The model for MutSΔC800/MutLLN40 complex on DNA (orange) sterically allows for LN40 dimerization (dimer modeled in green and grey as present in pdb entry 1NHJ). (B) Analysis as in Figure 4B, but using shorter, 41-bp mismatched DNA (ATAGGACGCTGACACTGGTGCTTGGCAGCTTCTAATTCGAT annealed with ATCGAATTAGAAGCTGCCAGGCACCAGTGTCAGCGTCCTAT) shows that crosslinked LN40 slows down the MutS sliding clamp on with a G:T mismatch, but point mutations in the MutLLN40 DNA-binding groove can abolish this. (C) Absolute response from the assay on 41-bp DNA fitted (single-site binding mode) to estimate maximum signal. Comparison shows that maximum response for MutSΔC800/MutLLN40 binding (150 RU) is 45% higher than for MutSΔC800 alone (104 RU). Since the MutSΔC800/MutLLN40 complex is 43% larger than MutSΔC800 dimer alone, this indicates that in this assay a single MutSΔC800/MutLLN40 complex binds the DNA duplex. (D) Co-injection of WT MutL results in slower release from DNA than MutSΔC800 alone, while uncrosslinked MutLLN40 only has a minor effect (traces normalized to maximum response). (E) While end-blocks on the DNA slow down MutS release, there is no effect on the already slow MutSΔC800/MutLLN40 release. This is more pronounced for WT MutS, which forms more stable dimers than MutSΔC800. Crosslinked MutLLN40 with mutations in the DNA-binding groove is deficient in the ability to retain MutSΔC800 on DNA. (F) Normalized overlay of the 1280 nM traces from Figure 4B,C.
Figure 5 with 1 supplement
Implications for DNA mismatch repair initiation.
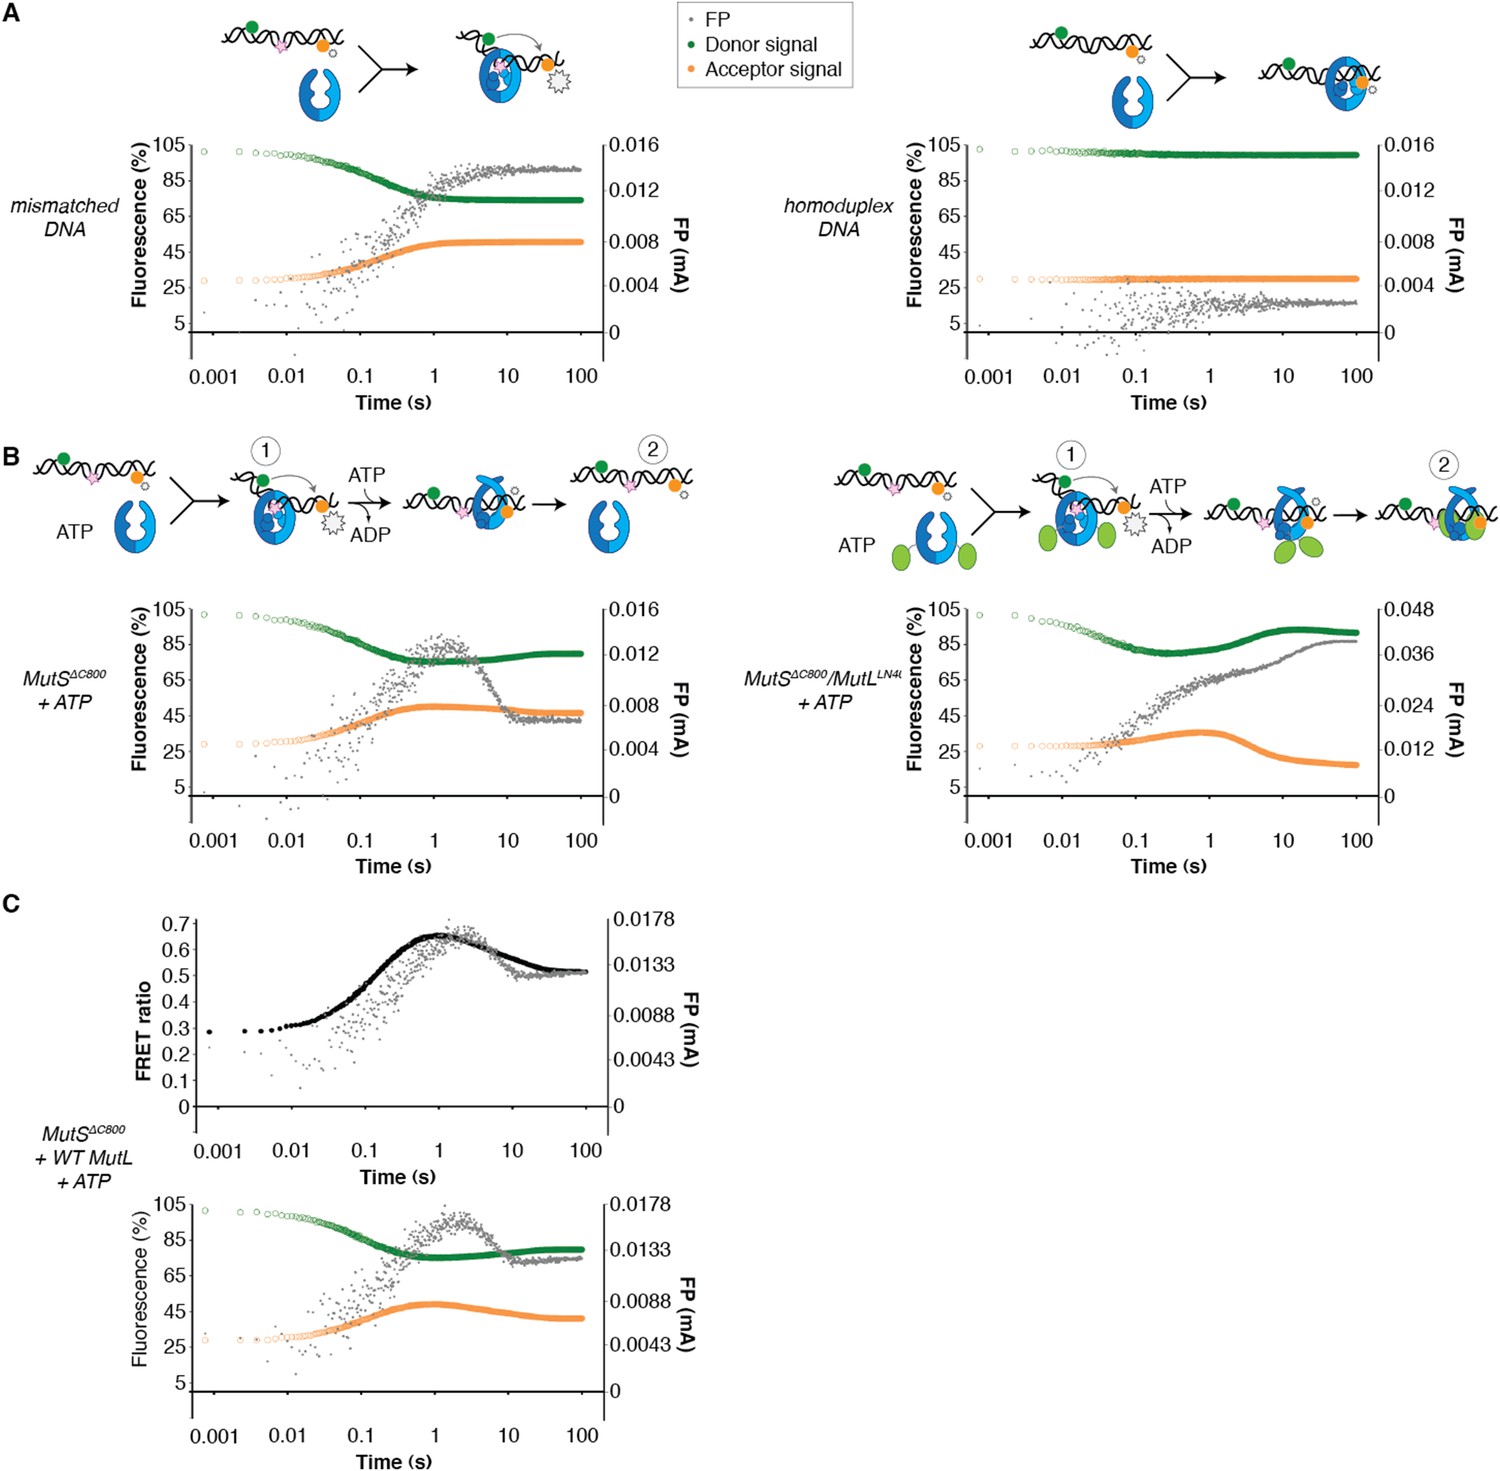
(A) Stopped-flow FRET and FP assay shows kinking of 45-bp DNA by MutSΔC800 binding only if there is a mismatch. Magnitude of FRET events are indicated by stars in the cartoon. (B) While MutSΔC800 initially kinks the DNA and subsequently releases in the presence of ATP, the MutSΔC800/MutLLN40 shows a secondary FP event without kinking the DNA. (C) Nicking assay of mismatch containing closed circular DNA (ccDNA) shows that WT or single-cysteine MutL can activate MutH, while mutations in the DNA-binding groove of MutL strongly impair the activation. (D) Spontaneous mutation rates after complementing MutL-deficient cells shows that the DNA-binding ability of MutL is essential for MMR in vivo. Error bars represent 95% confidence intervals. (E) Model for MMR initiation. After MutS undergoes an ATP-induced conformational change to allow binding of both subunits to one MutL molecule, MutL N-termini can interact and possibly dimerize, to be loaded onto DNA where MutL can activate downstream effectors.
Figure 5—figure supplement 1
DNA kinking by MutSΔC800 and MutSΔC800/MutLLN40.
(A) Stopped-flow FRET and FP assay shows kinking of 45-bp DNA by MutS binding only if there is a mismatch. Separate traces for the fluorophores are shown (orange: acceptor; green: donor fluorophore; grey: FP). Size of FRET events are indicated by stars. (B) While MutSΔC800 initially kinks the DNA and subsequently releases in the presence of ATP, the MutSΔC800/MutLLN40 complex remains bound to unkinked DNA. (C) Using WT MutL (400 nM) mixed with the MutSΔC800 in this assay results in more binding at equilibrium than MutSΔC800 alone, while there is less FRET than for MutSΔC800 alone. Under the graph with the FRET ratio (black: FRET; grey: FP), separate traces for the fluorophores are shown as in (A).
Videos
Video 1
Interpolation between two MutS conformations.
Interpolation between the mismatch-bound conformation of MutS and the conformation as observed in complex with MutLLN40 shows tilting of the MutS subunits across each other. The connector domain rotates outward, although the exact trajectory may be different than in this visualization. Mismatch-recognition domains are not shown since they are not visible in the MutSΔC800/MutLLN40 structure.
Video 2
Model for initiation of DNA mismatch repair.
After MutS (cyan/blue) has recognized a mismatch in DNA (in orange; mismatch shown as pink spheres), it will bind ATP which triggers a conformational change in which the subunits tilt across each other and the connector domains move outward. This pushes the DNA to a new channel, where MutS fits as a loose ring around the DNA duplex and can behave as a sliding clamp. The N-terminal domain of MutL (green) can specifically recognize this state by binding two interfaces simultaneously. This loads MutL onto the DNA, where the N-terminal domains could dimerize and downstream effectors can be activated.
Tables
Table 1
Data collection and refinement statistics
| Crystal form 1 27-bp DNA | Crystal form 2 27-bp DNA | Crystal form 3 100-bp DNA | |
|---|---|---|---|
| Data collection | |||
| Space group | C2 | C2 | P21 |
| Cell dimensions | |||
| a, b, c (Å) | 165.9, 188.5, 200.4 | 380.6, 126.5, 243.3 | 192.6, 109.4, 277.5 |
| α, β, γ (°) | 90.0, 94.8, 90.0 | 90.0, 91.4, 90.0 | 90.0, 90.0, 90.0 |
| Resolution (Å)* | 82.7–4.71 (4.96–4.71) | 49.94–6.6 (7.13–6.6) | 49.3–7.6 (8.5–7.6) |
| Rmerge | 19.4 (79.7) | 21.3 (80.1) | 16.8 (91.9) |
| I/σI | 2.5 (1.0) | 3.4 (1.1) | 4.3 (1.0) |
| Completeness (%) | 97.3 (98.0) | 96.8 (97.7) | 81.3 (82.5) |
| Redundancy | 2.4 (2.4) | 2.9 (3.0) | 2.3 (2.2) |
| Refinement | |||
| Resolution (Å) | 4.7 | 6.6 | 7.6 |
| No. reflections | 31,052 | 21,305 | 11,763 |
| Rwork/ Rfree | 31.8/35.0 | 25.6/28.7 | 26.2/30.5 |
| No. atoms | 21,906 | 45,054 | 45,054 |
| Protein | 21,813 | 44,868 | 44,868 |
| Ligand/ion | 93 | 186 | 186 |
| Water | 0 | 0 | 0 |
| B-factors | |||
| Protein | 212 | 255 | 221 |
| Ligand/ion | 220 | 212 | 171 |
| Water | n/a | n/a | n/a |
| R.m.s deviations | |||
| Bond lengths (Å) | 0.009 | 0.0103 | 0.0113 |
| r.m.s. Z (bonds) | 0.45 | 0.51 | 0.55 |
| Bond angles (°) | 1.32 | 1.35 | 1.31 |
| r.m.s. Z (angles) | 0.59 | 0.70 | 0.68 |
-
*
Highest resolution shell is shown in parenthesis.
Table 2
Mutation rates for MutS and MutL mutants as determined using in vivo complementation assays
| Protein | Mutations per 107 | (95% confidence interval) |
|---|---|---|
| MutS variant (MutL interface) | ||
| Empty vector | 0.601 | (0.446–0.772) |
| WT MutS | 0.0686 | (0.0408–0.101) |
| MutS P595A/I597A | 0.0545 | (0.0310–0.0826) |
| MutS M759D | 0.0819 | (0.0490–0.121) |
| MutS Y563A | 0.0488 | (0.0272–0.0749) |
| MutS P595A/I597A/M759D | 0.704 | (0.556–0.864) |
| MutS Y563A/P595A/I597A | 0.317 | (0.233–0.411) |
| MutS Y563A/P595A/I597A/M759D | 0.773 | (0.618–0.941) |
| MutL variant (MutS interface) | ||
| Empty vector | 5.43 | (4.00–7.00) |
| WT His-MutL | 0.121 | (0.0542–0.206) |
| His-MutL A138E | 2.76 | (2.12–3.46) |
| His-MutL H139A | 0.103 | (0.0439–0.179) |
| His-MutL A138E/H139A | 4.87 | (3.55–6.33) |
| His-MutL R55D/R57D | 6.41 | (4.99–7.95) |
| His-MutL R200D | 0.663 | (0.432–0.932) |
| His-MutL R55D/R57D/H139A | 5.33 | (3.93–6.89) |
| His-MutL R55D/R57D/A138E/H139A | 6.13 | (4.58–7.84) |
| His-MutL R55D/R57D/H139A/R200D | 5.22 | (3.84–6.76) |
| His-MutL R55D/R57D/A138E/H139A/R200D | 5.48 | (4.04–7.06) |
| MutL variant (DNA binding) | ||
| His-MutL R266E | 5.87 | (4.78–7.04) |
| His-MutL R162E/R266E/R316E | 5.39 | (4.37–6.49) |
-
Mutation rates and 95% confidence intervals were determined using the Fluctuation AnaLysis CalculatOR (http://www.mitochondria.org/protocols/FALCOR.html) using the MSS-MLE method. For MutS, at least 24 independent colonies were picked; for MutL at least 12 independent colonies were picked.
Download links
A two-part list of links to download the article, or parts of the article, in various formats.
Downloads (link to download the article as PDF)
Open citations (links to open the citations from this article in various online reference manager services)
Cite this article (links to download the citations from this article in formats compatible with various reference manager tools)
MutS/MutL crystal structure reveals that the MutS sliding clamp loads MutL onto DNA
eLife 4:e06744.
https://doi.org/10.7554/eLife.06744


