Transcription factor MITF and remodeller BRG1 define chromatin organisation at regulatory elements in melanoma cells
- Institut de Génétique et de Biologie Moléculaire et Cellulaire, France
- Icahn School of Medicine at Mount Sinai, United States
- University of Iowa College of Medicine, United States
- University of Leuven, Belgium
- Hospital for Sick Children, Canada
Figures
Figure 1

Purification of MITF-associated complexes.
(A) Western blot of 501Mel cell lines stably expressing Flag-HA-tagged-MITF (F-H-MITF). (B) The immunoprecipitated material from the soluble nuclear extract (SNE) was separated by SDS PAGE and stained with silver nitrate. F-H-MITF is indicated along with * that designates a contaminating protein seen in the control immunoprecipitations. Lane M corresponds to a molecular mass marker indicated in kDa. (C) Immunoblot detection of HERC2, BRG1, USP7, USP11, XRCC5, and XRCC6 in the MITF-associated complexes. (D) Summary of proteins and complexes interacting with MITF. Shown are the proteins found specifically in the immunopurifications of F-H-MITF classified according to their function and organisation into known complexes.
Figure 2
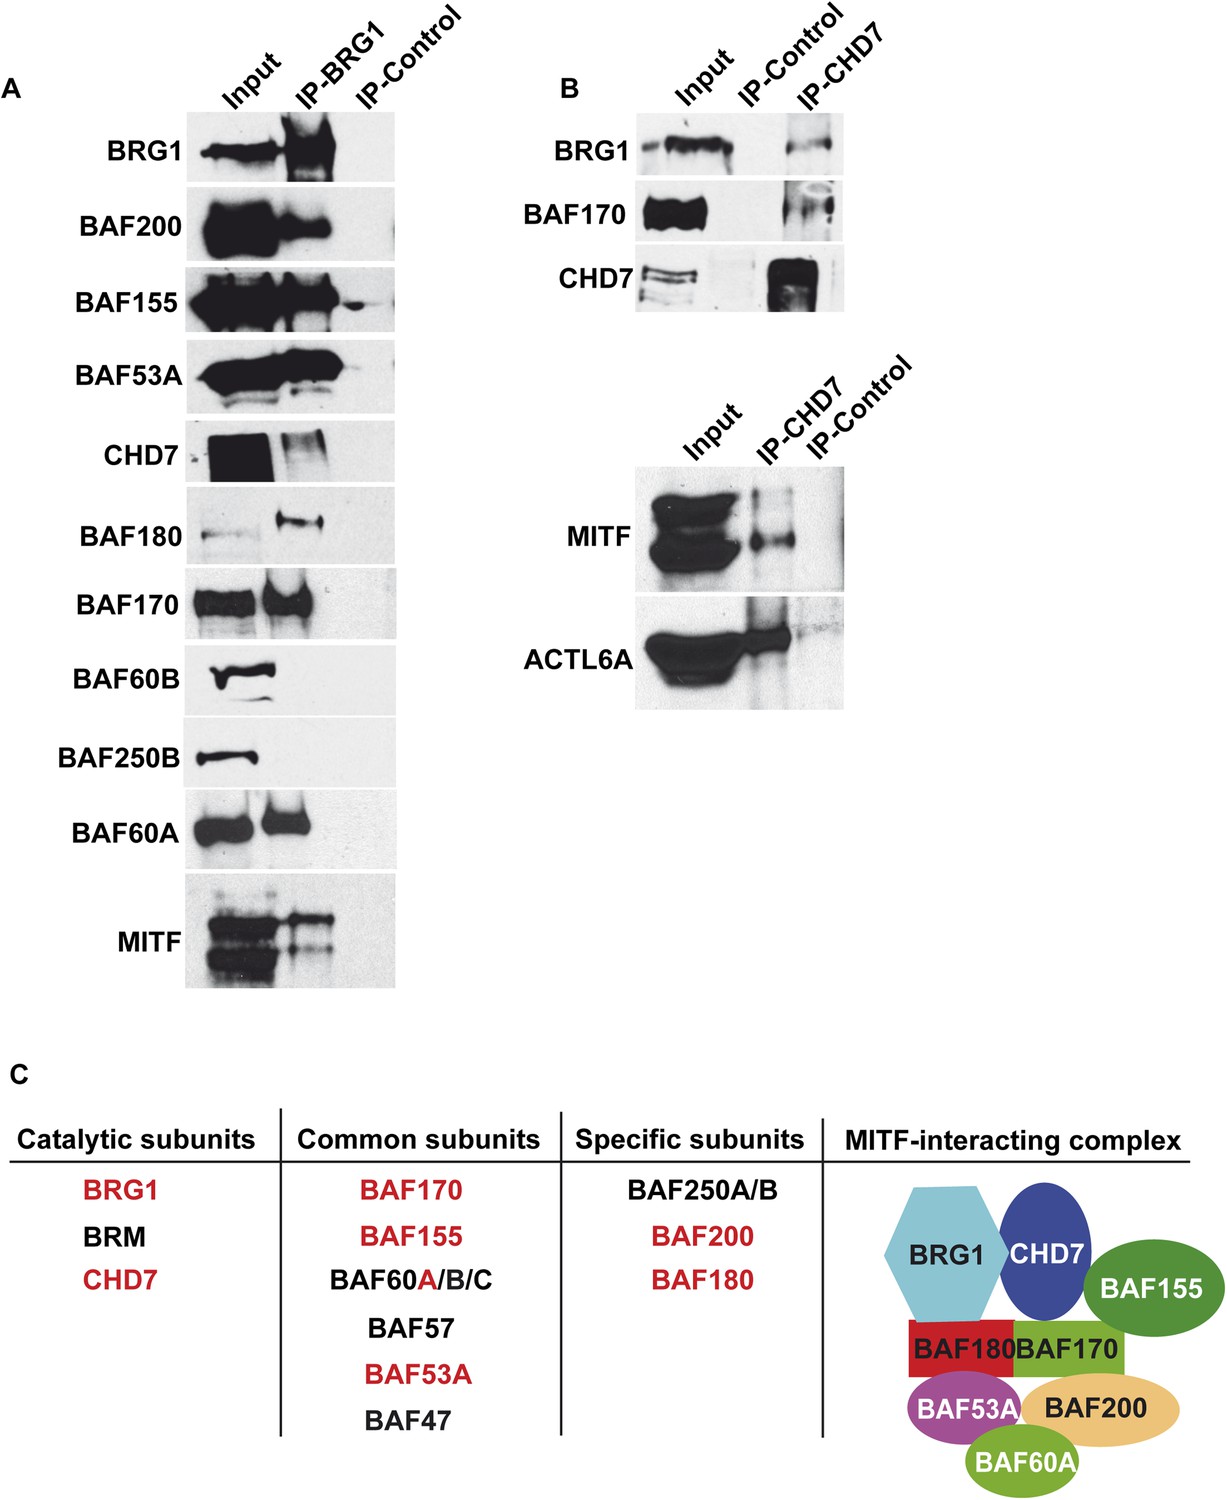
Composition of BRG1 complexes in 501Mel cells.
(A) BRG1 associates with CHD7 in 501Mel cells. Following immunoprecipitation of 501Mel cell extracts with anti-BRG1 antibody or HA beads as control the eluted fractions were probed with antibodies for the indicated proteins. (B) Following immunoprecipitation of 501Mel cell extracts with anti-CHD7 antibody or HA beads as control the eluted fractions were probed with antibodies for the indicated proteins. (C) Table summarising the known subunits of BRG1-containing complexes highlighting catalytic subunits with ATPase activity, common subunits and specific subunits. The composition of the complex interacting with MITF based on mass-spectrometry and immunoblots is schematised.
Figure 3 with 2 supplements
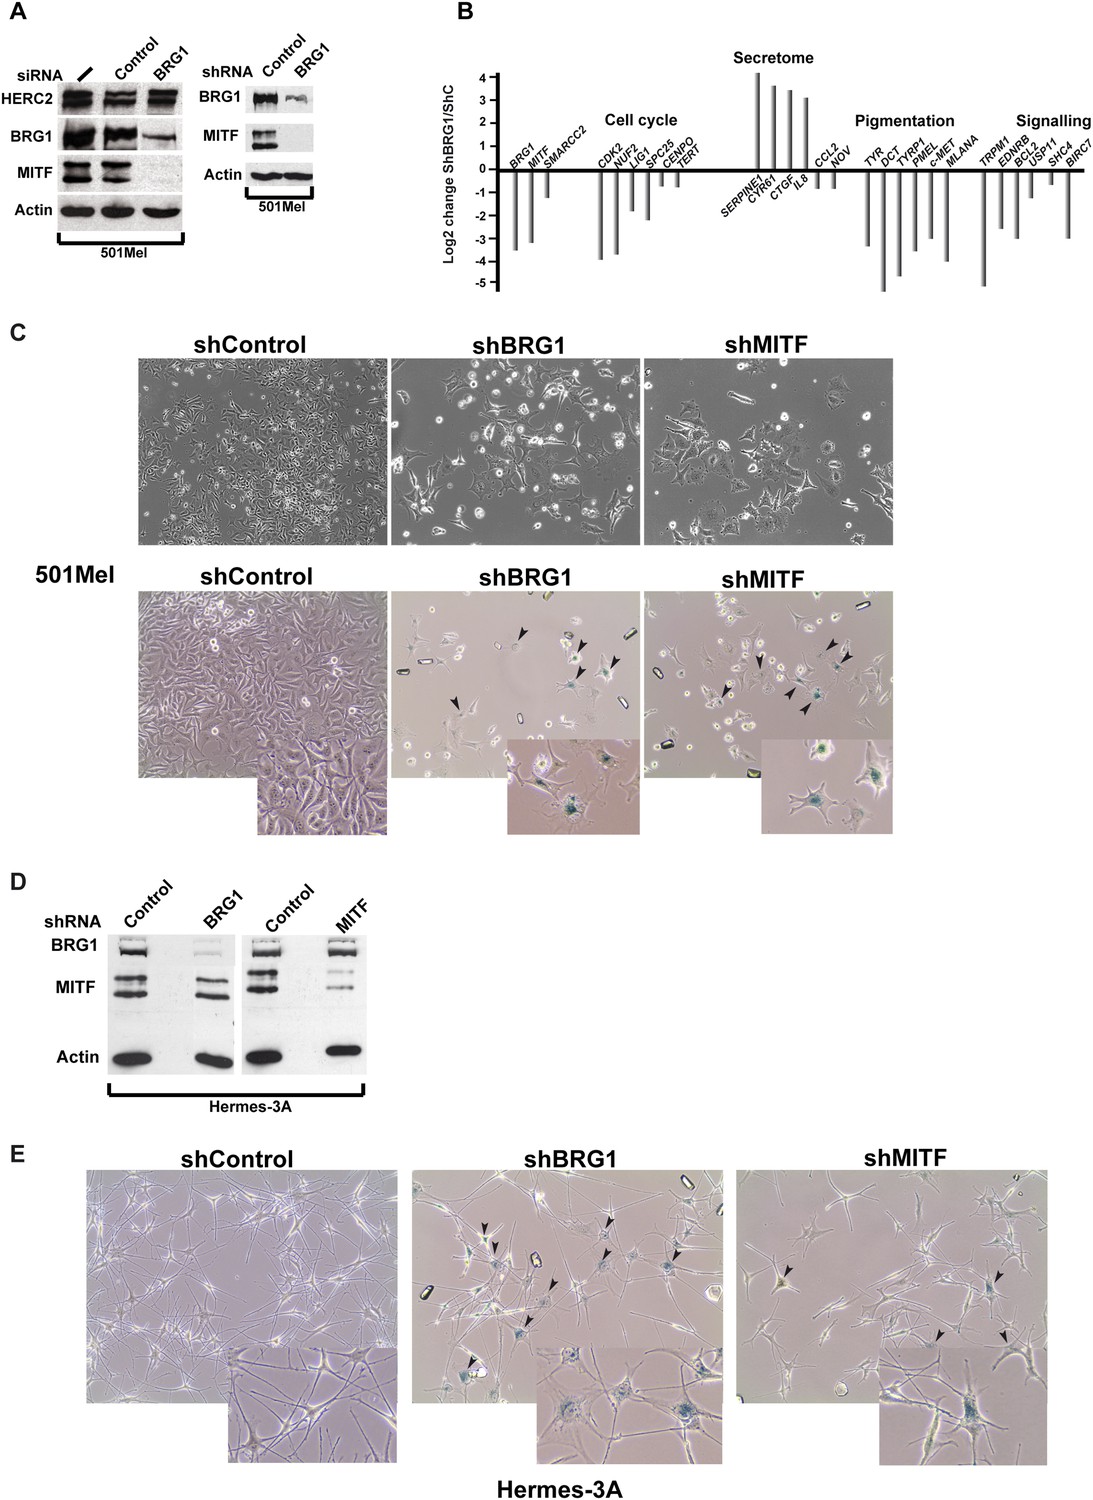
BRG1 is essential in melanoma cells and melanocytes.
(A) Immunoblots of 501Mel cells transfected with control or anti-BRG1 siRNA or cells infected with lentiviral vectors expressing control or anti-BRG1 shRNA. (B) Reverse transcription real time qPCR (RT-qPCR) performed on 501Mel cells infected with lentivirus vectors expressing control (C) or anti-BRG1 shRNA. The ratio of expression of the indicated genes is shown. (C) Phase contrast microscopy of 501Mel cells infected with the indicated shRNA vectors after 5 days of puromycin selection. Magnification X10. The lower panel shows cells stained for senescence-associated β-galactosidase. Arrowheads indicate representative stained cells. Inserts show enlargements of representative cells. (D) Immunoblots of Hermes 3A extracts following infection with lentiviral vectors expressing control, anti-BRG1, or anti-MITF shRNAs. (E) Phase contrast microscopy of Hermes 3A cells infected with the indicated shRNA vectors after 5 days of puromycin selection and stained for senescence-associated β-galactosidase. Arrowheads indicate representative stained cells. Inserts show enlargements of representative cells.
Figure 3—figure supplement 1
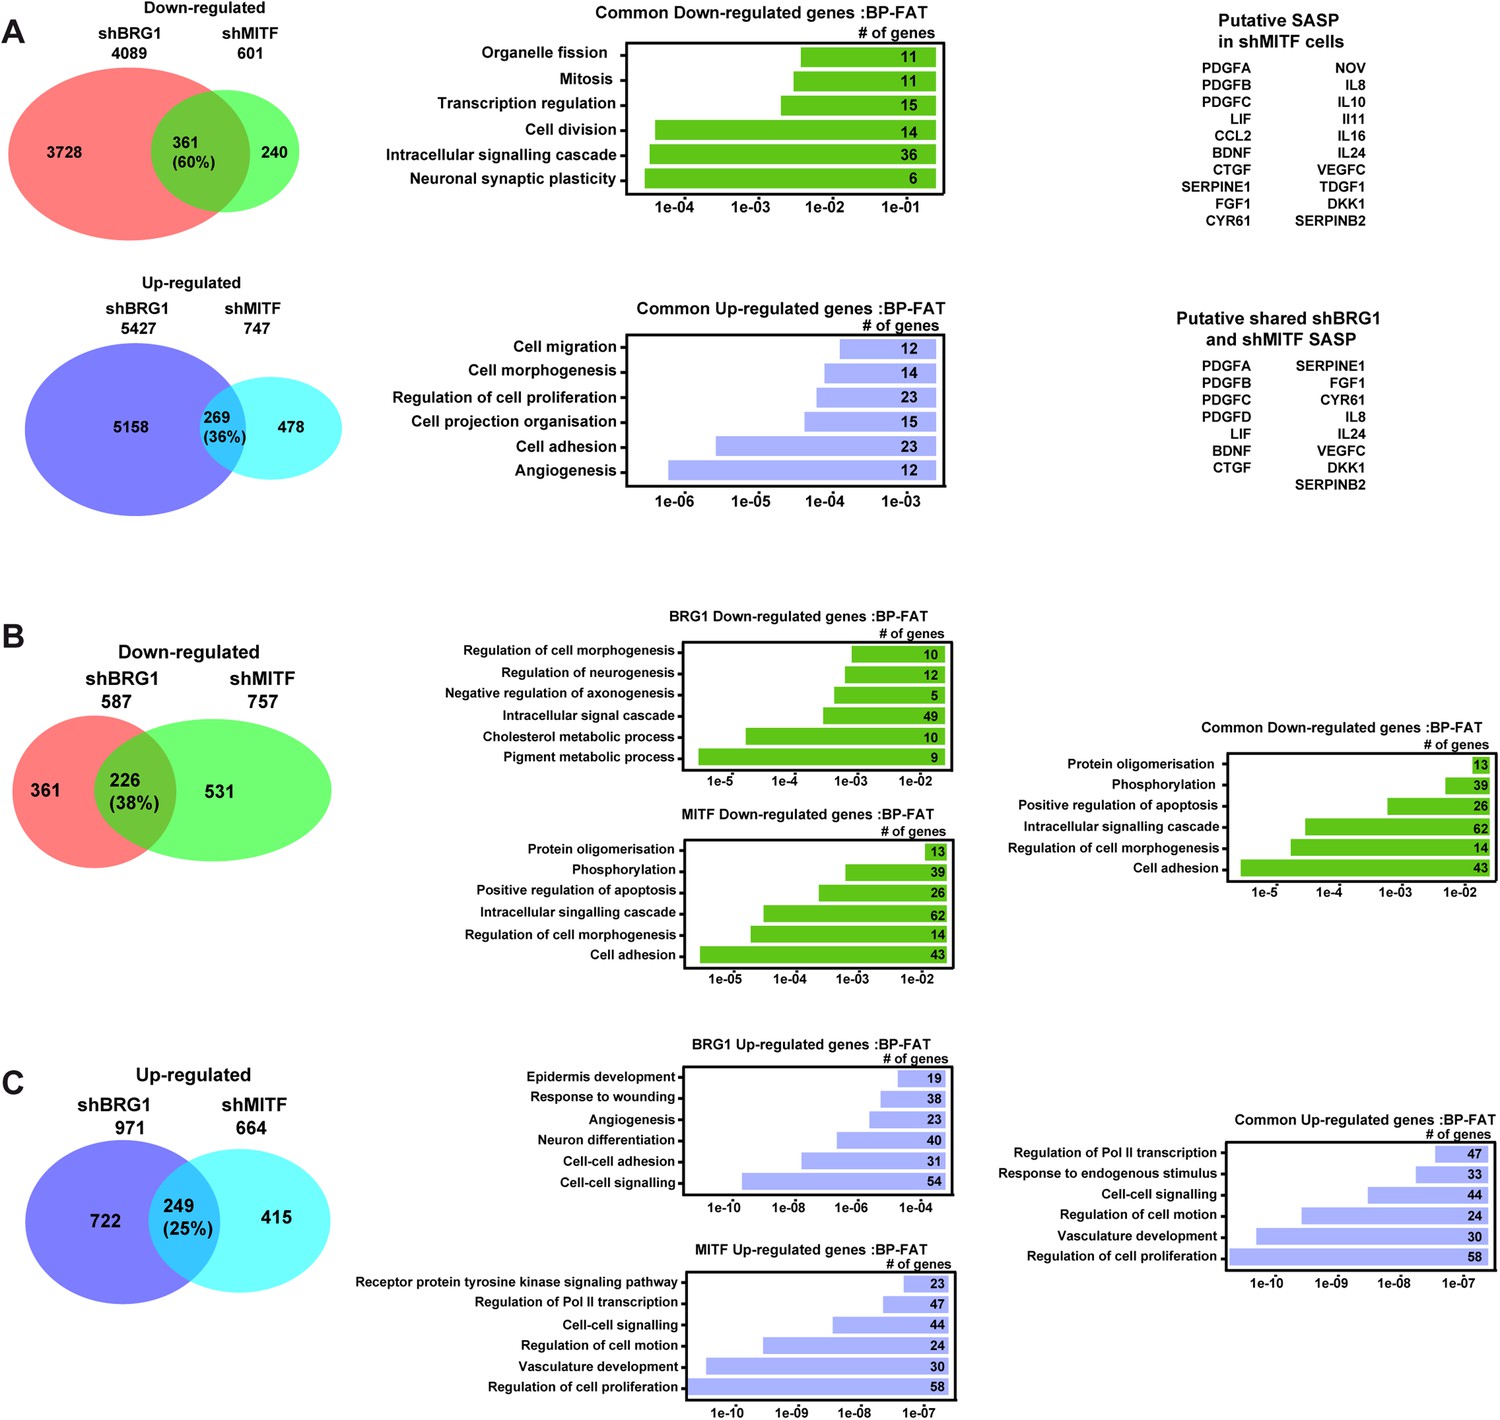
Gene expression changes in 501Mel and Hermes 3A cells.
(A) A Comparative analysis of RNA-seq data from shBRG1 and shMITF 501Mel cells. Venn diagrams indicate the overlap between genes that are up and down-regulated in the shBRG1 and shMITF cells. The results of ontology analysis of the commonly up- and down-regulated genes are shown graphically and classed by p value and the number of genes in each category is indicated. Lists of secreted growth factors and cytokines forming the SASP in the shBRG1 and shMITF cells are indicated. (B–C) Comparative analysis of RNA-seq data from shBRG1 and shMITF Hermes 3A cells. Venn diagrams indicate the overlap between genes that are up and down-regulated in the shBRG1 and shMITF cells. The results of ontology analysis of the specifically and commonly up- and down-regulated genes are shown graphically and classed by p value and the number of genes in each category is indicated.
Figure 3—figure supplement 2
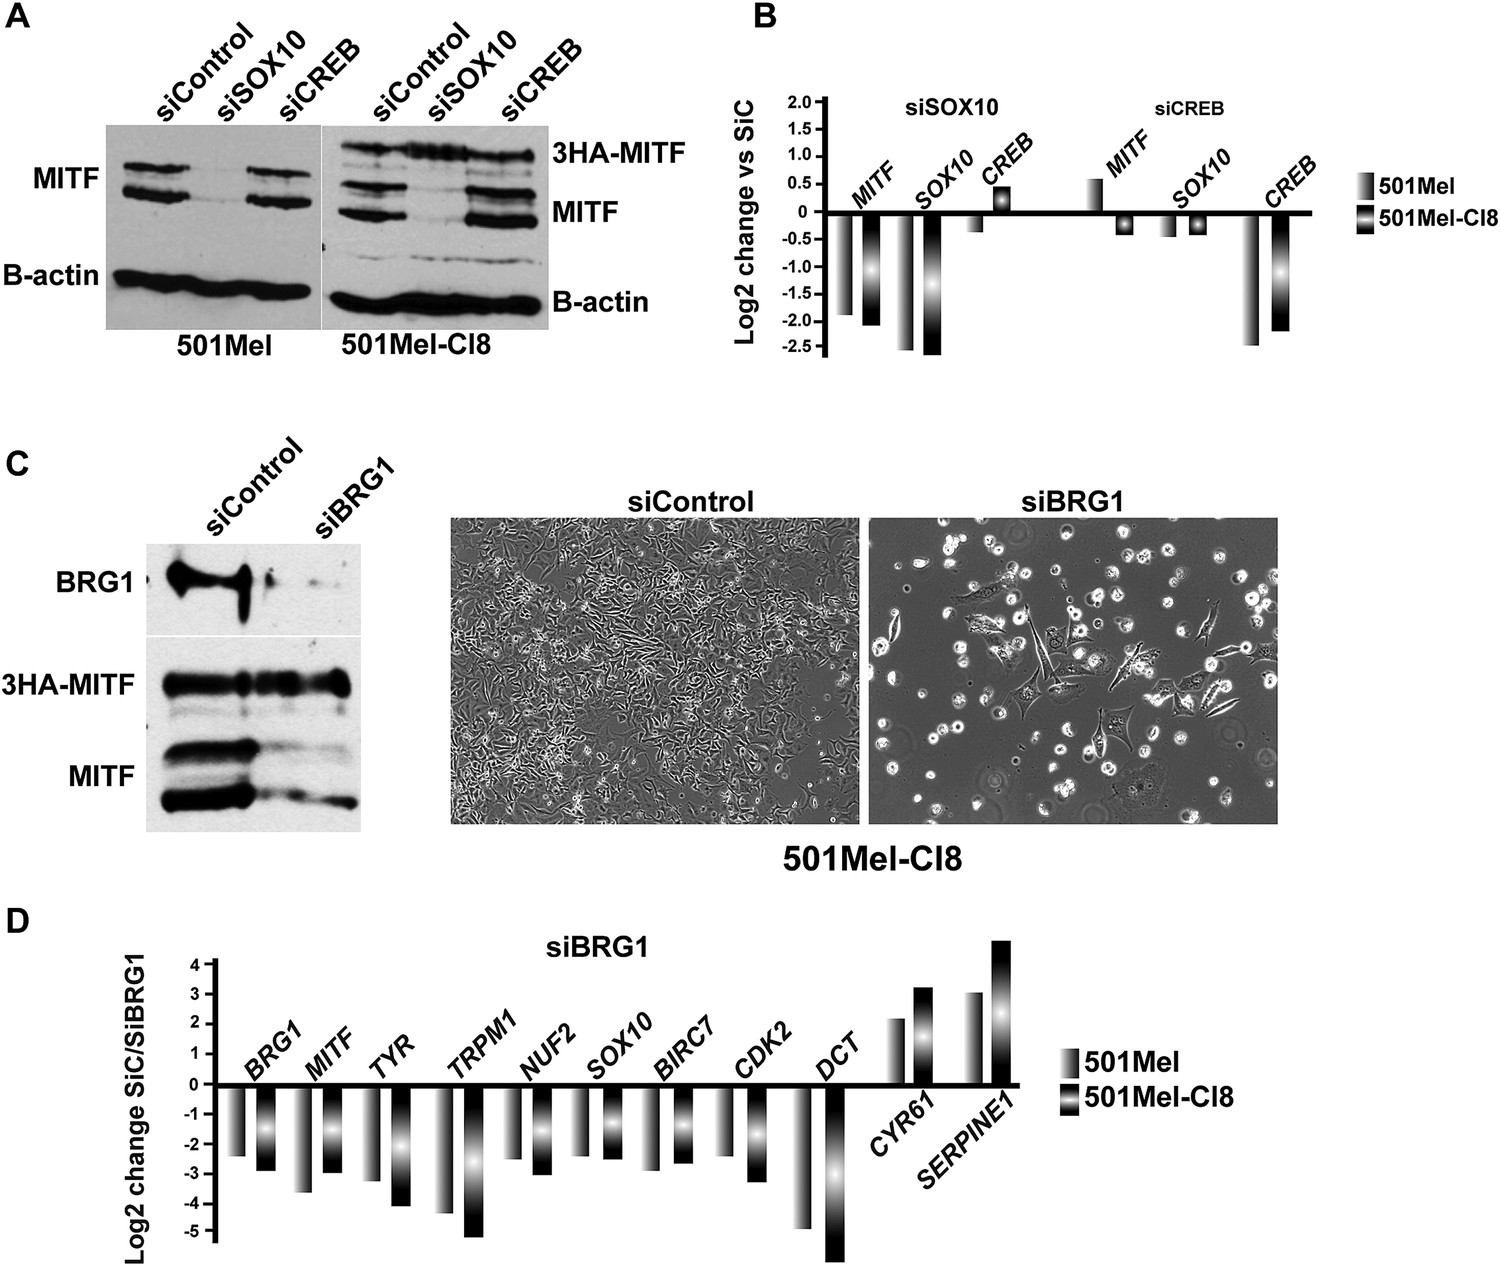
SOX10 regulates MITF expression in 501Mel cells.
(A) Western blot analysis of MITF expression in the indicated cell types after siRNA transfections. (B) RT-qPCR analysis of gene expression in the indicated cell types after siRNA transfections. (C) Western blot analysis of BRG1 and MITF expression in 501Mel CL8 cells following siRNA transfections. Phase contrast microscopy of 501Mel Cl8 cells following siRNA transfections. Magnification X10. (D) RT-qPCR analysis of gene expression in the indicated cell types after siRNA transfections.
Figure 4
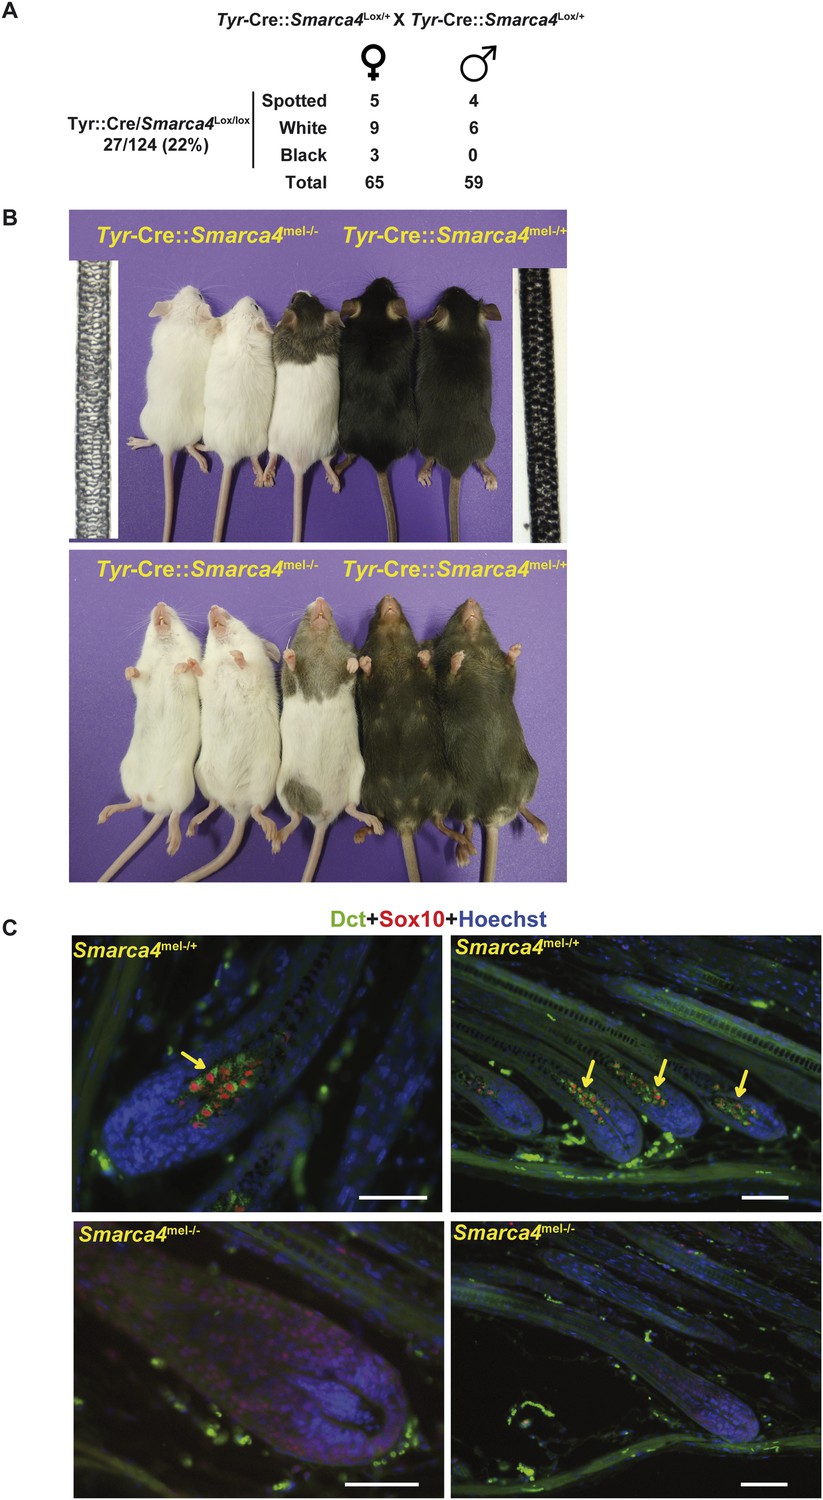
BRG1 is essential in mouse melanocytes in vivo.
(A) Statistics relevant to the phenotype of the mice lacking Brg1 in the melanocyte lineage. Note that as the Tyr-Cre transgene is present on the X chromosome, we detect black mice with the Tyr-Cre::Smarca4lox/lox genotype, but in these animals the Cre-recombinase is subjected to X-inactivation such that recombination does not occur in all melanoblasts. (B) Photographs of representative mice of the indicated genotypes. Bright field images of hair from the backs of 8-week-old animals of the two genotypes are also shown. Magnification X40. (C) Labelling of dorsal hair follicle bulbs with antibodies against Sox10 in red and Dct in green along with Hoechst-stained nuclei in blue. Arrows indicate labelled melanocytes in the bulb of Brg1 expressing mice. Scale bars are 50 μm.
Figure 5 with 1 supplement
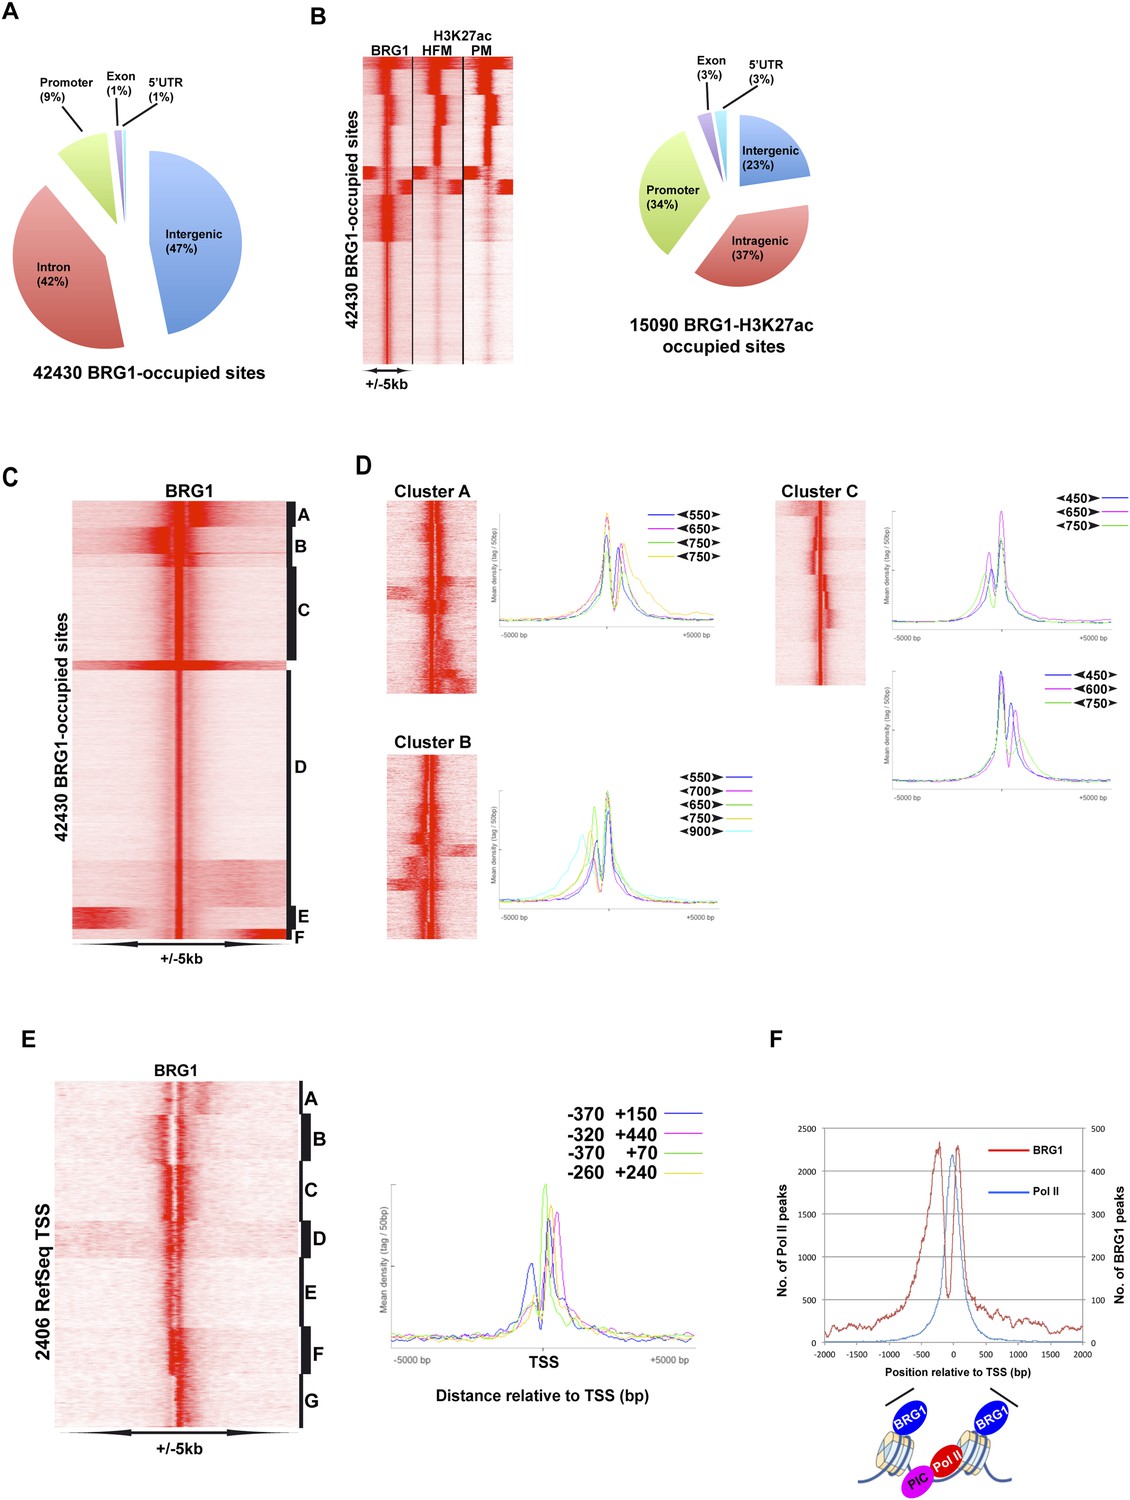
Genome-wide BRG1 occupancy.
(A) Pie chart showing distribution of BRG1-bound sites with respect to genomic features. (B) Clustering of BRG1 occupied sites with primary melanocyte and proliferative melanoma H3K27ac-marked elements and their distribution with respect to genomic features. (C) Read density clustering of BRG1 at its occupied sites reveals several profiles of BRG1 occupancy. (D) Clusters A–C from panel C were re-clustered and representative meta-profiles are shown to illustrate the distances separating the BRG1 peaks with the large and small arrowheads indicating the stronger and weaker peaks, respectively. (E) Re-analysis of RefSeq TSS where BRG1 is present reveals different localizations of BRG1-bound nucleosomes. Several representative meta-profiles of different subclasses are shown. The peak coordinates in each class relative to the TSS are indicated. (F) The overall meta-profile of BRG1 TSS occupancy is superimposed on the RNA Pol II meta-profile. The binding profiles of BRG1 and Pol II around the TSS are schematised below the graph.
Figure 5—figure supplement 1
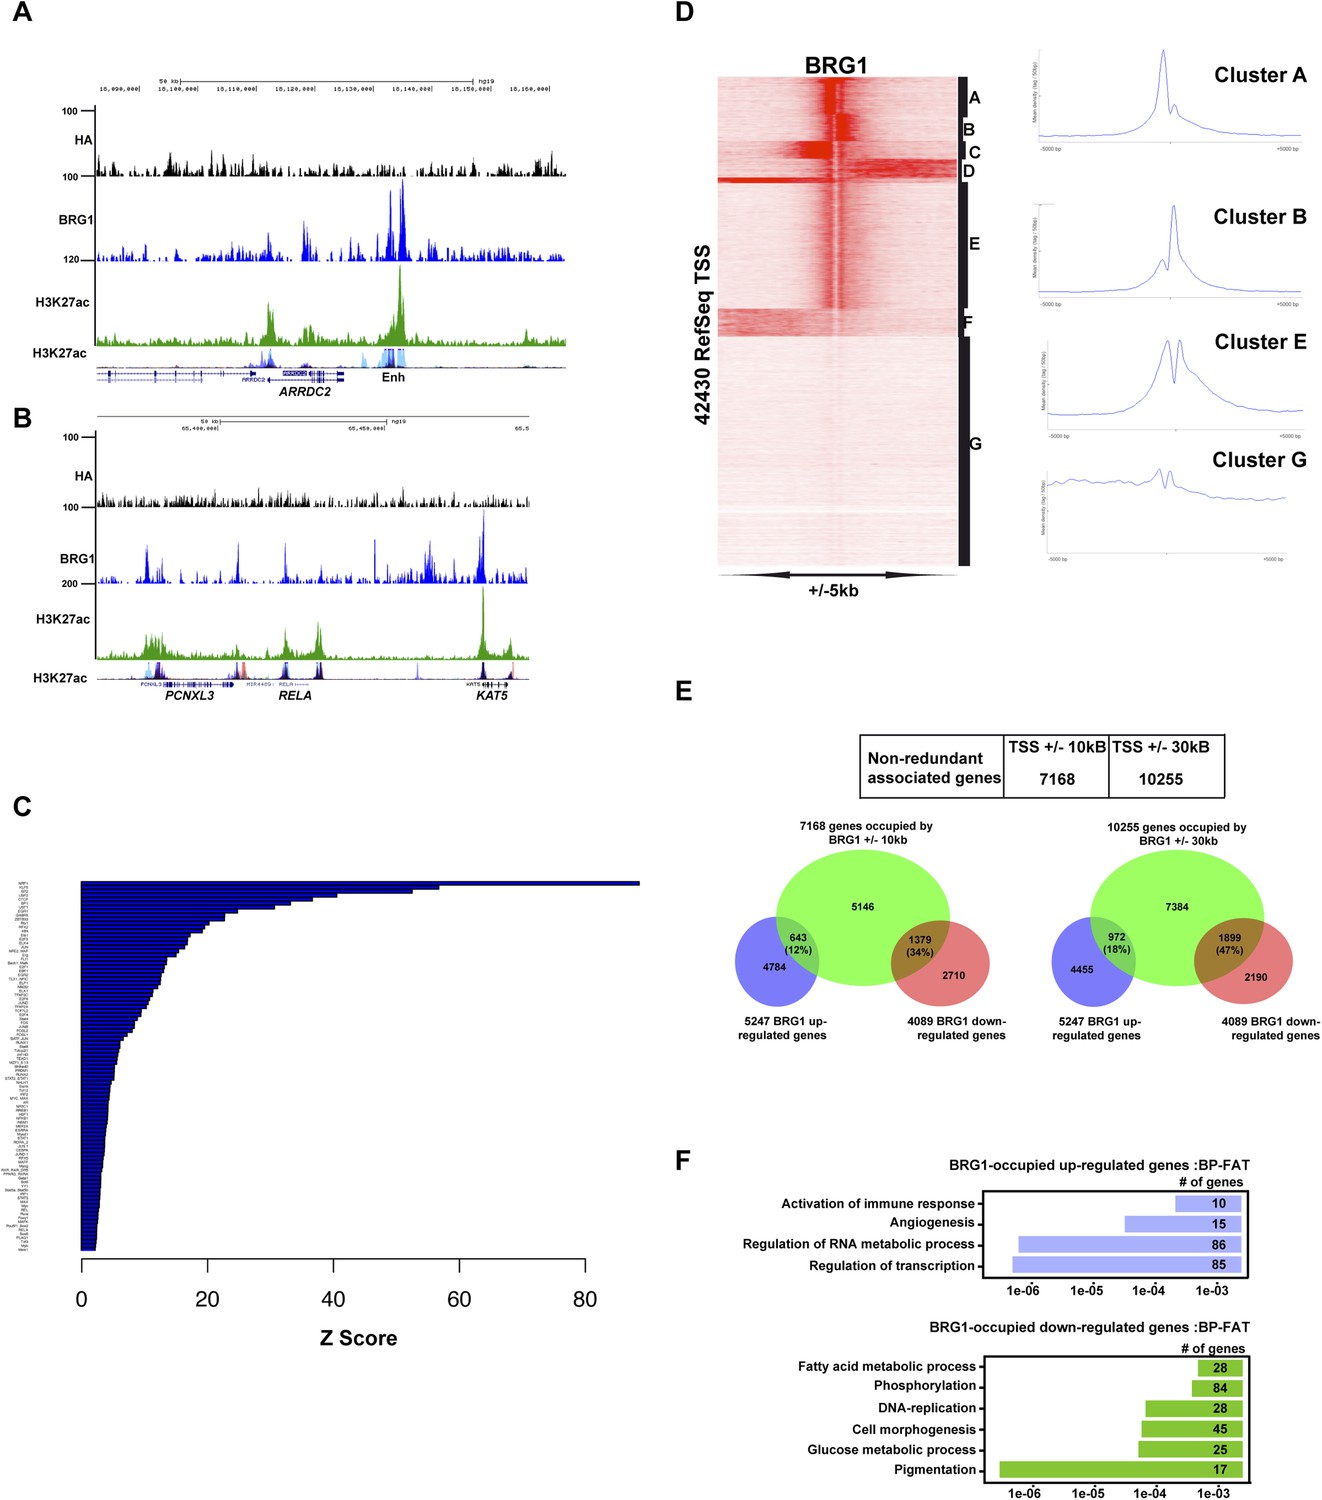
Profiling of BRG1 genome occupancy.
(A–B) UCSC screenshots illustrating BRG1 occupancy over the ARRDC2 and REL1 loci highlighting co-localization with H3K27ac-marked enhancers either in the Encode data track or in Human Foreskin Melanocytes (HFM). (C) Enrichment of TF binding motifs at BRG1-occupied sites. (D) Clustering analysis of BRG1 occupancy at RefSeq TSS illustrating the presence of BRG1 at a subset of TSS with different binding profiles. Cluster E showing BRG1 occupancy both upstream and downstream of the TSS was re-clustered to highlight the different profiles as shown in Figure 4E. (E) Integrative analysis of BRG1 ChIP-seq data with shBRG1 RNA-seq data. A table shows the number of genes with BRG1-occupied sites ±10 kb or ± 30 kb from the TSS. Venn diagrams indicate the number of these genes that are up- or down-regulated following shBRG1 knockdown. (F) Ontology analysis of the BRG1-associated up- and down-regulated genes.
Figure 6 with 2 supplements
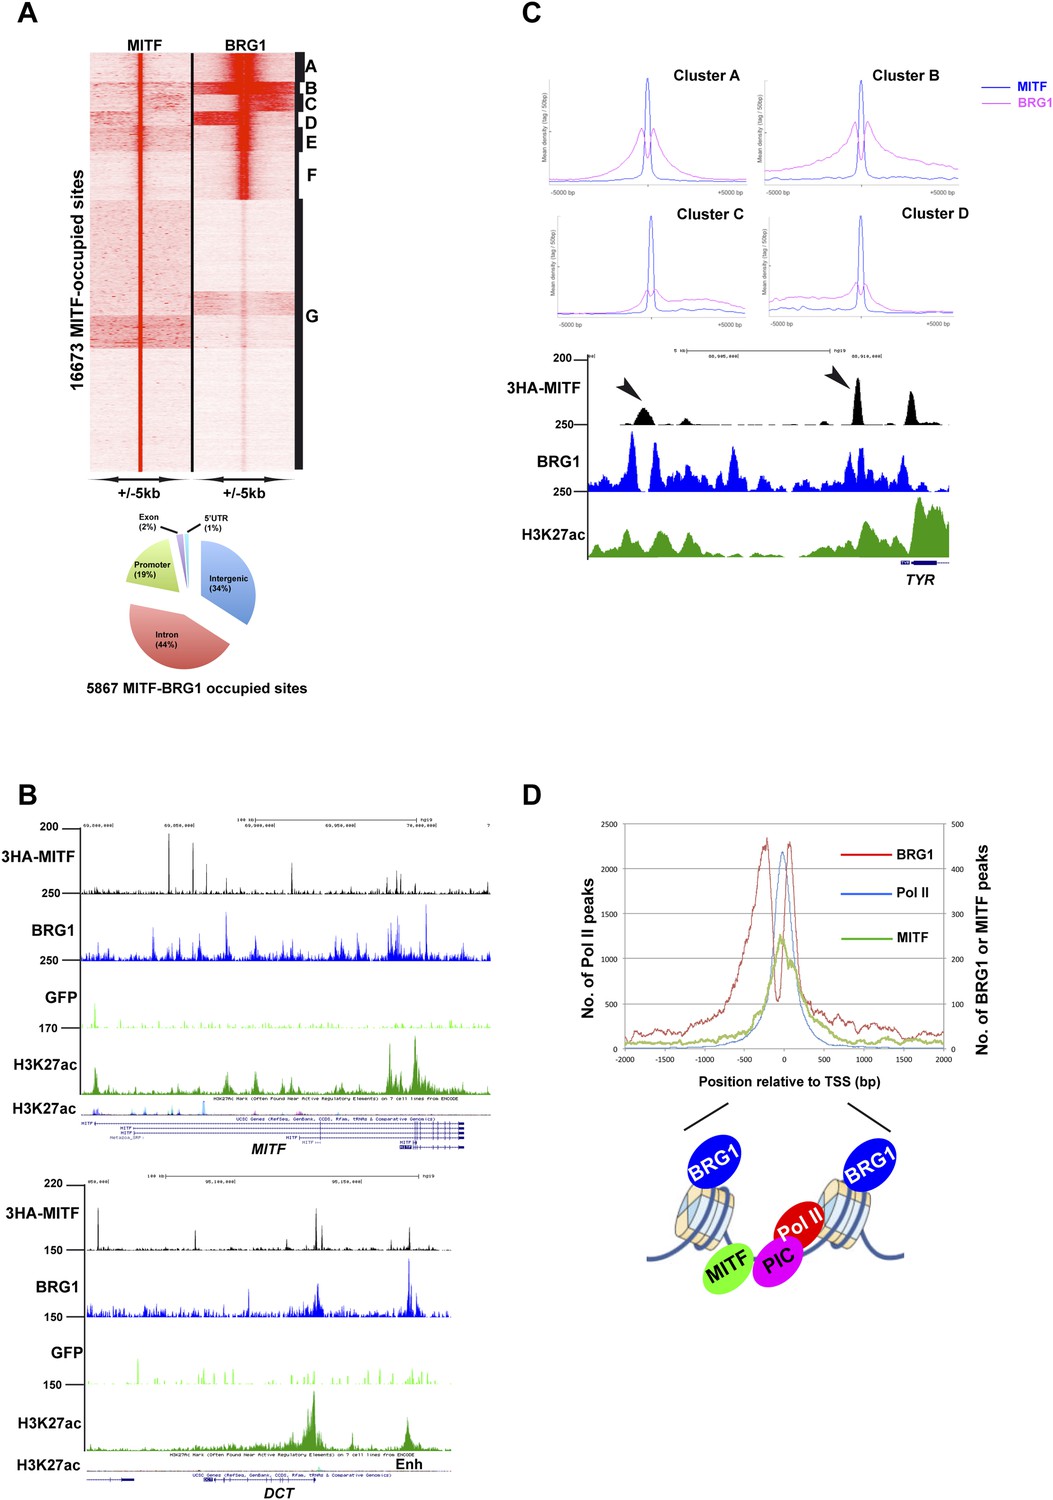
Sites co-occupied by BRG1 and MITF.
(A) Read density clustering of BRG1 and MITF at MITF-occupied loci reveals co-occupied sites with different profiles and their distribution with respect to genomic features. (B) UCSC screenshots showing MITF and BRG1 occupancy over the MITF and DCT loci highlighting their co-localization along with that of melanocyte-specific H3K27ac-marked enhancers. A GFP ChIP was performed as a negative control. (C) Meta-profiles of BRG1 occupancy in clusters A–D of panel A. The lower panel shows a UCSC screenshot of MITF and BRG1 occupancy over the TYR locus highlighting the binding of MITF between two BRG1-occupied nucleosomes. (D) Meta-profile showing occupancy by BRG1, MITF, and Pol II at the TSS. The binding profiles of each factor BRG1 and Pol II around the TSS are schematised below the graph.
Figure 6—figure supplement 1
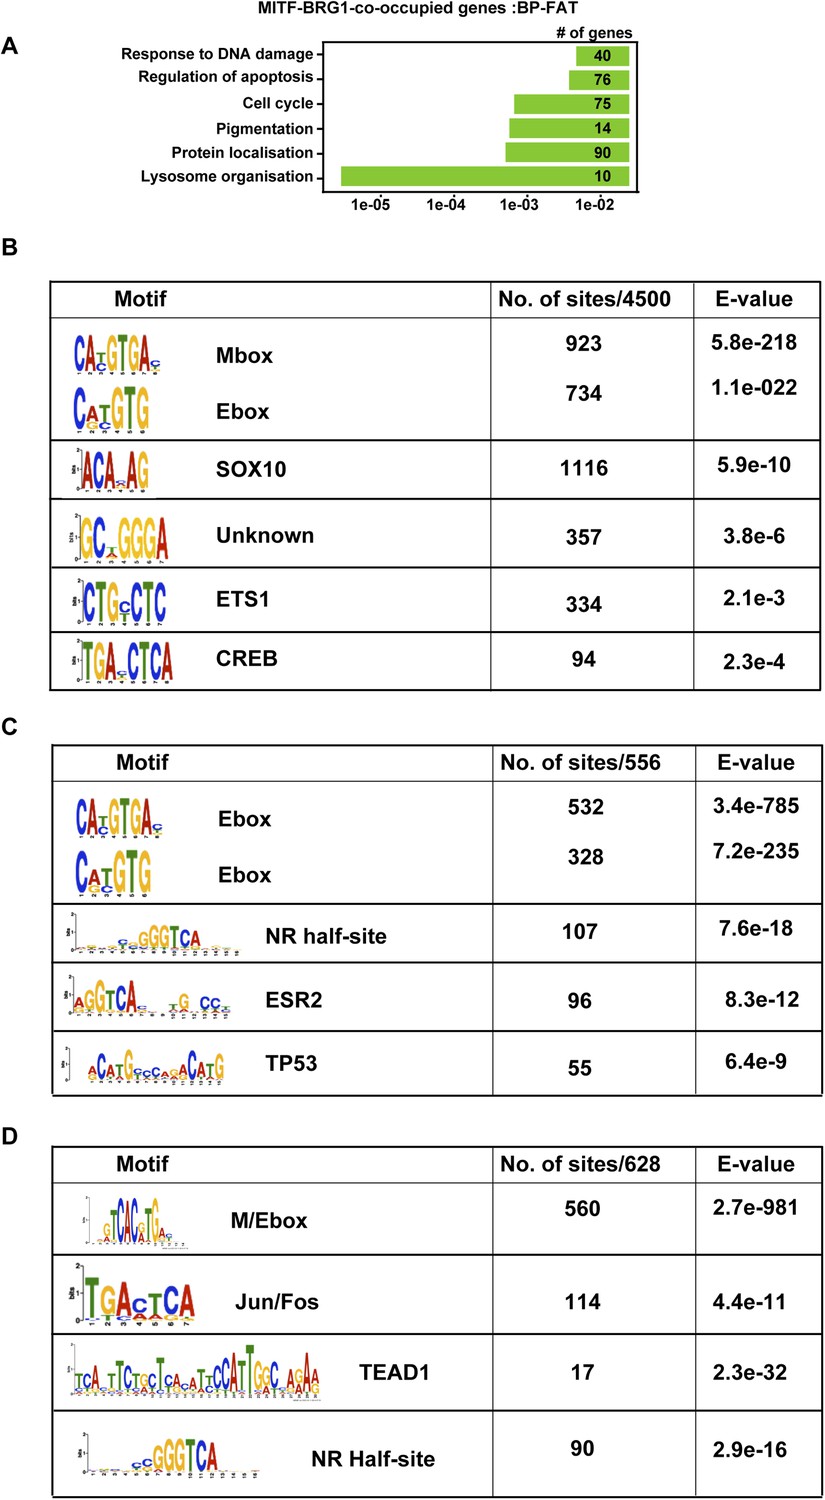
TF binding motifs at MITF and BRG1-bound sites.
(A) Ontology analysis of genes associated with BRG1-MITF-co-occupied sites. (B) Identification of transcription factor binding motifs at BRG1-MITF-occupied sites. MEME-ChIP identified several motifs enriched at these sites. The most prominent are the E-box and M-box corresponding to MITF binding, SOX10, CREB, and ETS1 as well as motifs with no known annotation. (C) Identification of transcription factor binding motifs at BRG1-occupied sites that are strongly enriched in siMITF senescent cells. (C–D) Identification of transcription factor binding motifs at MITF-occupied sites that are associated with down and up-regulated genes after MITF silencing.
Figure 6—figure supplement 2
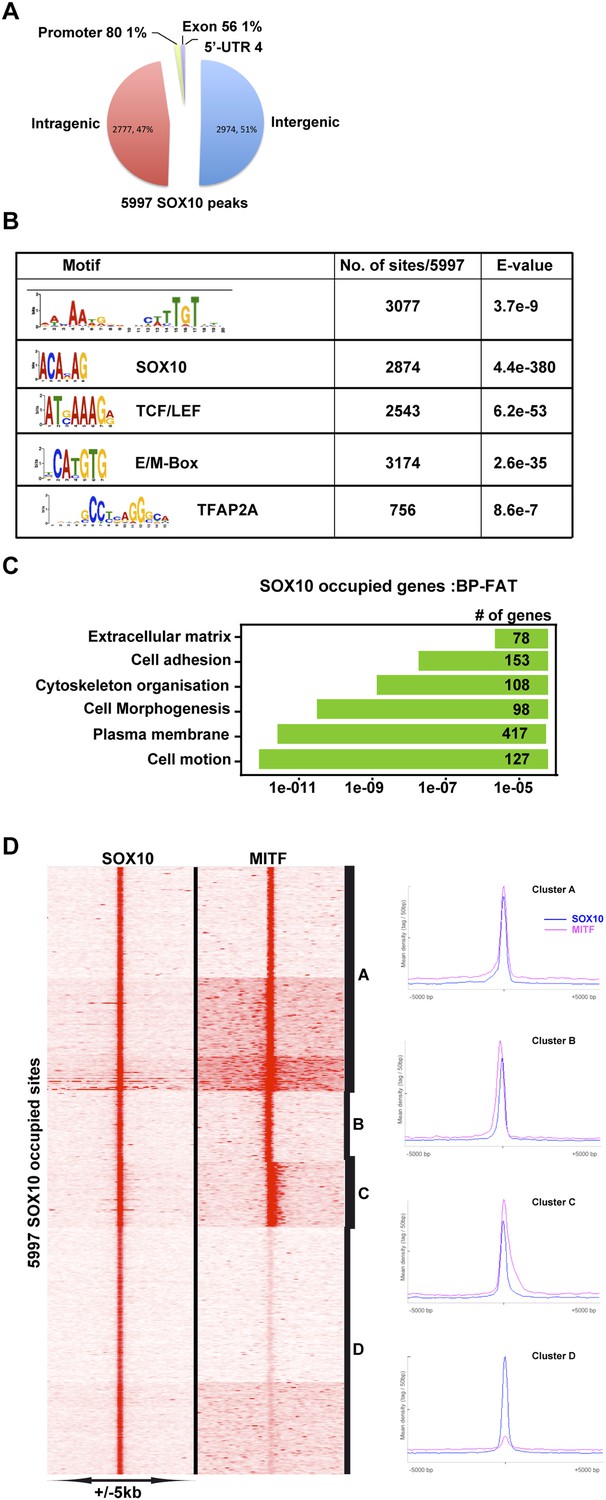
MITF co-localizes with SOX10.
(A) Pie chart illustrating distribution of SOX10-occupied sites with respect to genomic features. (B) DNA sequence motifs at SOX10 occupied sites. (C) Ontology analysis of genes with associated SOX10 binding sites. (D) Clustering at SOX10 occupied sites illustrates co-localization with MITF.
Figure 7 with 1 supplement

MITF, SOX10, and YY1 co-localize with BRG1.
(A) Read density clustering illustrating regions of co-localization of the indicated factors and melanocyte H3K27ac. The meta-profiles for the indicated clusters are shown to the right illustrating the binding of MITF and SOX10 between the two BRG1-bound and H3K27ac-marked nucleosomes. The binding profiles are schematised on the right of the figure. (B) Co-localization of MITF and SOX10 on YY1-occupied sites. (C) Similar to panel A, read density clustering illustrates MAREs with co-localization of H3K27ac, BRG1, MITF, and SOX10 at YY1-bound regions. A meta-profile is shown to the right along with a schematic representation of these sites.
Figure 7—figure supplement 1
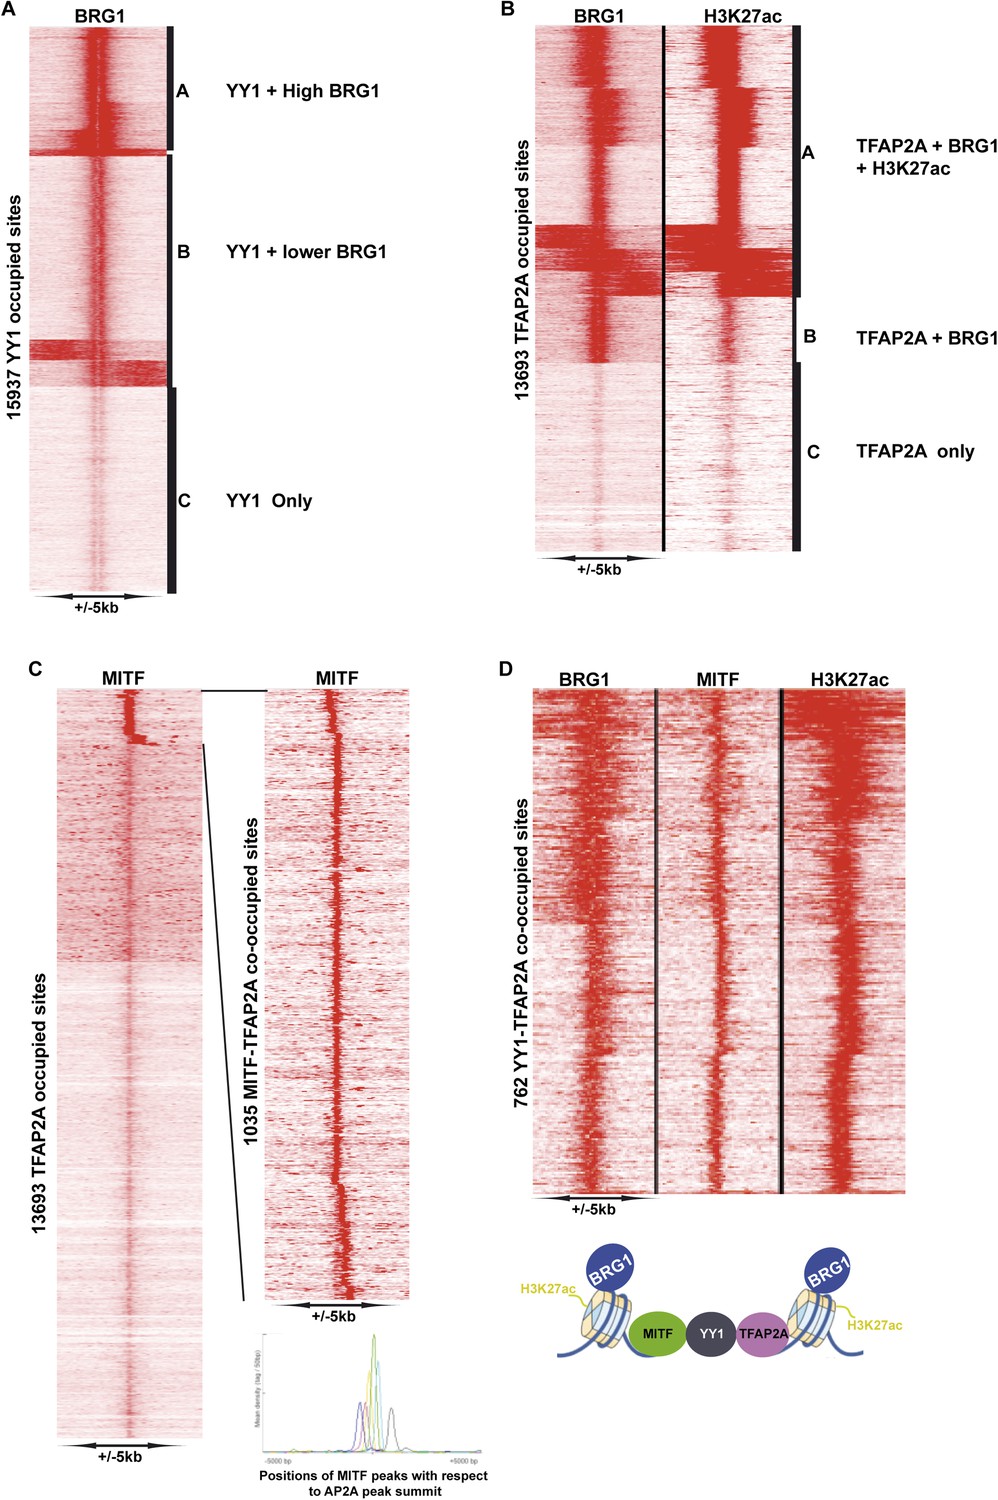
Identification of YY1-TFAP2A associated MAREs.
(A) Clustering at YY1 occupied sites illustrates co-localization with BRG1. (B) Clustering at TFAP2A occupied sites illustrates co-localization with BRG1 and H3K27ac. (C) Identifcation of TFAP2A sites co-occupied by MITF. The re-clustering shown to the right illustrates that MITF may be localized at various distances up- or down-stream of TFAP2A. (D) Clustering identifies MAREs where MITF co-localizes with YY1, TFAP2A, BRG1, and H3K27ac.
Figure 8 with 1 supplement
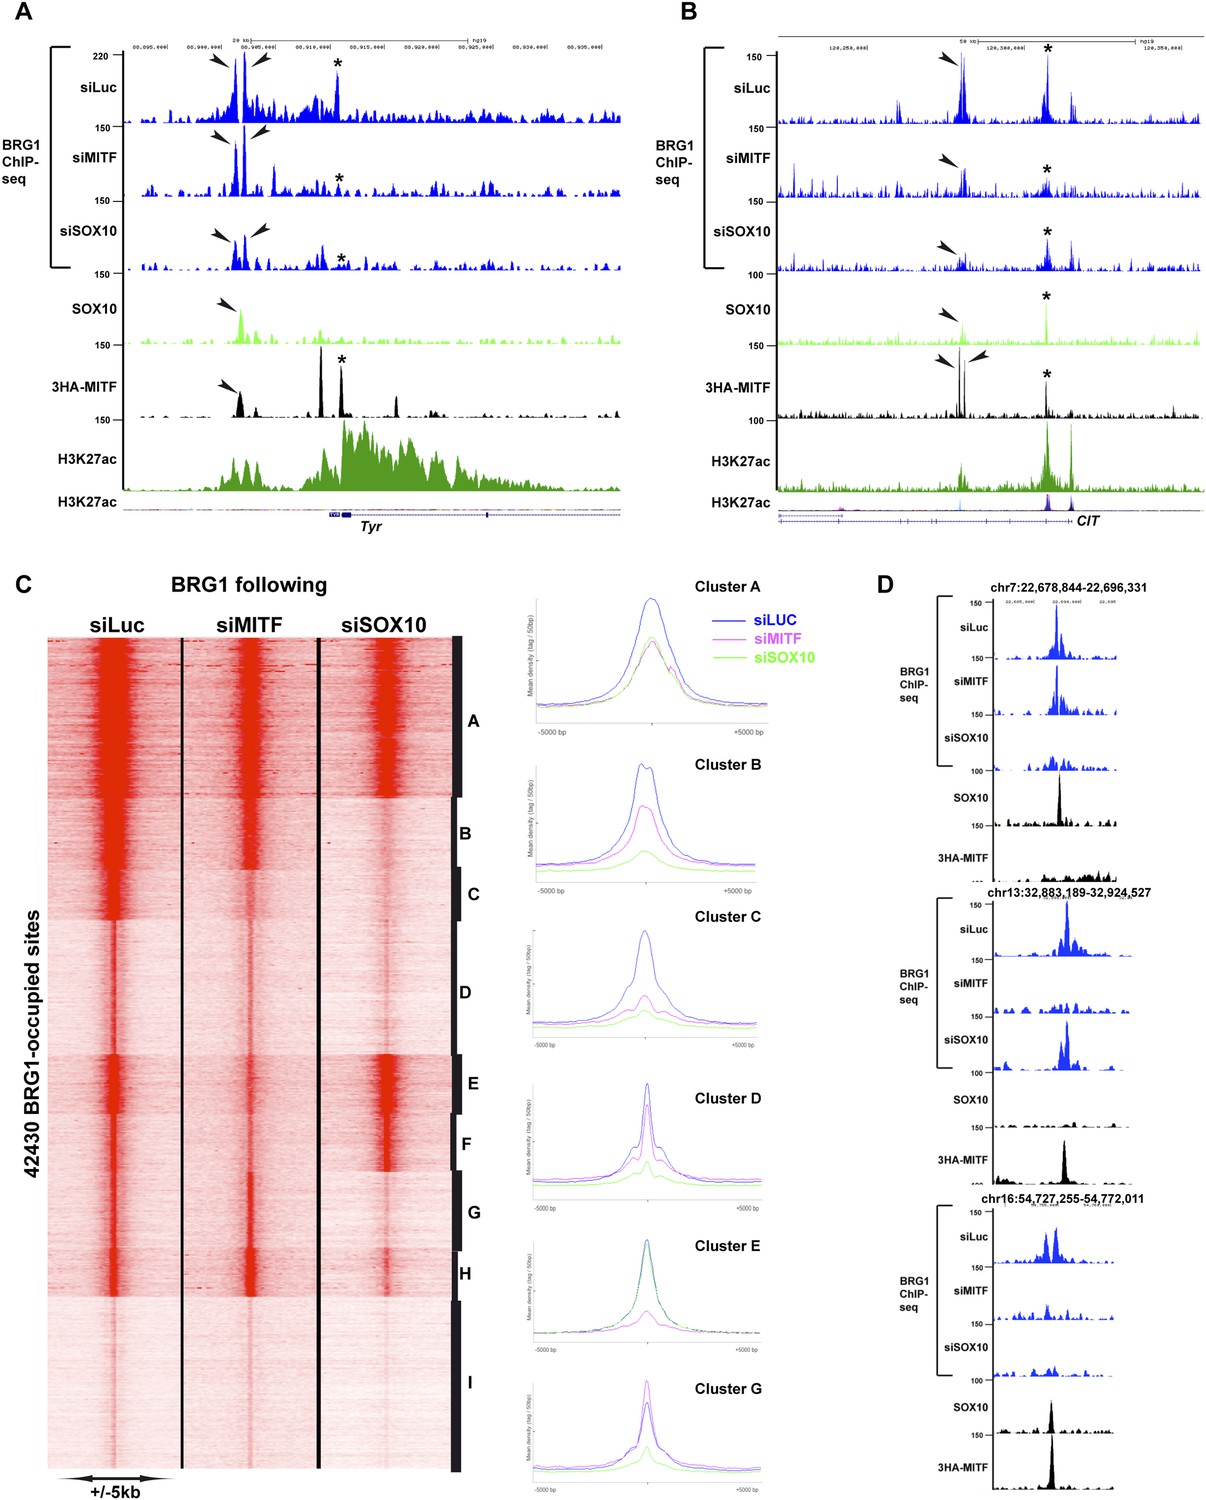
MITF and SOX10 actively recruit BRG1.
(A) UCSC screenshots illustrating occupancy over the TYR locus and highlighting the selective recruitment of BRG1 by MITF and/or SOX10. * illustrates a region where BRG1 occupancy is diminished upon siMITF silencing, while the arrow indicates a region where BRG1 is lost upon siSOX10 silencing. (B) * illustrates a region where BRG1 occupancy is diminished upon siMITF silencing, while the arrow indicates a region where BRG1 is diminished upon both siMITF and siSOX10 silencing. (C) Read density clustering illustrating set of sites whose BRG1 occupancy is diminished following siMITF or siSOX10 silencing compared to siLuc. The meta-profiles of several representative clusters are shown to the right of the figure. (D) UCSC screenshots showing examples of BRG1 recruitment by SOX10 or MITF.
Figure 8—figure supplement 1
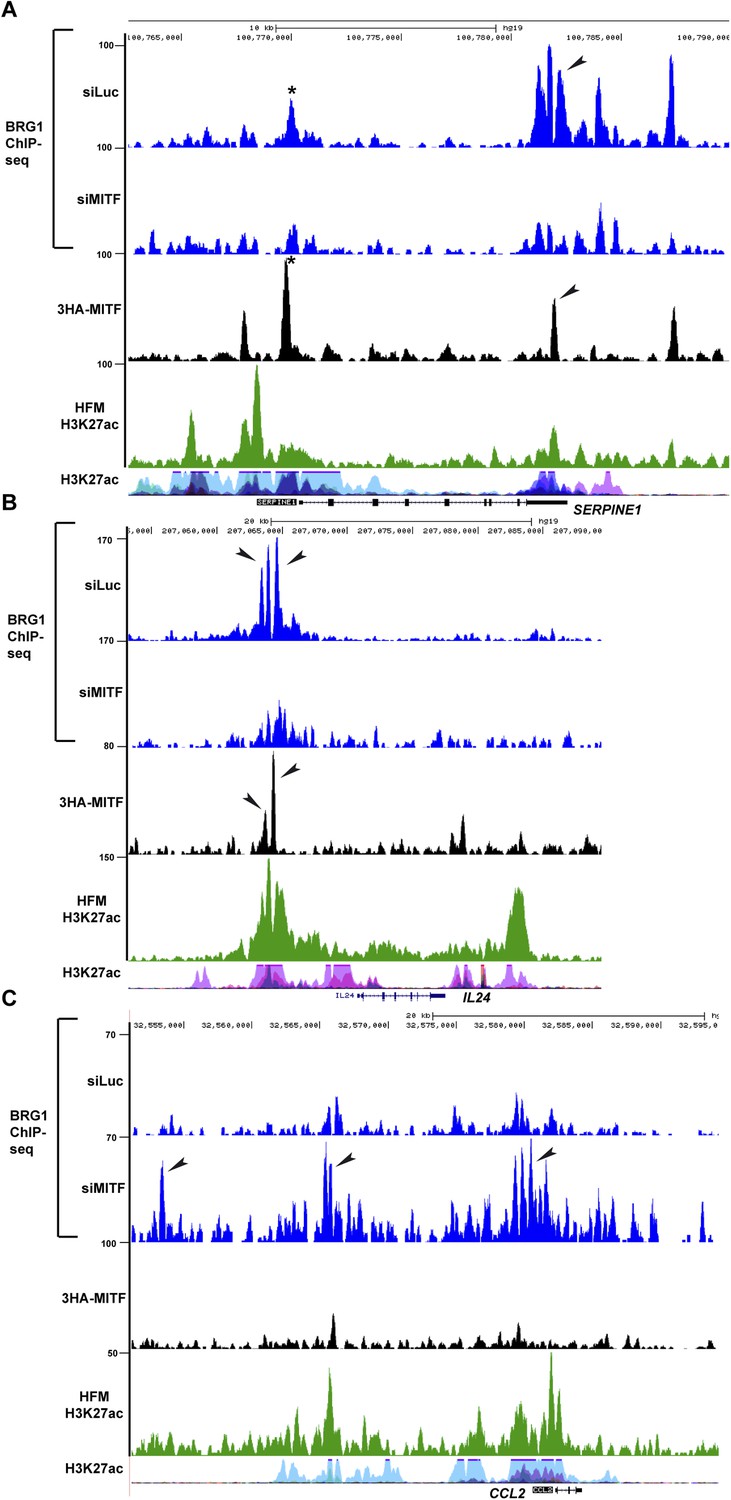
BRG1 and MITF repress gene expression.
(A–B) UCSC screenshots illustrating that MITF recruits BRG1 to regulatory elements of the SERPINE1 and IL24 loci. BRG1 is diminished at these genes in siMITF-silenced cells where these genes are activated. (C) BRG1 re-localizes over the genome in siMITF senescent cells. UCSC screenshot illustrating that BRG1 occupancy is strongly increased over the CCL2 locus in siMITF-silenced cells where this gene is strongly activated.
Figure 9

BRG1 controls dynamics of MITF binding.
(A) ChIP-qPCR of 3HA-MITF in 501Mel-CL8 cells at the indicated loci following transfection with siLuc or siBRG1. The protamine 1 locus (PRM1) was used as a negative control. (B) UCSC screenshots illustrating binding of MITF between two BRG1-occupied nucleosomes at selected loci assayed by ChIP-qPCR in panel A. sThe GPR110-1 and GPR110-2 sites assayed in Panel A are indicated in panel B. (C) A model for regulatory elements in the melanocyte lineage. Melanocyte lineage enhancers comprise combinations of MITF, SOX10, YY1, and also TFAP2A and ETS1 (not represented for simplicity. Note also that Pol II and the PIC are present at active enhancers where enhancer RNAs are made. For simplicity these are also not represented.) bound to a nucleosome-depleted region. MITF but also these other factors recruit BRG1/PBAF to the nucleosomes flanking the combinations of transcription factors. BRG1/PBAF also occupies the nucleosomes flanking the TSS and a subset of these promoters further comprises a MITF binding site close to the TSS.
Author response image 1

Additional files
-
Supplementary file 1
Related to Figure 1. Mass spectrometry identification of MITF partners. Excel table showing the data from the mass spectrometry analysis. Page 1 shows a summary of the number of peptides and proteins identified in the two experiments in the soluble nuclear and chromatin associated fractions. Page 2 lists the proteins identified uniquely in the F-H-MITF immunoprecipitates from the soluble nuclear fraction along with the number of peptides for each protein. Page 3 lists the proteins identified uniquely in the F-H-MITF immunoprecipitates from the chromatin-associated fraction along with the number of peptides for each protein.
- https://doi.org/10.7554/eLife.06857.019
-
Supplementary file 2
Related to Figure 2. Excel spread sheet of genes specifically and commonly regulated by BRG1 and MITF knockdown in 501Mel and Hermes 3A cells along with the appropriate gene ontology, see Figures S3B–D.
- https://doi.org/10.7554/eLife.06857.020
-
Supplementary file 3
Excel spread sheet of genes with associated BRG1 occupancy (either ±10 kb, or ±30 kb with respect to TSS) and regulated in shBRG1 along with the appropriate gene ontology as described in Figure S5E.
- https://doi.org/10.7554/eLife.06857.021
-
Supplementary file 4
Excel spread sheet of genes associated with BRG1 and MITF co-occupied sites or MARES along with their gene ontology.
- https://doi.org/10.7554/eLife.06857.022
-
Supplementary file 5
Excel spread sheet of primer sequences used for RT-qPCR and ChIP-qPCR.
- https://doi.org/10.7554/eLife.06857.023
Download links
A two-part list of links to download the article, or parts of the article, in various formats.
Downloads (link to download the article as PDF)
Open citations (links to open the citations from this article in various online reference manager services)
Cite this article (links to download the citations from this article in formats compatible with various reference manager tools)
Transcription factor MITF and remodeller BRG1 define chromatin organisation at regulatory elements in melanoma cells
eLife 4:e06857.
https://doi.org/10.7554/eLife.06857


