Mapping and analysis of Caenorhabditis elegans transcription factor sequence specificities
- University of Toronto, Canada
- University of Cincinnati, United States
- University of Massachusetts Medical School, United States
- Cincinnati Children's Hospital Medical Center, United States
- Canadian Institutes For Advanced Research, Canada
Figures
Figure 1 with 1 supplement
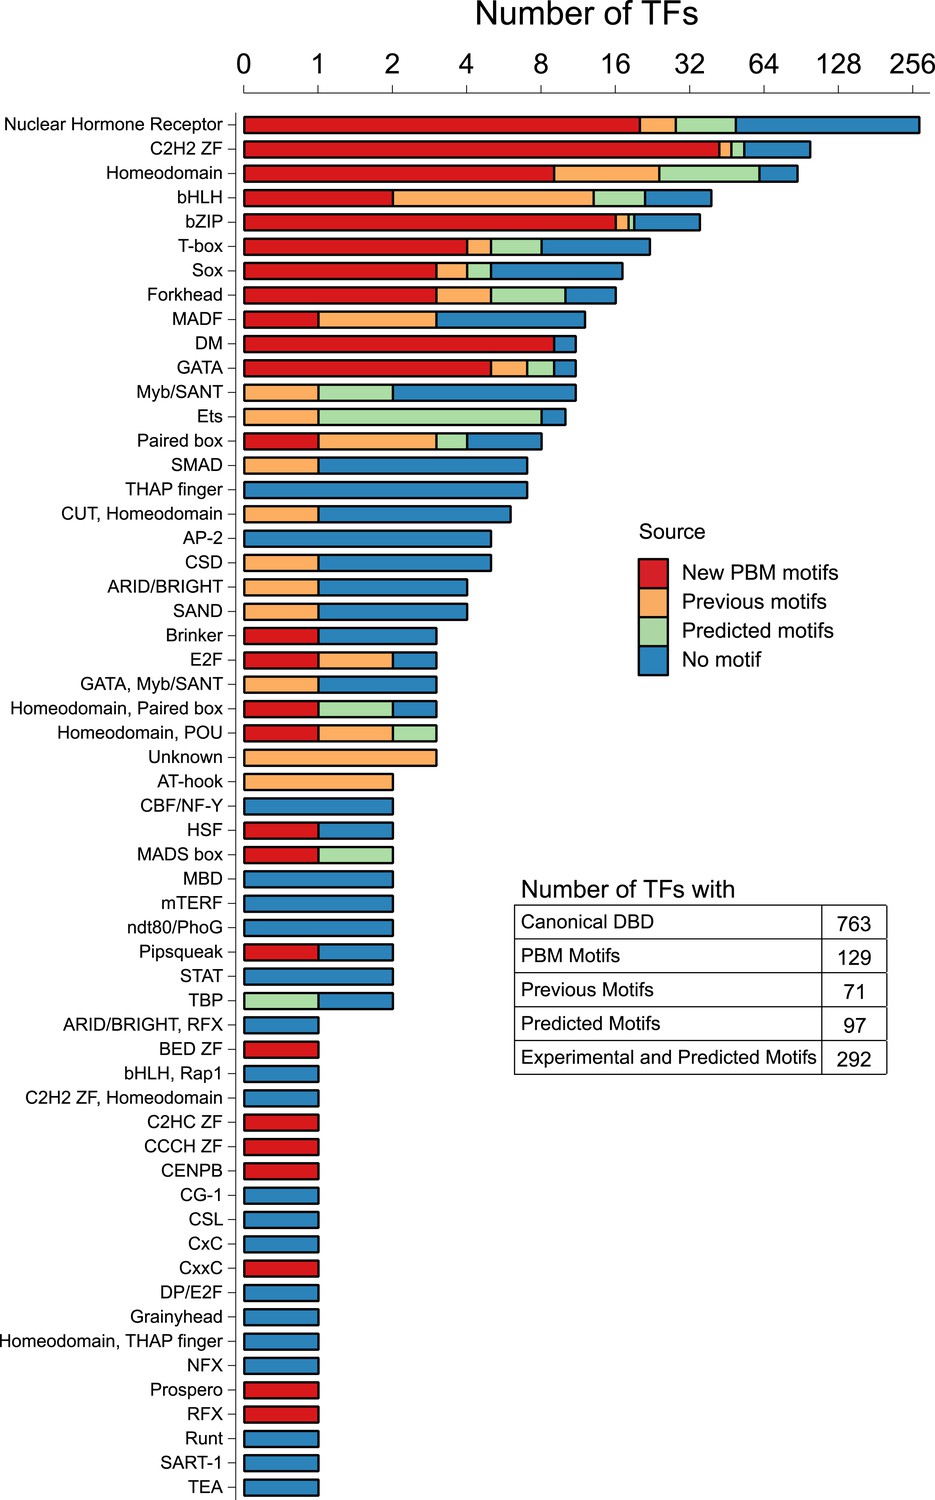
Motif status by DBD class.
Stacked bar plot depicting the number of unique C. elegans Transcription factors (TFs) for which a motif has been derived using PBM (this study), previous literature (including PBMs), or by homology-based prediction rules (see main text). The y-axis is displayed on a log2 scale for values greater than zero. See Figure 1—source data 1 for DNA-binding domain (DBD) abbreviations. Correspondence between motifs identified in current study and previously reported motifs is shown in Figure 1—figure supplement 1.
-
Figure 1—source data 1
Table of C. elegans TF repertoire motif coverage and list of TF DBDs present in C. elegans.
The number of unique C. elegans TFs by DNA-binding domain family for which a motif has been derived using PBM (this study), previous literature (including PBMs), or by homology-based prediction rules and the list of C. elegans TFs by DNA-binding domain family type.
- https://doi.org/10.7554/eLife.06967.004
Figure 1—figure supplement 1
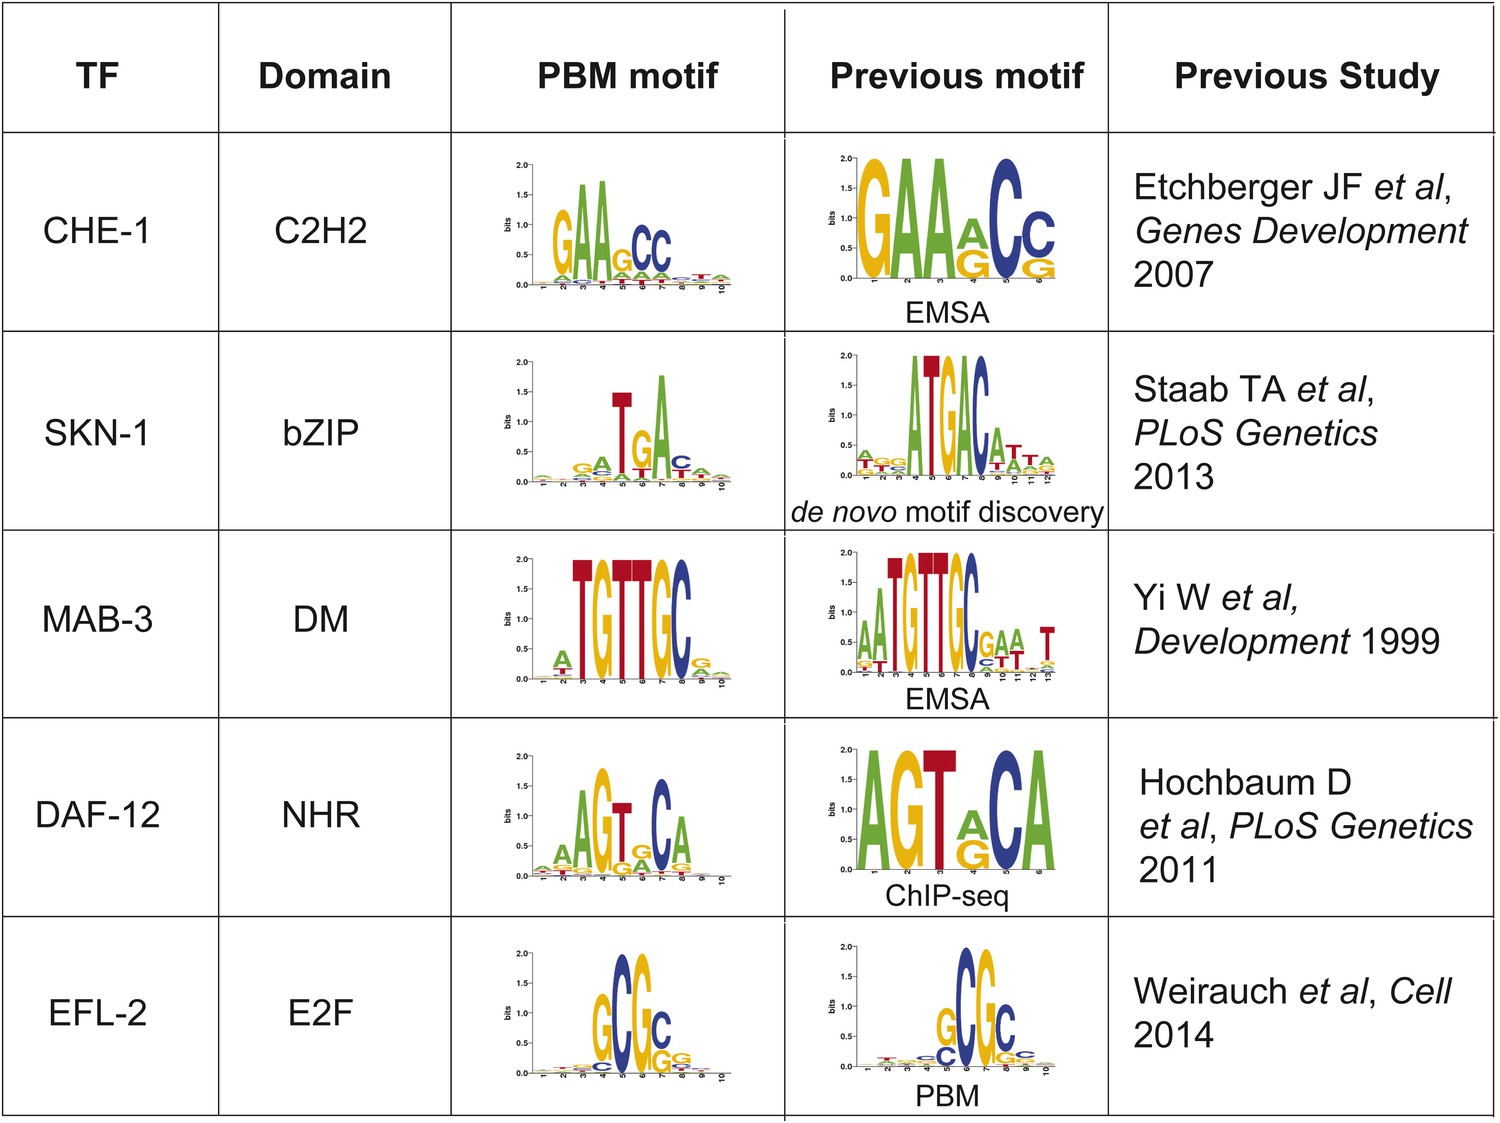
Correspondence between TF motifs identified from our PBM study and previously reported motifs from several types of experimental data.
https://doi.org/10.7554/eLife.06967.005
Figure 2 with 5 supplements
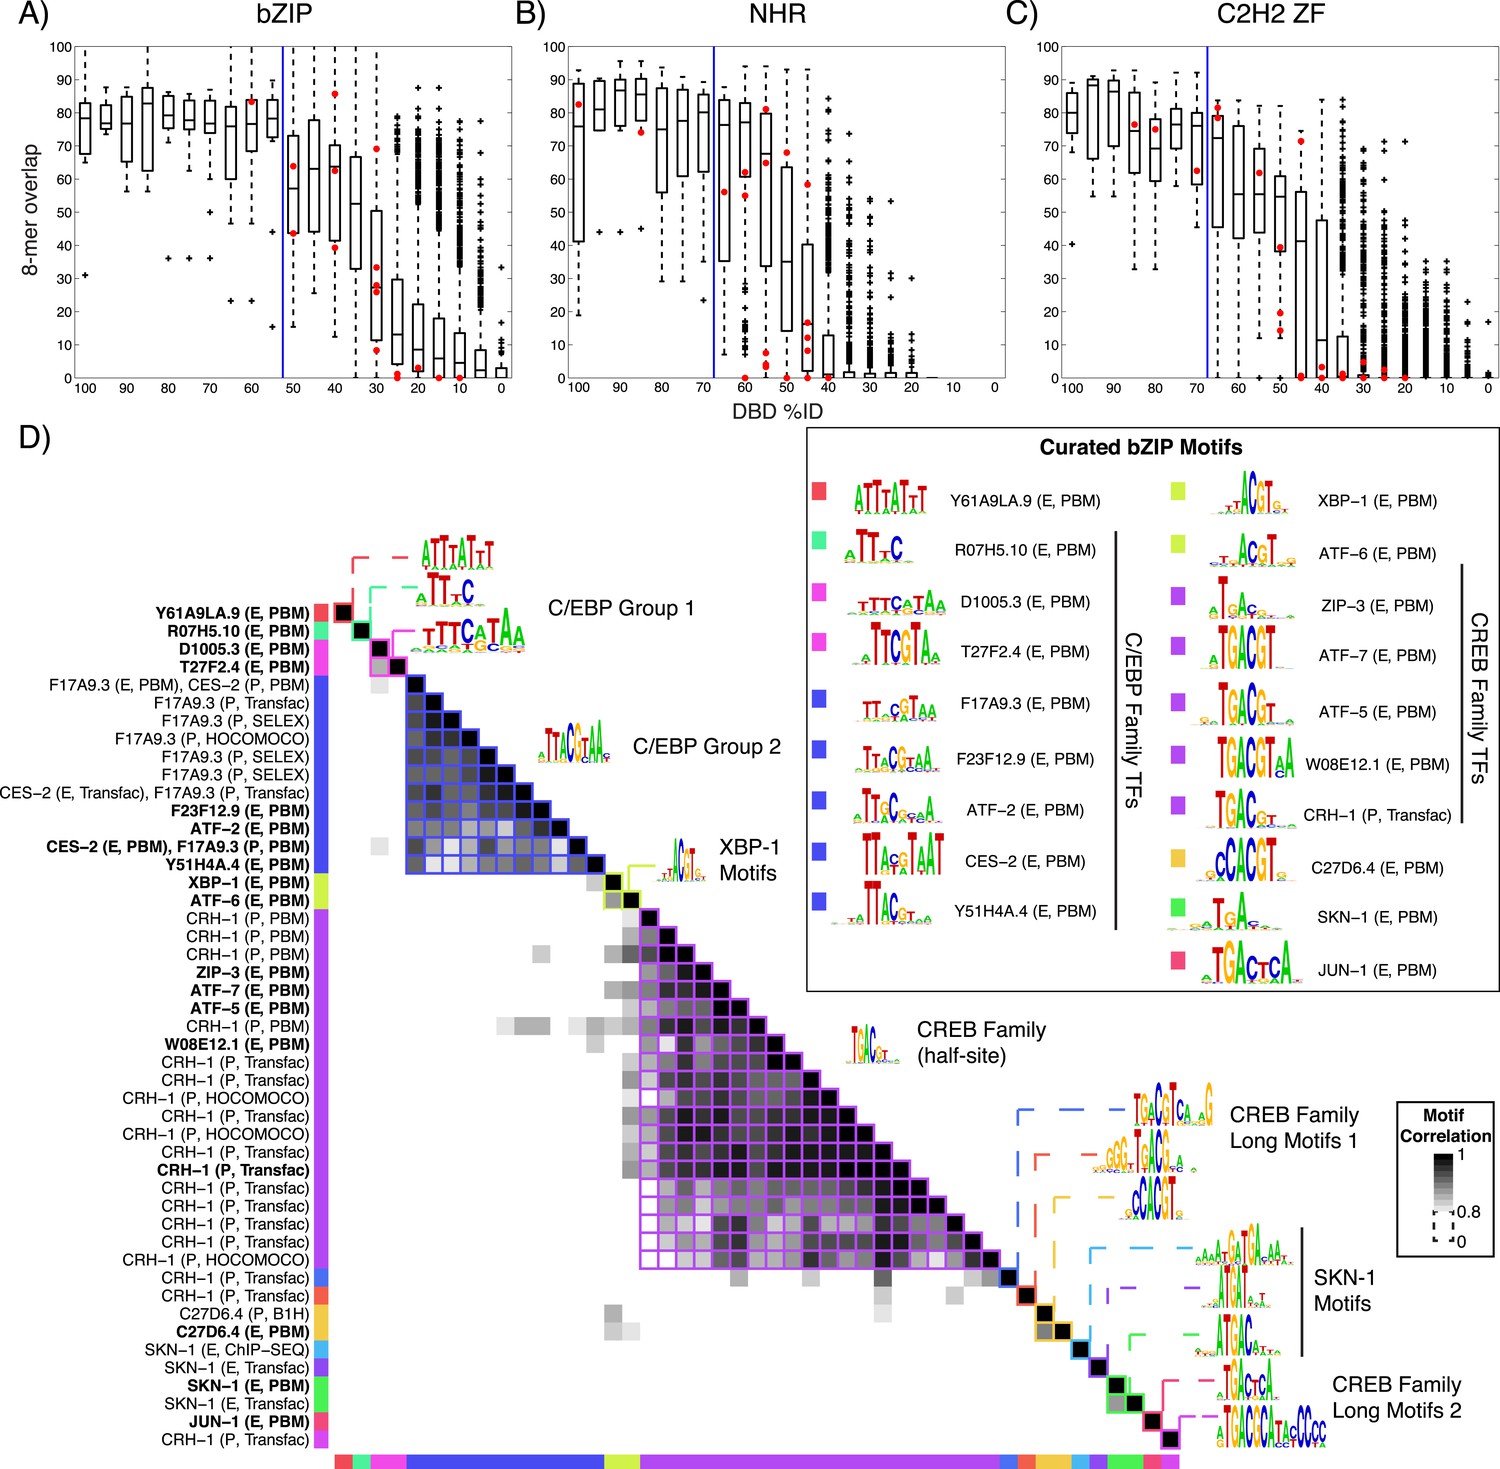
Motif prediction, motif clustering, and identification of representative motifs.
(A–C) Boxplots depict the relationship between the %ID of aligned AAs and % of shared 8-mer DNA sequences with E-scores exceeding 0.45, for the three DBD classes, as indicated. %ID bins range from 0 to 100, of size 10, in increments of five. Red dots indicate individual TFs in this study, vs the next closest TF with PBM data. Vertical lines indicate AA %ID threshold above which motifs can be predicted using homology, taken from (Weirauch et al., 2014). Boxplots for all other DBDs in current study are shown in Figure 2—figure supplements 1–4. (D) Clustering analysis of motifs of bZIP domains using position-weight matrices (PWM)clus (Jiang and Singh, 2014). Colored gridlines indicate clusters. Cluster centroids are shown along the diagonal; expert curated motifs are shown within the box at right. ‘E’ indicates experimentally determined motifs; ‘P’ indicates predicted motifs. Source of motif is also indicated. Results of motif curation for GATA family TFs is displayed in Figure 2—figure supplement 5.
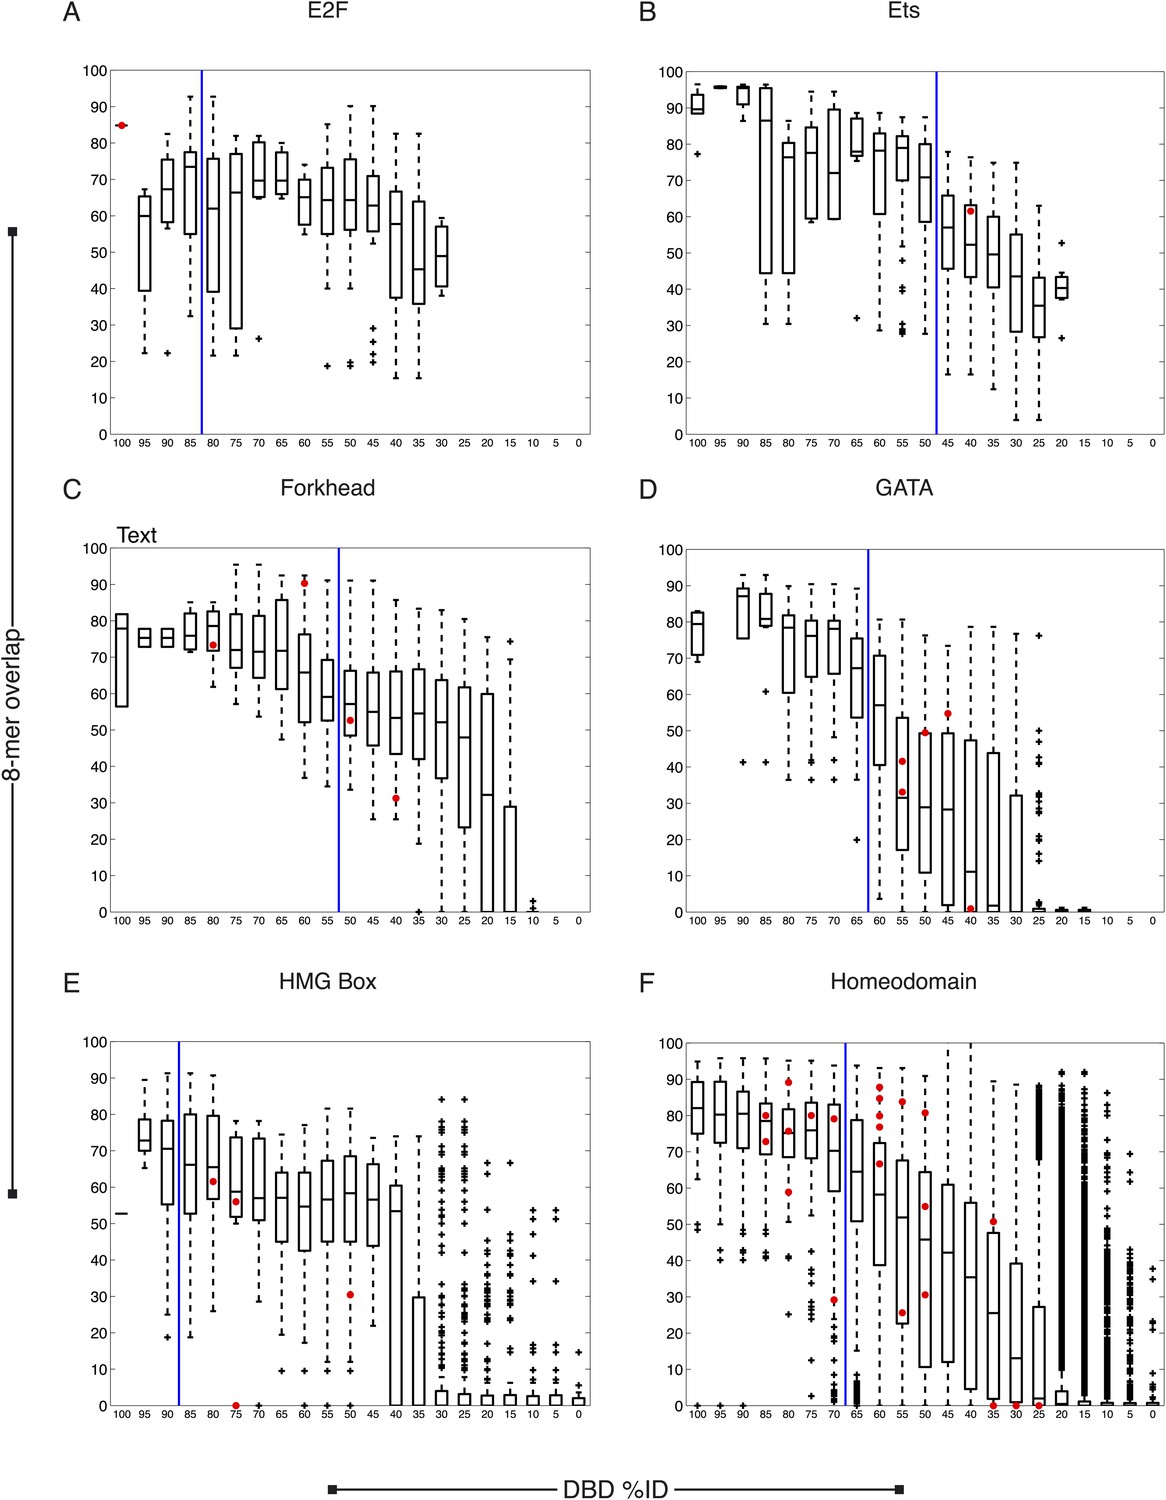
Figure 2—figure supplement 1
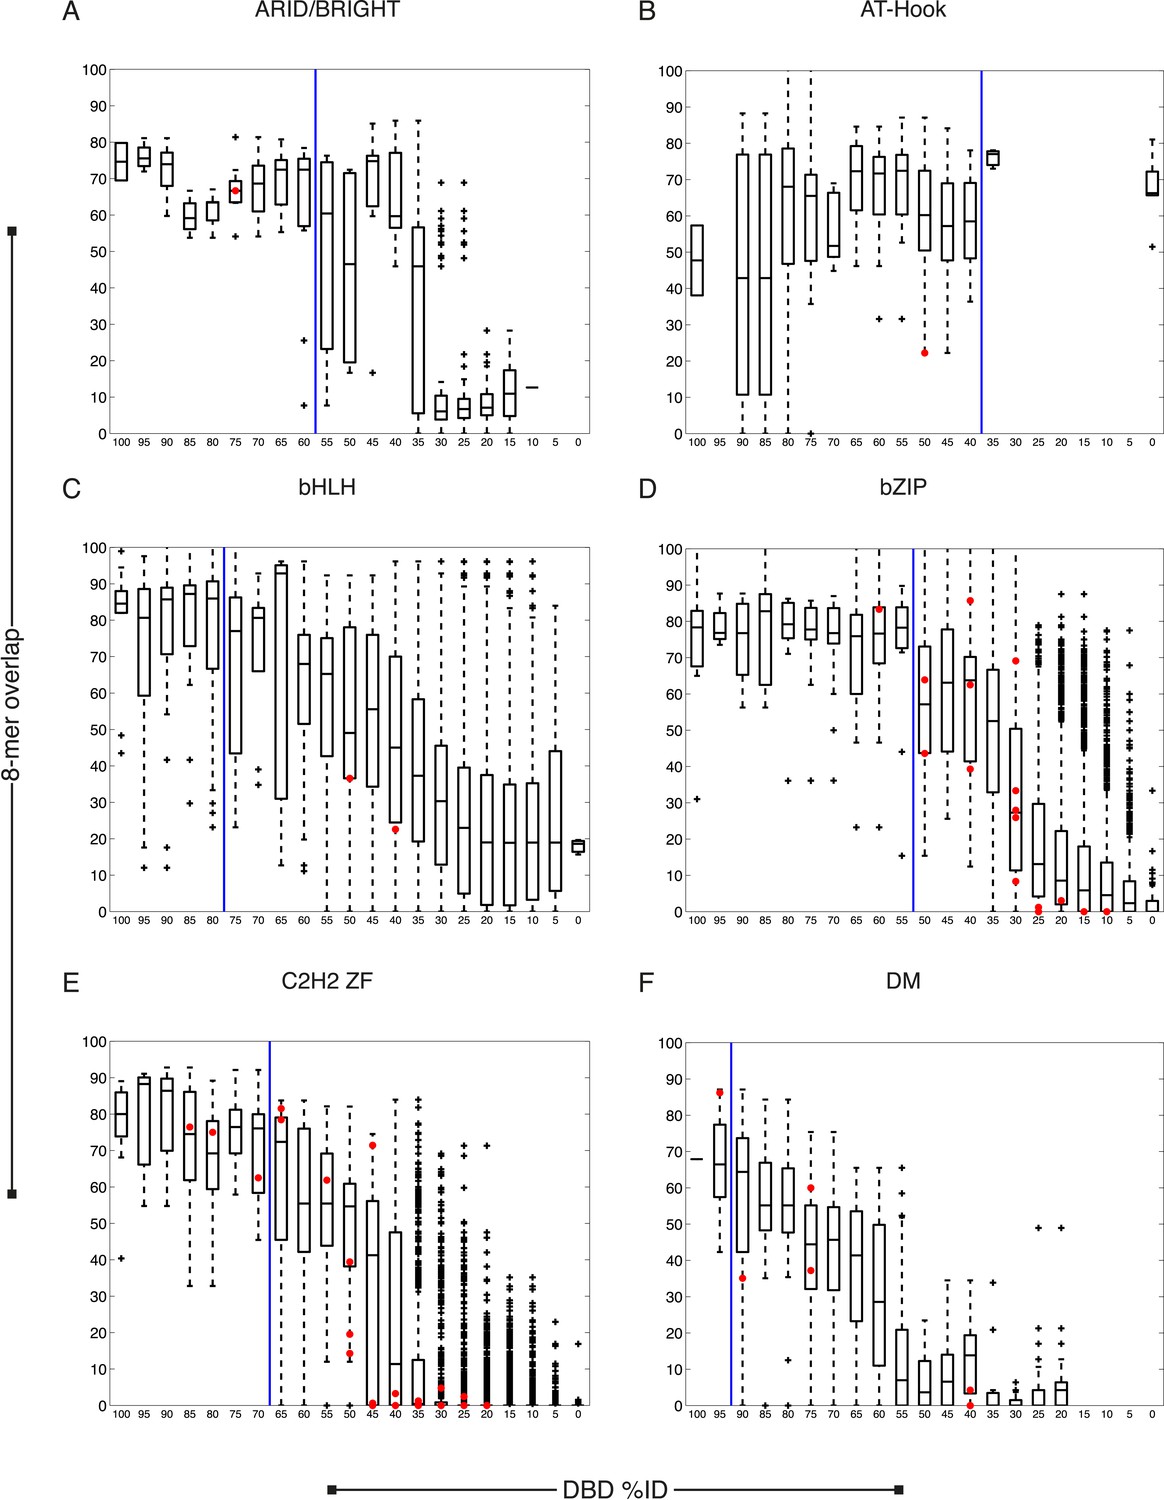
C. elegans TFs adhere to established thresholds for motif inference.
(A–F) Boxplots depict the relationship between the %ID of aligned AAs and % of shared 8-mer DNA sequences with E-scores exceeding 0.45, for the DBD classes of TFs with PBMs from this study. %ID bins range from 0 to 100, of size 10, in increments of five. Red dots indicate individual proteins in this study, vs the next closest protein with PBM data. Vertical blue lines indicate AA %ID threshold above which motifs can be predicted using homology.
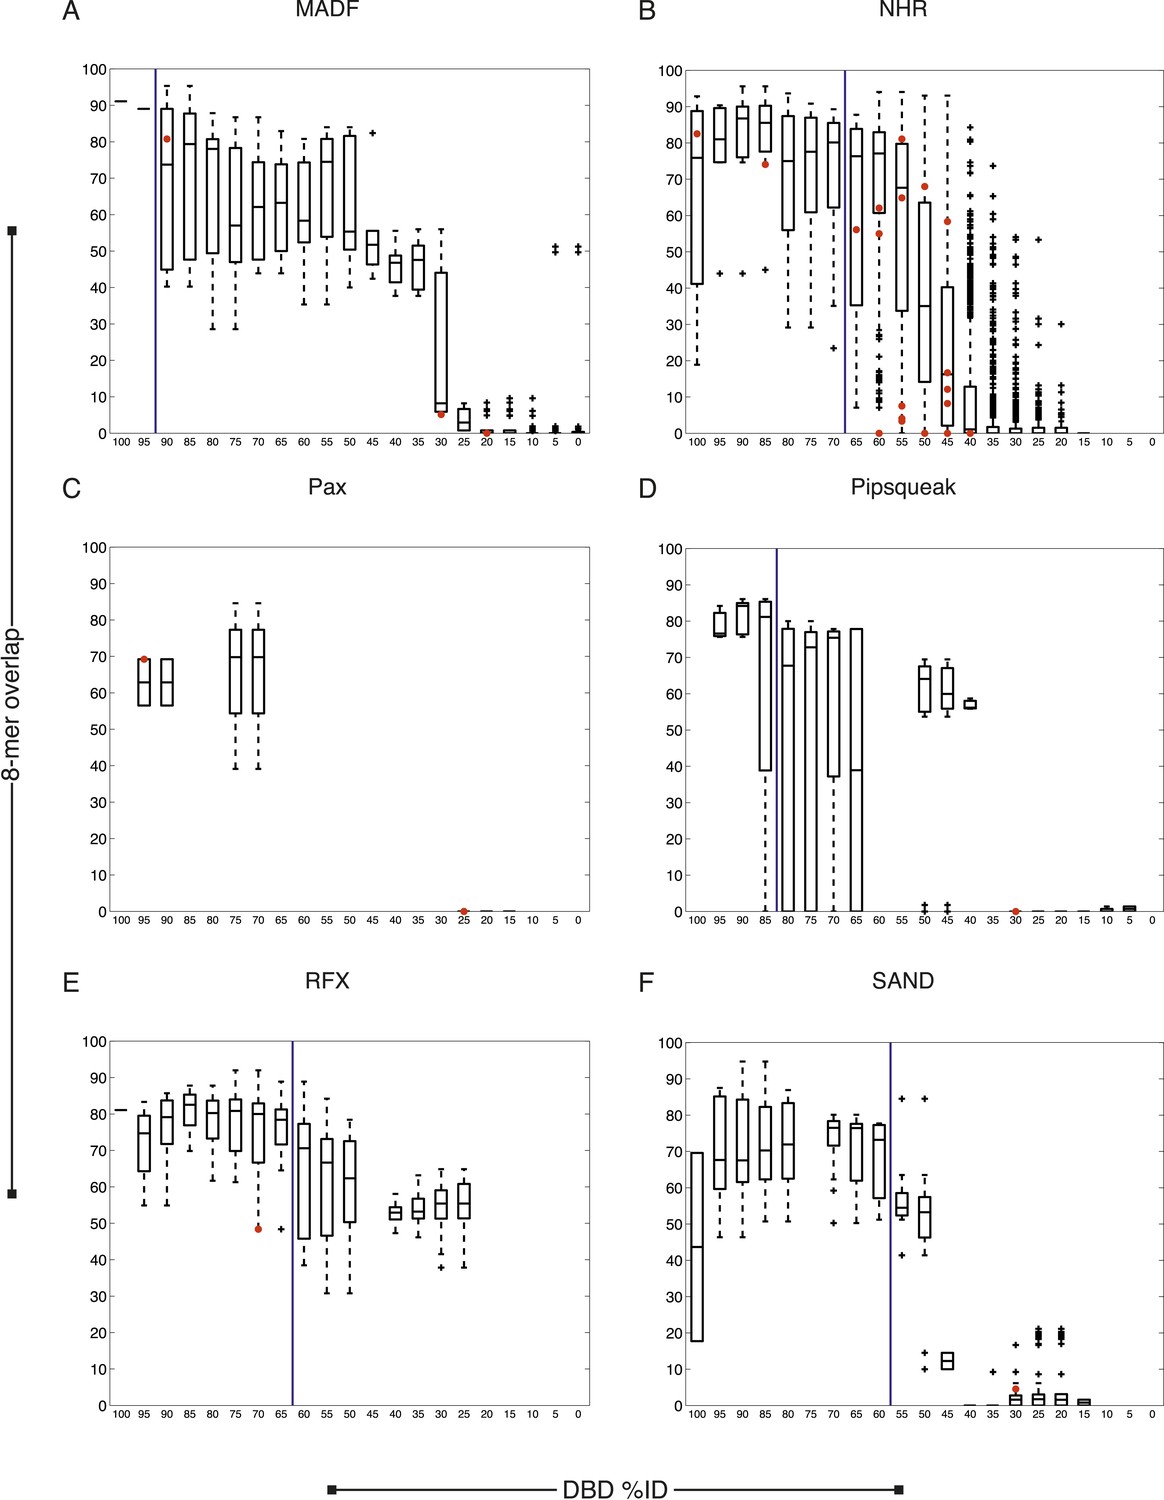
Figure 2—figure supplement 2
C. elegans TFs adhere to established thresholds for motif inference (continued).
(A–F) Boxplots depict the relationship between the %ID of aligned AAs and % of shared 8-mer DNA sequences with E-scores exceeding 0.45, for the DBD classes of TFs with PBMs from this study. %ID bins range from 0 to 100, of size 10, in increments of five. Red dots indicate individual proteins in this study, vs the next closest protein with PBM data. Vertical blue lines indicate AA %ID threshold above which motifs can be predicted using homology.
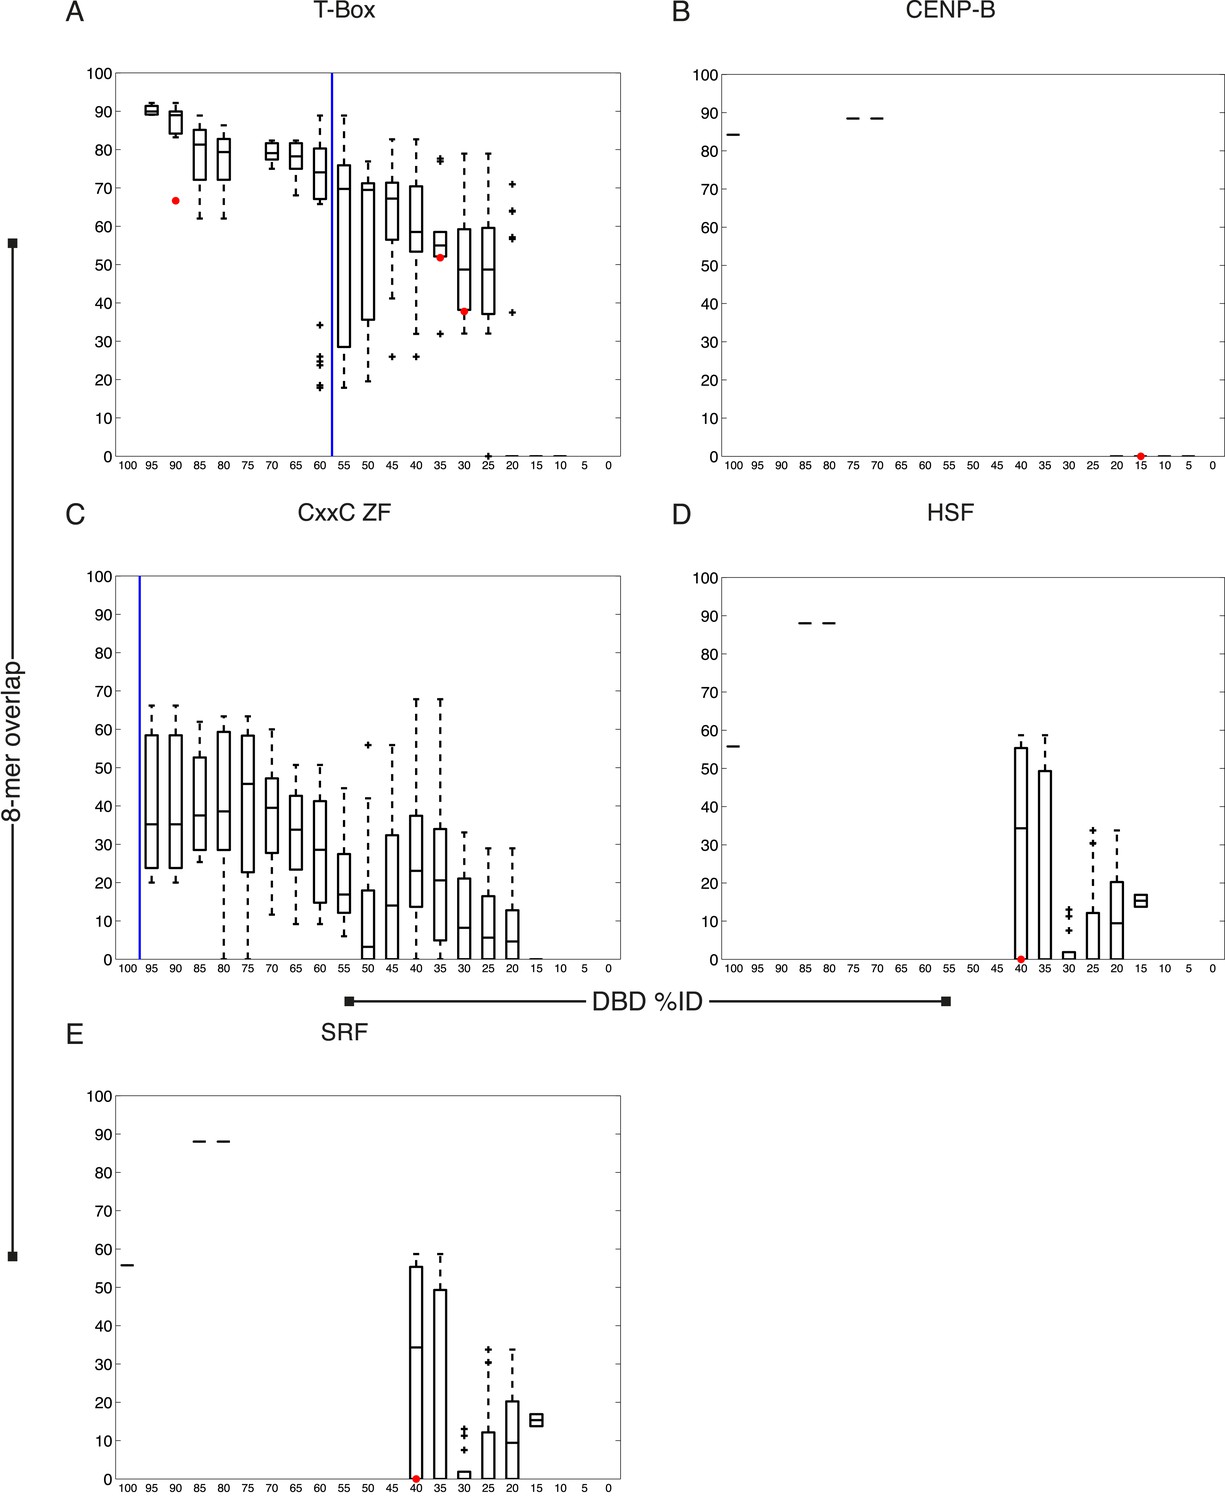
Figure 2—figure supplement 3
C. elegans TFs adhere to established thresholds for motif inference (continued).
(A–F) Boxplots depict the relationship between the %ID of aligned AAs and % of shared 8-mer DNA sequences with E-scores exceeding 0.45, for the DBD classes of TFs with PBMs from this study. %ID bins range from 0 to 100, of size 10, in increments of five. Red dots indicate individual proteins in this study, vs the next closest protein with PBM data. Vertical blue lines indicate AA %ID threshold above which motifs can be predicted using homology.
Figure 2—figure supplement 4
C. elegans TFs adhere to established thresholds for motif inference (continued).
(A–E) Boxplots depict the relationship between the %ID of aligned AAs and % of shared 8-mer DNA sequences with E-scores exceeding 0.45, for the DBD classes of TFs with PBMs from this study. %ID bins range from 0 to 100, of size 10, in increments of five. Red dots indicate individual proteins in this study, vs the next closest protein with PBM data. Vertical blue lines indicate AA %ID threshold above which motifs can be predicted using homology.
Figure 2—figure supplement 5
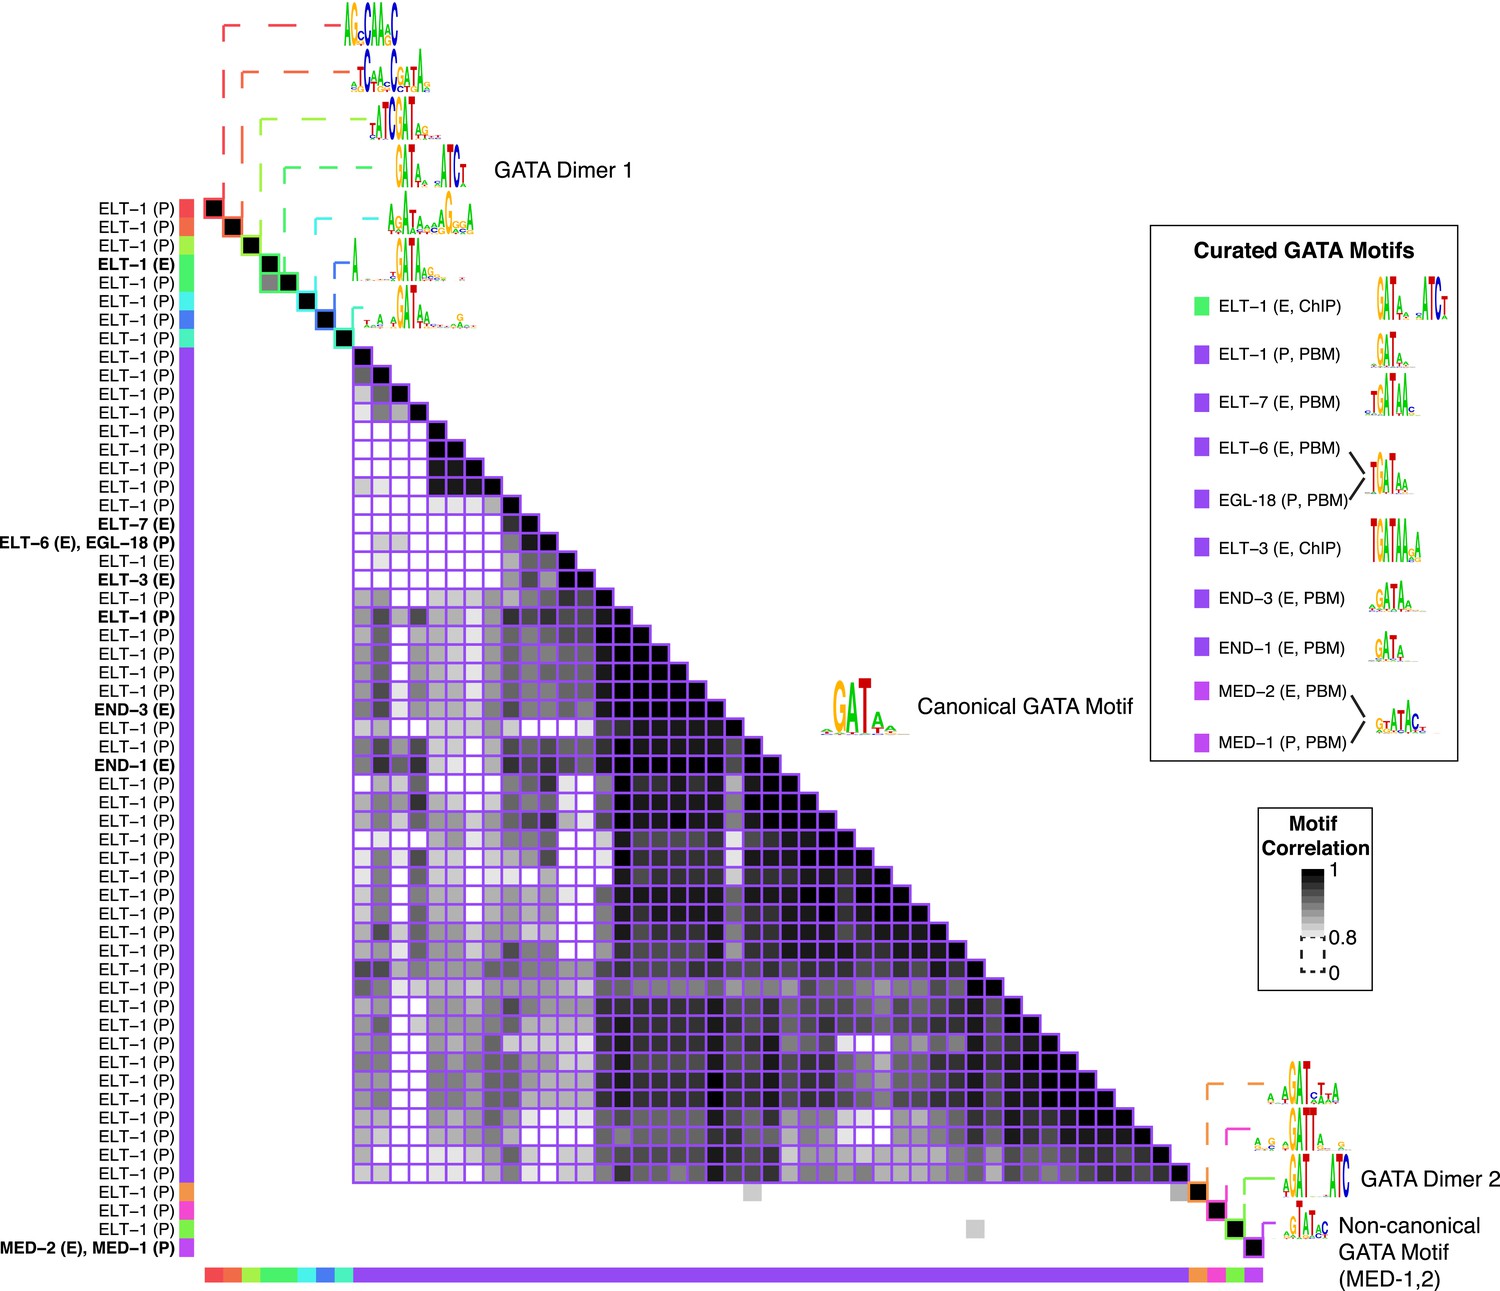
GATA TF motif clustering and identification of representative motifs.
Clustering analysis of C. elegans GATA TF's motifs using PWMclus (Jiang and Singh 2014). Colored gridlines indicate clusters. Cluster centroids are shown along the diagonal, while manually curated motifs are shown within the box at right. Bolded row names represent motifs obtained from this study.
Figure 3
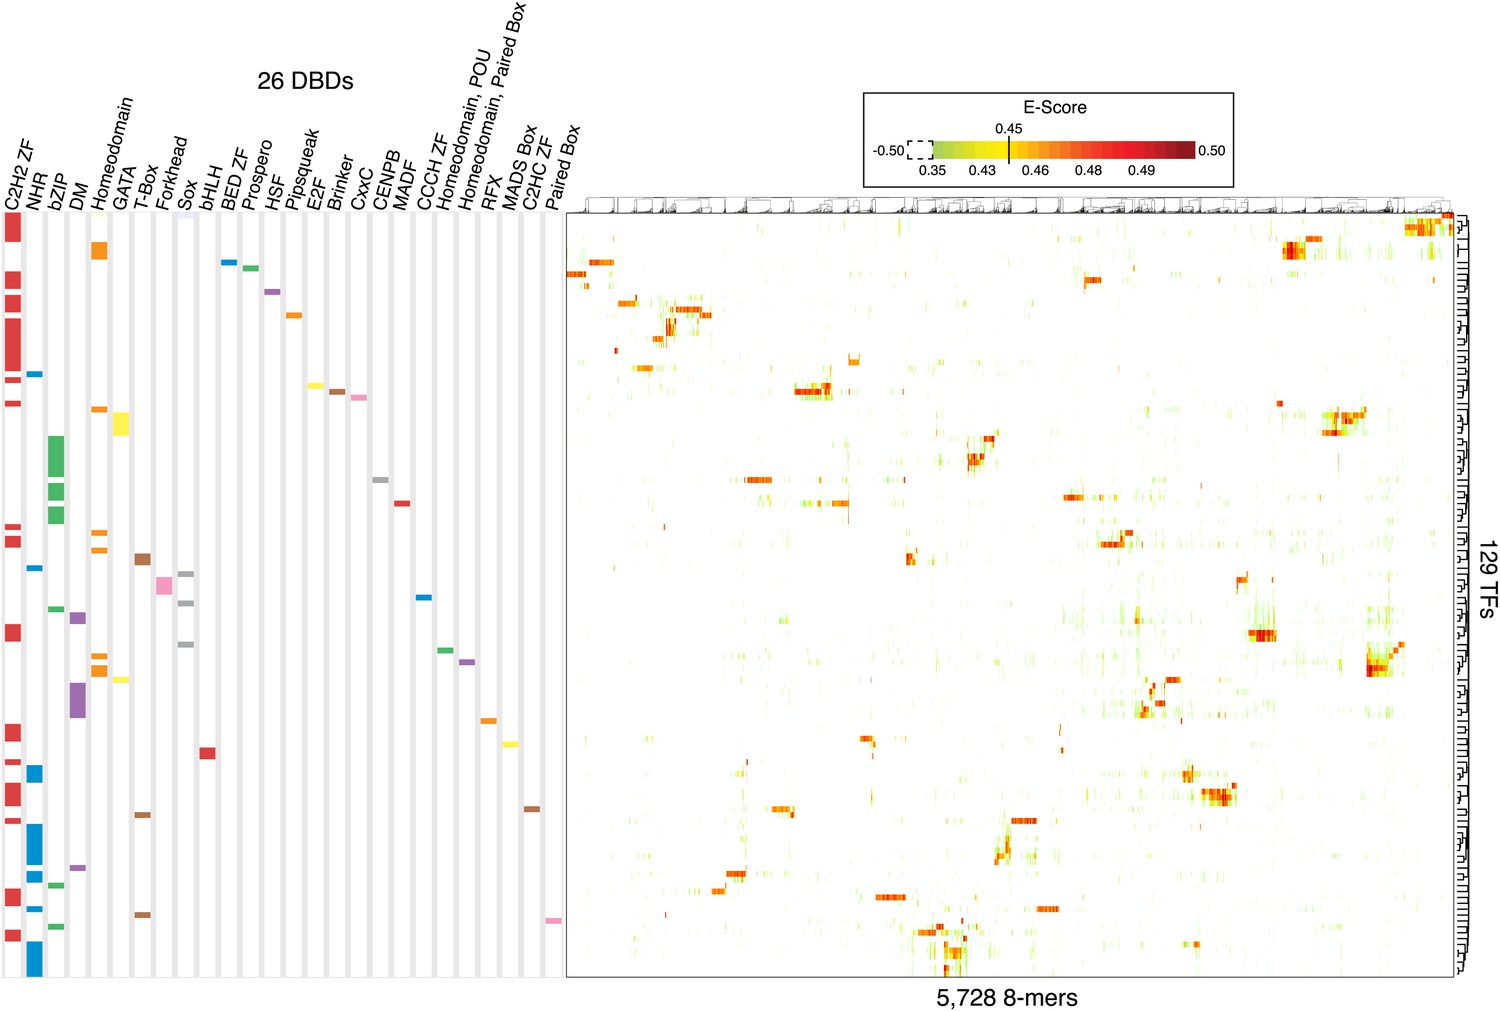
Overview of 8-mer sequences preferences for the 129 C. elegans TFs analyzed by PBM in this study.
2-D Hierarchical agglomerative clustering analysis of E-scores performed on all 5728 8-mers bound by at least one TF (average E > 0.45 between ME and HK replicate PBMs). Colored boxes represent DBD classes for each TF. Average E-score data is available in Figure 3—source data 1.
-
Figure 3—source data 1
Table showing 8-mers bound by at least one TF with an average E-score ≥0.45 for all the 129 C. elegans TFs analyzed by PBMs in this study.
- https://doi.org/10.7554/eLife.06967.013
Figure 4
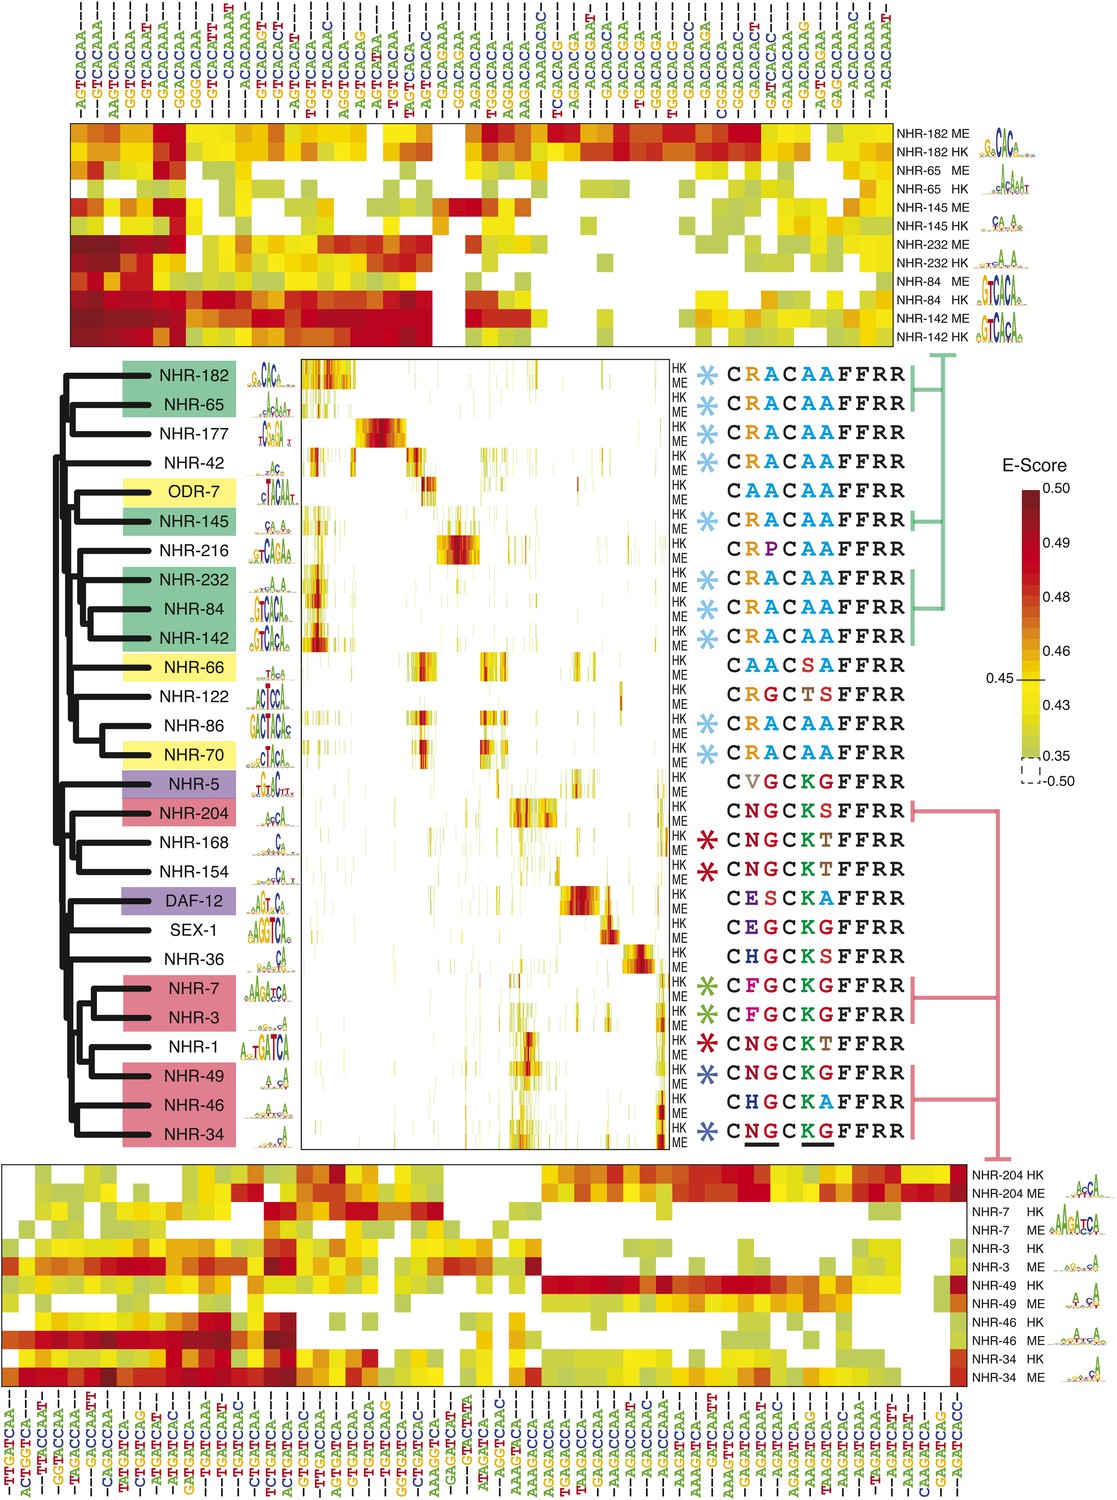
8-mer binding profiles of NHR family reveal distinct sequence preferences.
Left, ClustalW phylogram of nuclear hormone receptor (NHR) DBD amino acid sequences with corresponding motifs. TF labels are shaded according to motif similarity groups identified by PWMclus. Center, heatmap showing E-scores. NHRs are ordered according to the phylogram at left. The 1406 8-mers with E-score > 0.45 for at least one family member on at least one PBM array were ordered using hierarchical agglomerative clustering. Each TF has one row for each of two-replicate PBM experiments (ME or HK array designs). Right; recognition helix (RH) sequences for the corresponding proteins, with identical RH sequence types highlighted by colored asterisks. Variant RH residues are underlined at bottom. Right, matrix indicates cluster membership according to PWMclus. Top and bottom, pullouts show re-clustered data including only the union of the top ten most highly scoring 8-mers (taking the average E-score from the ME and HK arrays) for each of the selected proteins. E-scores for k-mers in all three heatmaps are available in Figure 4—source data 1.
-
Figure 4—source data 1
Table showing 8-mer E-score profiles of NHRs analyzed by PBMs.
8-mers bound by at least one NHR with an E-score ≥0.45 for all the C. elegans NHRs that have been analyzed by PBMs (center panel) and a table of pullouts (top and bottom panel) showing average (ME and HK) E-scores of the union of the top ten highly scoring 8-mers bound by at least one NHR within the selected motif cluster.
- https://doi.org/10.7554/eLife.06967.015
Figure 5 with 1 supplement
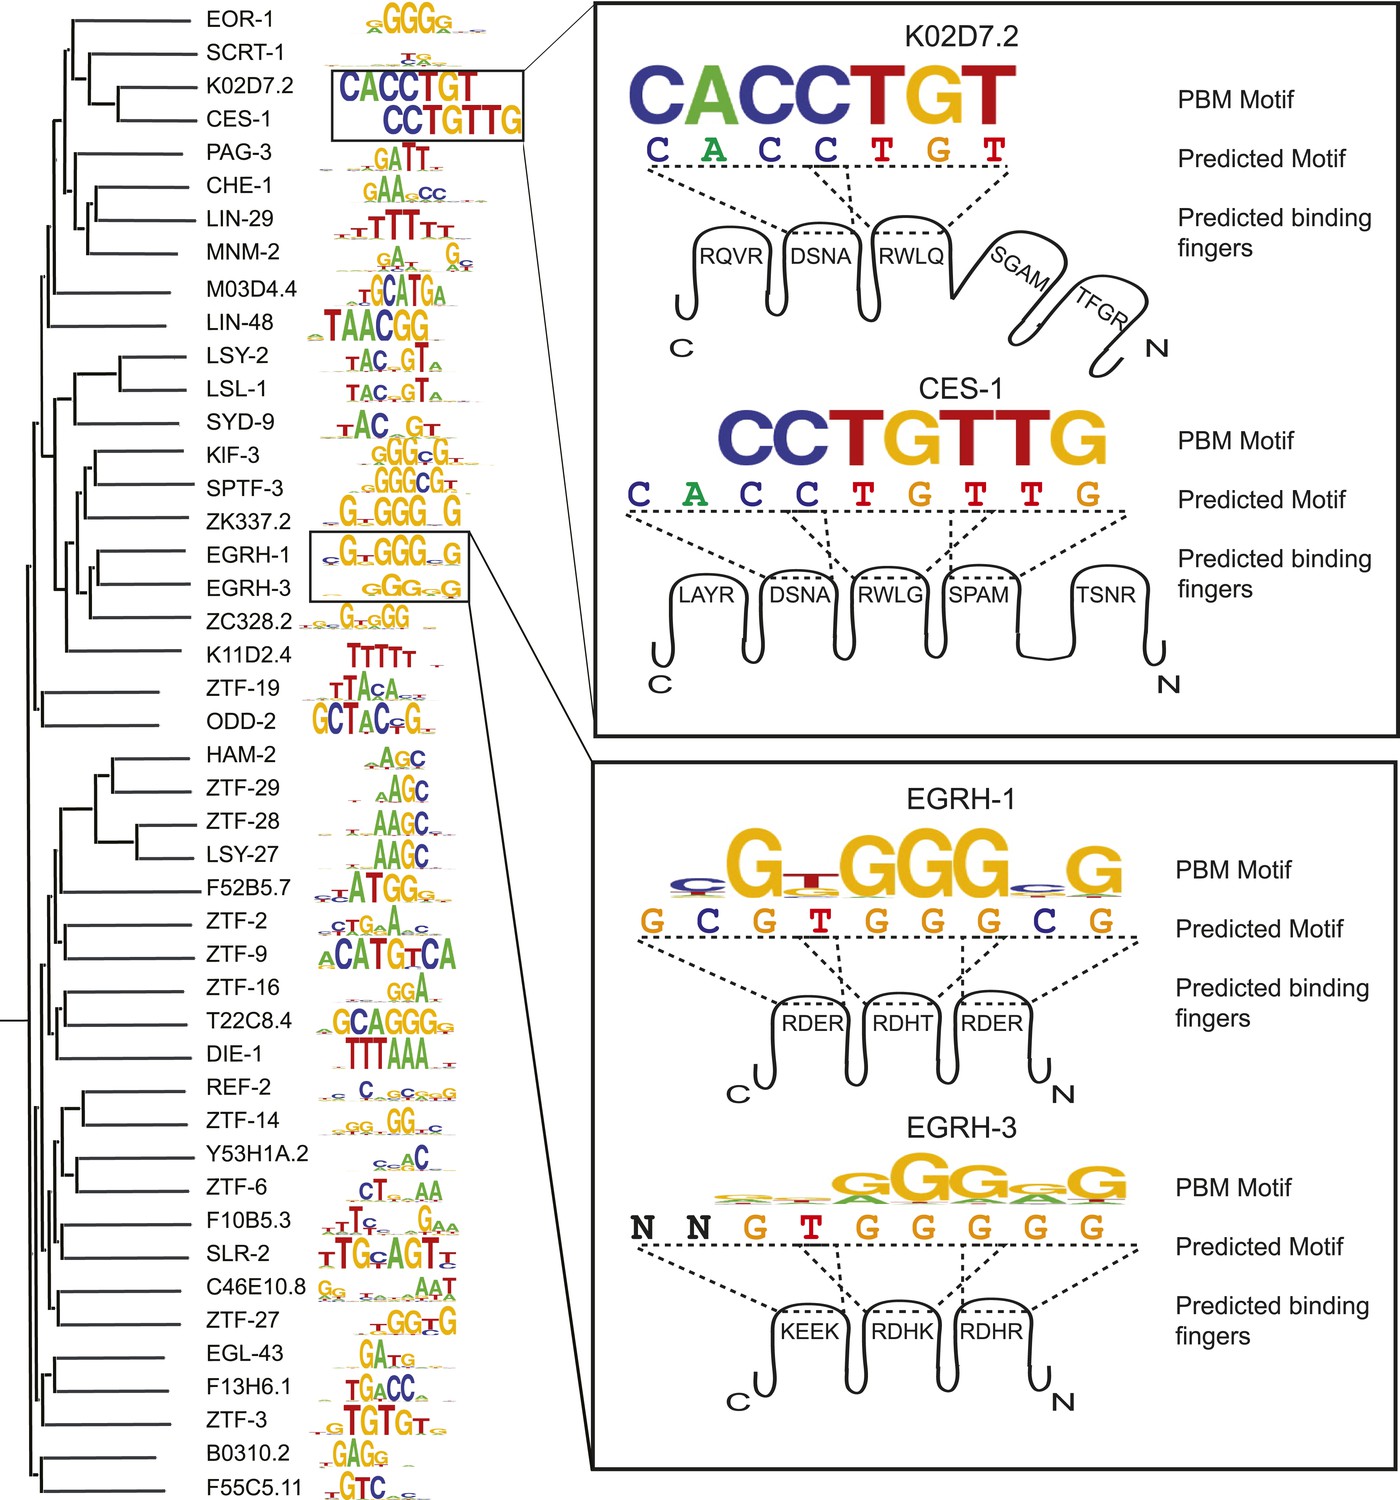
C2H2 motifs relate to DBD similarity and to the recognition code.
Left, ClustalW phylogram of C2H2 zinc finger (ZF) amino acid sequences with corresponding motifs. Right, examples in which motifs predicted by the ZF recognition code are compared to changes in DNA sequences preferred by paralogous C2H2 ZF TFs. Cartoon shows individual C2H2 ZFs and their specificity residues. Dashed lines correspond to 4-base subsites predicted from the recognition code.
Figure 5—figure supplement 1

Comparison of C2H2 ZF recognition model with motifs derived PBM.
Motif correlations between PBM derived motifs and ZF-model based predictions for TFs with both typical and atypical (A) linker lengths between ZF modules that are longer than 6 amino acids or shorter than 4 amino acids (B) zinc coordinating cysteine or histidine structural motifs and (C) differing length of the ZF array. Examples of recognition code predictions (sequence logos) for both typical and atypical TFs are compared with PBM motifs for each case. The p-values shown are estimated from Student's t-test. The number of TFs in each boxplot is shown above in parentheses.
Figure 6 with 1 supplement
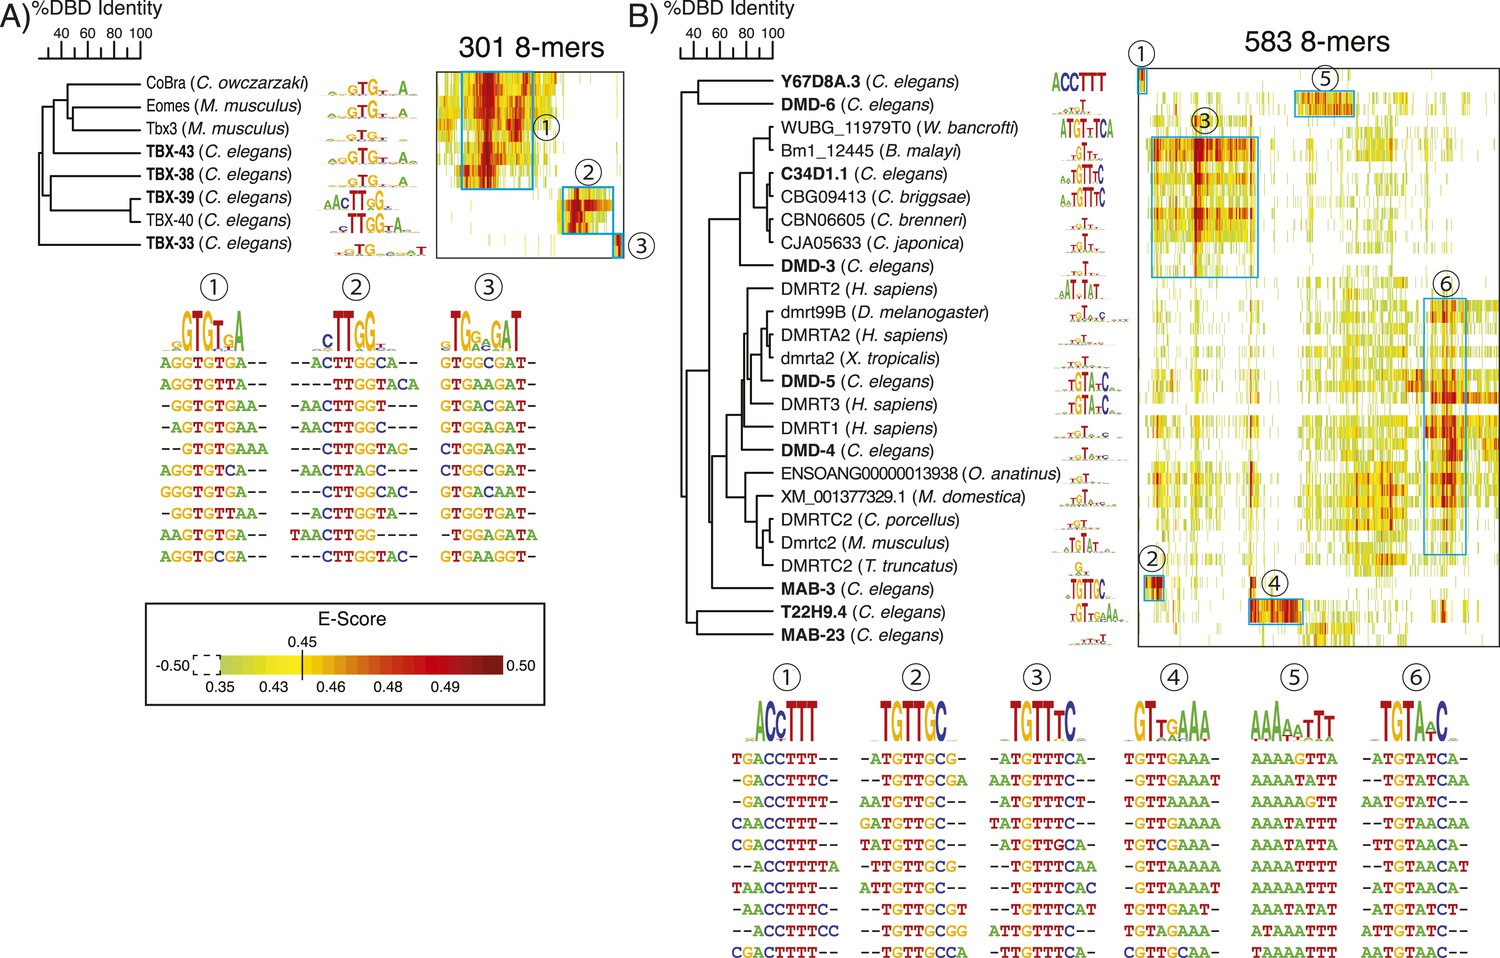
Nematode-specific sequence preferences in T-box and DM TFs.
PBM data heatmaps of preferred 8-mers for T-box (A), and DM (B) TFs. TFs are clustered using ClustalW; 8-mers were selected (at least one instance of E > 0.45) and clustered using hierarchical agglomerative clustering, as in Figures 4, 5. Ten representative 8-mers (those with highest E-scores) are shown below for each of the clusters indicated in cyan. C. elegans TFs with data from this study are bolded. E-score data for T-box and DM TFs available in Figure 6—source data 1.
-
Figure 6—source data 1
Table showing 8-mer E-score profiles of T-box and DM TFs from C. elegans and other metazoans that have been analyzed by PBMs.
- https://doi.org/10.7554/eLife.06967.019
Figure 6—figure supplement 1
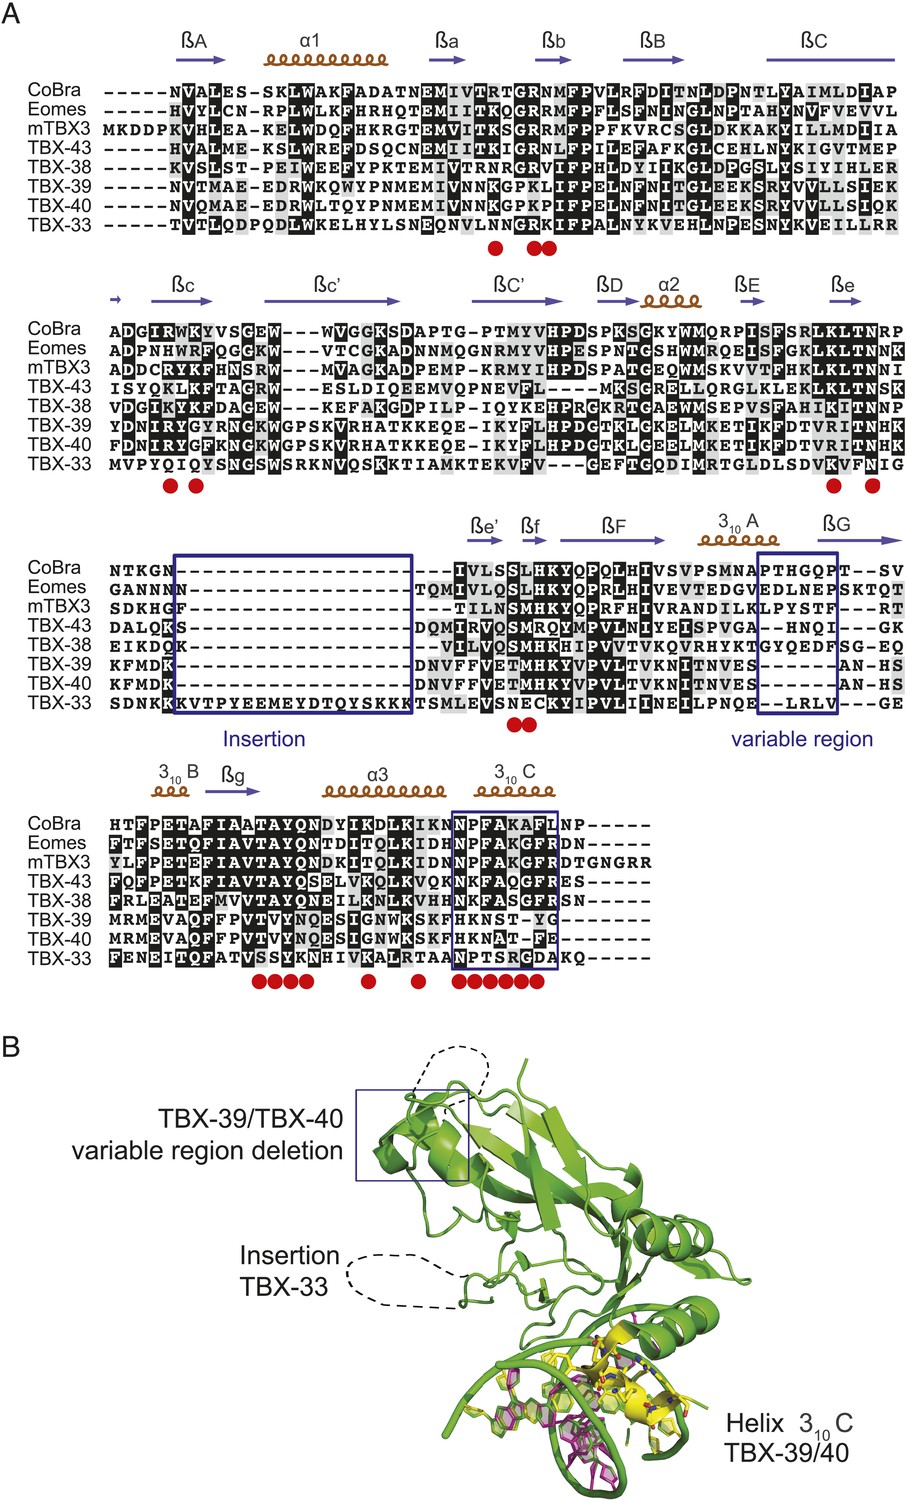
T-box sequence alignments and the crystal structure of mTBX3 illustrate C. elegans specific variations.
(A) Multiple-sequence alignment of T-box DBDs from C. elegans, the protist C. owczarzaki CoBra and mouse Eomes, and TBX3. Key DNA-binding residues identified from crystal structure of mTBX3 are highlighted in red. Sequence insertions (for TBX-33), changes in the variable region (for TBX-39/40), and significant sequence changes in the key 310C RH (for TBX- 39/40) are highlighted in blue frames. (B) Crystal structure model of mTBX3 is used as a prototype to illustrate C. elegans specific sequence variations. The primary recognition helix, 310C, is highlighted in yellow.
Figure 7 with 1 supplement

The C. elegans curated motif collection explains ChIP-seq and Y1H TF binding data.
Heatmap of CentriMo −log10 (q-values) for central enrichment of TF motifs in the top 250 peaks for each ChIP experiment. Motif enrichment in Y1H data is presented in Figure 7—figure supplement 1. Both ChIP-seq and Y1H heatmaps use a common colour and annotation scale. Heatmaps are symmetric with duplicate rows to ensure the diagonal represents TF-motif enrichment in it's matching data set(s). Red and blue coloring depicts statistically significant enrichments and depletions (q ≤ 0.05).
Figure 7—figure supplement 1
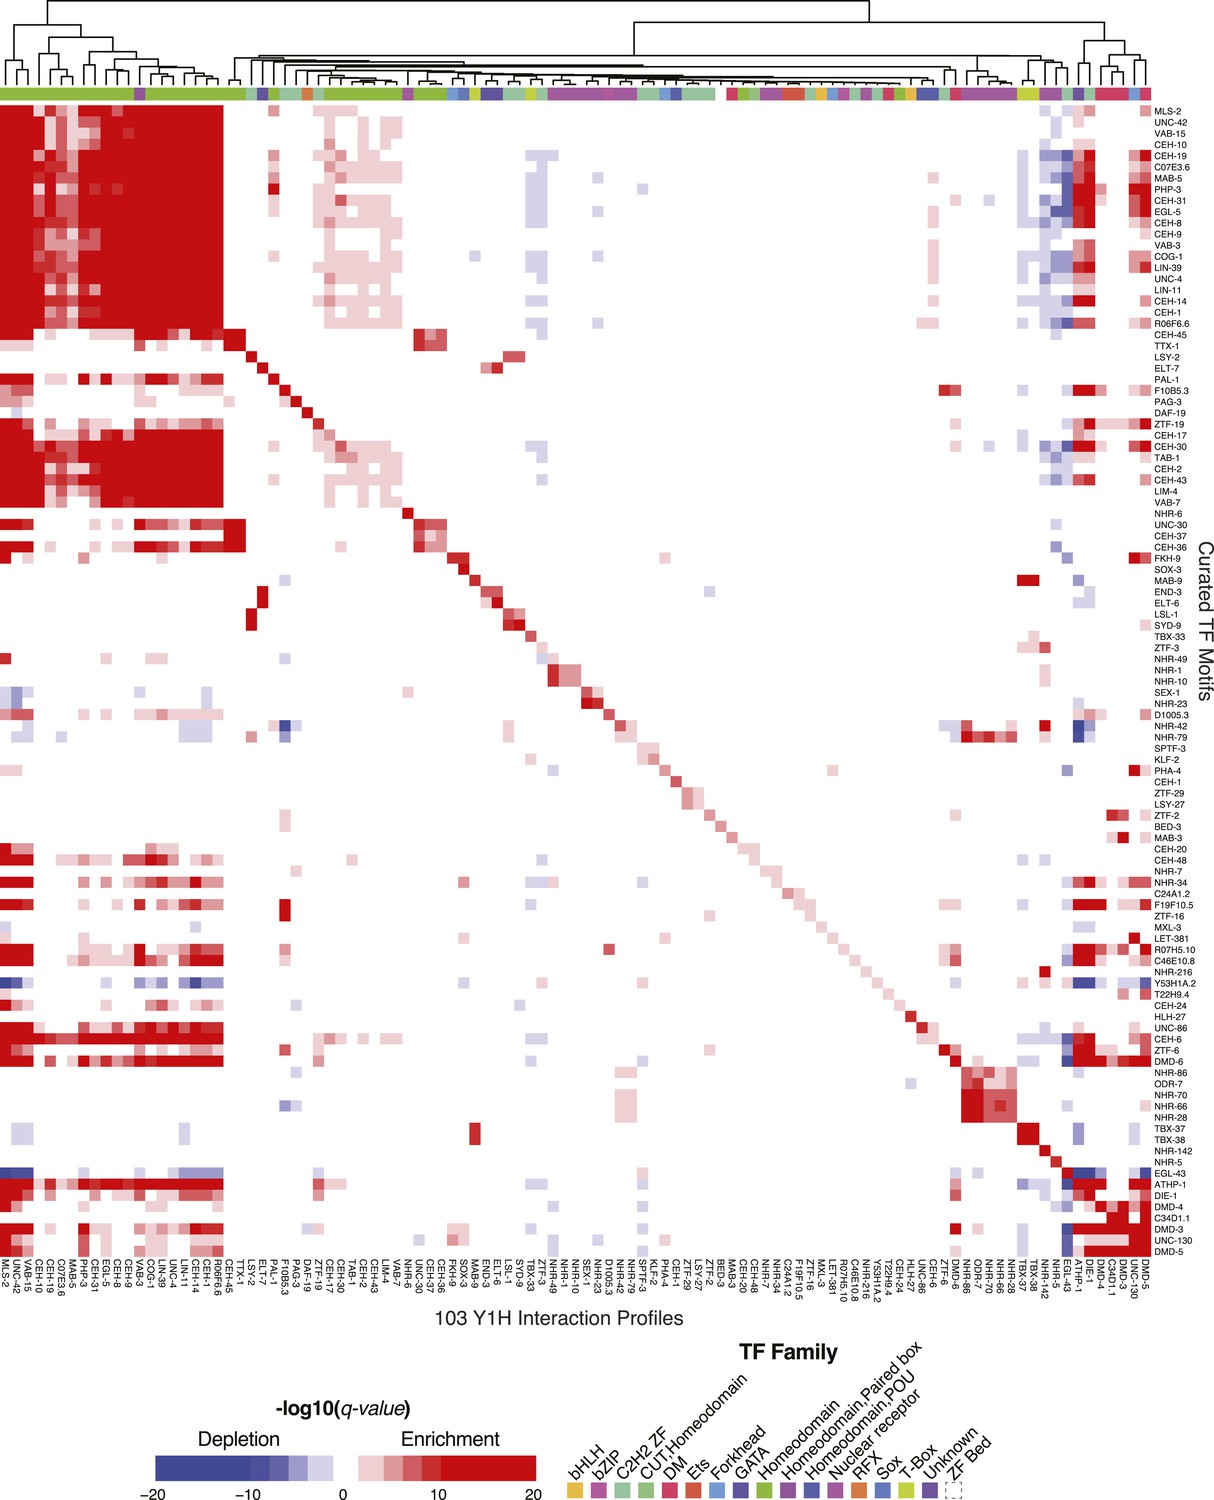
The C. elegans curated motif collection explains Y1H TF binding data.
Heatmap depicting enrichment or depletion (Mann–Whitney U test) of TF motifs in the interactions of TF's with a collection of promoter bait sequences in Y1H experiments compared to all non-interacting bait sequences.
Figure 8 with 5 supplements
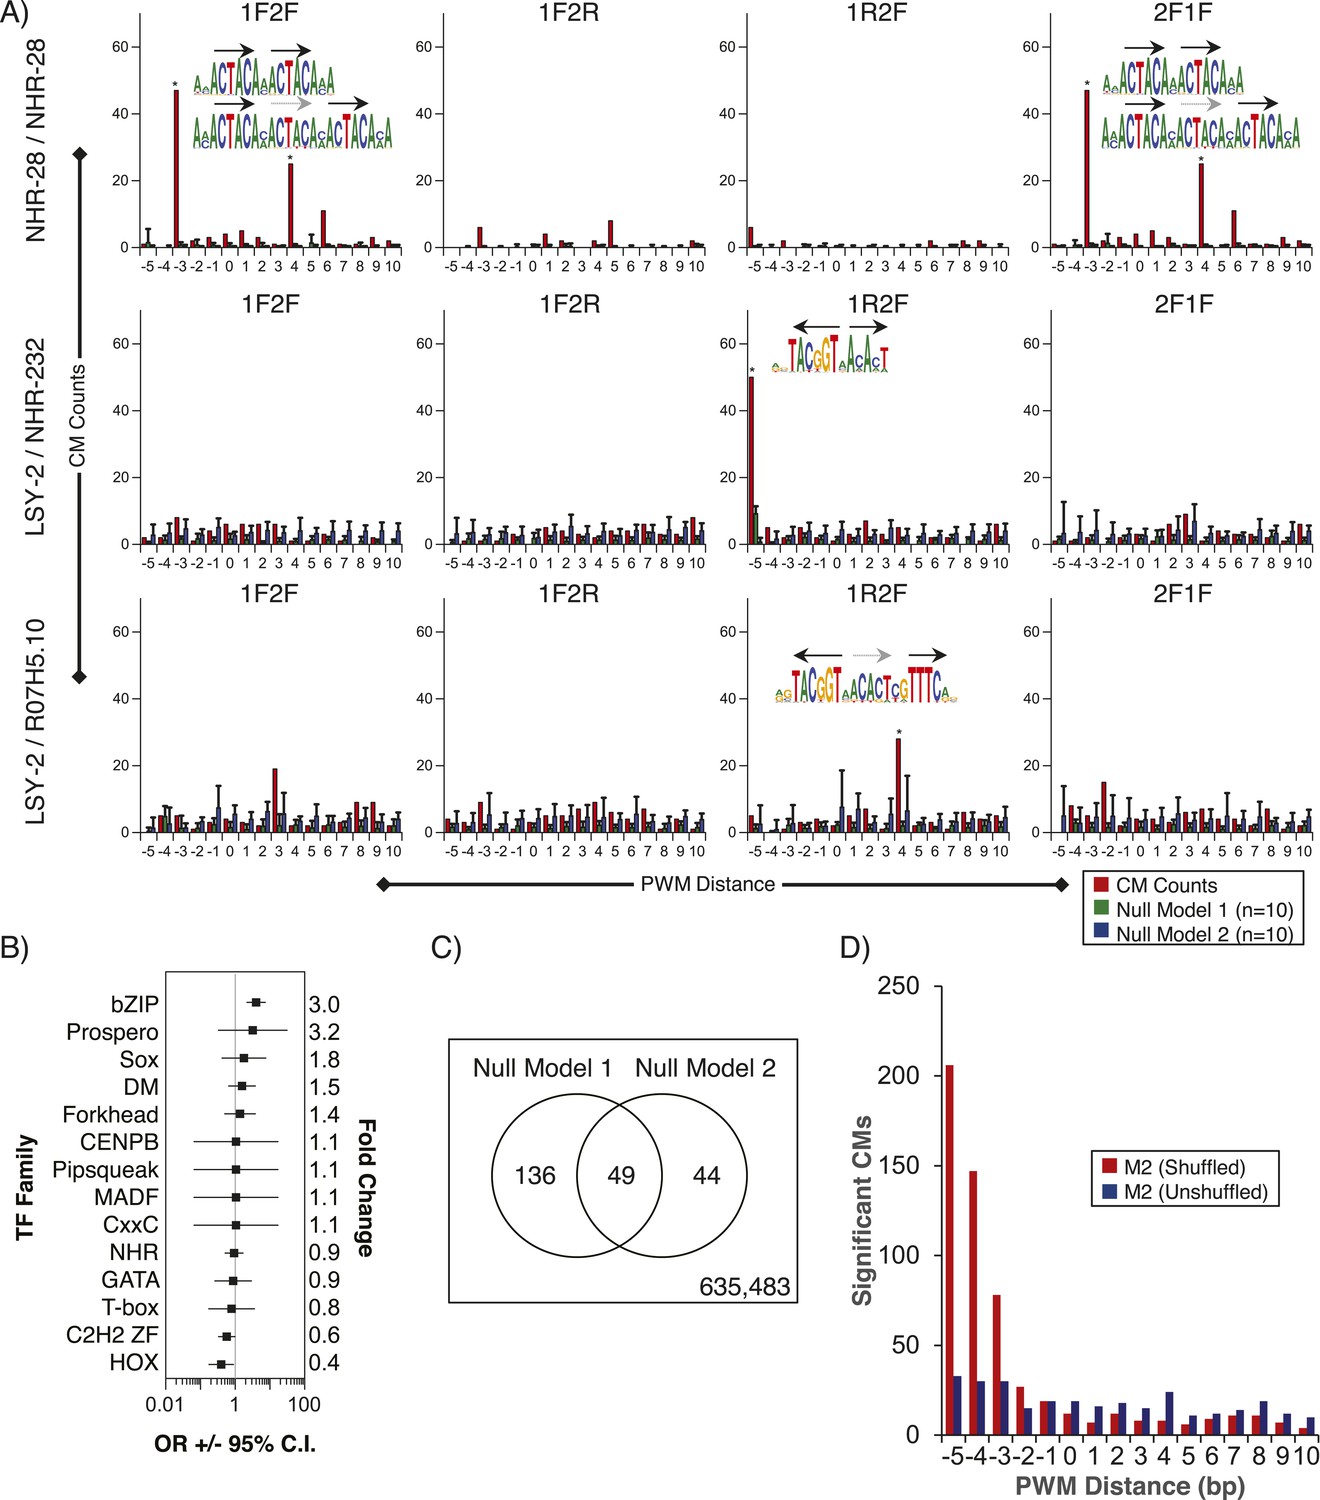
Composite motifs enriched in C. elegans ChIP-seq peaks.
(A) Stereospecificity plots showing enriched CM configurations for pairs of TF motifs. The identical ‘1F2F’ and ‘2F1F’ results in A (top row) demonstrate homodimer and homotrimer CMs, while those involving LSY-2, NHR-232, and R07H5.10 demonstrate heterodimer and heterotrimer CMs (middle and bottom rows, respectively). Black arrows represent orientation of the motif within CMs, while gray dashed arrows designate shadow motifs within trimeric CMs. Error bars are ± S.D., *corrected p < 0.05. (B) Forest plot of odds ratios for TF family enrichment in CMs vs input TF list. (C) Venn diagram showing overlap of significant CMs identified by null model 1 (dinucleotide shuffled sequence) and null model 2 (motif shuffling). (D) Number of significant CMs identified relative to dinucleotide scrambled sequences using shuffled and non-shuffled non-ChIPed motifs, as a function of motif pair distance.
-
Figure 8—source data 1
Table displaying enrichment statistics, spacing and orientations between PWMs for CMs identified in modENCODE ChIP-seq data.
- https://doi.org/10.7554/eLife.06967.024
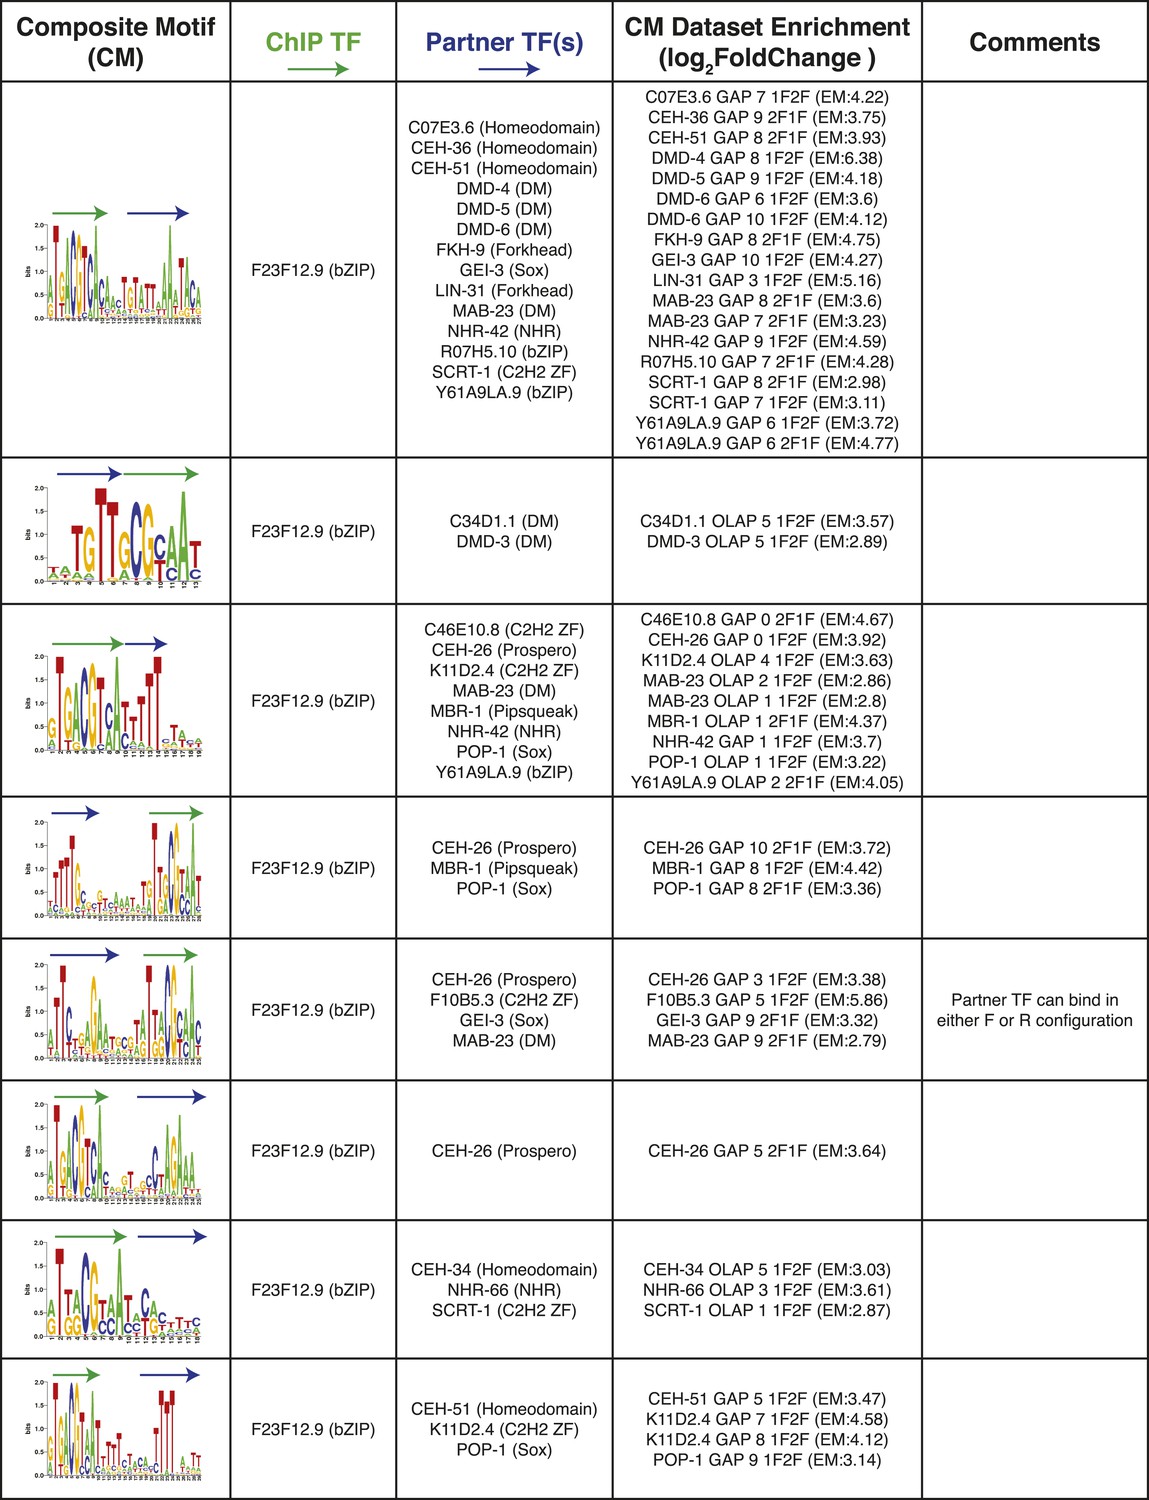
Figure 8—figure supplement 1
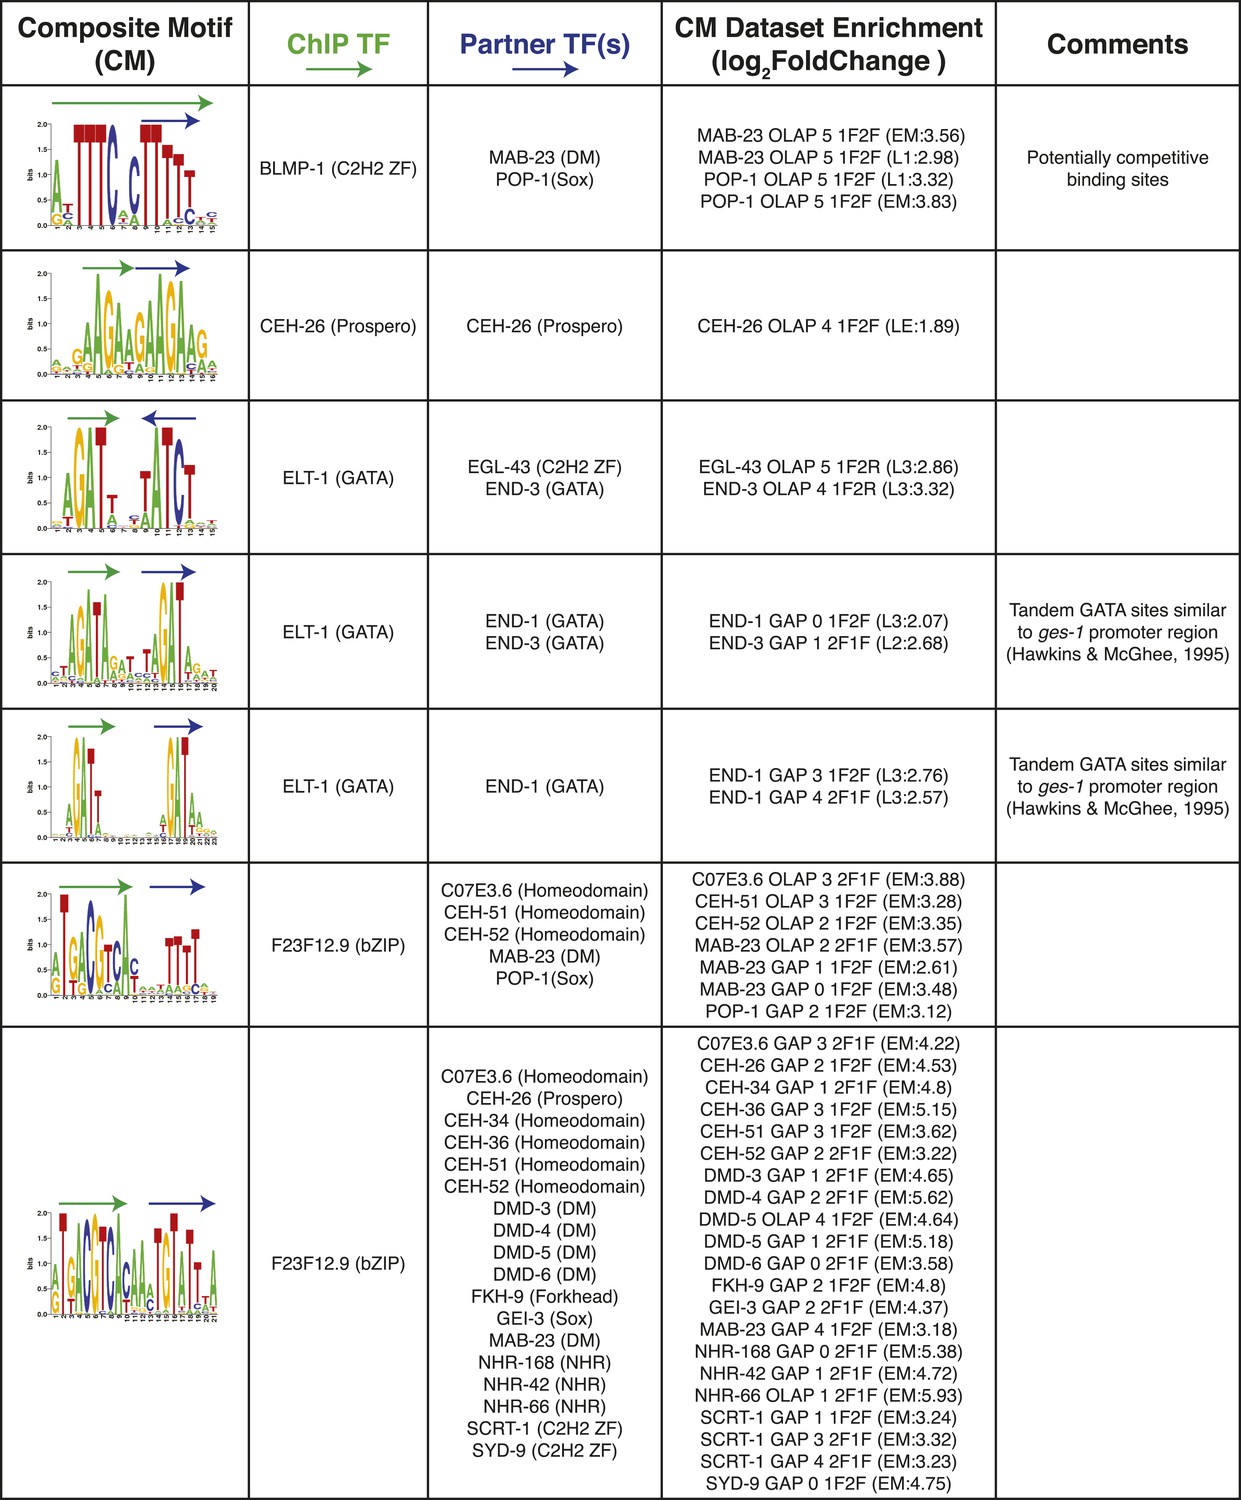
Summary of clustered CMs enriched in C. elegans ChIP-seq peaks.
CM-cluster centroids are shown for the enriched motifs. For each cluster, the ChIPed TF(s) and potential partner TF(s) are listed along with information about motif overlap (OLAP), spacing (GAP), and enrichment. Colored arrows over motif indicate high-information content portions of either factor.
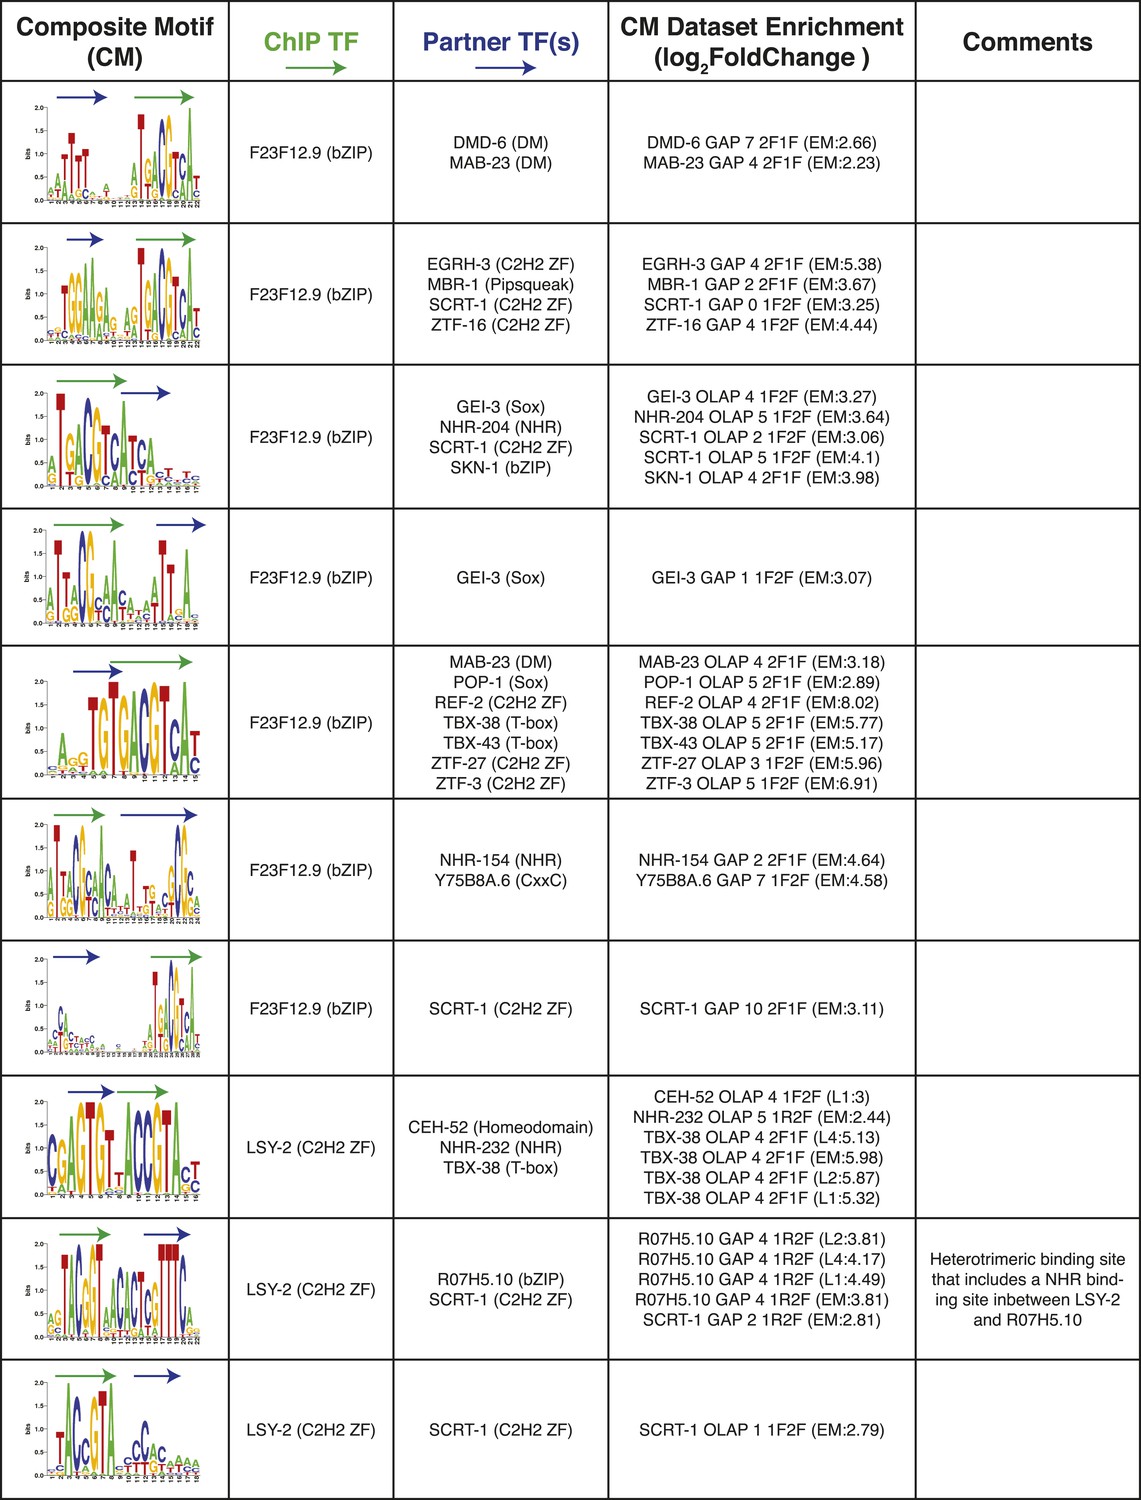
Figure 8—figure supplement 2
Summary of clustered CMs enriched in C. elegans ChIP-seq peaks (continued).
CM-cluster centroids are shown for the enriched motifs. For each cluster, the ChIPed TF(s) and potential partner TF(s) are listed along with information about motif overlap (OLAP), spacing (GAP), and enrichment. Colored arrows over motif indicate high-information content portions of either factor.
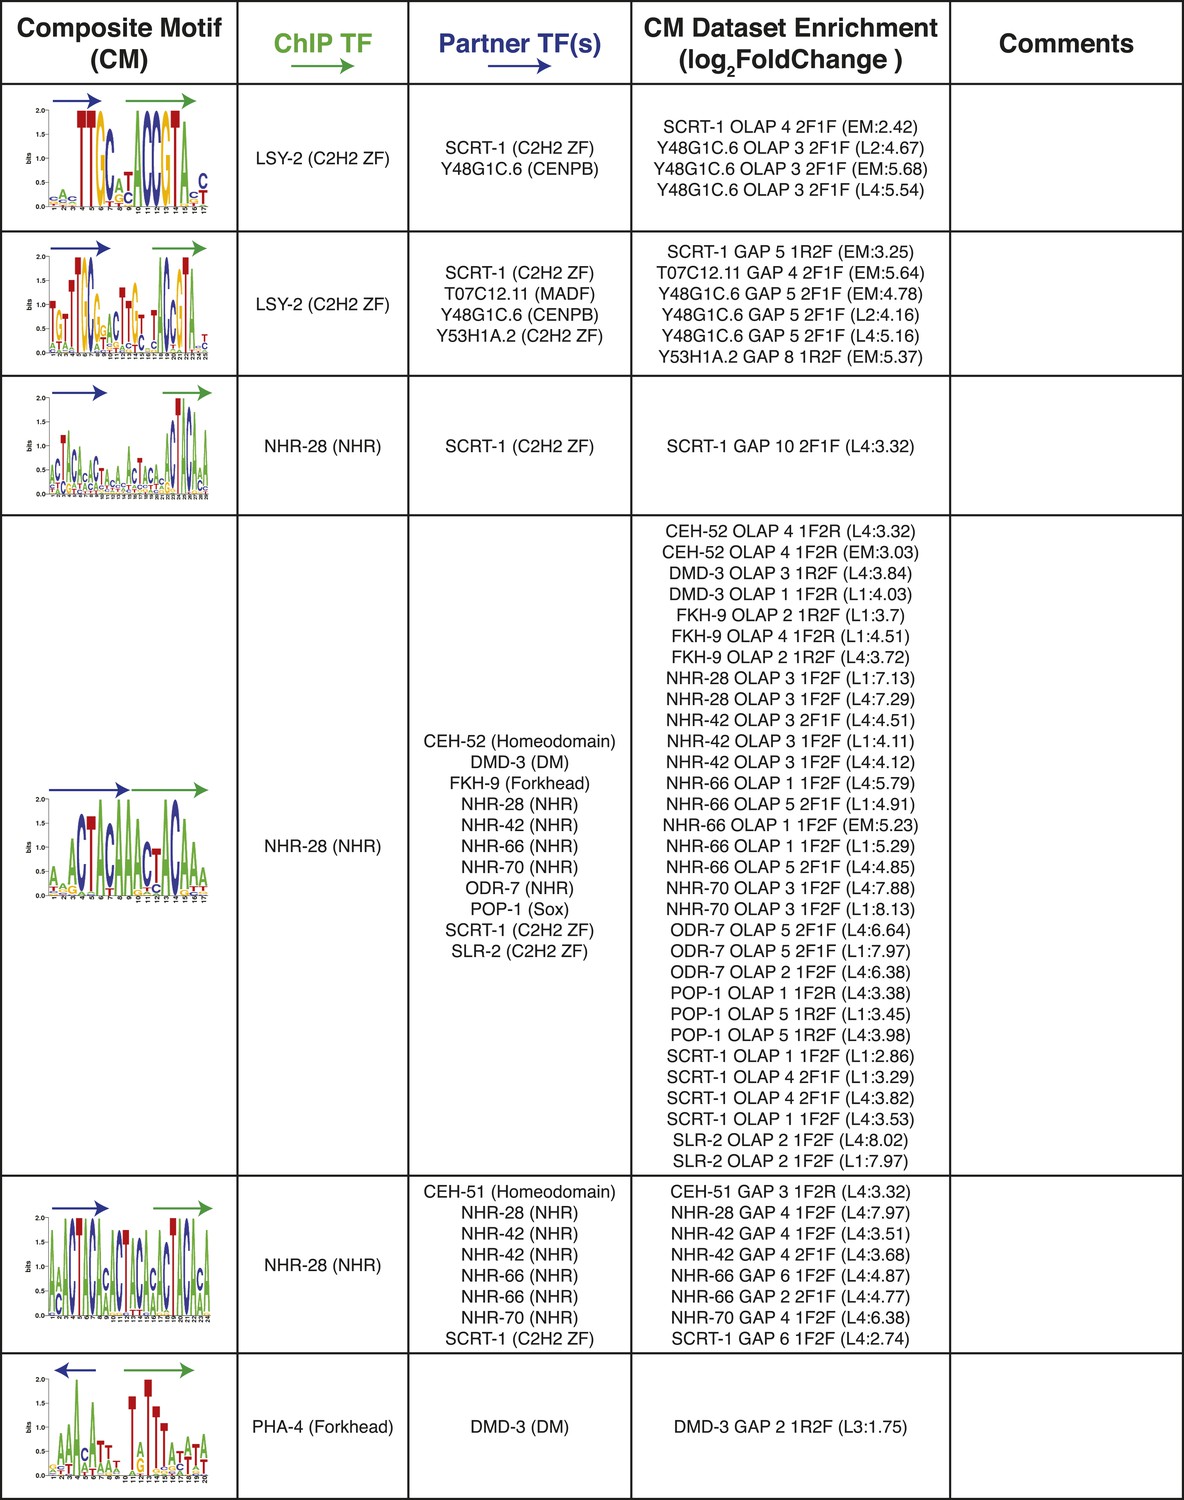
Figure 8—figure supplement 3
Summary of clustered CMs enriched in C. elegans ChIP-seq peaks (continued).
CM-cluster centroids are shown for the enriched motifs. For each cluster, the ChIPed TF(s) and potential partner TF(s) are listed along with information about motif overlap (OLAP), spacing (GAP), and enrichment. Colored arrows over motif indicate high-information content portions of either factor.
Figure 8—figure supplement 4
Summary of clustered CMs enriched in C. elegans ChIP-seq peaks (continued).
CM-cluster centroids are shown for the enriched motifs. For each cluster, the ChIPed TF(s) and potential partner TF(s) are listed along with information about motif overlap (OLAP), spacing (GAP), and enrichment. Colored arrows over motif indicate high-information content portions of either factor.
Figure 8—figure supplement 5
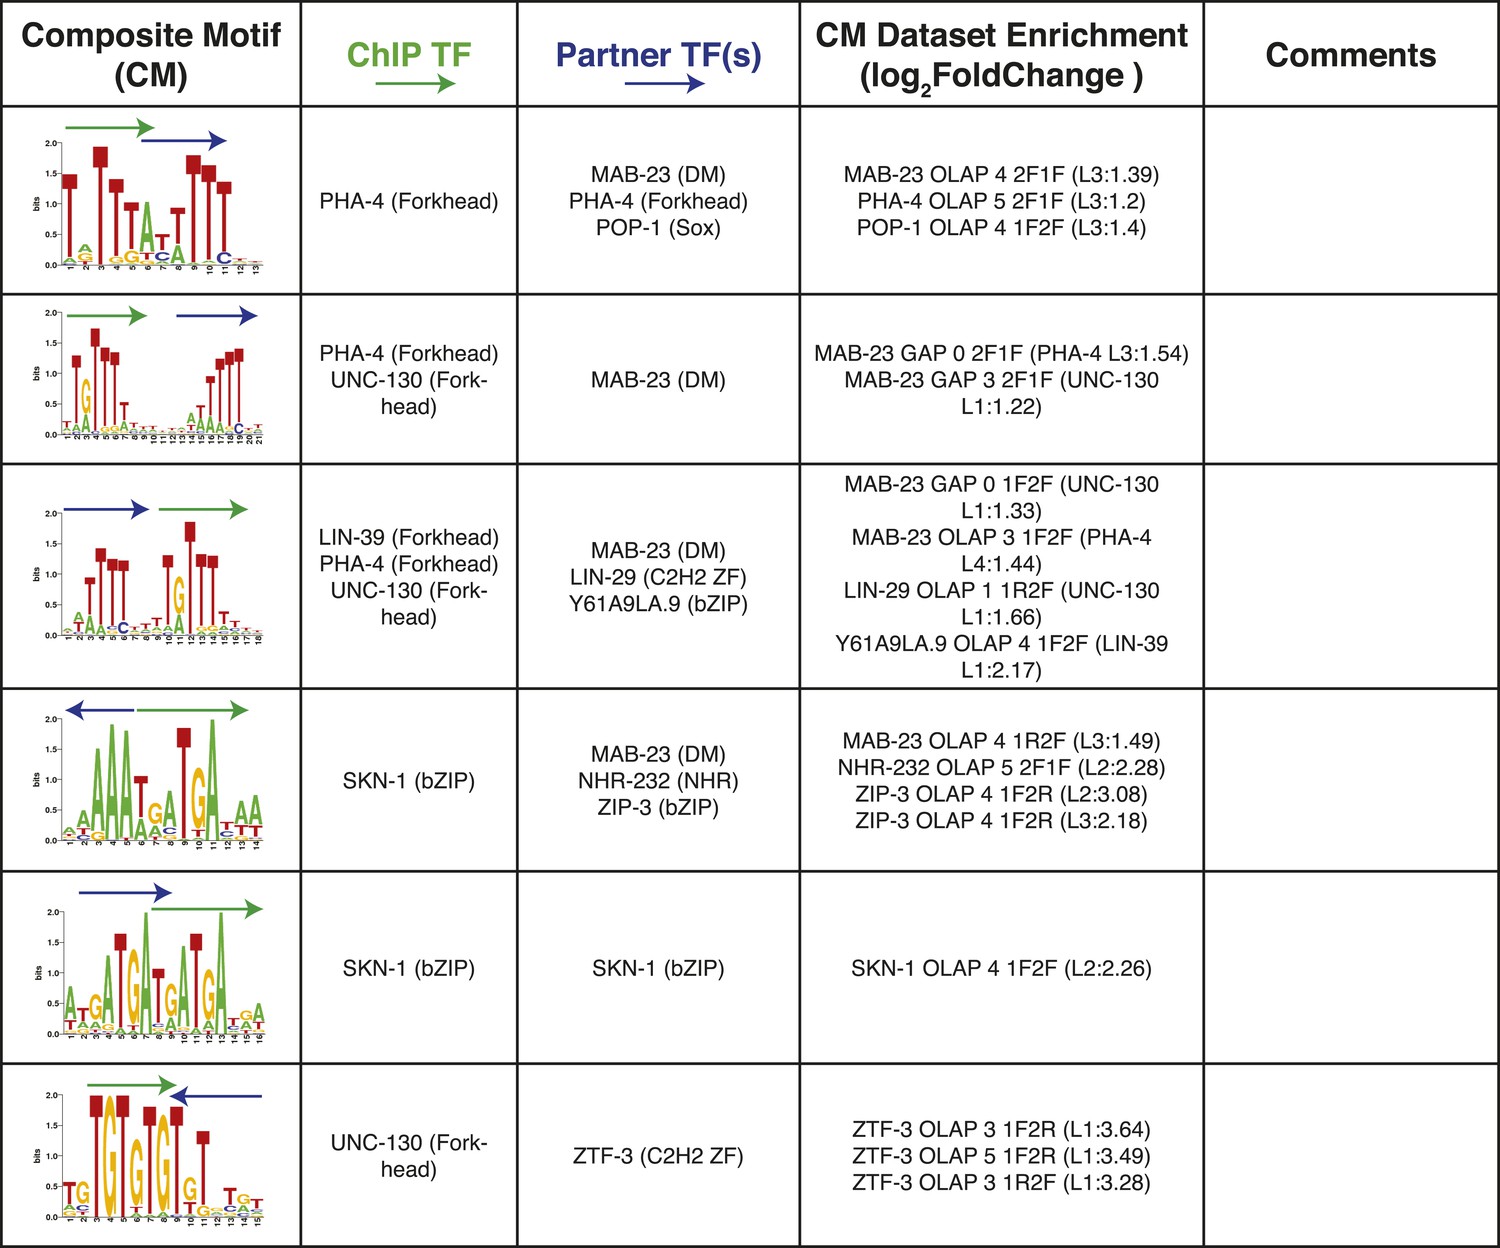
Summary of clustered CMs enriched in C. elegans ChIP-seq peaks (continued).
CM-cluster centroids are shown for the enriched motifs. For each cluster, the ChIPed TF(s) and potential partner TF(s) are listed along with information about motif overlap (OLAP), spacing (GAP), and enrichment. Colored arrows over motif indicate high-information content portions of either factor.
Figure 9
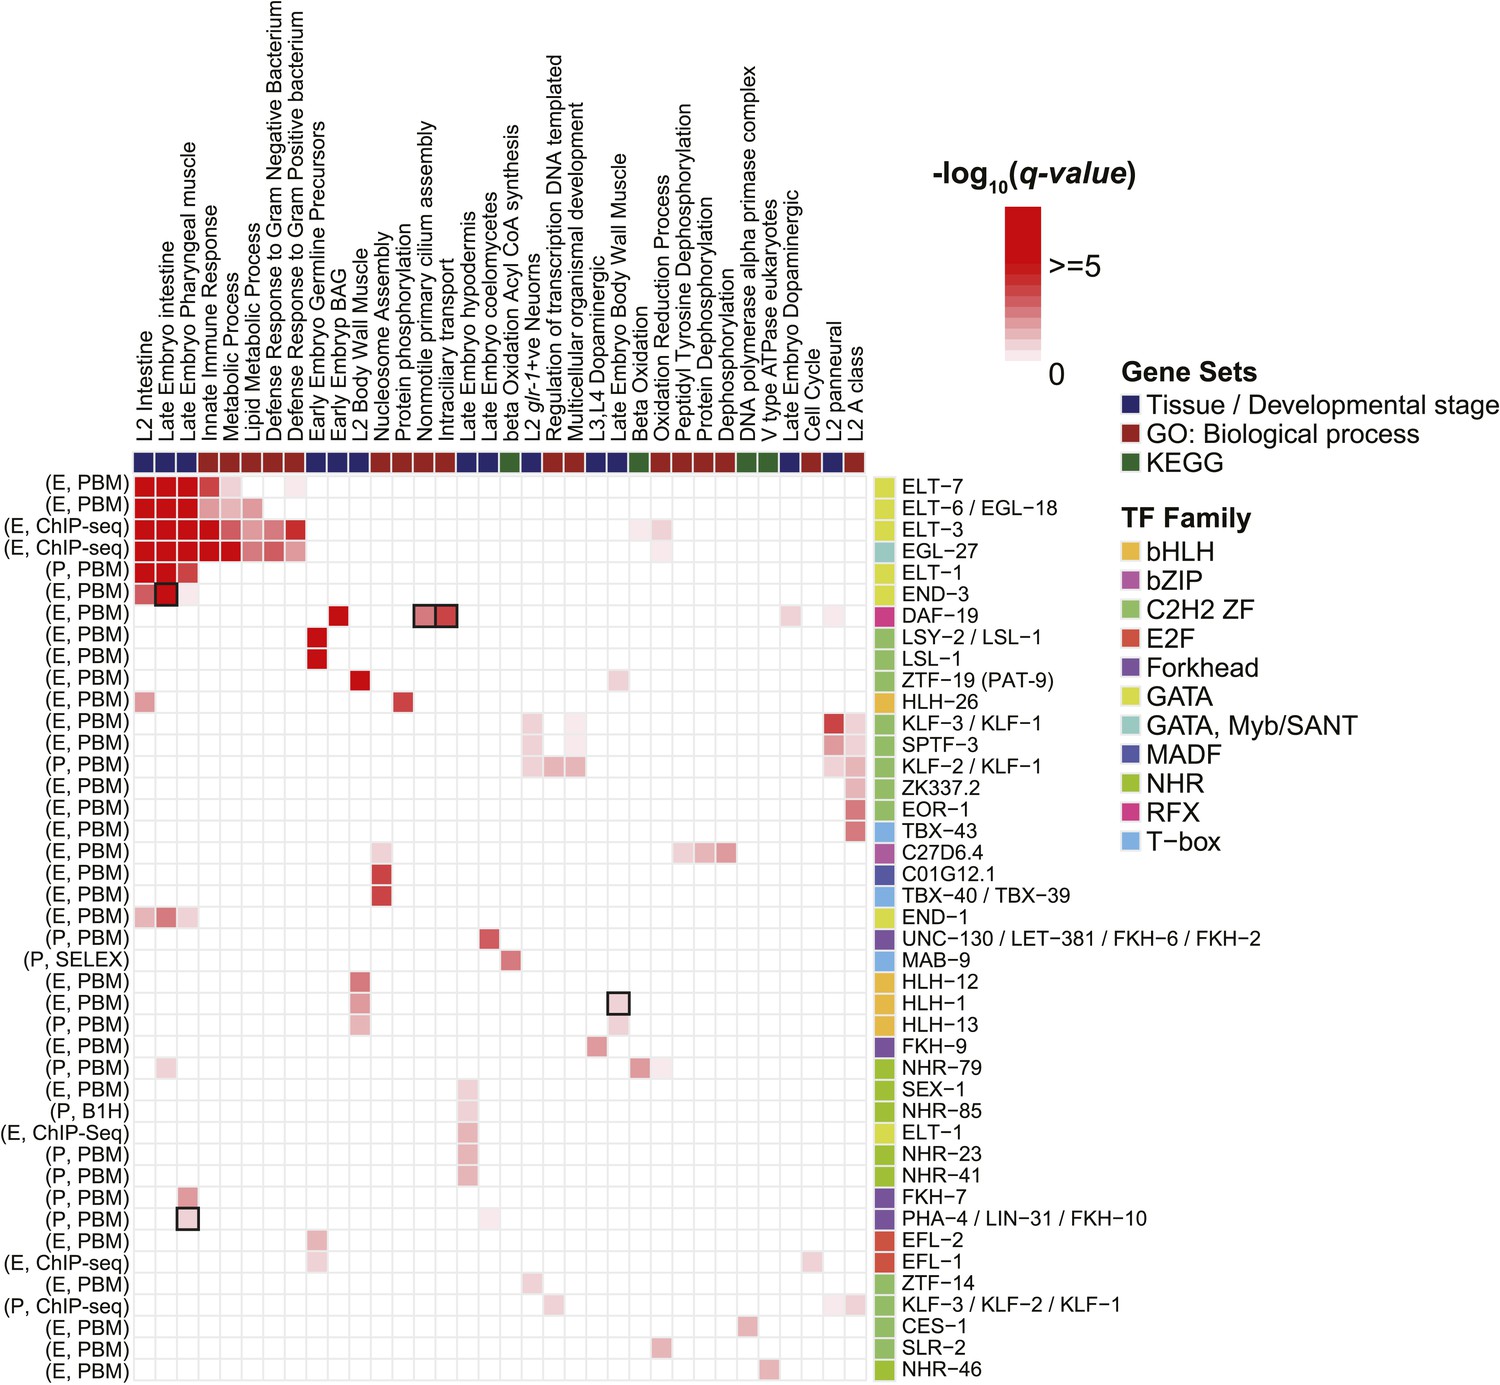
Enrichment of motifs upstream of gene sets.
Each row of the heatmap represents a motif from our curated collection that is enriched (q < 0.05) in at least one gene set category. Known regulatory interactions between TFs and gene sets are highlighted (black outlines). ‘E’ indicates experimentally determined motifs; ‘P’ indicates predicted motifs. Source of motif is also indicated. Enrichment q-values are available in Figure 9—source data 1.
-
Figure 9—source data 1
Table of motif enrichments −log10 (p-values) in the promoters of gene set categories identified from KEGG pathway modules, Gene Ontology processes, and tissue/developmental stage specific expression lists.
- https://doi.org/10.7554/eLife.06967.031
Additional files
-
Supplementary file 1
Comparison of CisBP TF collection with wTF2.0. Includes comments of overlaps and differences between two lists and whether each entry is likely a bona fide TF.
- https://doi.org/10.7554/eLife.06967.032
-
Supplementary file 2
C. elegans curated motif collection. This spreadsheet contains the curated motif IDs for each C. elegans TF along with their source and experimental support.
- https://doi.org/10.7554/eLife.06967.033
-
Supplementary file 3
Number of experiments required for complete coverage of human, fly, and worm TF collections. This spreadsheet contains numbers of experiments needed for each DBD class to have complete coverage of the motif collection based on previously described DBD prediction thresholds.
- https://doi.org/10.7554/eLife.06967.034
-
Supplementary file 4
List of primers and gene synthesis constructs used to obtain TF clones in this study. This spreadsheet contains primers used to clone TFs as well as gene synthesis constructs that were cloned in to the PBM plasmid backbone (Supplementary file 5).
- https://doi.org/10.7554/eLife.06967.035
-
Supplementary file 5
PBM plasmid (pTH6838) backbone map. Information on the expression vector used in PBM experiments.
- https://doi.org/10.7554/eLife.06967.036
Download links
A two-part list of links to download the article, or parts of the article, in various formats.
Downloads (link to download the article as PDF)
Open citations (links to open the citations from this article in various online reference manager services)
Cite this article (links to download the citations from this article in formats compatible with various reference manager tools)
Mapping and analysis of Caenorhabditis elegans transcription factor sequence specificities
eLife 4:e06967.
https://doi.org/10.7554/eLife.06967


