Antigen presentation kinetics control T cell/dendritic cell interactions and follicular helper T cell generation in vivo
- University of Glasgow, United Kingdom
- University of Zurich, Switzerland
Figures
Figure 1
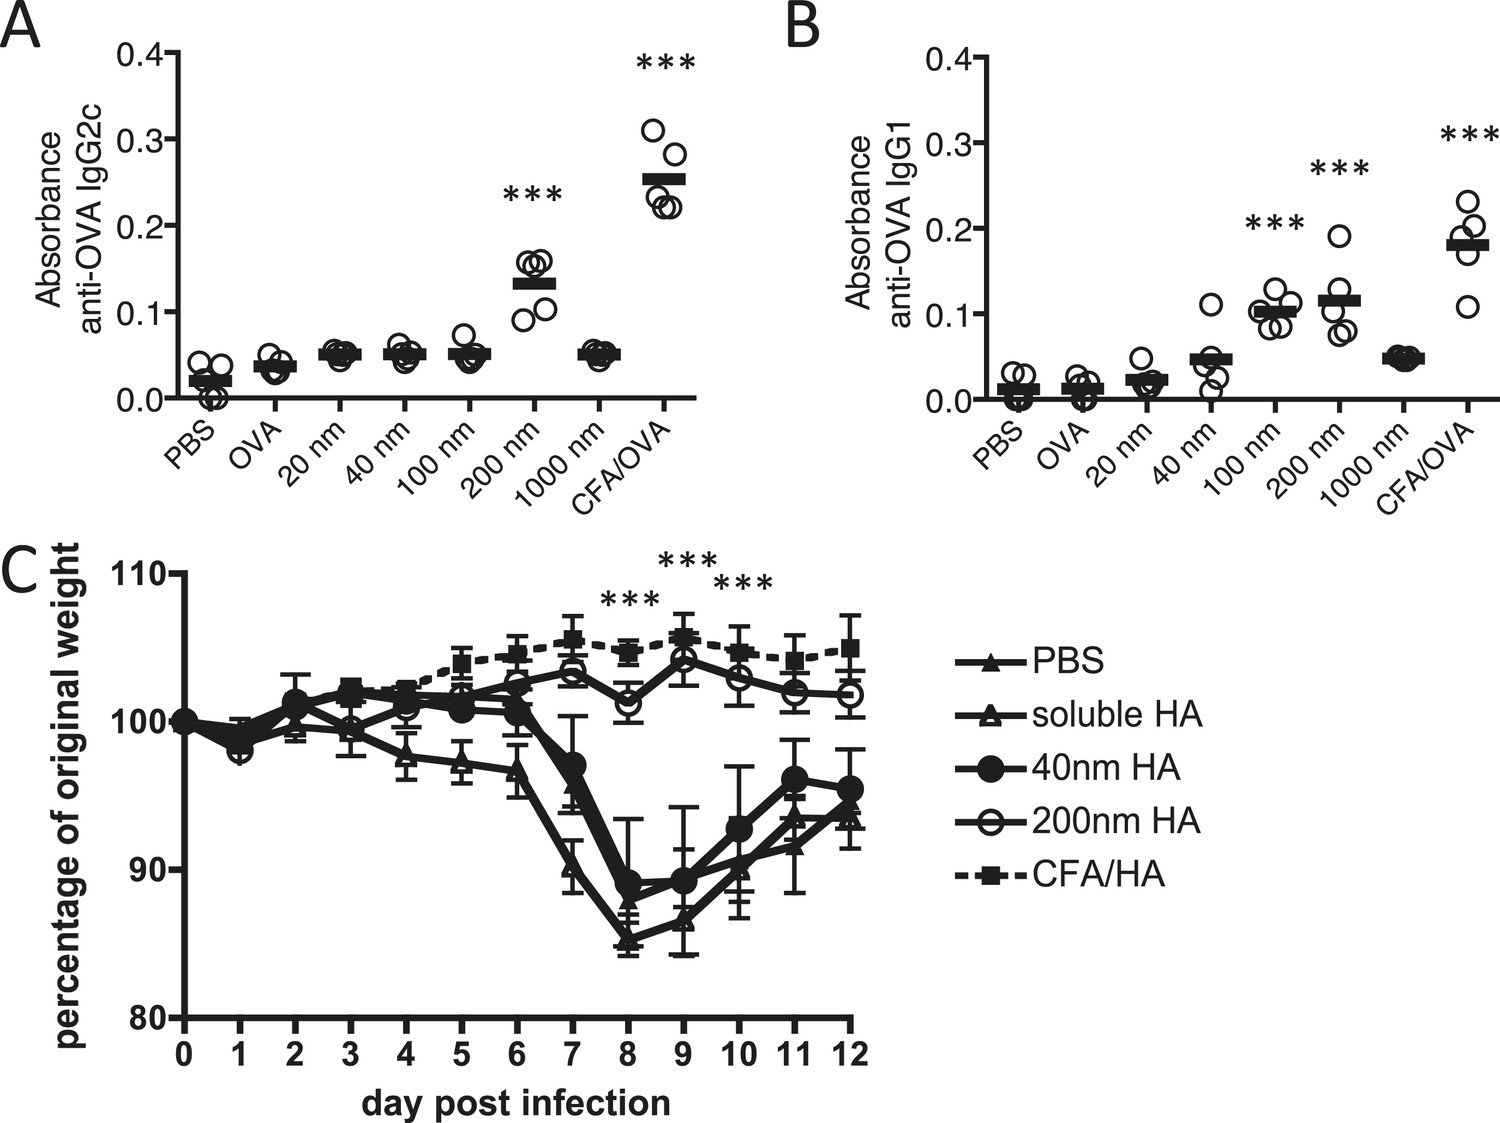
Immunisation with antigen loaded 200 nm particles induces elevated IgG and can provide protective immunity to influenza virus infection.
Mice were immunised s.c. in the scruff with 100 μg of ovalbumin (OVA) alone or conjugated to 20 nm, 40 nm, 100 nm, 200 nm or 1000 nm particles. 14 days later, serum was tested by ELISA for anti-OVA-IgG2c (A) and anti-OVA-IgG1 (B). Data show the mean (−) absorbance (405 nm) at a dilution of 1 in 200 with the five experimental animals per group (′) ***p < 0.001 comparing to the PBS group. To assess functional responses, C57BL/6 mice were immunised s.c. with 50 μg of hemagglutinin (HA) alone, conjugated to 40 or 200 nm particles, or emulsified with complete Freund's adjuvant (CFA). Weight changes were then monitored following intranasal infection with 300 PFU of influenza A virus (WSN) (C). Data shows the mean of five experimental animals per group ± standard deviation ***p < 0.001 comparing 200 nm group to 40 nm group.
Figure 2
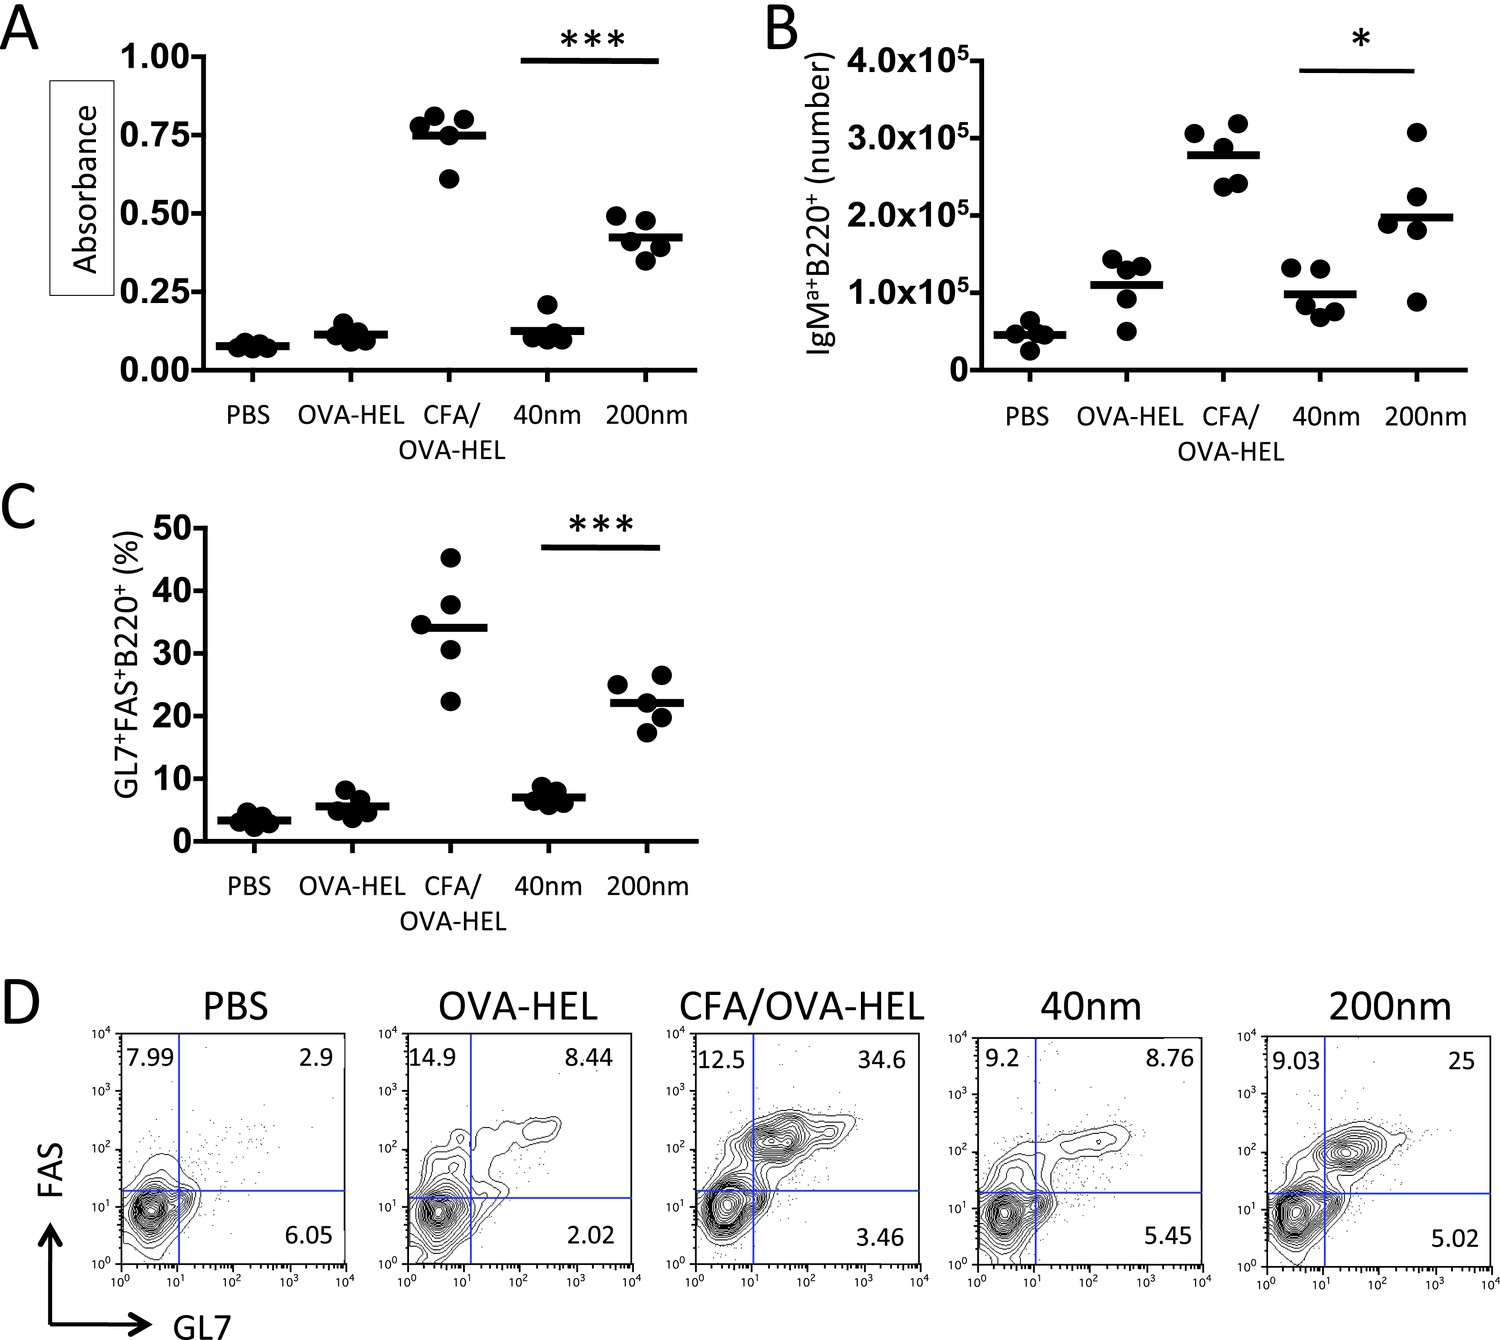
Immunisation with antigen loaded 200 nm particles enhances B cell expansion and germinal centre (GC) B cell responses.
To dissect the cellular responses in detail, MD4 BcR transgenic (Tg) B cells and OT-II TcR Tg T cells and were adoptively transferred into C57BL/6 recipients. Mice were then challenged with OVA-hen egg lysozyme (HEL) conjugated to 40 nm or 200 nm particles. Challenges with PBS, OVA-HEL alone or in CFA were included as negative and positive controls. Day 10 serum samples were assayed by ELISA to determine anti-HEL-IgMa levels (A). Expansion of B220+IgMa+ MD4 B cells in popliteal LNs was assessed by flow cytometry 7 days post challenge (B). Development of GC B cell responses was determined by examining GL7 and FAS expressing by MD4 B220+ cells (C). Representative staining of GC markers GL7 and FAS are also shown (D). Panels show mean value and five individual animals in a representative experiment of 3.
Figure 3
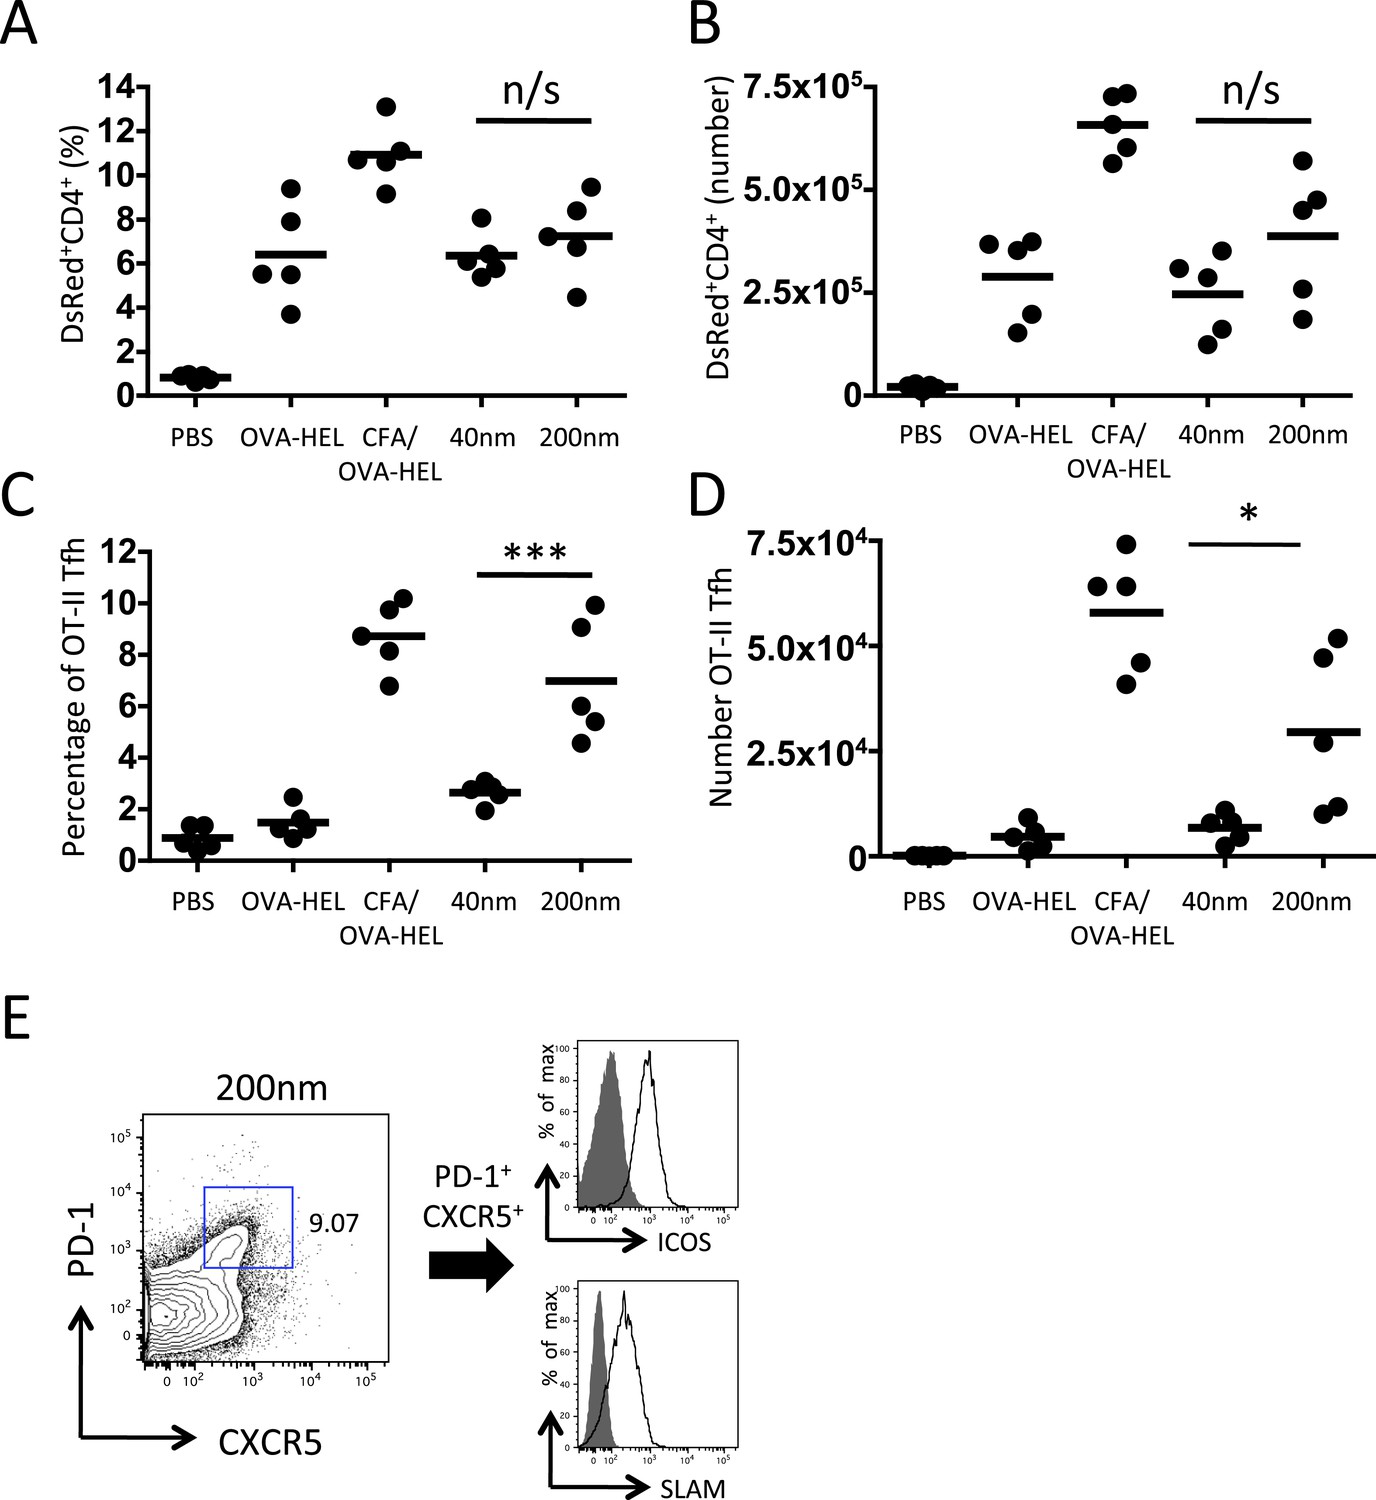
200 nm particles induce T follicular helper (Tfh) differentiation.
MD4 BcR Tg B cells and OT-II TcR Tg T cells and were adoptively transferred into C57BL/6 recipients. Mice were then challenged with OVA-HEL conjugated to 40 nm or 200 nm particles. Challenges with PBS, OVA-HEL alone or in CFA were included as negative and positive controls. CD4+DsRed+ OT-II cell expansion in LNs 5 days post challenge (A, B). These were defined as Tfh cells when being PD-1+ and CXCR5+ (C, D). Cells were also confirmed as being both ICOS+ and SLAM+ (E). Panels show mean value and five individual animals in a representative experiment of 3.
Figure 4
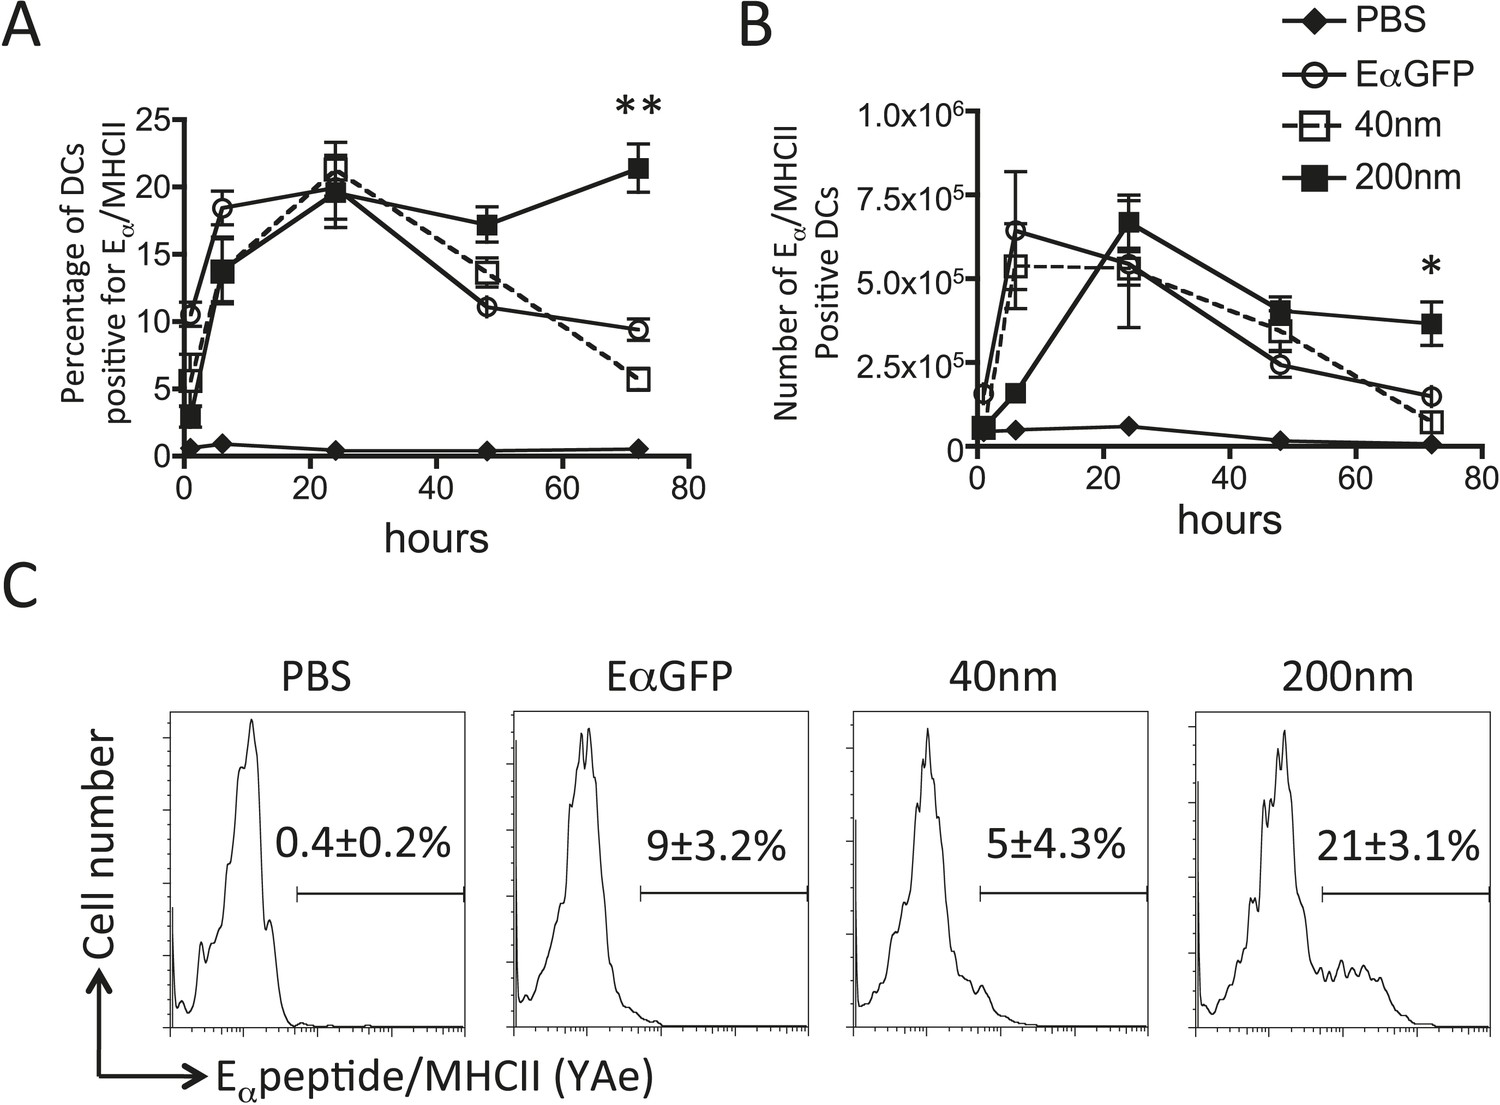
200 nm particulate antigen challenge promotes sustained presentation of peptide/MHCII by dendritic cells (DCs).
C57BL/6 mice were immunized s.c. in the footpad with 100 μg of the model antigen EαGFP alone or covalently conjugated to 40 nm or 200 nm particles. Challenge with PBS was included as a negative control. The draining popliteal LNs were harvested after 1, 6, 24, 48 and 72 hr post challenge. Flow cytometry was used to determine levels of presentation of the Eαpeptide/MHC class II complex using the monoclonal antibody YAe on CD11c+B220− conventional DCs. The percentage and number of conventional DCs cells staining YAe+ is shown in (A) and (B) respectively. Representative flow cytometry plots are shown for 72 hr post challenge (C). Data shows the mean of three animals per time point ± standard deviation and are representative of ≥2 independent experiments. * 40 nm vs 200 nm p = 0.012.
Figure 5
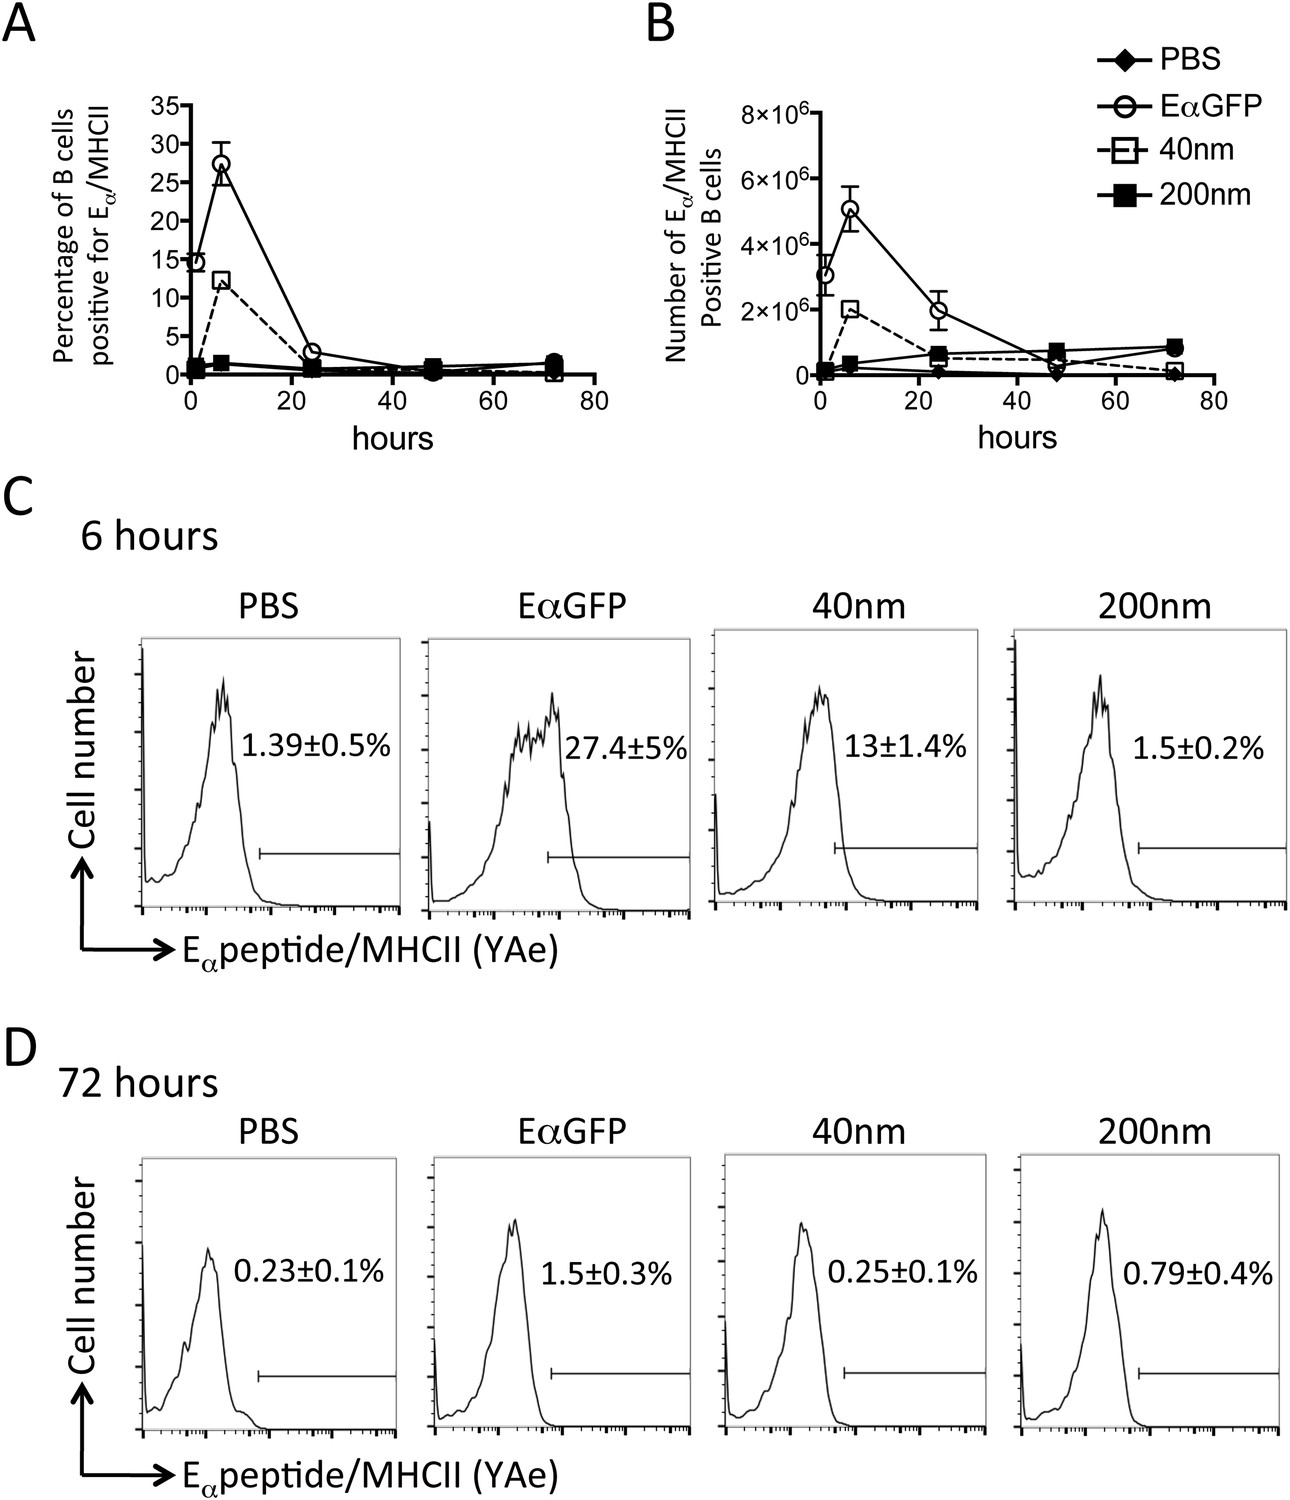
Peptide/MHCII presentation by B cells.
C57BL/6 mice were immunized s.c. in the footpad with 100 μg of the model antigen EαGFP alone or covalently conjugated to 40 nm or 200 nm particles. Challenge with PBS was included as a negative control. The draining popliteal LNs were harvested after 1, 6, 24, 48 and 72 hr post challenge. Flow cytometry was used to determine levels of presentation of the Eαpeptide/MHC class II complex using the monoclonal antibody YAe on B220+CD11c− B cells. The percentage and number of conventional DCs cells staining YAe+ is shown in (A) and (B) respectively. Representative flow cytometry plots are shown for 6 and 72 hr post challenge (C, D respectively). Data shows the mean of three animals per time point ± standard deviation and are representative of ≥2 independent experiments.
Figure 6
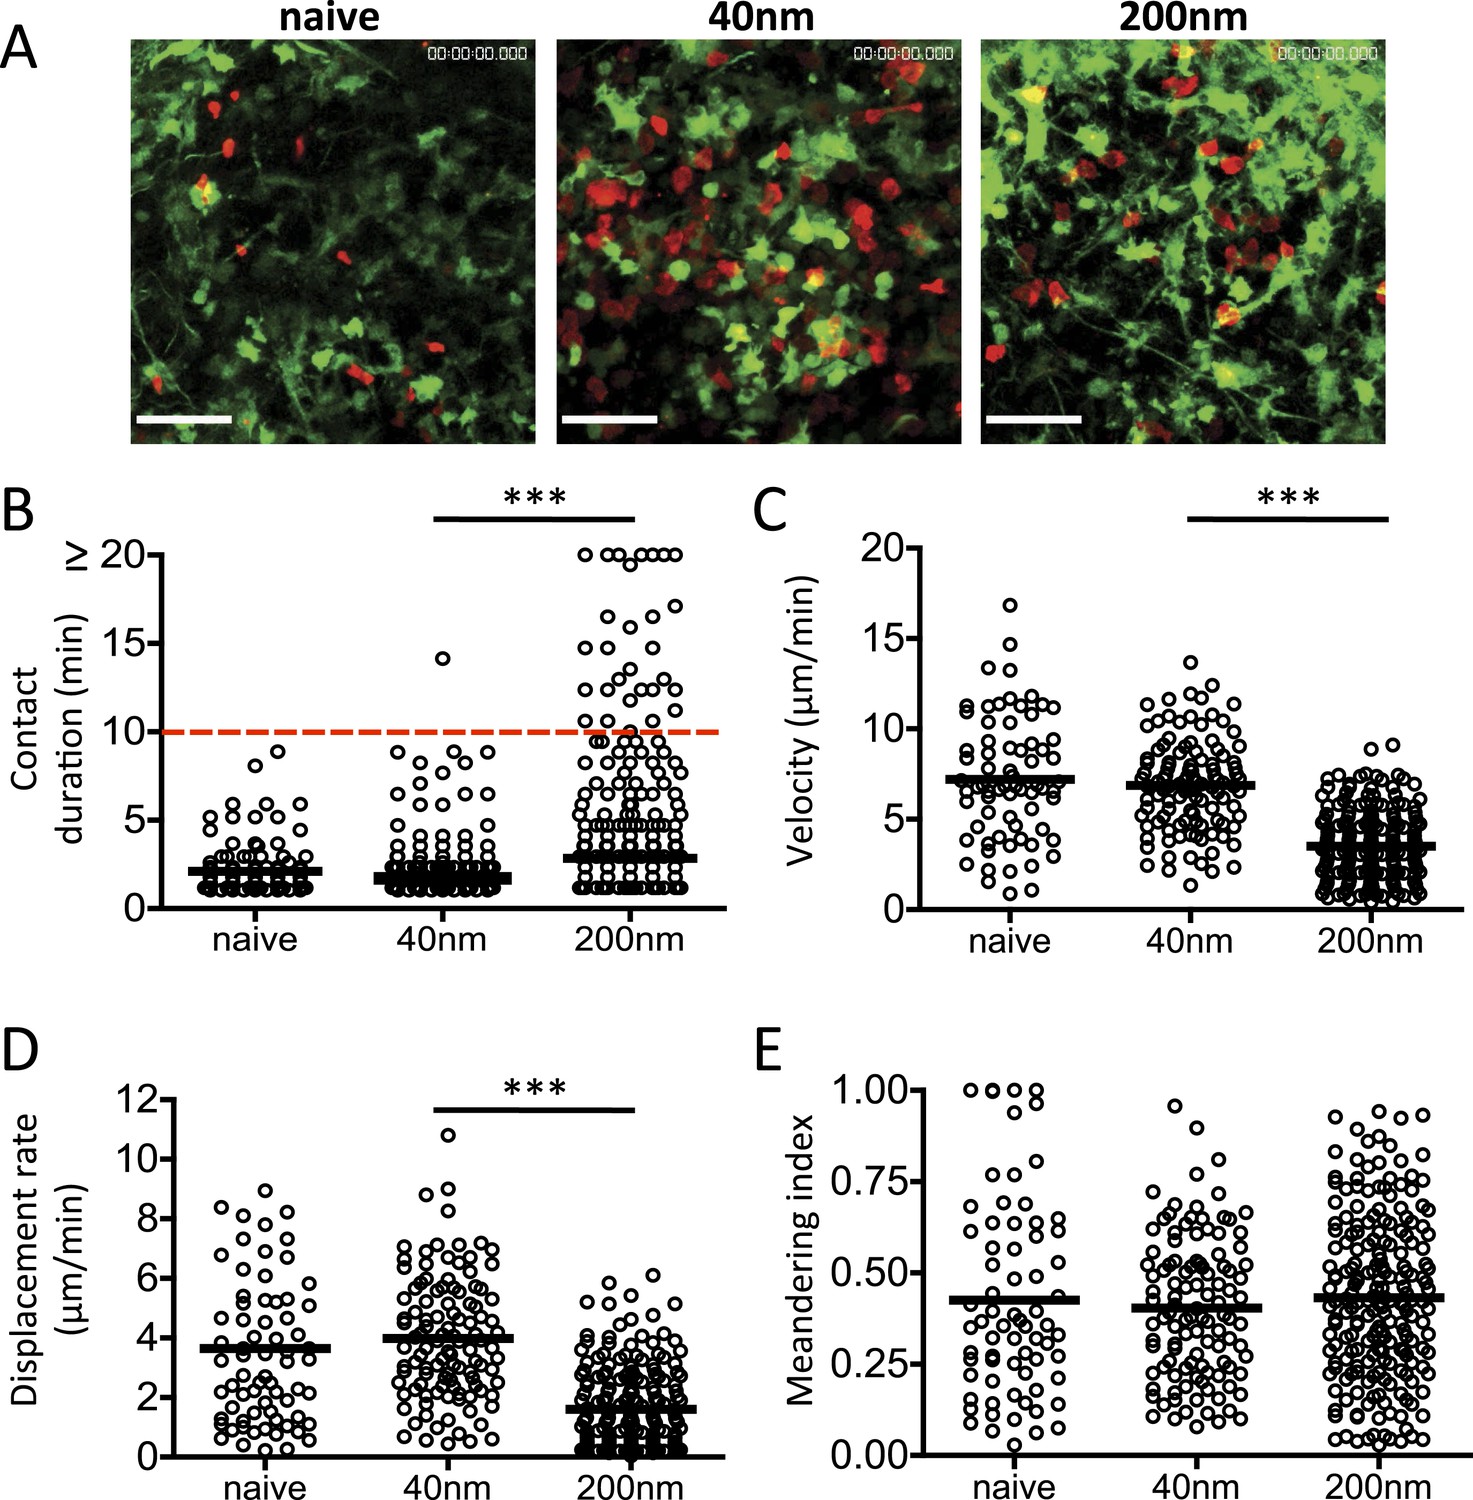
DC and T cell interactions persist after challenge with 200 nm particulate antigen.
DsRed OT-II T cells were adoptively transferred into CD11cYFP recipients and footpad challenged with 100 µg of OVA alone, conjugated to 40 nm or 200 nm particles. Popliteal LNs were imaged at 72 hr. Representative images following challenge (A) correspond with Video 1 video file. The duration of OT-II T cell interaction with DCs was determined as intersection of DsRed and YFP signals (B). The velocity (C), displacement rate (D) and meandering index (E) for T cells were calculated. Data is representative of ≥3 individual animals and shows pooled tracks with mean values of three separate areas of a lymph node. Scale bars represent 50 μm.
Figure 7
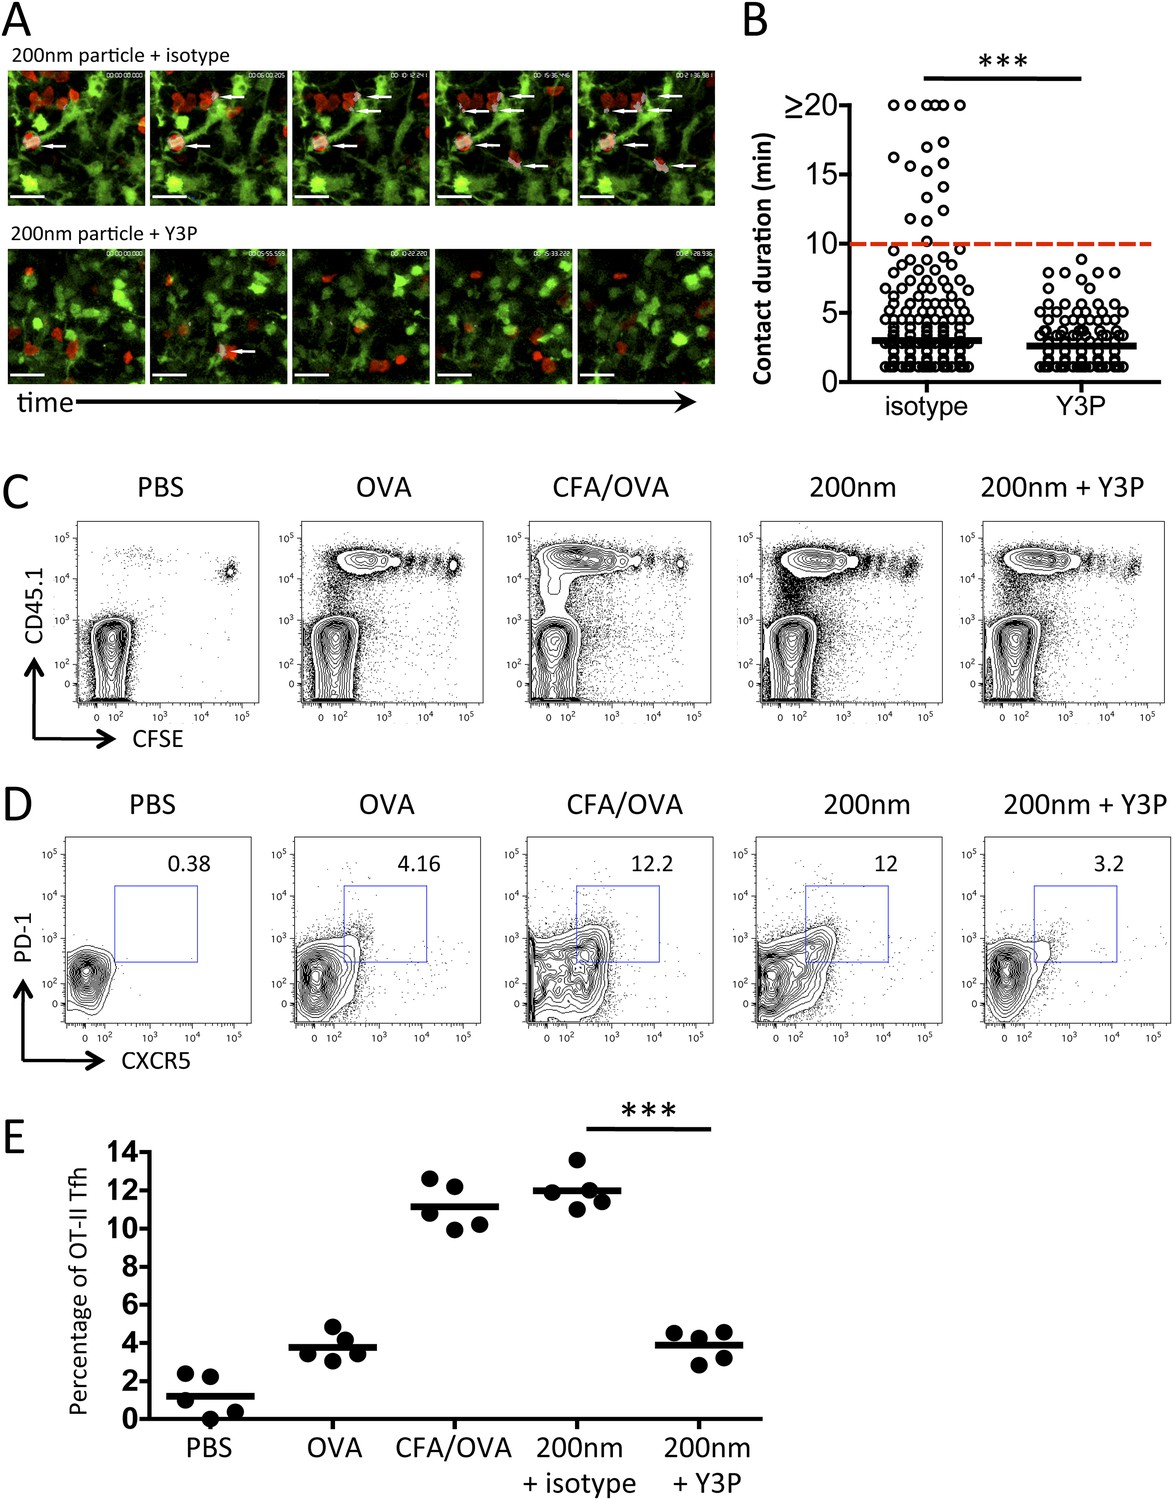
Blockade of stage 3 DC/T cell interactions following 200 nm particulate challenge prevents Tfh differentiation.
Disruption of stage 3 DC/T cell interaction was demonstrated by imaging DsRed OT-II T cells adoptively transferred into CD11cYFP recipients. Mice were footpad challenged with 100 µg of OVA conjugated to 200 nm particles and popliteal LNs imaged at 72 hr. 500 µg isotype (mIgG2a) or Y3P (anti-mouse I-A) was given i.v. 2 hr prior to imaging. Representative video frames show areas of intersection in grey and highlighted by white arrows (A, see Video 2 for video). Scale bars represent 25 μm. The duration of OT-II T cell interaction with DCs was determined as intersection of DsRed and YFP signals (B). Next, CFSE OT-II TcR Tg T cells were adoptively transferred into C57BL/6 recipients. Mice were then challenged with PBS, OVA with CFA or OVA conjugated to 200 nm particles. Mice were treated with a single dose of Y3P or isotype antibody i.v. 72 hr post challenge with particles. Draining LNs were harvested on day 5 post challenge. (C) Representative plots showing CFSE division of CD45.1+ OT-II TcR Tg T cells (gated on CD4+ population). Tfh cells were defined as being PD-1+CXCR5+ (D) and confirmed as ICOS+ (data not shown) for plotting Tfh proportion as a percentage of the OT-II population (E). Data is representative of two independent experiments with five animals per group.
Figure 8
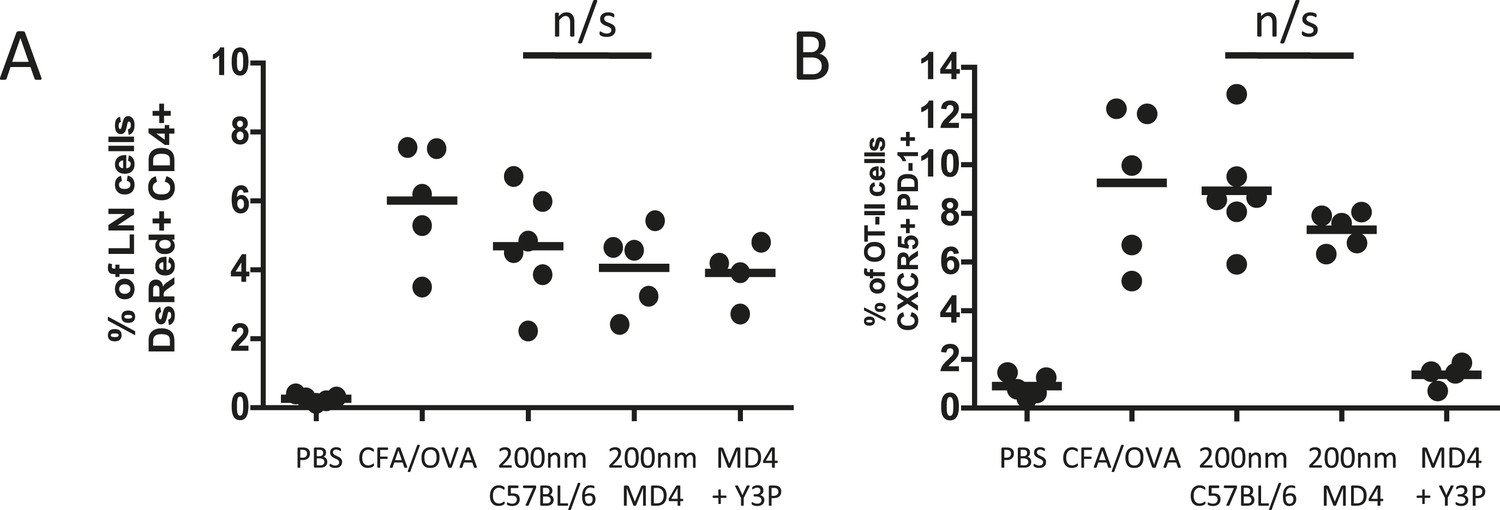
Cognate interactions between B and T cells are not required for early Tfh differentiation.
OT-II TcR Tg T cells and were adoptively transferred into C57BL/6 or intact MD4 BcR Tg recipients. Mice were then challenged with OVA conjugated to 200 nm particles and 500 µg isotype (mIgG2a) or Y3P (anti-mouse I-A) given i.v. 72 hr later. Challenges with PBS, OVA/CFA were included as negative and positive controls. Flow cytometry was used to assess CD4+CD45.1+ OT-II cell expansion in LNs 5 days post challenge (A). Tfh were defined by PD-1 and CXCR5 co-expression (B). Panels show mean value and five individual animals, ***p < 0.001.
Videos
Video 1
Imaging DC and T cell behaviour after challenge with 200 nm particulate antigen.
DsRed OT-II T cells were adoptively transferred into CD11cYFP recipients and footpad challenged with 100 µg of OVA conjugated to 40 nm or 200 nm particles. Popliteal LNs were imaged at 72 hr. 2 hr prior to imaging, 200 nm challenged groups were given 500 μg mIgG2a or Y3P (anti-mouse I-A). Data is representative of ≥3 individual animals and shows one of three separate areas imaged per lymph node. Scale bar represents 50 μm.
Video 2
Disruption of DC and T cell interactions using Y3P.
As for Video 1, DsRed OT-II T cells were adoptively transferred into CD11cYFP recipients and footpad challenged with 100 µg of OVA conjugated to 40 nm or 200 nm particles. Popliteal LNs were imaged at 72 hr. 2 hr prior to imaging, 200 nm challenged groups were given 500 µg mIgG2a or Y3P (anti-mouse I-A). Videos were acquired using a 20×/1.0 NA water-immersion objective lens and 2× zoom. Areas of interaction are shown in grey. Scale bars represent 25 μm.
Tables
Table 1
Comparison of particle conjugates
| Particle size | 40 nm | 200 nm |
|---|---|---|
| Antigen dose/mouse | 100 μg | 100 μg |
| Antigen molecules/mouse | 1.3 × 10¹⁵ | 1.3 × 10¹⁵ |
| Latex dose/mouse | 100 μg | 130 μg |
| Number of particles/mouse | 1.4 × 10¹² | 2.9 × 10¹⁰ |
| Antigen molecules/particle | 1000 | 20,000 |
| Surface area/particle | 5024 nm2 | 125,600 nm2 |
| Antigen density | 1 per 5 nm2 | 1 per 6 nm2 |
-
Data shows an example of a typical carbodiimide-mediated conjugation of ovalbumin to either 40 or 200 nm. Various parameters relating to a typical s.c. immunisation with 100 μg of protein are shown.
Download links
A two-part list of links to download the article, or parts of the article, in various formats.
Downloads (link to download the article as PDF)
Open citations (links to open the citations from this article in various online reference manager services)
Cite this article (links to download the citations from this article in formats compatible with various reference manager tools)
Antigen presentation kinetics control T cell/dendritic cell interactions and follicular helper T cell generation in vivo
eLife 4:e06994.
https://doi.org/10.7554/eLife.06994


