Interplay of cell dynamics and epithelial tension during morphogenesis of the Drosophila pupal wing
- Max Planck Institute of Molecular Cell Biology and Genetics, Germany
- Max Planck Institute for the Physics of Complex Systems, Germany
- Institut de Biologie du Développement de Marseille, France
- The Francis Crick Institute, United Kingdom
Figures
Figure 1
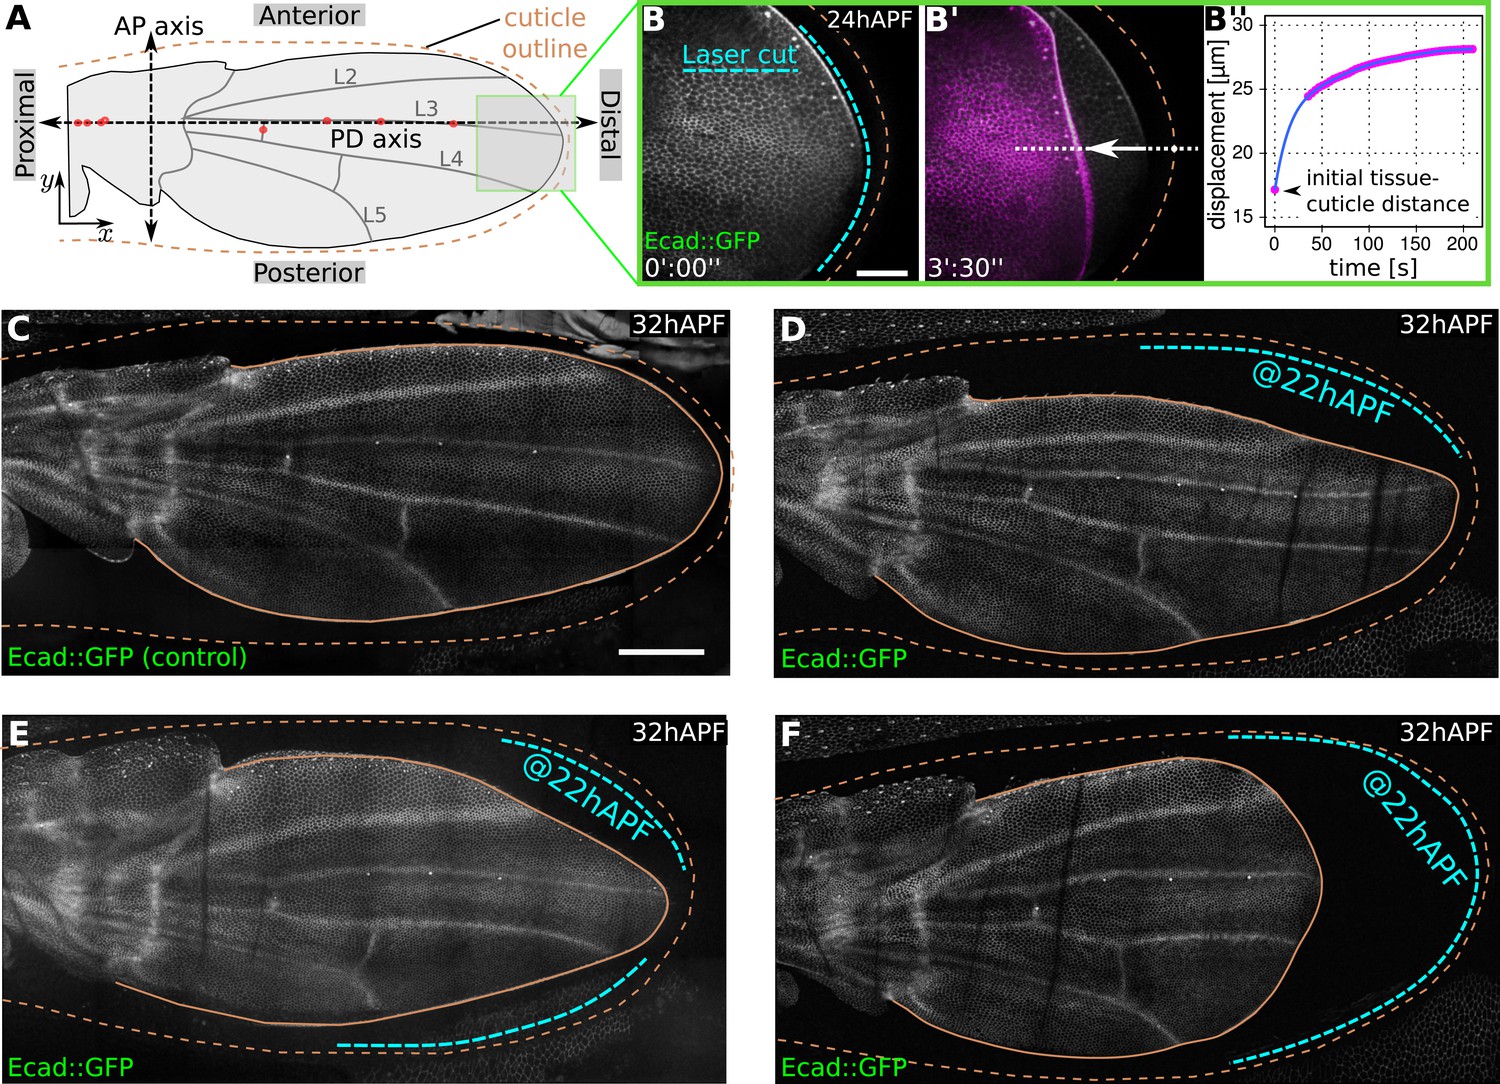
Physical constraints at the margin maintain epithelial tension in the wing.
(A) Cartoon depicting a pupal wing at 32 hAPF. Dashed double-sided arrows depict the proximal-distal (PD) and anterior-posterior (AP) axes. The PD axis is defined by a regression line passing through selected sensory organs (red dots) that are easily identifiable in Ecad::GFP expressing wings. The x axis is defined to correspond to the PD axis pointing distally, and the y axis is defined to correspond to the AP axis pointing anteriorly. L2–L5 indicate longitudinal veins 2–5. Brown dashed line outlines the cuticular sac surrounding the wing epithelium. Scale bar 20 µm. (B, B′) Show the distal end of a wild-type (WT) Ecad::GFP-expressing wing at 24 hAPF (greyscale in B, B′) and the same wing 3.5 min after laser ablation in the space between wing margin and cuticle (magenta in B′). The blue dashed line indicates the site of laser ablation. (B′′) Shows wing margin displacement measured with respect to the cuticle (brown dashed line in B′) along the white dotted line in (B′). Experimental points (magenta) were interpolated by a polynomial (blue line). (C–F) Show 32 hAPF wings that were unperturbed (C) or subjected to laser ablation at 22 hAPF (D–F). Ablation of the connections between the wing margin and the cuticle were performed in different regions, indicated by blue dashed lines in (D–F), and lead to altered wing shapes at 32 hAPF compared to the unperturbed control (C). Scale bar 100 µm.
Figure 2 with 3 supplements
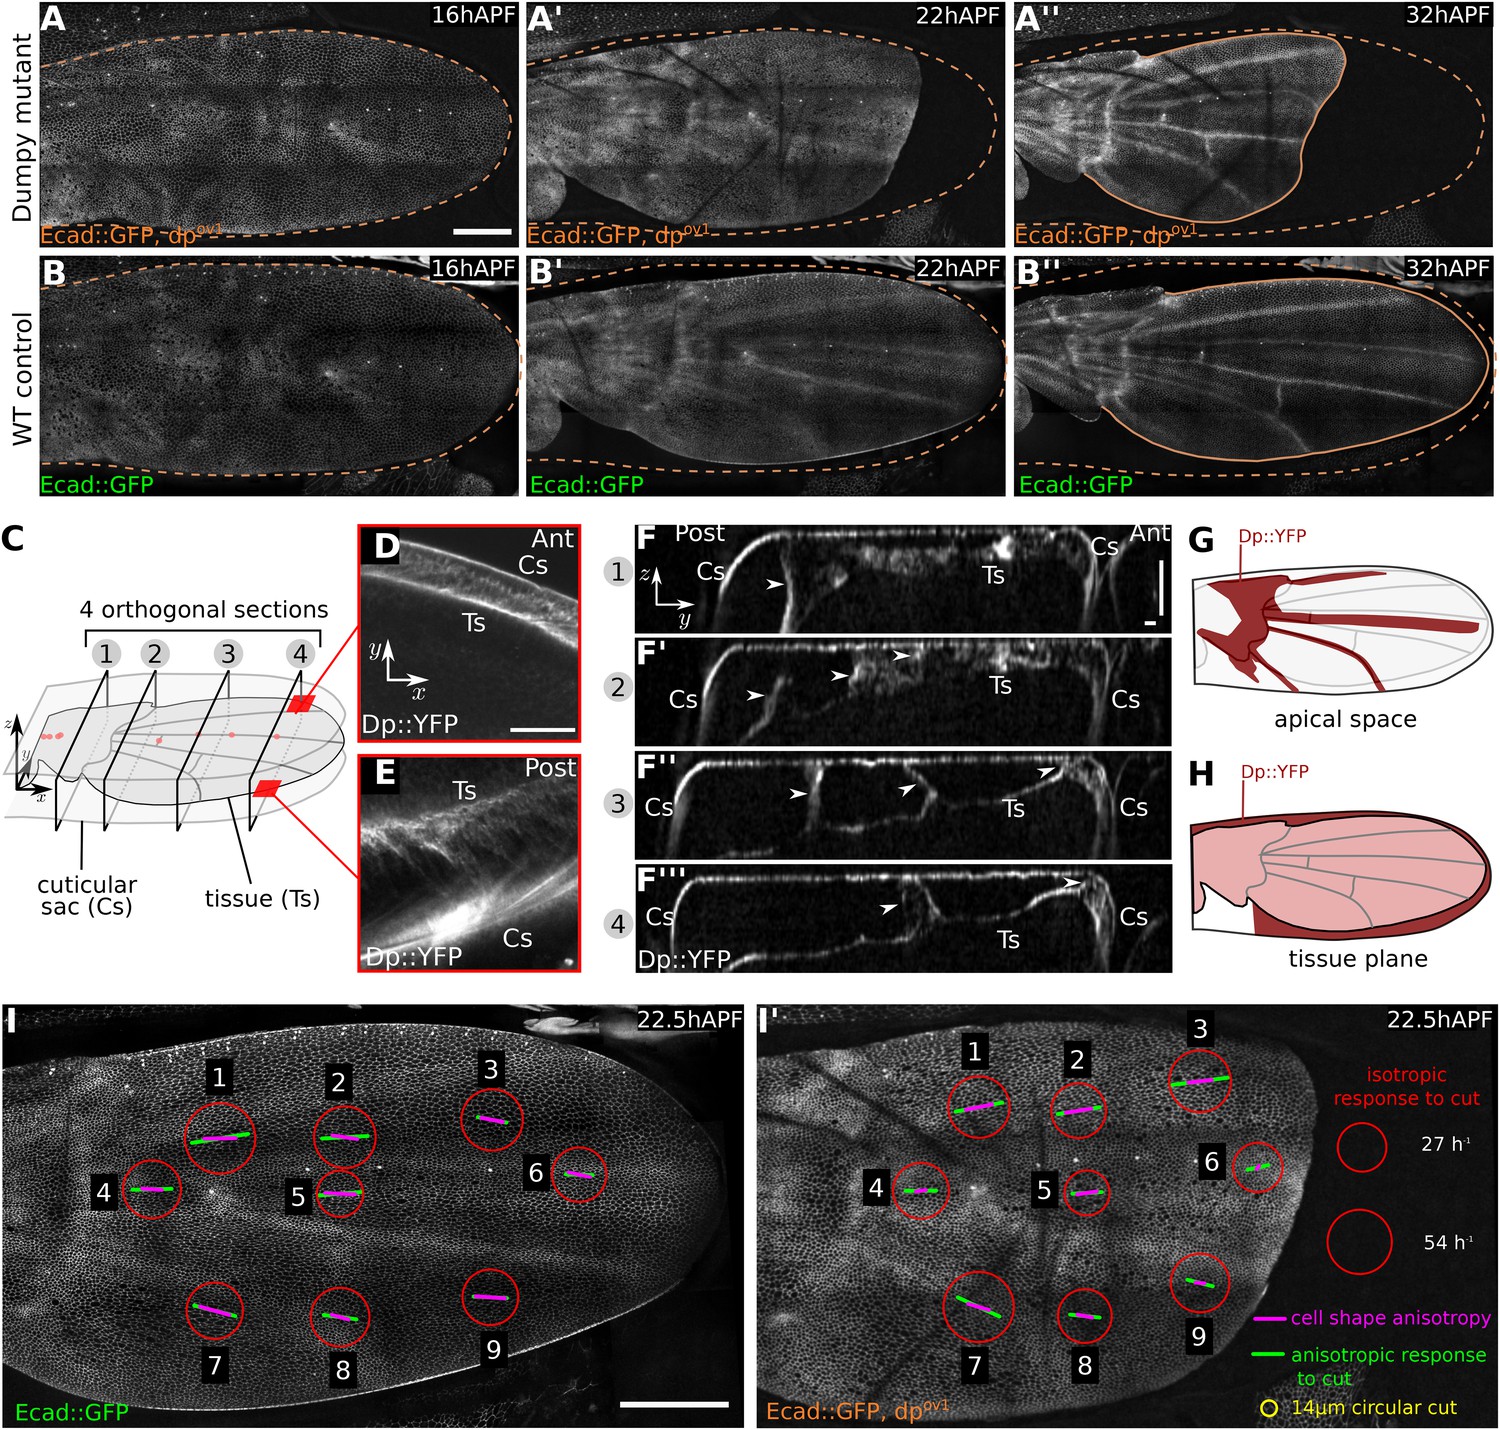
Dumpy-dependent apical attachments of wing tissue to the cuticle act as a counter-force to hinge contraction.
(A–B′′) Show individual frames from a time-lapse video of dumpyov1 mutant and control WT wings expressing Ecad::GFP, and depict wings at 16 hAPF (A, B), 22 hAPF (A′, B′), and 32 hAPF (A′′, B′′). The position of the cuticle is indicated by a brown dashed line. Scale bar 100 µm. (C) Cartoon depicting the pupal wing and surrounding cuticular sac, labeled to indicate the optical sections shown in panels (D–F). (D–F′′′) Show optical sections through a 22 hAPF wing from a pupa harboring a Dumpy::YFP protein trap at the endogenous locus. (D–E) Show sections in the plane of the wing epithelium near the anterior (D) and posterior (E) margins. Dumpy::YFP is present in the space between the wing margin and the cuticle. Scale bar 20 µm. (F–F′′′) Show optical sections orthogonal to the wing epithelium at different proximal-distal positions (indicated in C). Dumpy::YFP connects the dorsal wing surface and the cuticle in specific positions (arrowheads). Scale bars: 20 µm. (G) Summarizes the pattern of Dumpy::YFP connections between the dorsal wing surface and overlying cuticle—these lie over the hinge and vein regions. (H) Shows the pattern of Dumpy::YFP connections between the wing margin and cuticle—these extend around the wing margin except in the posterior/proximal regions. (I–I′) Summarize quantifications of circular laser ablation experiments performed in nine specific regions of five WT and five dumpyov1 mutant wings. The size of the red circles indicates the initial rate of area expansion of the perimeter of the circular cut, which reflects the isotropic tissue stress. Green bars represent the direction and magnitude of the elliptical deformation of the initially circular cut, reflecting the anisotropy of tissue stress (see ‘Materials and methods’, Analysis of circular laser ablations). Magenta bars depict the orientation and magnitude of local cell elongation. Scale bar: 100 µm.
Figure 2—figure supplement 1

Dumpy::YFP cuticle imprint and Dumpy apical connections.
(A) Shows Dumpy::YFP fluorescence in the cuticle (>10 µm away from the apical wing surface) of a 22 hAPF wing (red square indicates enlarged region). Dumpy::YFP highlights imprints of cell boundaries in the cuticle. (B) Shows total Dumpy::YFP present between the dorsal wing surface and the cuticle. Dumpy::YFP signal was manually segmented and colored in green, then overlaid over a 22 hAPF WT Ecad::GFP expressing wing to highlight its position relative to wing veins (see also Video 3). Scale bar: 100 µm.
Figure 2—figure supplement 2
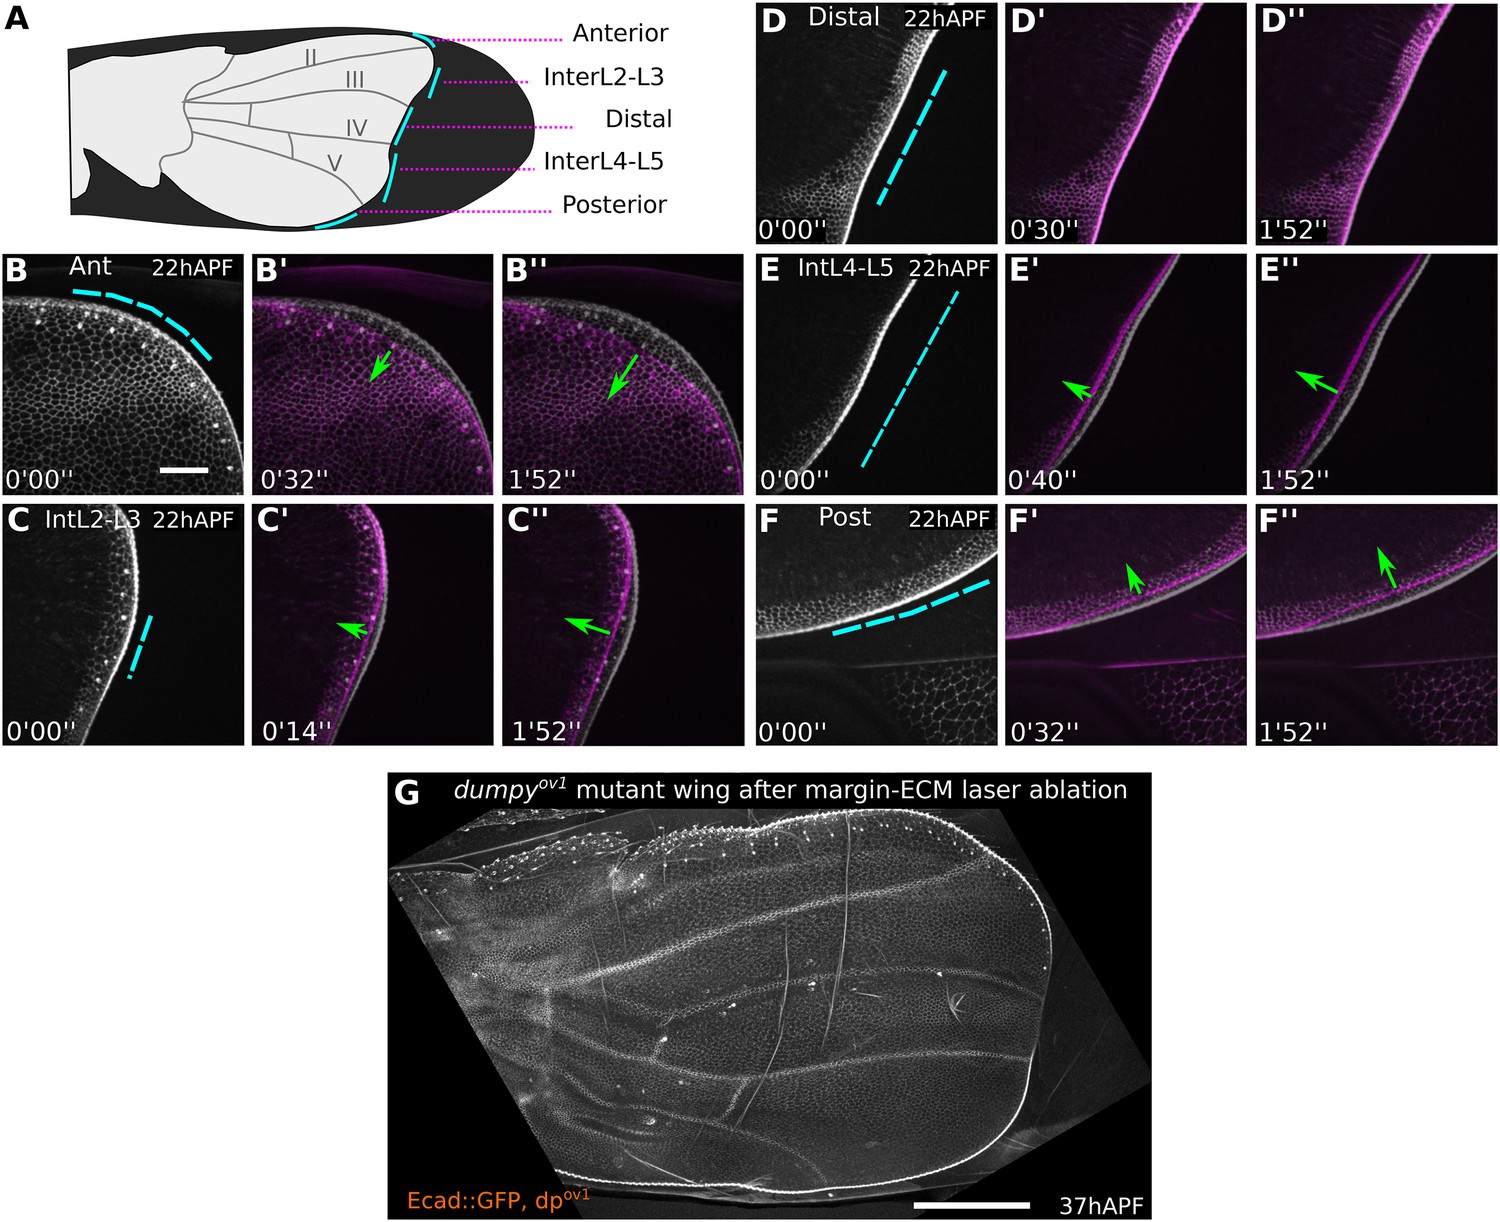
dumpyov1 weakens distal attachments between wing margin and cuticle.
(A) Cartoon of a dumpyov1 mutant wing indicating sites of laser cuts (blue lines) performed in wings shown in (B–F′′). (B–F′′) Show 22 hAPF dumpyov1 mutant wings before (greyscale) and shortly after (magenta) laser severing in different regions between the margin and the cuticle. Blue dashed lines indicate cut site, and green arrows the amount and direction of retraction after the cut. Time after ablation is indicated (minutes, seconds). Tension-bearing connections are present anteriorly and posteriorly, but not distally in dumpyov1. Scale bar 20 µm. (G) dumpyov1 mutant wing at 37 hAPF, 15 hr after ablation of margin-cuticle connections in the whole region comprising panels B–F′′. Scale bar 100 µm.
Figure 2—figure supplement 3
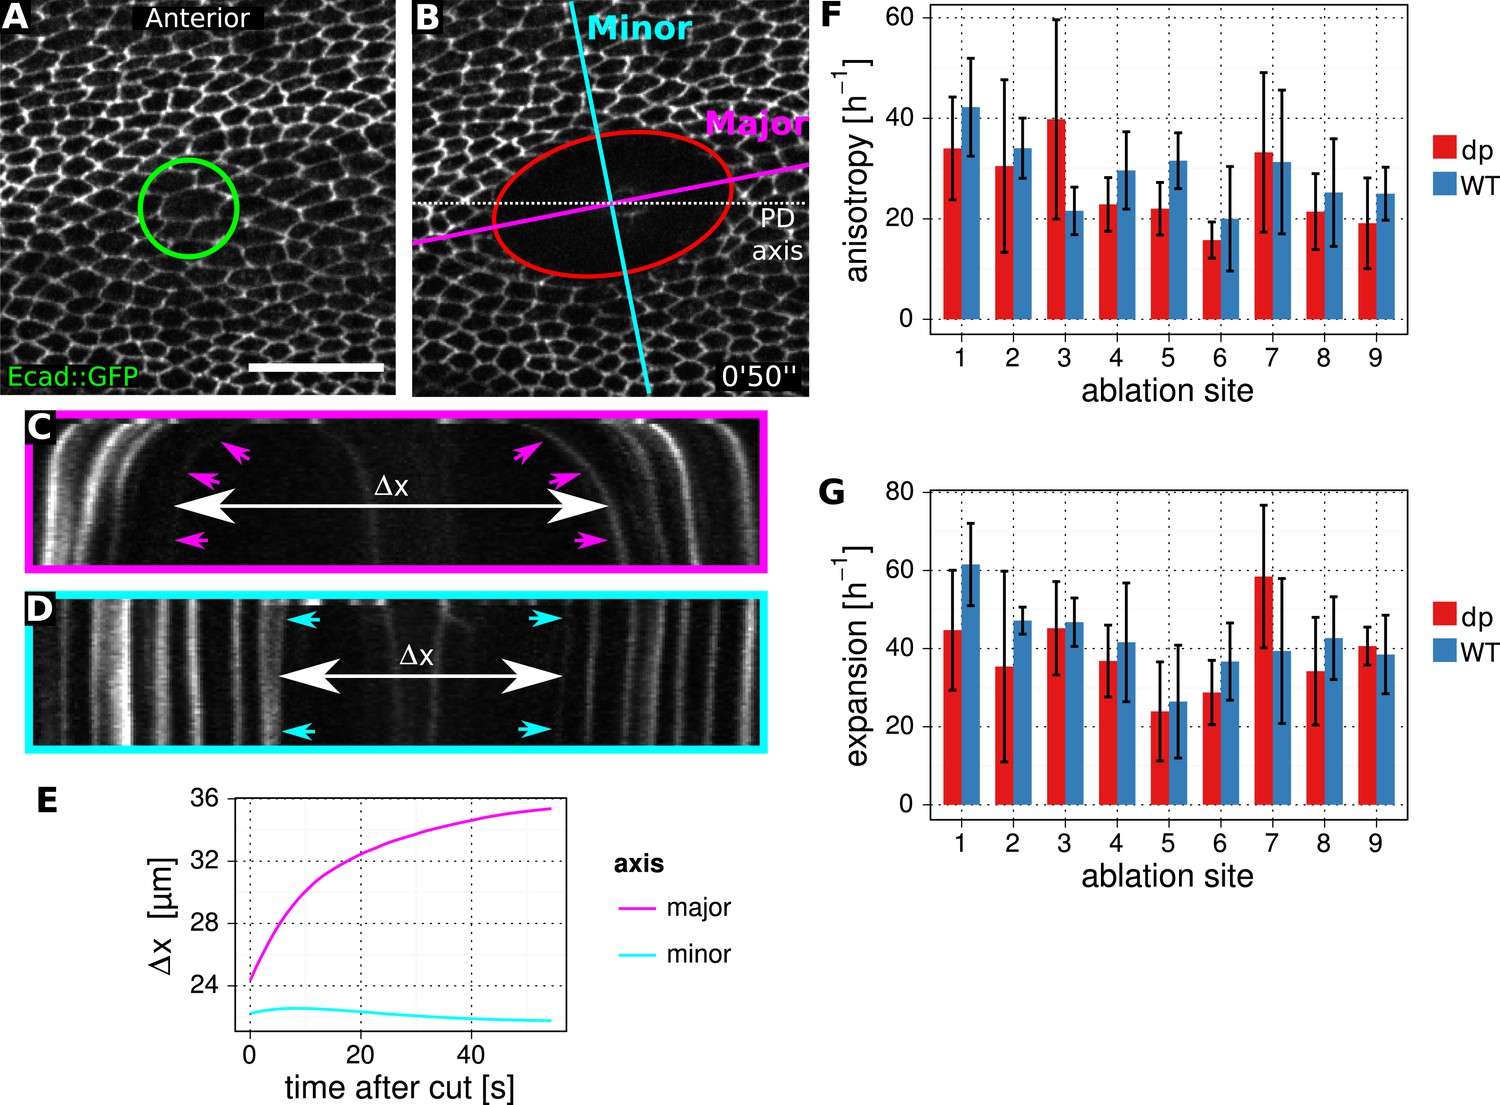
Method to determine stresses in WT and dumpyov1 mutant.
(A, B) Enlarged regions of the wing epithelium at 22.5 hAPF, before (A) and 50 s after (B) circular laser ablation in the epithelium. The green circle depicts the 14 µm circular cut in diameter. The red ellipse is a fit to the manually segmented perimeter of the cut region at 50 s. Minor (blue) and major (magenta) axes of this ellipse are used to define orthogonal kymographs. Scale bar 20 µm. (C, D) Kymographs defined in (B). Arrowheads depict the lines that were segmented using Fiji. Δx shows the relative increase in wing tissue displacement along the major and minor axes after the cut. (E) Graph showing an example of the relative tissue displacement along the major and minor axes. These displacements are used to estimate the initial velocity gradient of recoil after laser ablation (‘Materials and methods’, Analysis of circular laser ablations). The initial velocity gradient reflects the isotropic and and anisotropic stresses in the tissue. (F, G) Comparison of stresses between WT control and dumpyov1 mutant wings. Circular cuts were performed in nine different locations as depicted in Figure 2I,I′. Error bars show standard deviation over five replicates for each location and genotype.
Figure 3 with 2 supplements
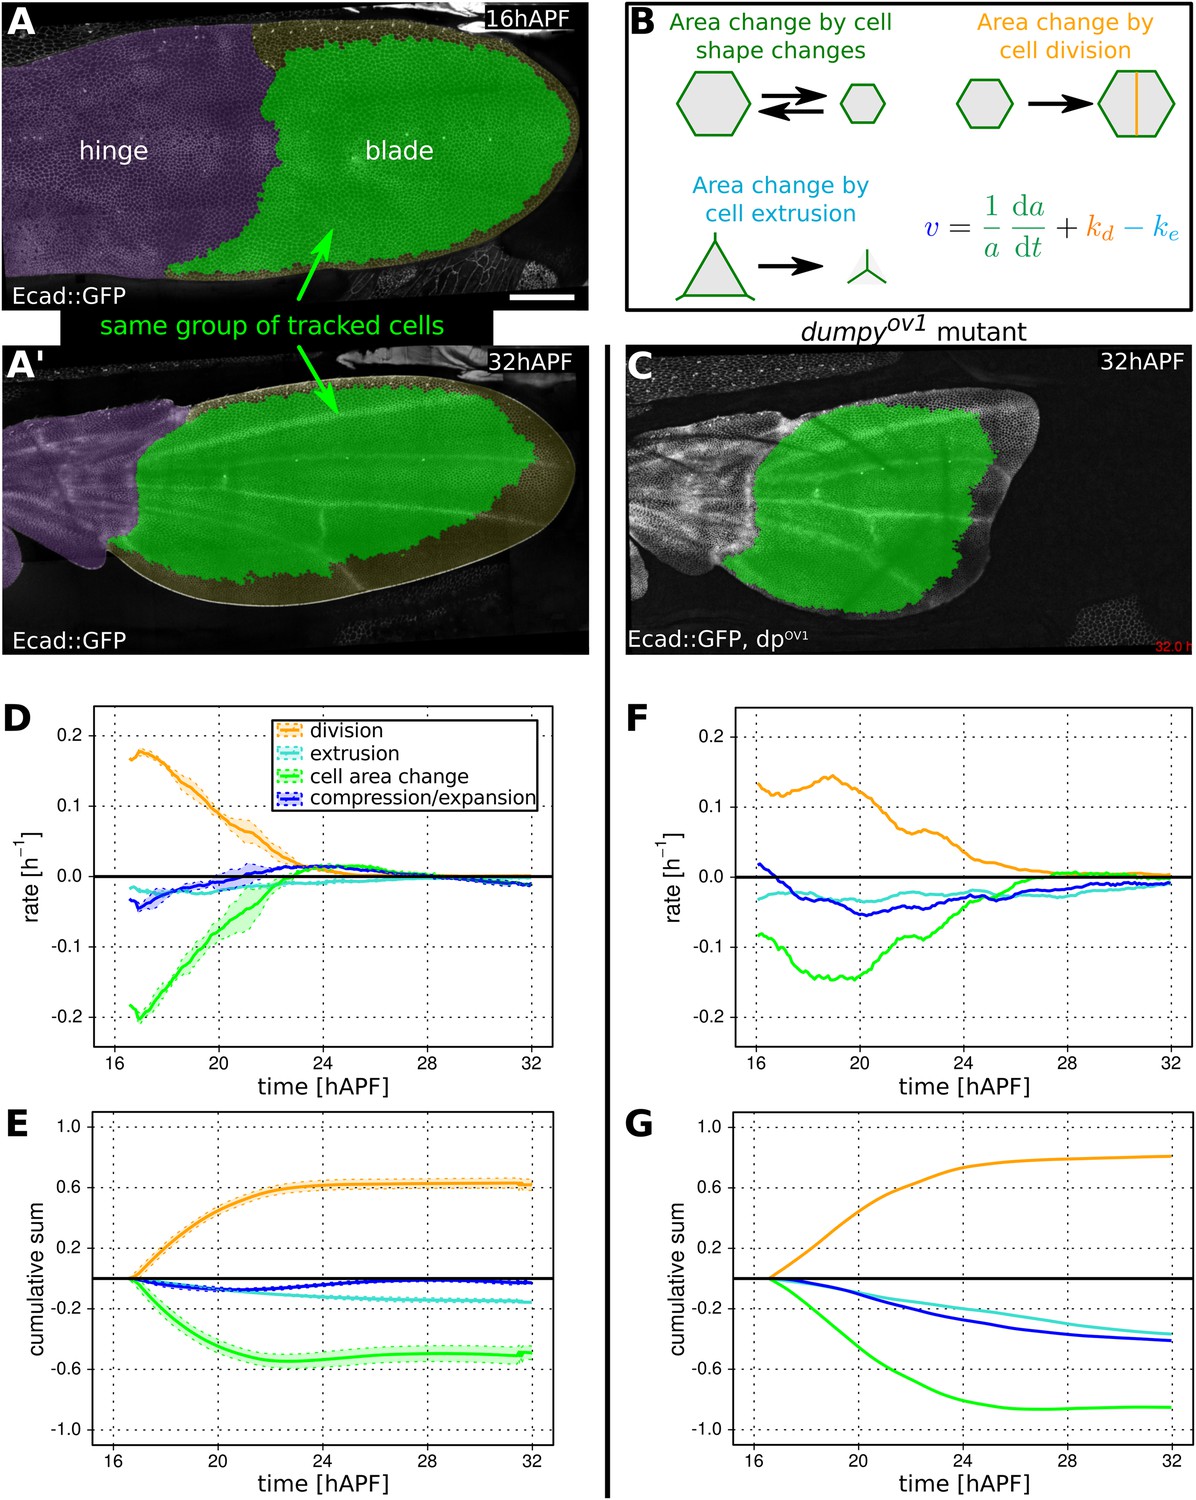
Cellular contributions to wing blade area changes.
(A, A′) WT Ecad::GFP expressing wing at 16 hAPF (A) and (A′) at 32 hAPF. The hinge is colored purple. Green shaded region indicates the region of the blade in which segmented cells could be tracked from the beginning to the end of the video. This region was used for further analysis (D, E). (B) Cartoon illustrating cellular contributions to wing blade area change: cell area change, cell division and cell extrusion. The equation decomposes the relative area change of the entire wing blade (v) into the relative area changes due to each cellular contribution throughout the wing blade. (C) dumpyov1 mutant wing at 32 hAPF. Green shaded region indicates tracked region used for analysis in (F, G). (D, E) Relative cellular contributions to wing blade area change over time, averaged over three WT wings. The rates of relative area change are shown in (D) and their cumulative sums are shown in (E). Lighter shaded regions in indicate standard deviations between wings. (F, G) Cellular contributions to wing blade area change in a dumpyov1 mutant wing. Cumulative plots (G) were generated starting at 16.5 hAPF, the earliest time common to all compared videos. Scale bar 100 µm.
Figure 3—figure supplement 1
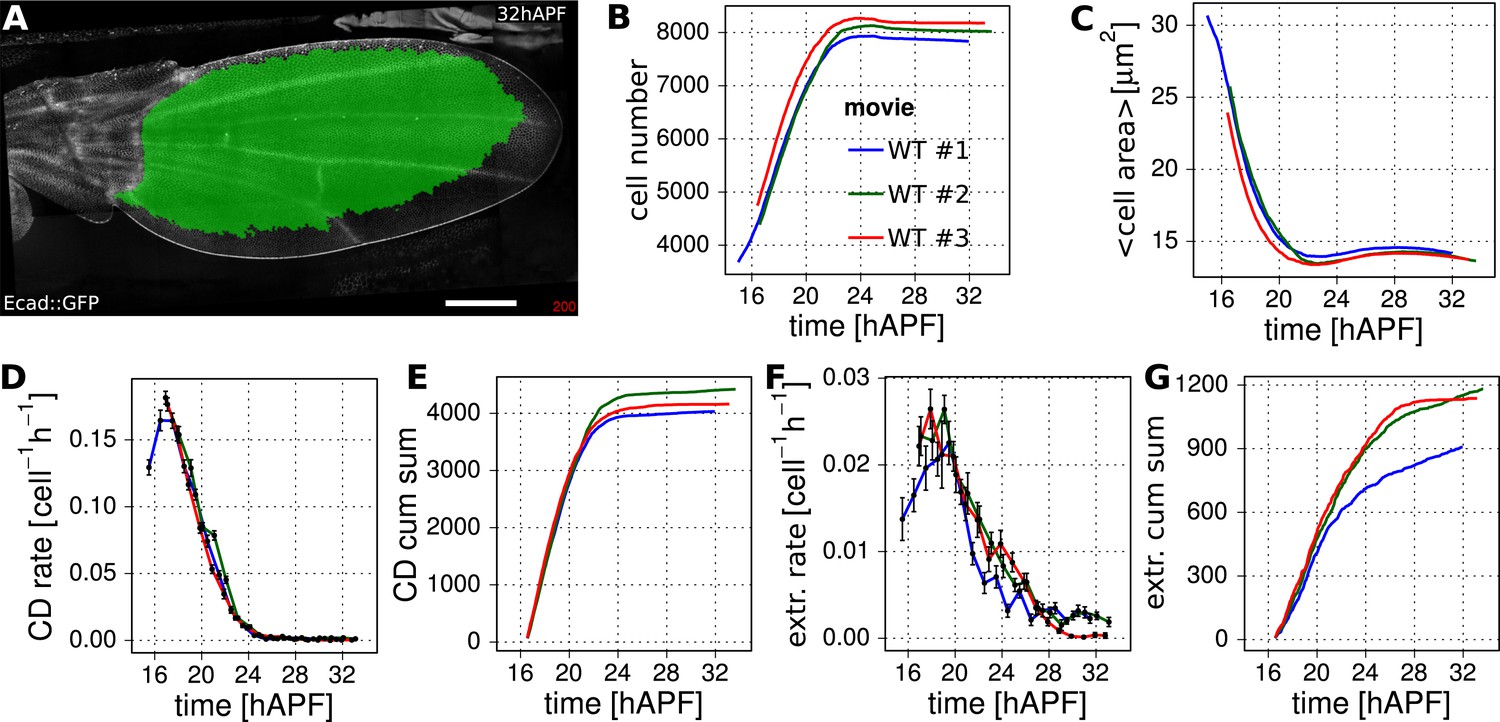
Reproducibility of cell number and cell area in three WT wings.
(A) A WT Ecad::GFP-expressing wing at 32 hAPF. The tracked and analyzed region is highlighted in green. Scale bar 100 µm. (B) Cell number change in 3 WT wing blades. (C) Average cell area (µm2) in the blade of 3 WT wings. (D) Cell division rates in 3 WT wing blades (divisions per cell per hour). The time was divided into 1 hr intervals in which the cell division rate was averaged. Error bars represent the standard error to the mean. (E) Cumulative increase in cell number due to cell division in 3 WT wing blades. (F) Cell extrusion rates (extrusions per cell per hour) in 3 WT wing blades. These were obtained similarly to panel D. (G) Cumulative numbers of cells lost due to cell extrusion throughout 3 WT wing blades. The same 3 WT wings are indicated in red, blue and green in panels (B–G).
Figure 3—figure supplement 2
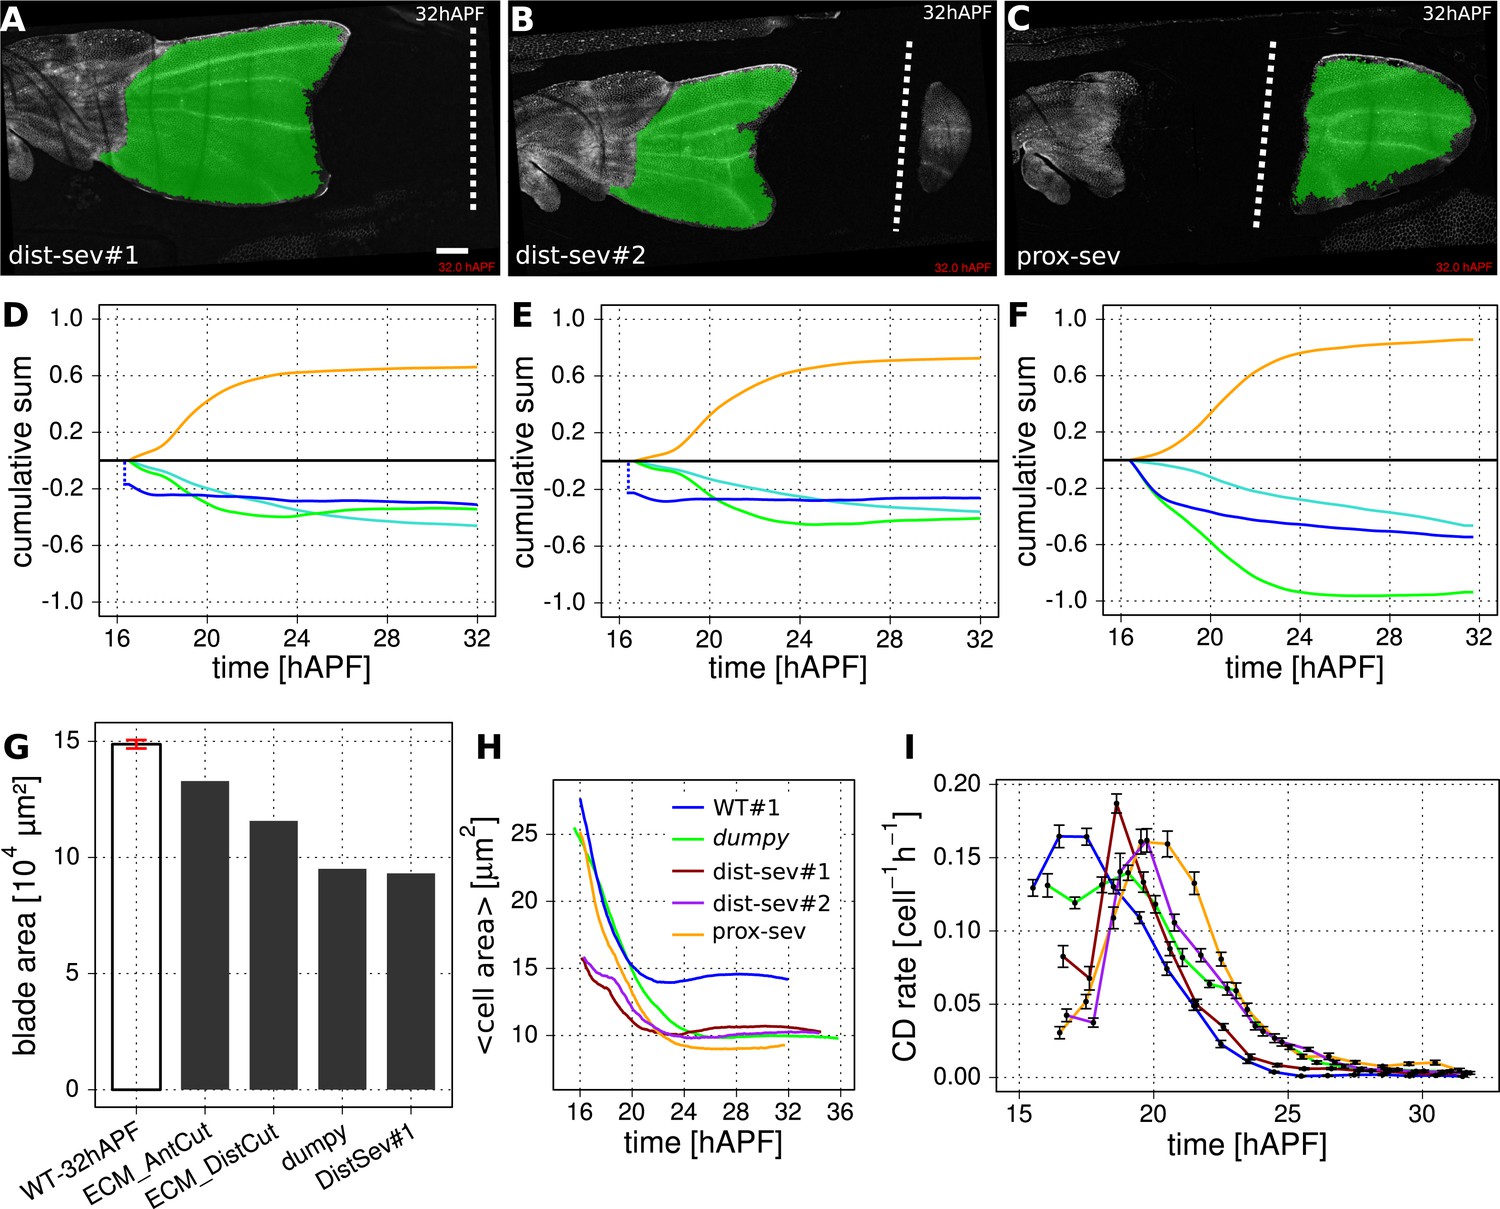
Epithelial tension is required to maintain wing blade area.
(A–F) Cumulative cellular contributions to changes in wing blade area in three mechanically perturbed WT wings. Green highlighting indicates tracked regions subjected to further analysis. Wings were severed either distally within the wing blade (A, D) and (B, E), or close to the hinge-blade interface (C, F) starting the ablation at 15.5 hAPF. (D, E, F) Show cumulative area change of the tracked region (blue curves) along with cumulative cellular contributions due to cell divisions (orange), cell area changes (green) and cell extrusions (turquoise). To calculate these changes starting at the time of laser ablation, we must first estimate the outline of the tracked region at the time of laser severing—after laser severing, the wing changes its area rapidly before time-lapse imaging can begin. Since molting has not yet occurred at 15.5 hAPF, the outline of the cuticle serves as a marker for the initial anterior and posterior edges of the wing. We estimate the initial hinge-blade interface position in laser severed wings by overlaying the cuticle outline of the laser severed wing with that of a non-perturbed WT wing at 15.5 hAPF. We determine the initial position of the cut from the laser-burned imprint in the cuticle. By using these landmarks to calculate the initial area, we estimate the area change that occurred before the onset of recording, and offset each cumulative area change (blue) curve by this amount. The offsets are negative for dist-sev#1 and #2, that is, wing blade area shrinks rapidly in response to laser ablation. In contrast, the offset is zero for the proximally severed wing blade, which does not shrink immediately after ablation. (G) Final (32 hAPF) measured area of unperturbed and the indicated laser severed wing blades. The red error bar indicates the standard deviation amongst the 3 WT wing blades. The absolute blade area of dist-sev#1 reflects the sum of the areas of tissue proximal and distal to the cut. (H) Average cell area (µm2) over time in WT wing blades and wing blades subject to the indicated perturbations (dumpyov1, dist-sev#1, dist-sev#2, prox-sev). When PD stresses are weakened, the average cell area shrinks to ∼10 µm2 as compared with ∼15 µm2 in unperturbed WT. (I) Cell division rates (per cell per hour) in WT and perturbed wing blades. The time was divided into 1 hr intervals in which the cell division rate was averaged. Error bars represent the standard error to the mean. Colors refer to the same wings as in panel H. Scale bar: 100 µm.
Figure 4
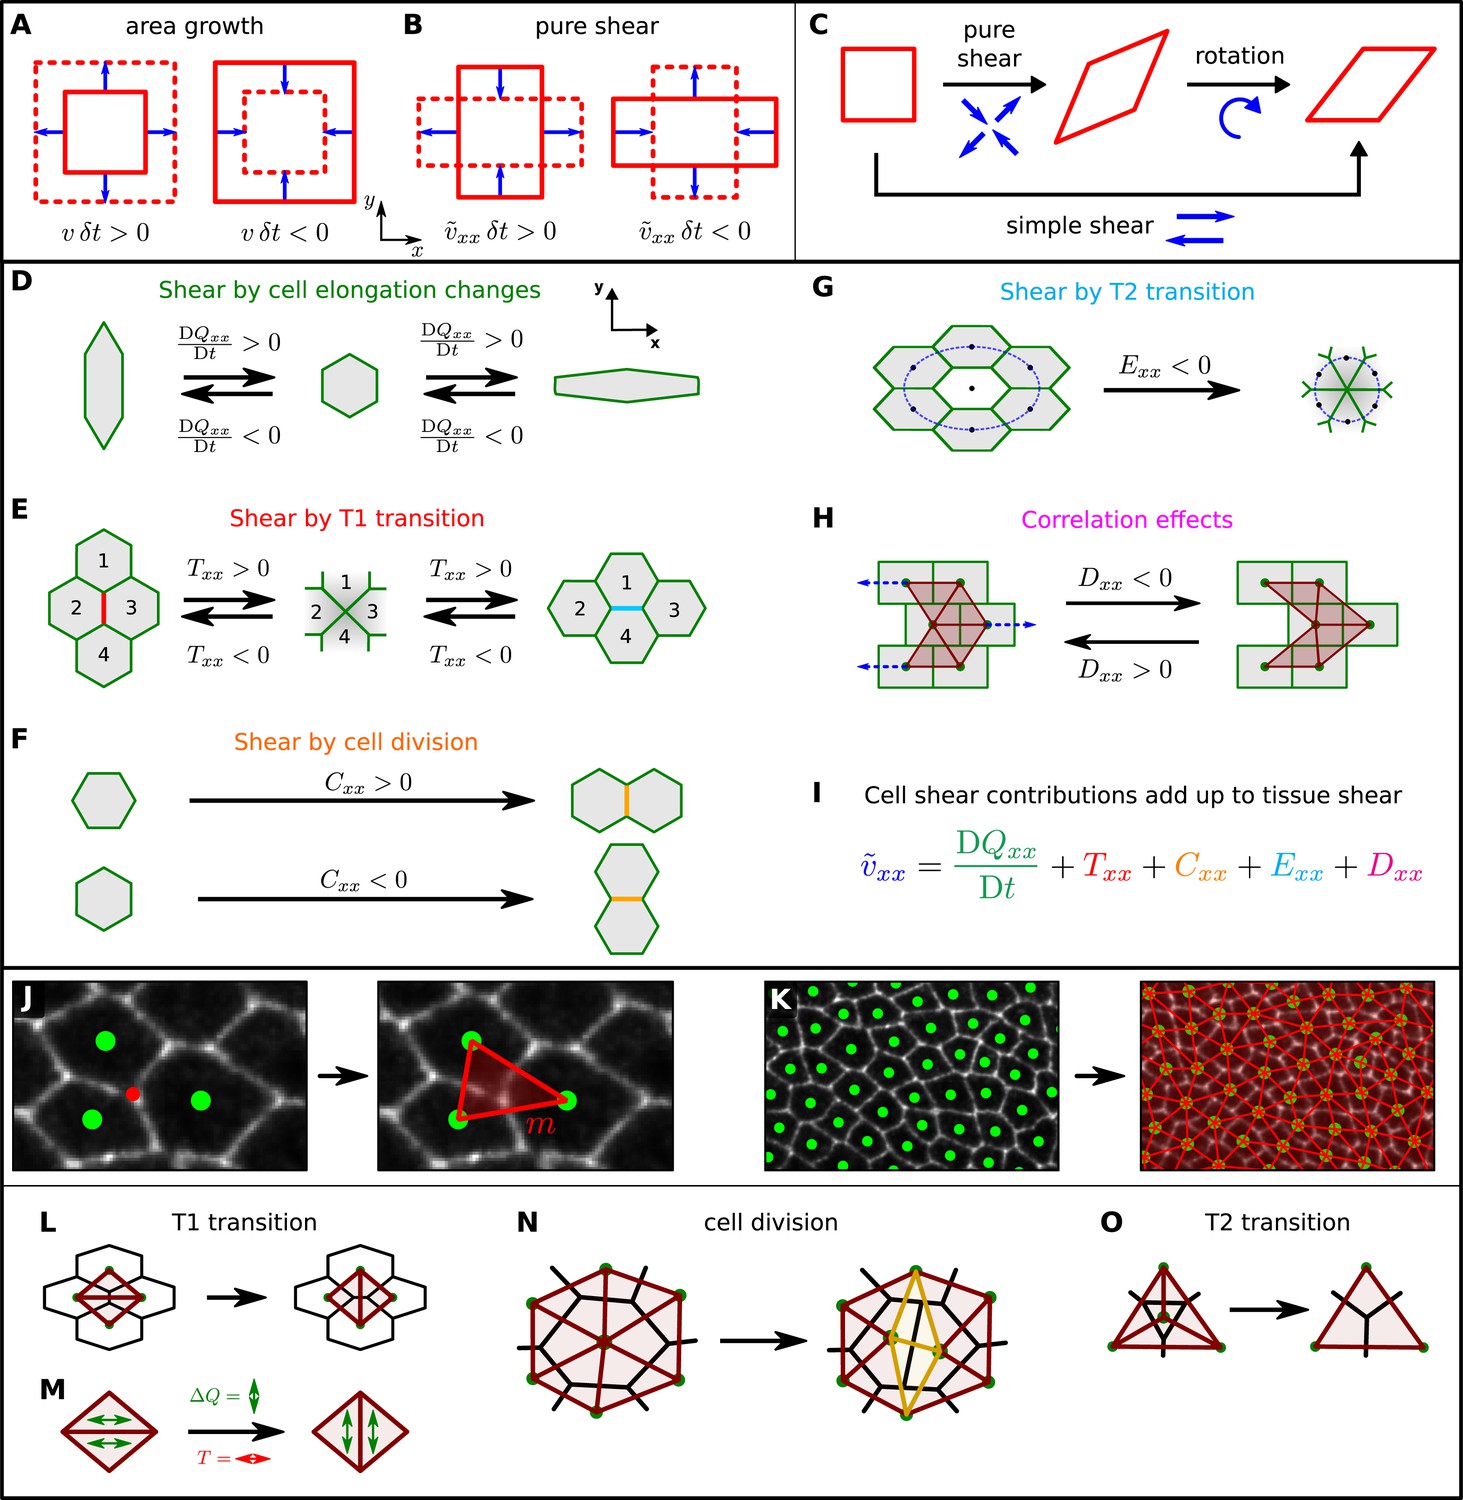
A method to quantify cellular contributions to wing blade deformation.
(A, B) Isotropic part of tissue deformation, that is, tissue area growth (A), and anisotropic part of tissue deformation, that is, tissue pure shear, along the x axis (B). The deformation occurs during a time interval δt. (B) The sign of the pure shear rate component indicates the shear direction. Positive means that the shear deformation occurs along the PD axis (also referred to as x axis). Negative corresponds to shear along the AP axis (or y axis). (C) A simple shear deformation corresponds to a superposition of a pure shear deformation and a rotation. (D–H) Cartoons depicting how changes in cell shape, cell rearrangements, cell divisions, cell extrusions and correlation effects could produce tissue shear. (I) The equation decomposes the tissue shear rate into shear contributed by each of these cellular processes (color code as in D–H). For simplicity, the tensorial equation was projected onto the PD axis as most of the deformation occurs along the PD axis. (J, K) Triangulation method. (J) The cellular network is tiled with triangles: each vertex (red dot) of the cellular network that touches three cells gives rise to a single triangle (red), whose corners are defined by the centers of the three cells (green dots). (K) The resulting set of triangles tiles the cellular network without gaps or overlaps. (L–O) Triangle network modifications upon topological changes due to cell rearrangements (L), cell divisions (N), and extrusions (O). (M) The discontinuous change in average triangle elongation during a given topological change is used to calculate the shear induced by the topological change.
Figure 5 with 1 supplement
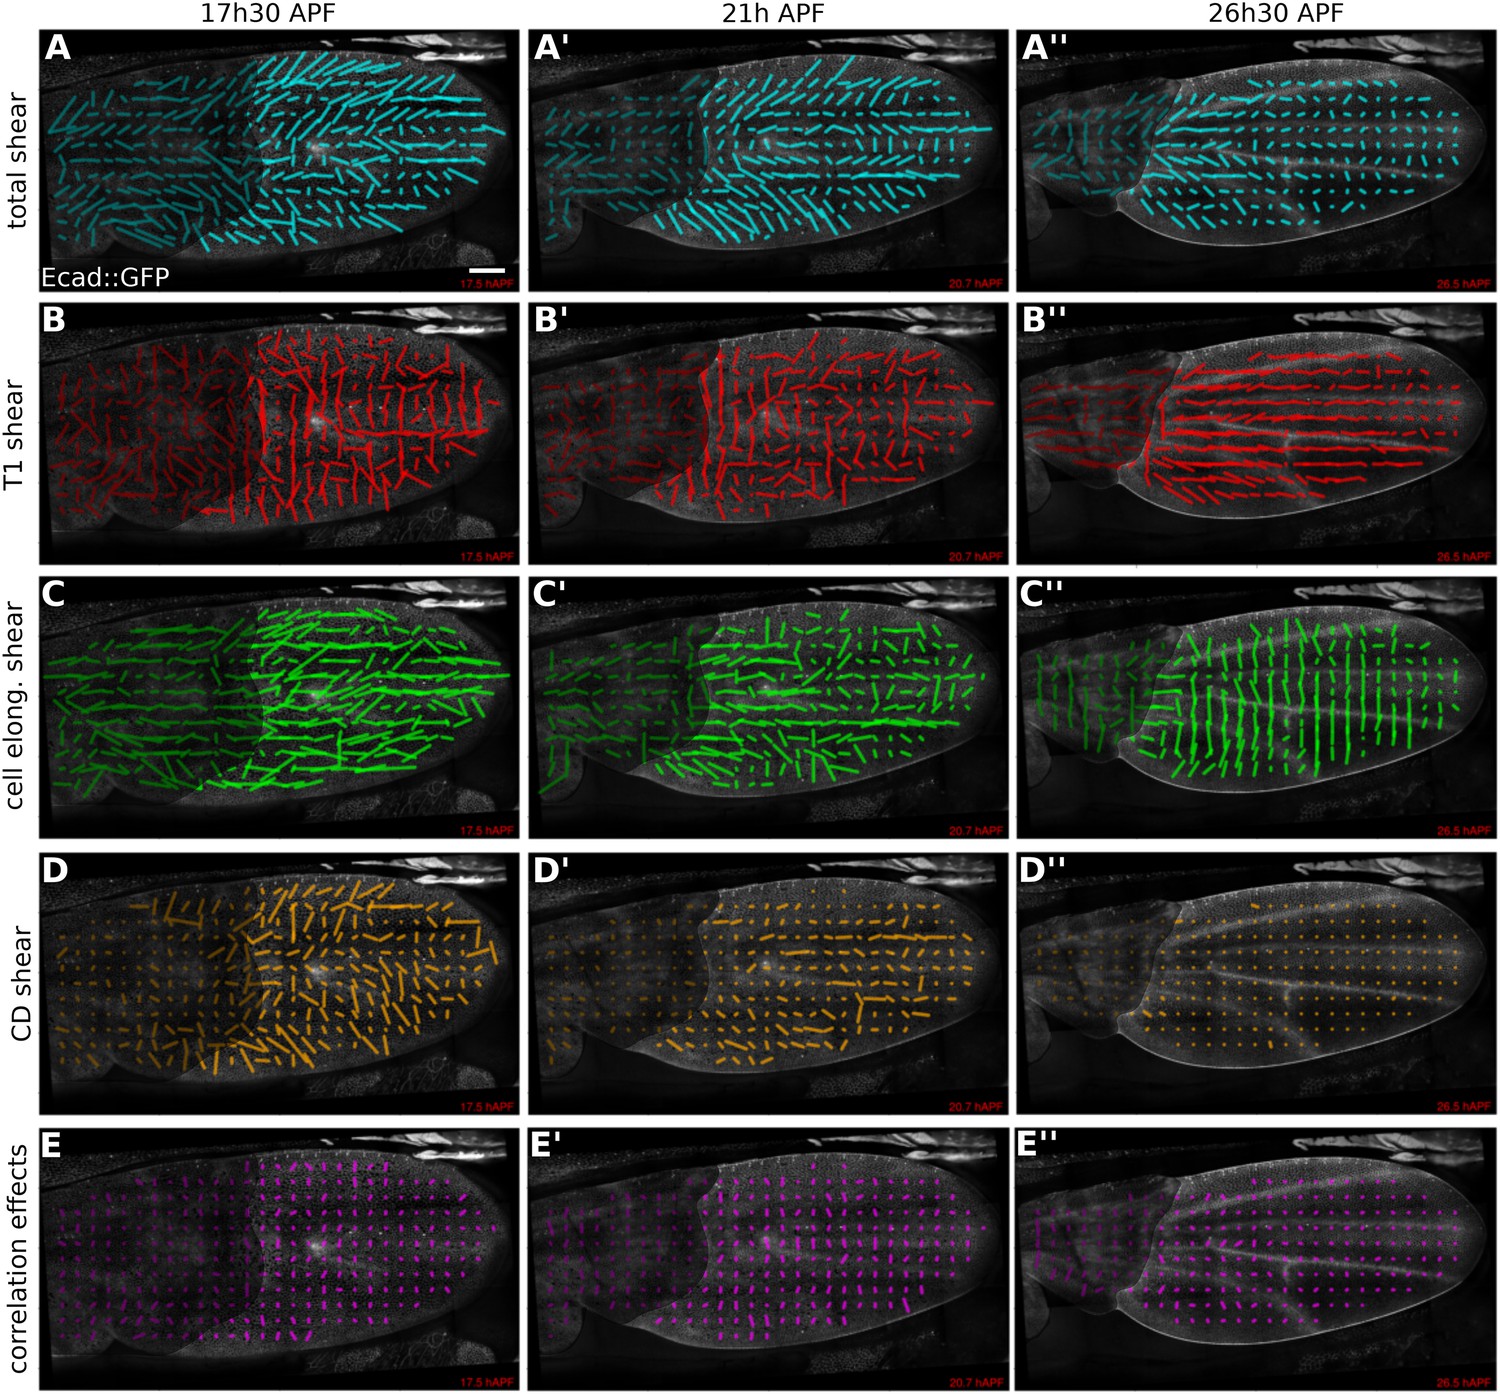
Patterns of cellular contributions to tissue shear in unperturbed WT wings.
(A–E′′) Patterns of local tissue shear rates (A–A′′), local shear rates contributed by cell rearrangements (T1 transitions, B–B′′), cell shape changes (C–C′′), cell divisions (D–D′′), and correlation effects (E–E′′), in a WT wing at 17.5 hAPF (phase I), 21 hAPF (intermediate phase) and 26 hAPF (phase II). The shear rate and shear rate contribution tensors were locally averaged within 26 × 26 µm2 square elements (25–50 cells) of a fixed grid. A 45 min time window was used to smooth the shear values within each grid element. The resulting nematic tensors are represented by line segments whose length and direction correspond to the norm and orientation of the tensor, respectively. Scale bar: 100 µm.
Figure 5—figure supplement 1
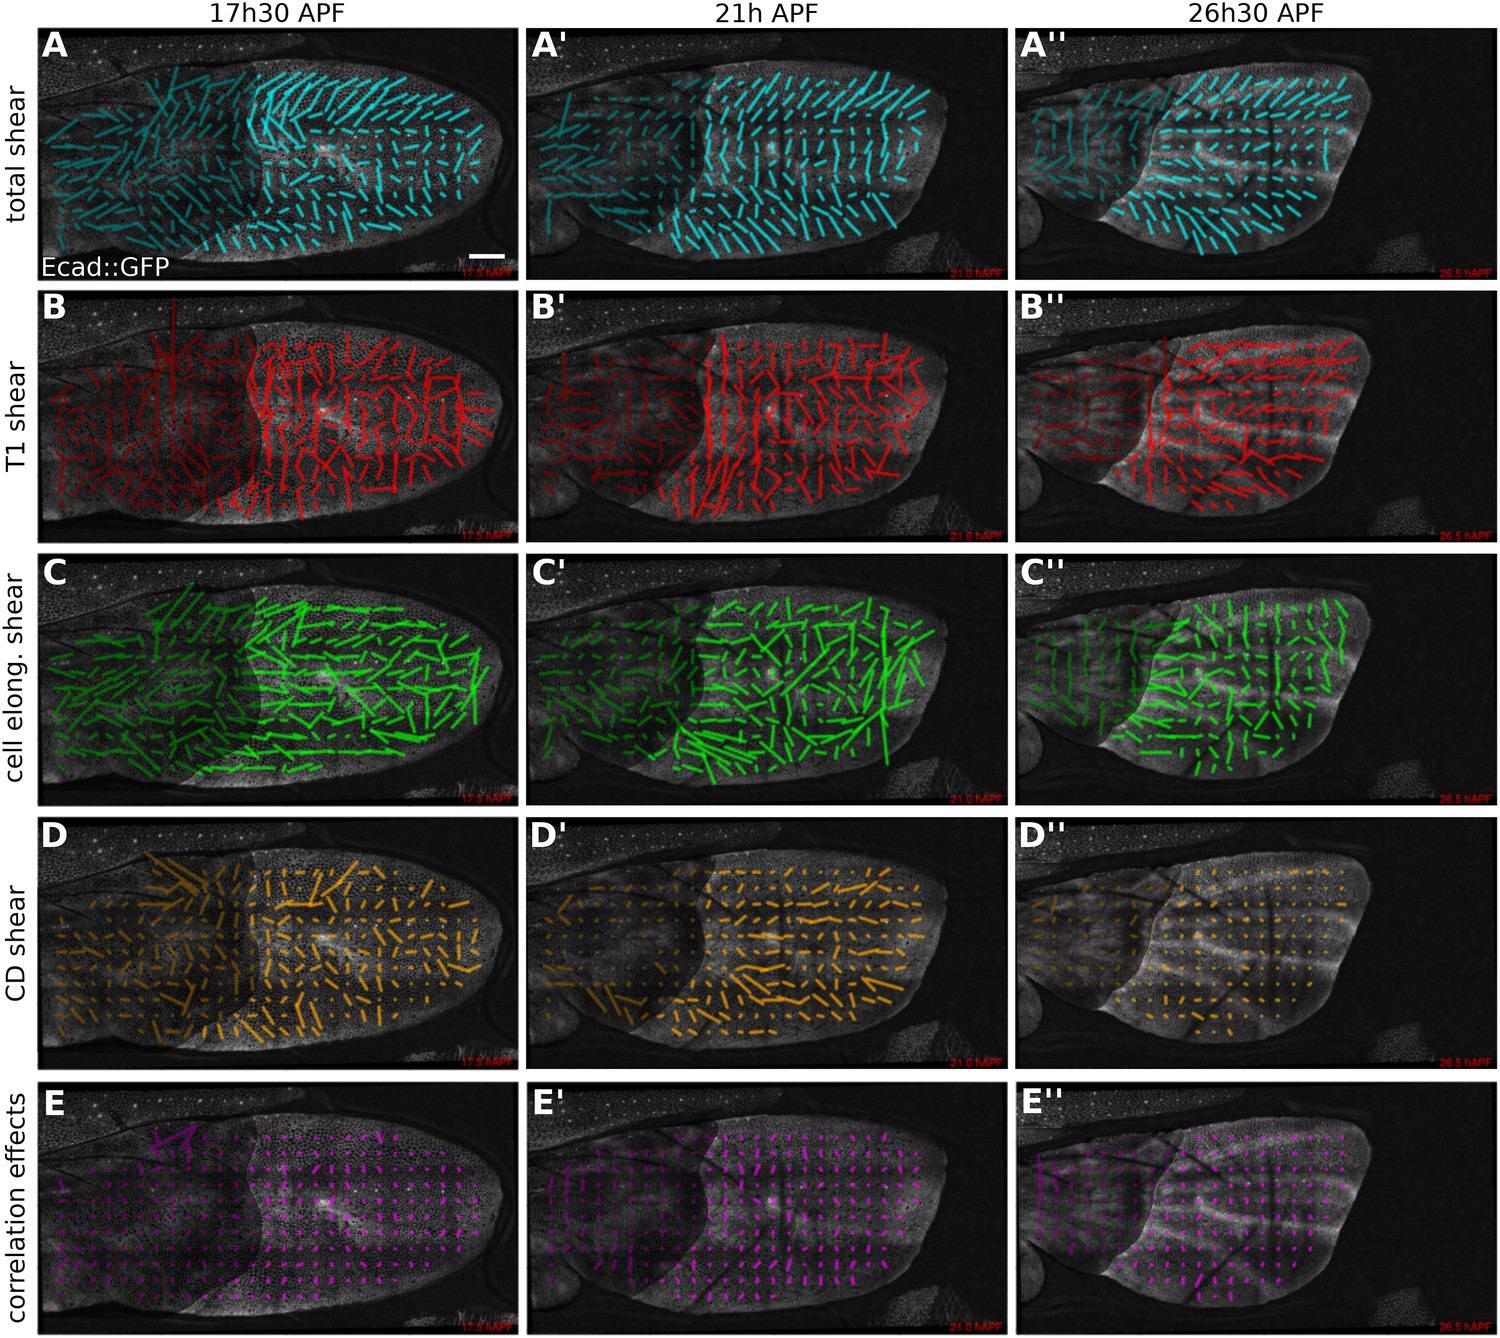
Patterns of cellular contributions to tissue shear in dumpyov1 mutant.
(A–E′′) Patterns of local tissue shear rates (A–A′′) and local shear rates contributed by cell rearrangements (B–B′′), cell shape changes (C′, C′′), cell divisions (D–D′′), and correlation effects (E–E′′), in a dumpyov1 mutant wing at 17.5 hAPF, 21 hAPF and 26 hAPF. The shear calculations were performed as described in Figure 5. The resulting nematic tensors are represented by line segments whose length corresponds to the amplitude of the shear and whose orientation to the shear axis. Scale bar: 100 µm.
Figure 6 with 1 supplement
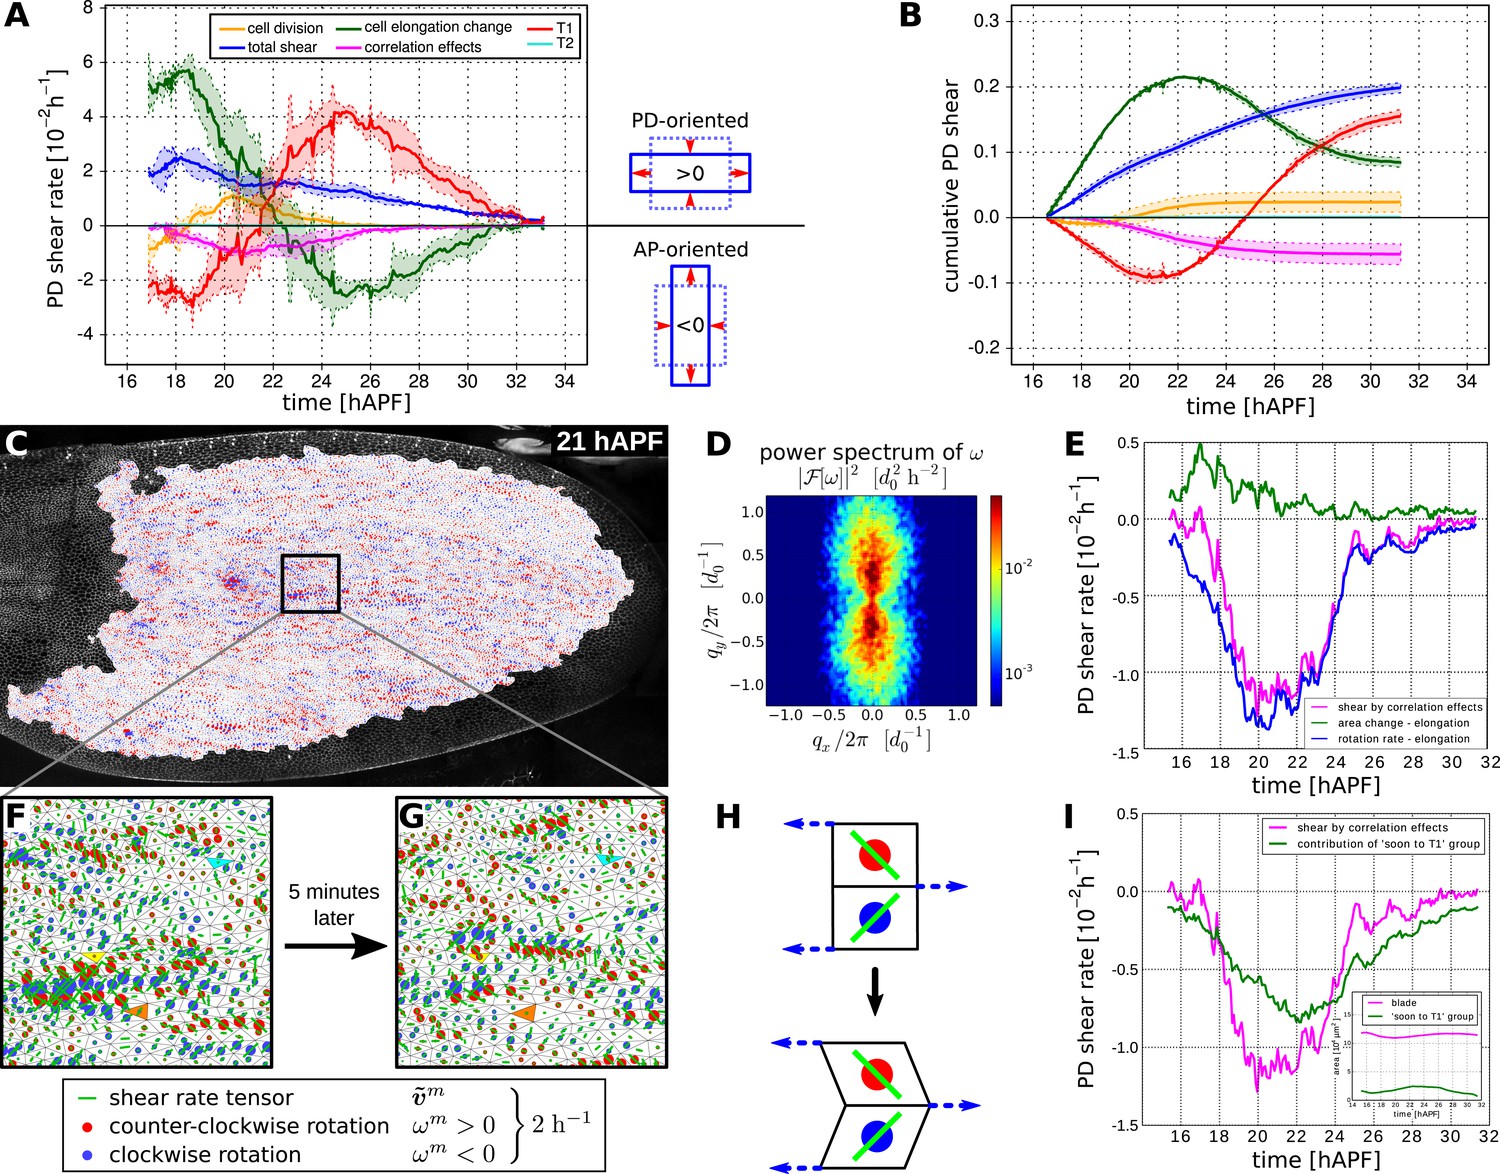
Total cellular contributions to tissue shear throughout the WT wing blade.
(A) Shows the tissue shear rate (blue) over time, and shear rates contributed by cell rearrangements (red), cell shape changes (green), cell divisions (orange), and correlation effects (magenta), averaged throughout the wing blade. These averages were taken over the tracked region shown in Figure 3A by averaging nematic tensors throughout the wing blade. The resulting quantities were further projected onto the PD axis and averaged over the three WT videos. Ribbons indicate the standard deviation between wings. The sign of the shear rate defines its orientation (>0 is PD-oriented and <0 is AP-oriented). (B) Shows the accumulated tissue shear over time throughout the blade, and the accumulated contributions of each cellular process (color code as in A). (C) Pattern of local tissue rotation rate at 21 hr after puparium formation (APF). The local tissue rotation rate ωm is plotted separately for each triangle m. Red circles correspond to a counter-clockwise rotation and blue circles correspond to a clockwise rotation. The area of each circle scales with the absolute rotation rate. (D) The spatial power spectrum of the local tissue rotation rate corresponding to the pattern in panel C (see Appendix 1, ‘Power spectrum of local tissue rotation’). The power spectrum is a function of a wave vector q = (qx, qy), which is measured in units of a typical cell diameter d0 = 4 μm. The two peaks in the power spectrum at qpeak ≈ (0, ±0.3d0/2π) correspond to the existence of horizontal bands of alternating tissue rotation that are separated by about 1.5 cell diameters (compare panels F, G). (E) Correlation effects contributing to shear along the PD axis, Dxx (magenta curve). Dxx can be decomposed into an area expansion part (green curve), which corresponds to a correlation between the local area expansion rate vm and local triangle elongation : , and into a rotational part (blue curve), which corresponds to a correlation between the local tissue rotation rate ωm and local triangle elongation: (see Appendix 1, ‘Large-scale shear in the absence of topological transitions’). The rotational part dominates the shear by correlation effects. (F) Enlargement of the rotation pattern in panel C with an additional indication of the pattern of the local shear rate tensor by green bars. Length and orientation of a bar correspond to magnitude and axis of the local shear rate, respectively. The axis of local shear is correlated with the sign of local rotation (indicated by red and blue circles). (G) The same region of the wing in the subsequent frame (about 5 min later). Three corresponding triangles in panels F and G are colored in cyan, yellow and orange, respectively. The patterns of local shear and rotation change on time scales of minutes. (H) A correlation of local rotation and local shear within bands as shown in panels F, G corresponds to bands of alternating simple shear. (I) Contribution to the shear due to correlation effects of the group of triangles that are going to disappear due to a T1 transition within nine video frames (<45 min) (Appendix 1, ‘Role of T1 transitions in the correlation-induced shear’). Inset: the area of this group is small compared to the total blade area, although it accounts for a significant amount of shear due to correlation effects in the blade.
Figure 6—figure supplement 1

The shear decomposition method effectively describes tissue deformation and cellular contributions to tissue shear.
(A) Verification of the shear decomposition method. The total tissue shear rate can be obtained by averaging changes in triangle elongation, without redefining triangles after topological changes (blue curve, see Appendix 1, ‘Decomposition of the large-scale tissue shear rate’). The same values are obtained independently by decomposing shear into the cellular contributions due to cell shape changes, cell divisions, cell extrusions, cell rearrangements and correlation effects to shear (pink curve). (B) Independent methods quantitatively account for the shape change of the wing blade. The blade shape was first characterized by a nematic determined by the outline of the tracked region. The change of this nematic with respect to its initial value over time is shown (dotted yellow line) together with the cumulative tissue shear (blue) obtained from the triangle method. (C) Here, we illustrate a scenario without overall tissue shear and where cell elongation does not change in the long run. However, the shear contribution by T1 transitions T is positive along the horizontal axis. This shear contribution is exactly compensated by the correlation effects D. (D) As a proxy for cell boundary orientation, we use the orientation of the line (yellow) connecting the centers (blue points) of the two corresponding triangles (red).
Figure 7
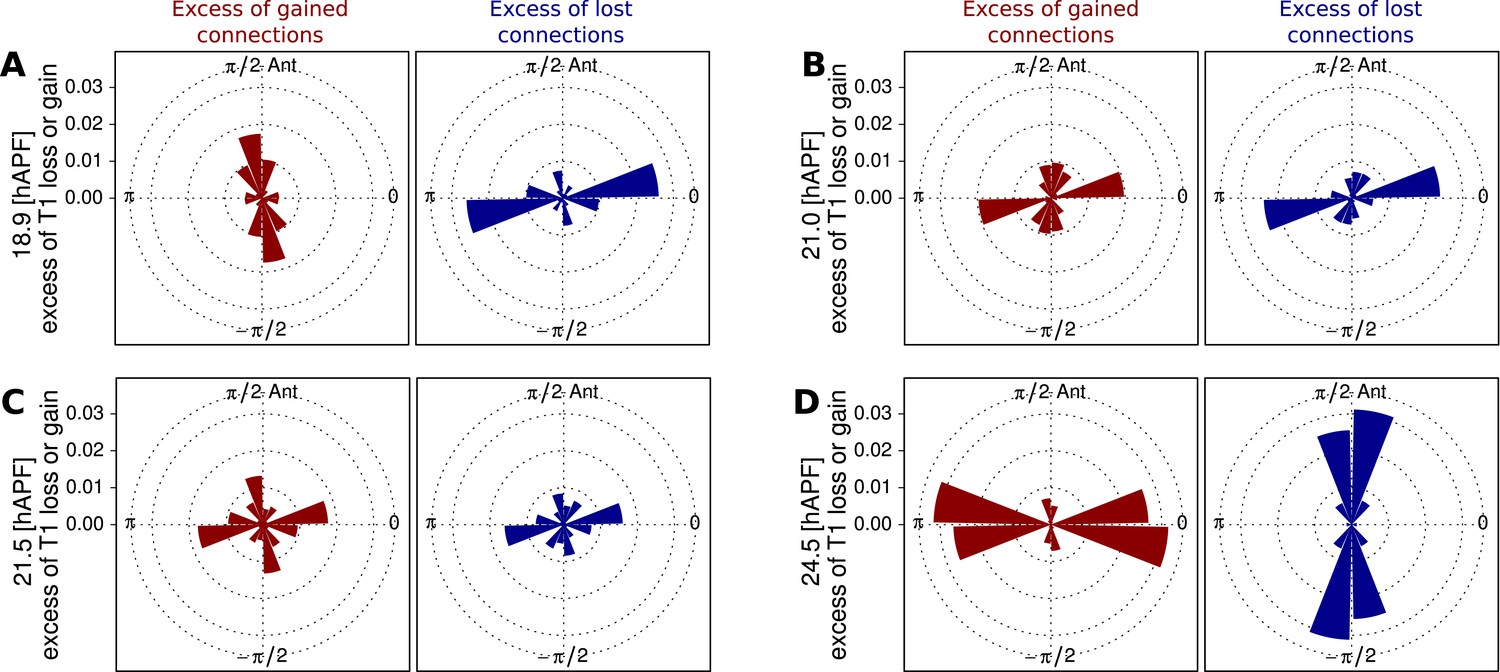
Changes in angular distribution of lost and newly formed cell–cell junctions.
(A–D) Effective proportions of cell–cell connections that are lost (blue) or gained (red) in different directions as a consequence of cell rearrangements in a WT wing. To calculate these effective proportions, we subtracted the angular distribution of all cell boundaries from the angular distribution of cell–cell connections that were lost or gained by cell rearrangements, revealing the orientation of cell boundaries with a disproportionate tendency to be lost or gained. Rose diagrams show angles of cell boundaries that are more likely to be gained (red) or lost (blue) at specific times during the video corresponding to important changes in cell dynamics: (A) 18.9 hAPF (peak of negative shear rate by cell rearrangements), (B) 21 hAPF (peak of correlation effects), (C) 21.5 hAPF (shear rate by cell rearrangements crosses zero) and (D) 24.5 hAPF (peak of positive shear rate by cell rearrangements).
Figure 8 with 3 supplements
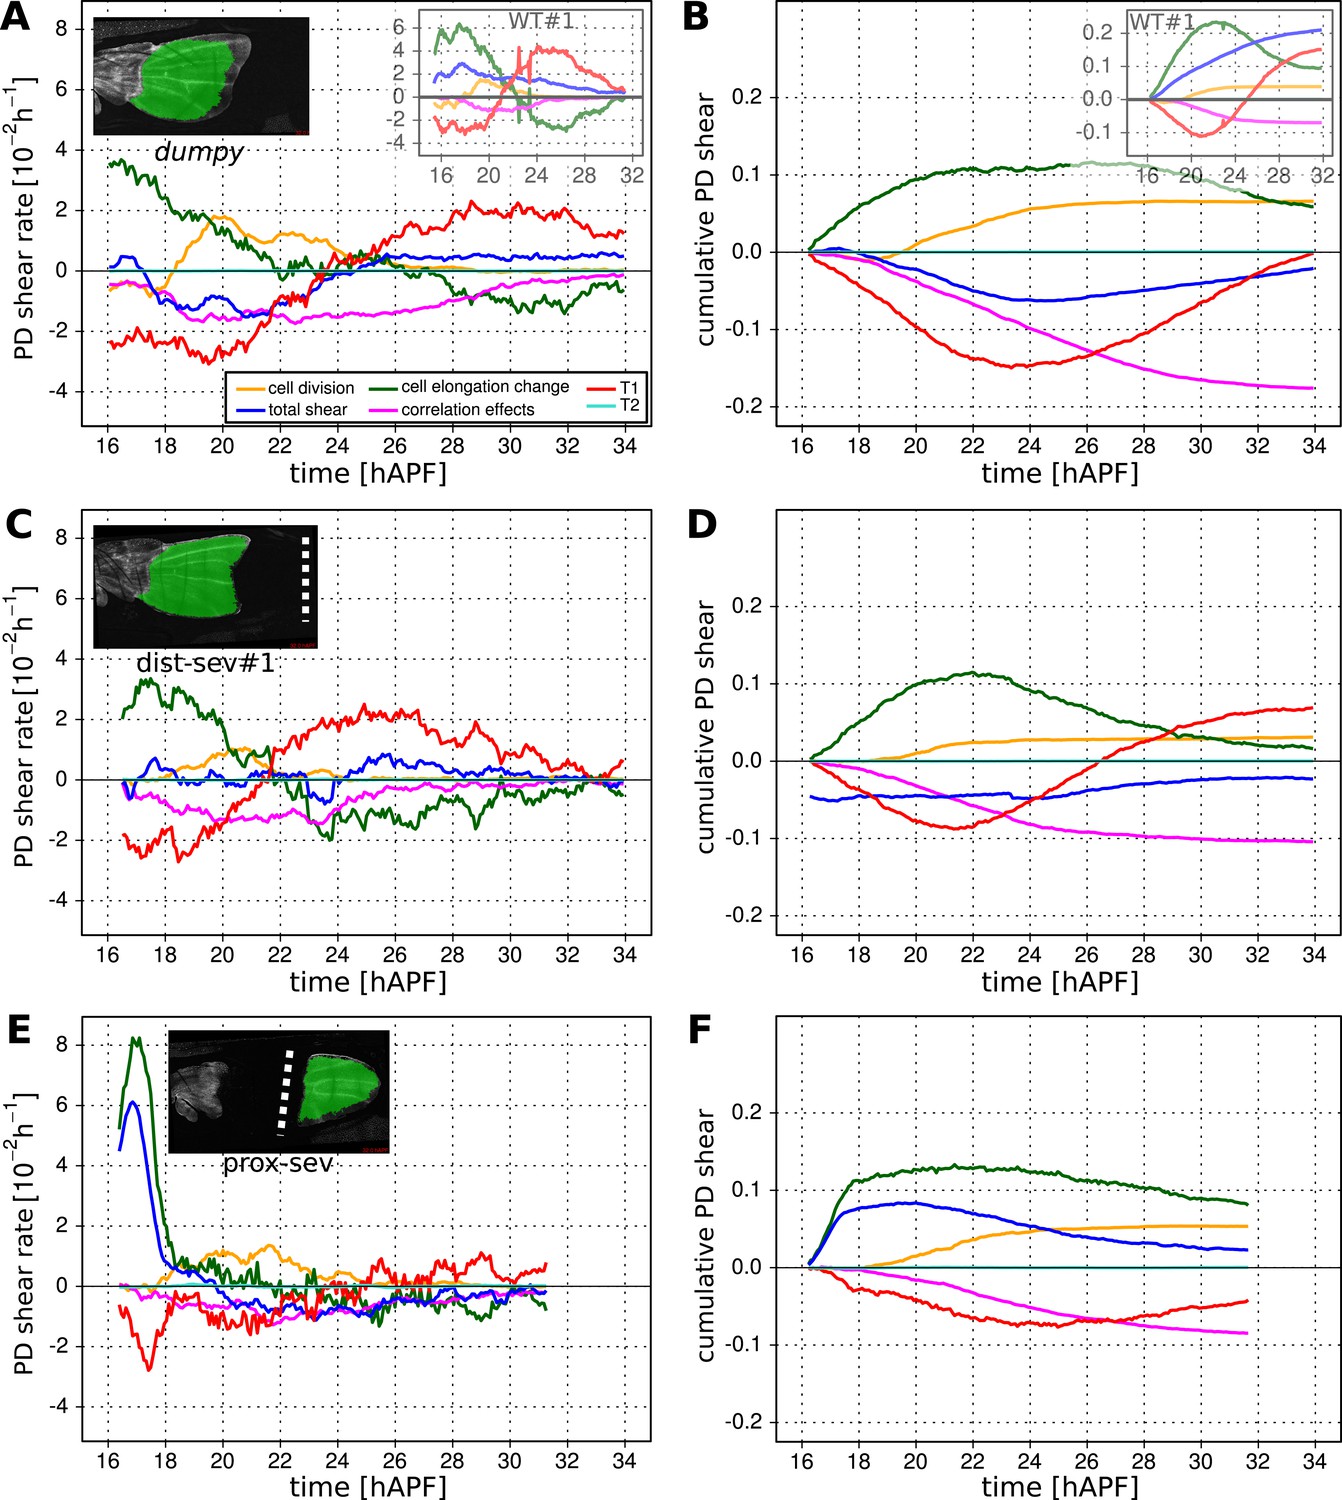
Total cellular contributions to tissue shear throughout perturbed wing blades.
(A–F) Show total shear rates (A, C, E) and total accumulated shear (B, D, F), along with their cellular contributions, in the dumpyov1 wing blade (A, B), and wing blades severed either distally (C, D) or proximally (E, F) before hinge contraction (∼16 hAPF). Blue = total tissue shear, Red = shear due to T1 transitions, Green = shear due to cell elongation change, Orange = shear due to cell division, Magenta = shear due to correlation effects. Corresponding plots for WT wings (identical to those in Figure 6) are inset in the upper right corners of (A, B) for the purposes of comparison. Insets in left corners of (A, C, E) show the tracked regions of each wing in green at 32 hAPF. To plot accumulated tissue shear in laser ablated wings, we offset the calculated accumulated tissue shear (blue) by a value corresponding to the difference in blade elongation before ablation and at start of recording (see Figure 3—figure supplement 2). All videos were aligned in time by taking the histoblast nests fusion time as a reference at about 26.5 hAPF. All cumulated shear curves start at 16.2 hAPF, which is the earliest common time point registered in all compared videos, including the dist-sev#2 video shown in Figure 8—figure supplement 1A,B.
Figure 8—figure supplement 1

Total cellular contributions to tissue shear throughout perturbed wing blades.
(A-C) Show total shear rate (A) and total accumulated shear (B), along with their cellular contributions, in a distally severed wing blade (dist-sev#2). A small piece of WT tissue (about 500 cells) was ablated in the blade at ∼16 hAPF, leaving a small distal piece of tissue. Left corner inset in (A) shows the severed wing at 32 hAPF, with the tracked region highlighted in green. Blue = total tissue shear, Red = shear due to T1 transitions, Green = shear due to cell elongation change, Orange = shear due to cell division, Magenta = shear due to correlation effects. The offset for accumulated tissue shear (blue in panel B) was calculated as in Figure 8 (see also Figure 3—figure supplement 2). (C) Shows the wing blade aspect ratio (ar) in WT unperturbed wings at 16 hAPF and 32 hAPF, and in laser ablated wings at 32 hAPF. The aspect ratio is obtained from the measured blade elongation by the relation ar = exp(2Qxx), (see ‘Materials and methods’, Measurements of wing dimensions). Red error bars: standard deviation over the 3 WT wings.
Figure 8—figure supplement 2
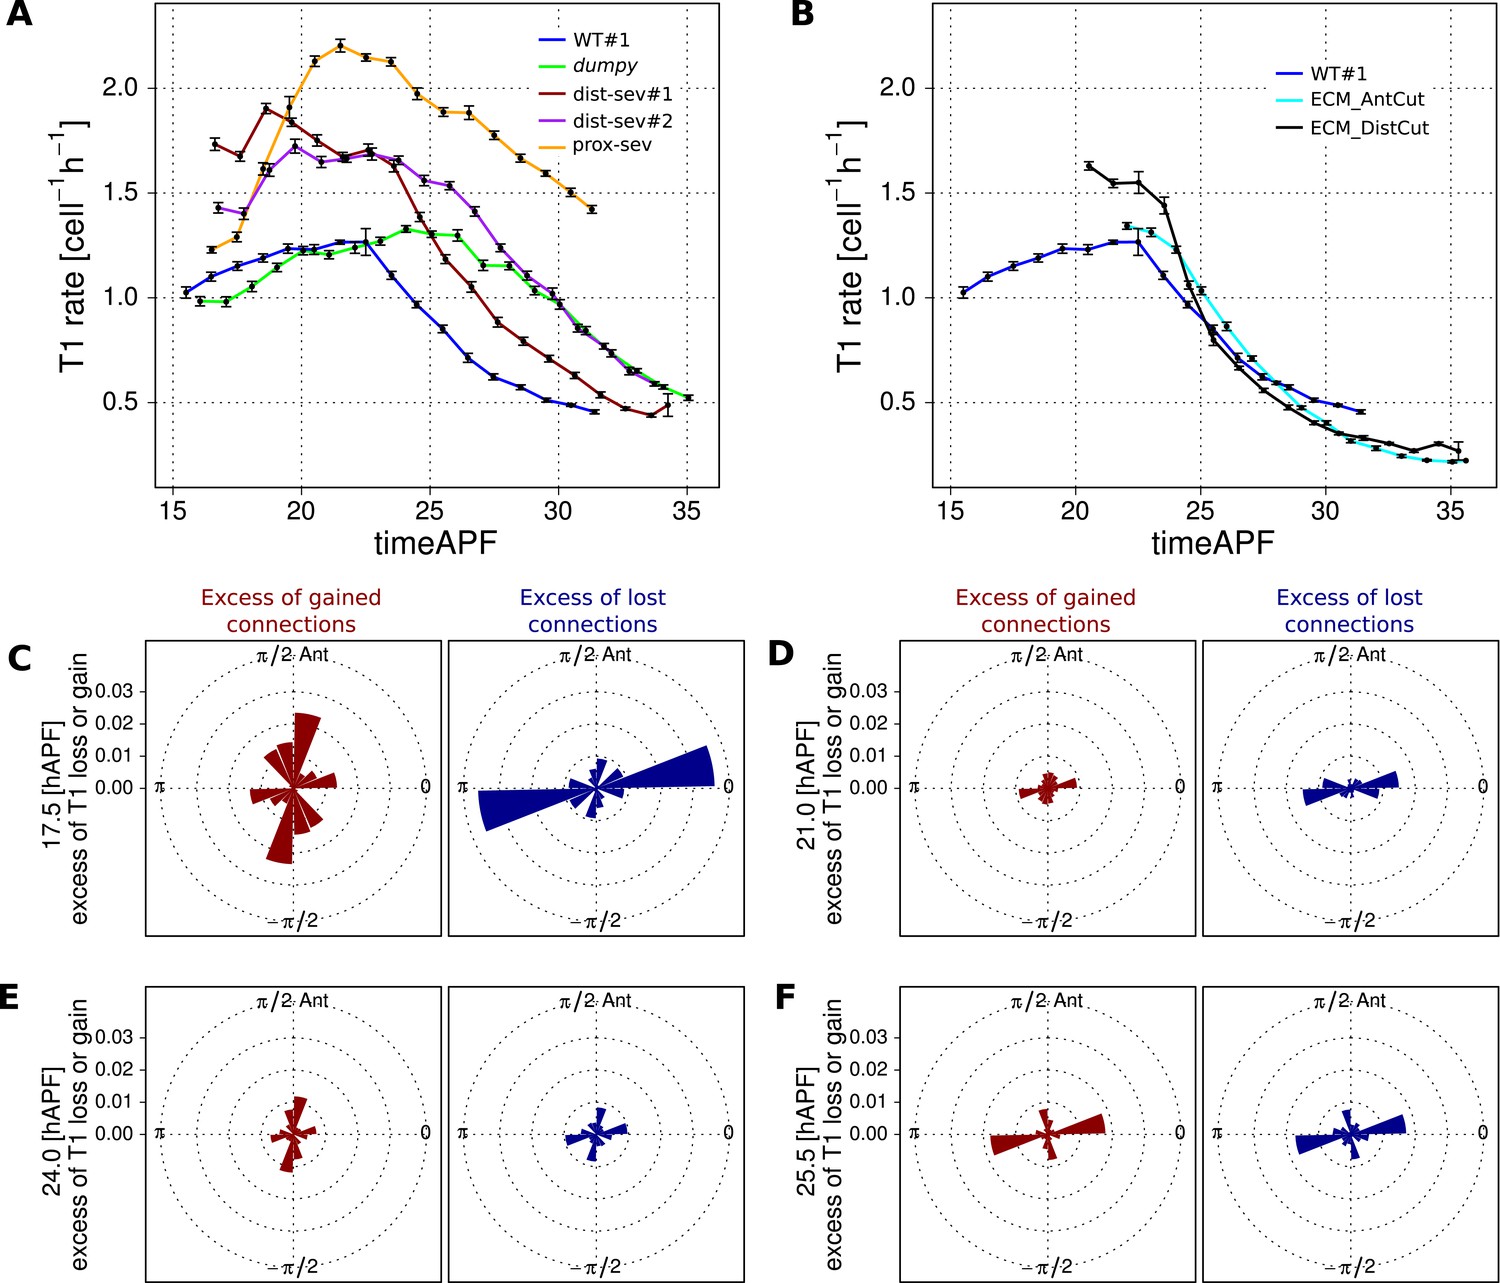
Effect of mechanical perturbations on T1 transitions.
(A, B) Show the rate of T1 transitions over time in unperturbed WT wing blades and under different genetic and mechanical perturbations. (A) Shows WT (blue), dumpyov1 (green), and the three wings that were mechanically severed before hinge contraction: dist-sev#1 (dark red), dist-sev#2 (purple) and prox-sev (yellow). (B) Shows T1 transition rates in the two wings suffering laser ablation in the extra-cellular matrix (ECM) just prior to phase II: ECM_AntCut (cyan), ECM_DistCut (black), along with WT (blue) for comparison. (C–F) Effective proportions of cell–cell connections that are lost (blue) or gained (red) in different directions in the severed hinge-blade video (prox-sev). These effectives proportions were calculated for all time points as described in Figure 7, and are displayed at 17.5 hAPF (peak of negative shear rate by cell rearrangements), 21 hAPF (peak of correlation effects), 24 hAPF (shear rate by cell rearrangements crosses zero) and 25.5 hAPF (peaks of positive shear rate by cell rearrangements). Note that the timing of these events differs slightly from the corresponding times in unperturbed wings.
Figure 8—figure supplement 3
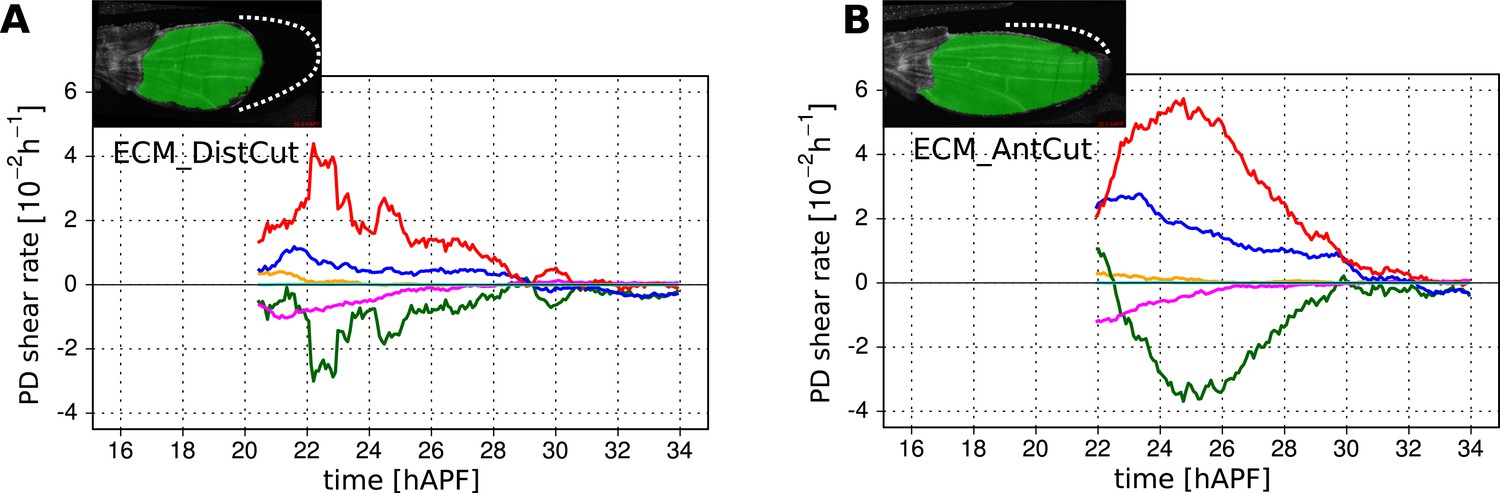
Total cellular contributions to tissue shear in wing blades after laser-severing of the extracellular matrix.
(A) Blade anisotropic deformation rate and its cellular contributions in a WT wing in which the extracellular matrix was distally ablated shortly before phase II (ECM_DistCut). (B) Blade anisotropic deformation rate and its cellular contributions in a WT wing in which the extracellular matrix was anteriorly ablated shortly before phase II (ECM_AntCut).
Figure 9 with 2 supplements
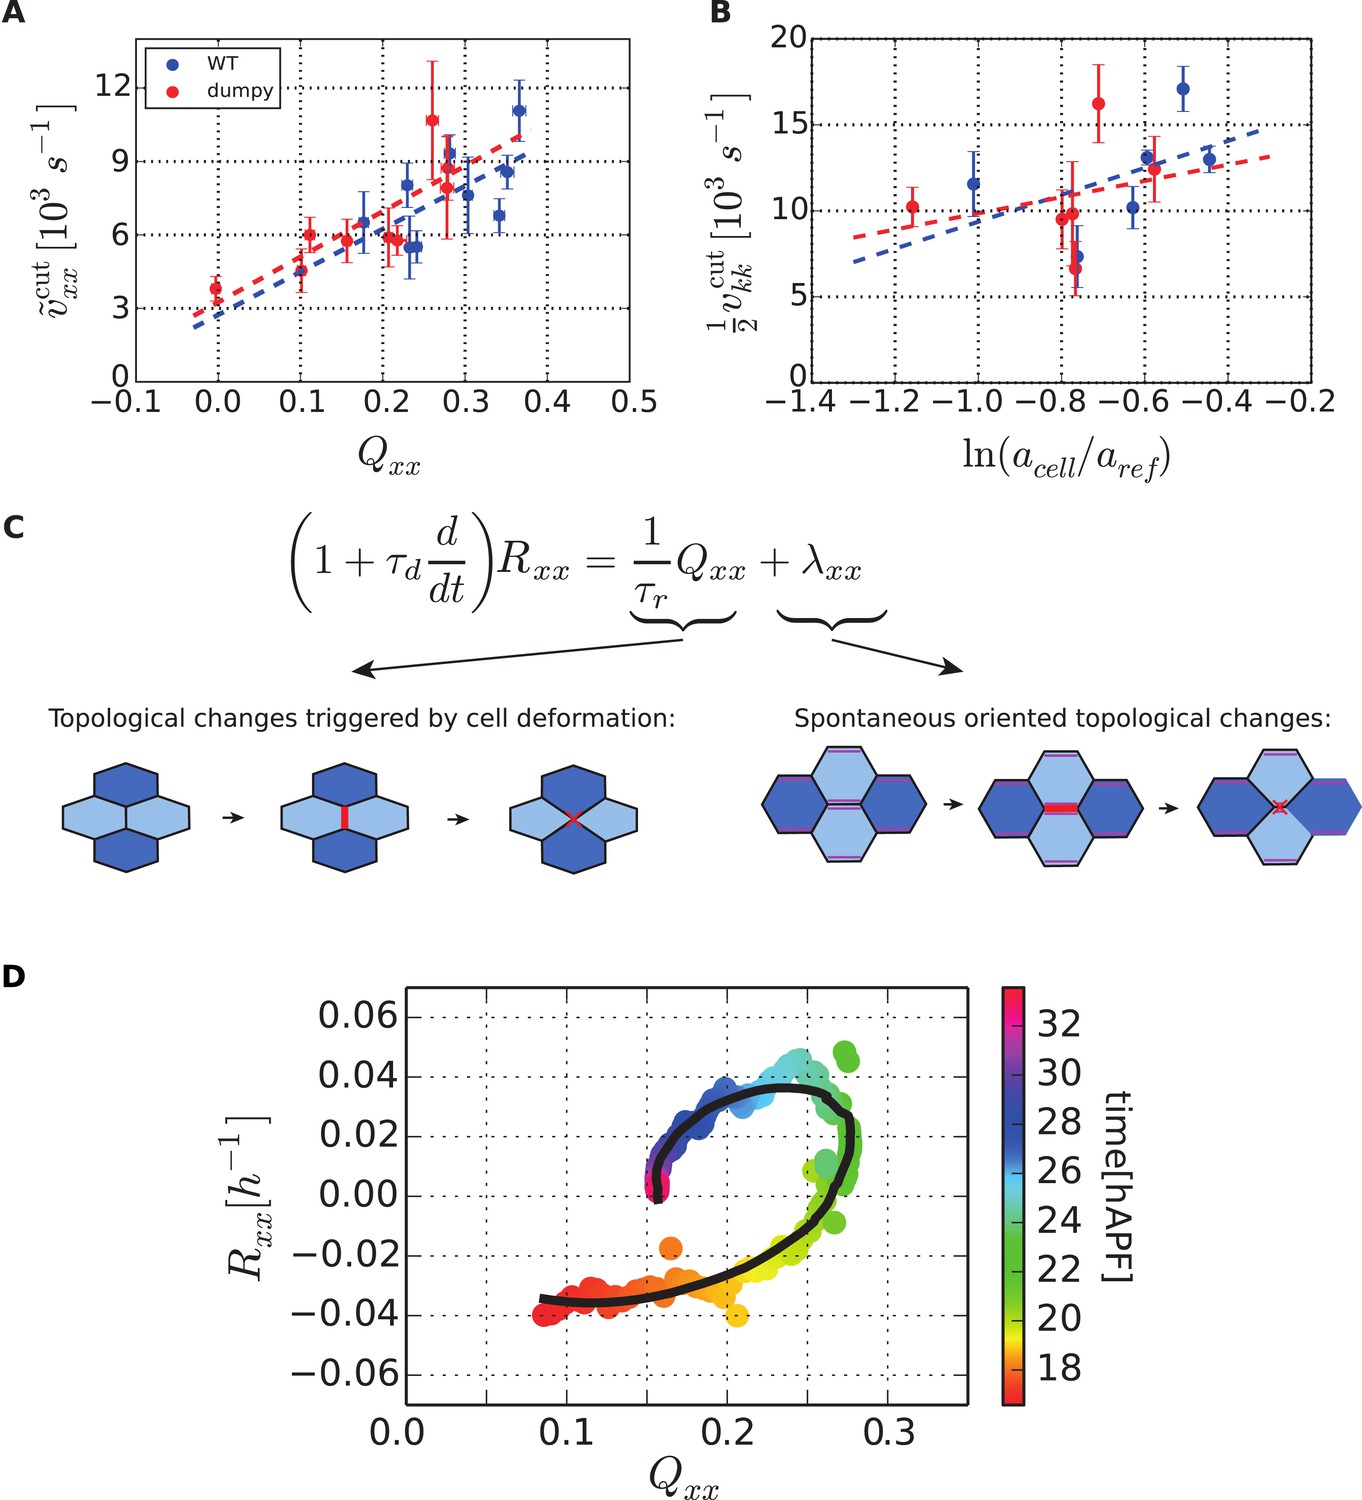
Dependency of stresses and topological changes on cell deformation.
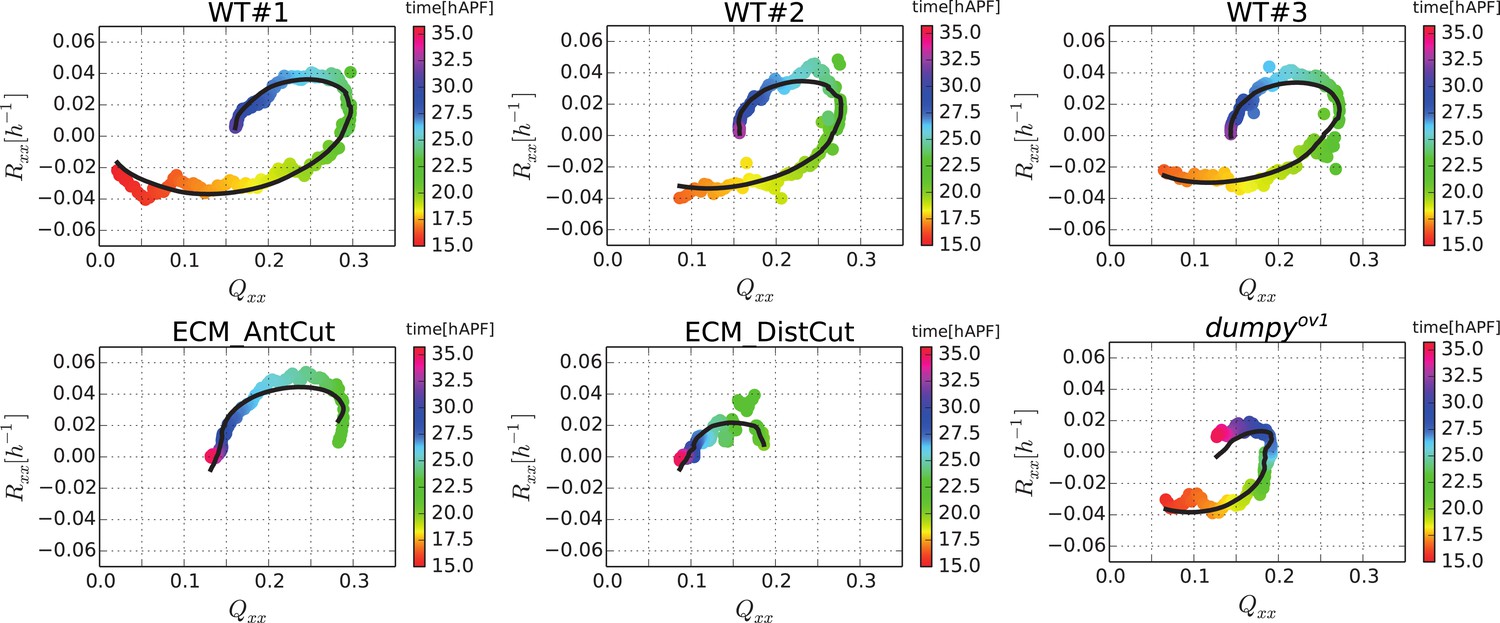
(A) Anisotropic recoil of circular cut boundaries after laser ablation of the blade at 22 hAPF, as a function of the projected average cell elongation in the region of the cut, for WT and dumpyov1 wings. (B) Isotropic recoil of circular cut boundaries after laser ablation of the blade at 22 hAPF, as a function of the average cell area in the region of the cut, for WT and dumpyov1 wings. (C) Topological changes are driven either by cell elongation or by polarity-dependent processes, with a delay τd. (D) Shear due to topological changes as a function of cell elongation in the blade. Experimental points are color-coded according to time. The black line is a fit of Equation 5 shown in (C) to the experimental data. Due to a delay τd in the response of topological changes to cell elongation, data points follow a spiraling curve during wing morphogenesis.
Figure 9—figure supplement 1
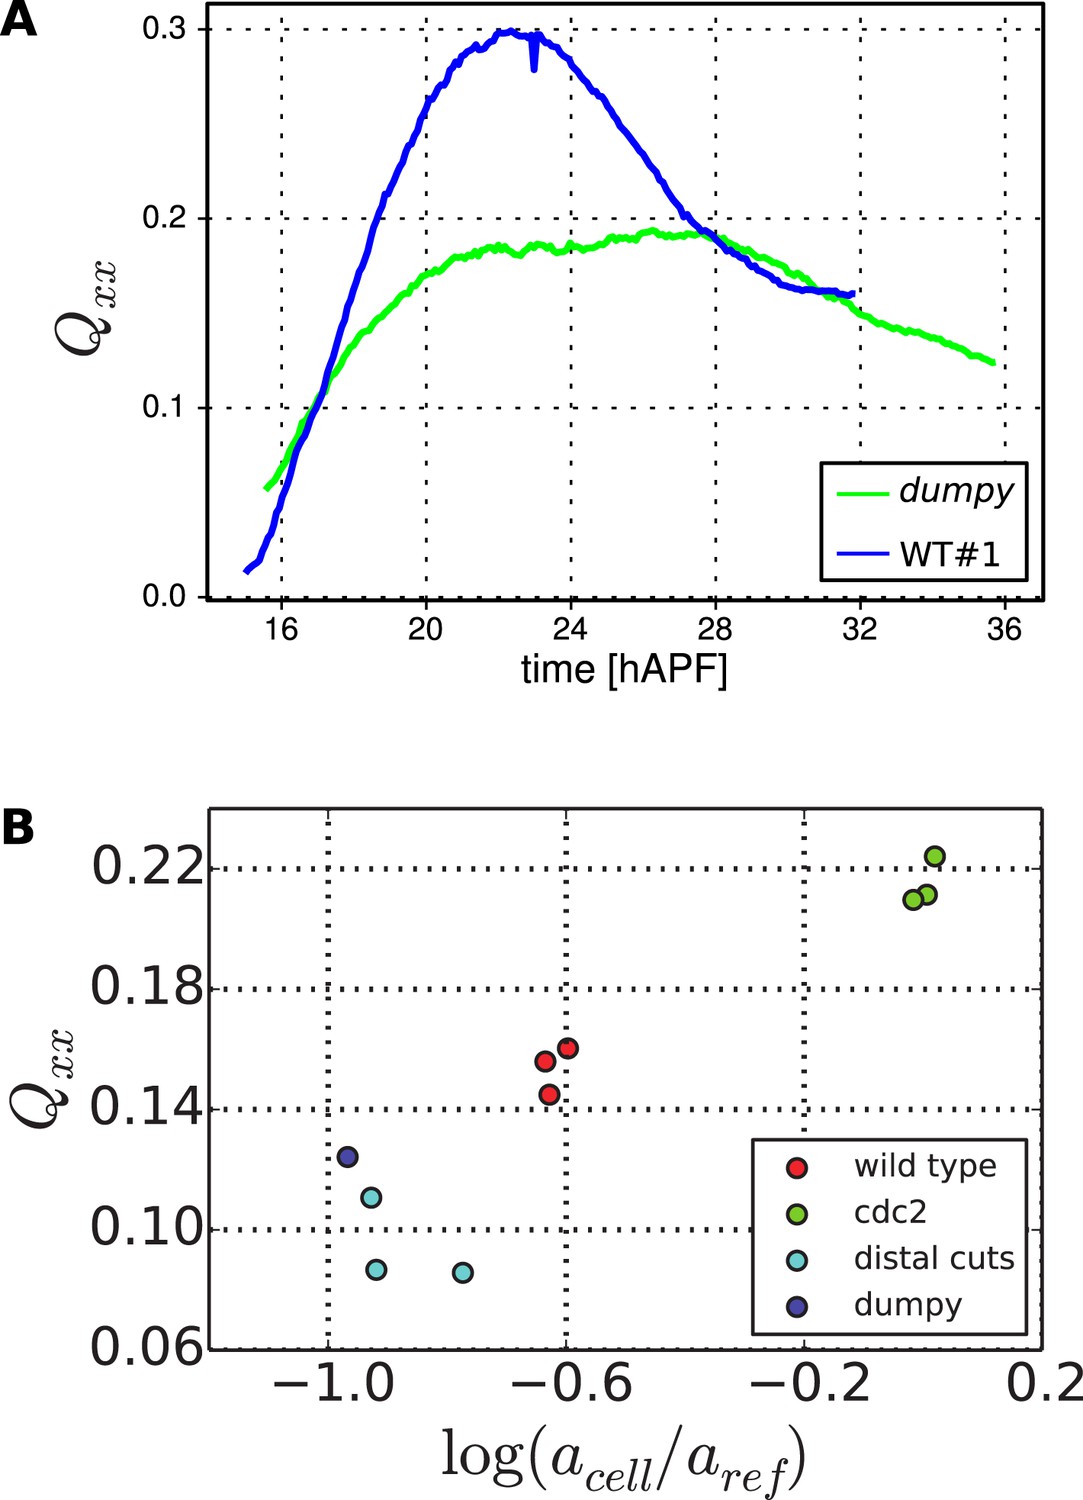
Cell elongation state.
(A) Average cell elongation state in the wing blade as a function of time. This quantity is obtained from the triangulated network of cells in WT and dumpyov1 wings (blue and green curves, respectively). (B) Average final cell elongation as a function of the final cell area in the blade, for WT, dumpyov1 and cdc2E1-E24 wings, as well as WT wings in which the extracellular matrix was ablated. Note that in cdc2E1-E24 mutant wings, cell divisions were inhibited from about 16 hAPF on.
Figure 9—figure supplement 2
Shear due to topological changes as a function of cell elongation in the blade for 6 analyzed wings.
Experimental points are color-coded according to time. Black lines are the results of a joint fit of Equation 5 to the six wings, with a single choice of the parameters τr and τd, and different values of λxx (see Table 1).
Figure 10 with 2 supplements
Continuum mechanical model of wing morphogenesis.
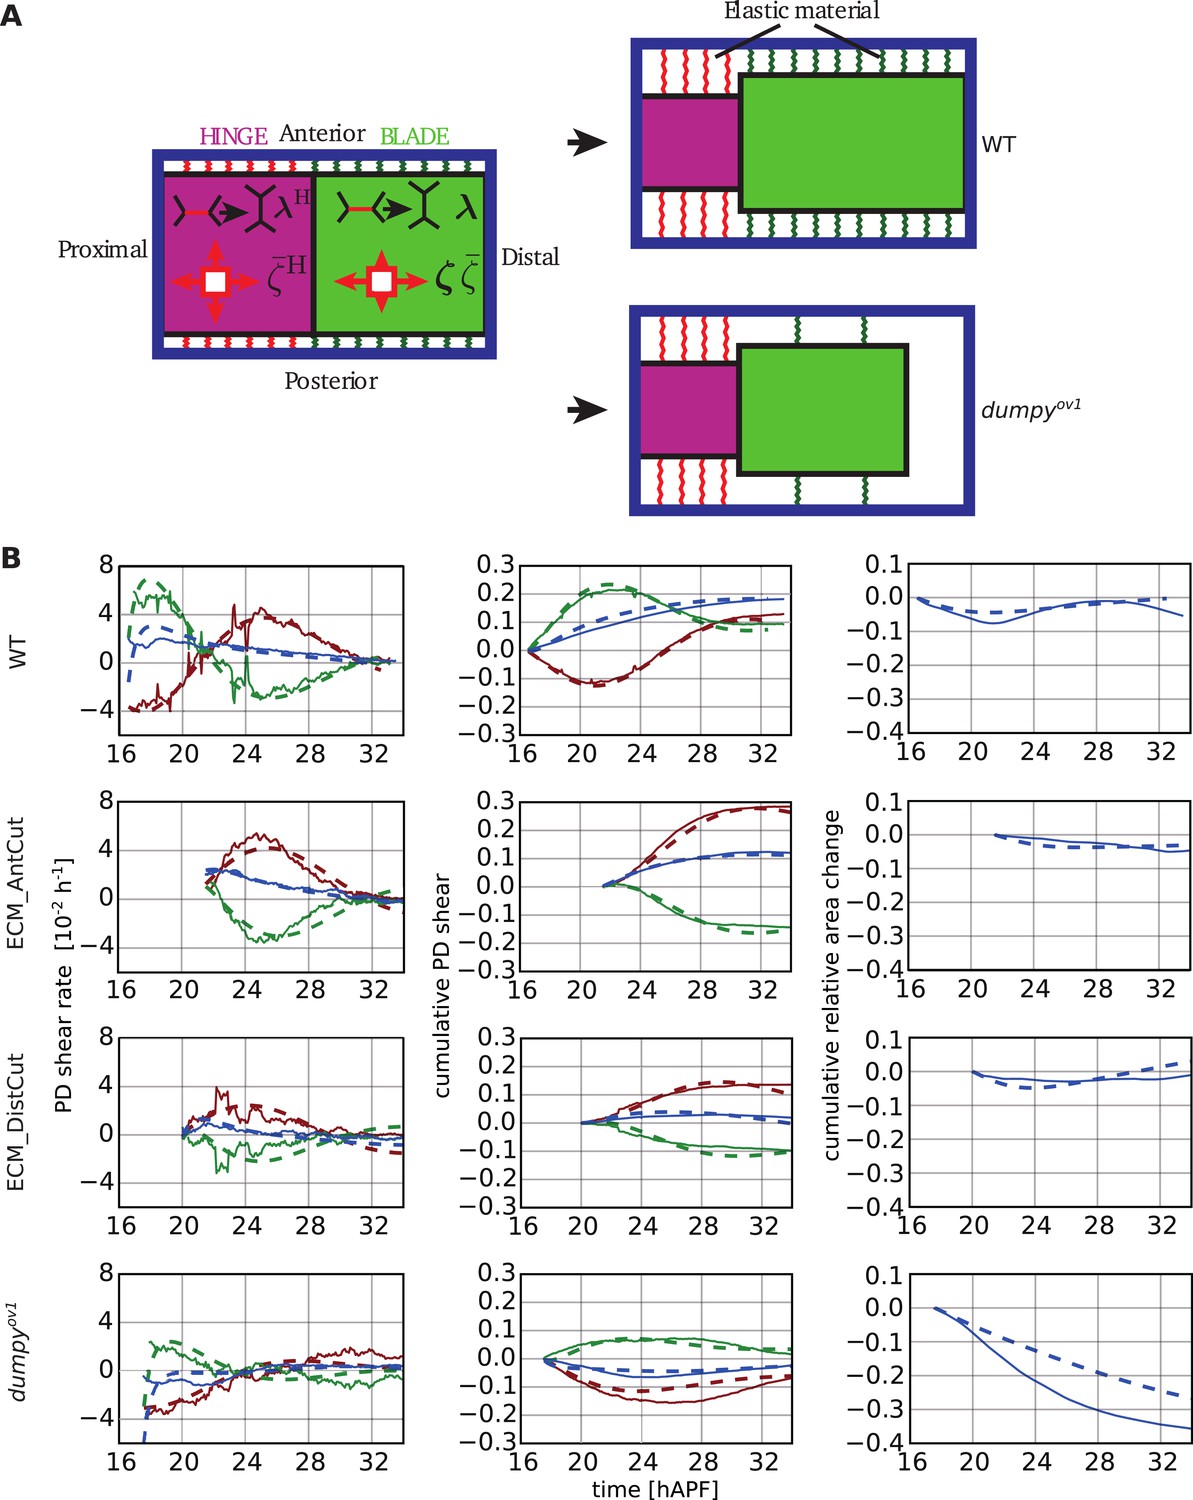
(A) Schematics of the wing model: the hinge and blade are represented by rectangles. Within each rectangle, the tissue is subjected to cell-autonomous anisotropic and isotropic stresses ζ and , and to topological changes driven by cell polarity-dependent processes λ. The complex elastic material connecting the wing to the cuticle is represented by AP-oriented elastic links (green and red springs on the cartoon) and PD-oriented springs (see Figure 10—figure supplement 1). In WT wings, the blade distal end is fixed, while it is free to move in the dumpyov1 mutant. (B) (Left) Experimental (solid line) and theoretical (dashed line) time courses of tissue shear rate (blue curves), cell elongation change (green curves) and shear due to topological changes (red curves), in the blade and along the PD axis. (Middle) Experimental and theoretical time courses of cumulative tissue shear (blue curve), cell elongation (green curve) and cumulative shear due to topological changes (red curves), in the blade and along the PD axis. (Right) Experimental and theoretical cumulative relative blade area change. Model parameters were obtained by a fitting procedure to experimental data (Tables 1, 2). The continuum mechanical model recapitulates cell shape changes and tissue flow during wing morphogenesis.
Figure 10—figure supplement 1

Schematics of the rectangle model.
(A) The hinge and blade are represented by two rectangles connected to an external frame representing the cuticle (blue rectangle). AP-oriented elastic springs at the anterior and posterior sides, with elastic moduli kH and k, resist change of heights of the rectangle. In addition, two PD-oriented elastic springs constrain the length of the hinge and blade with elastic moduli kPD and . In WT wings, the blade is firmly attached distally to the cuticle. To represent the wing whose ECM is ablated distally, a free boundary is introduced on the distal side of the blade rectangle. Similary, anterior ablation of the ECM is represented by removing anterior springs, k = 0. To represent the dumpyov1 mutant, distal links are removed while anterior and posterior links are weakened. (B) Geometry of rectangle deformation. The position of the hinge-blade interface is labeled xBH, the total length of the wing L, the heights of the hinge and blade hH and h. Lower plots: representation of the velocity profiles in the x and y direction in the hinge and blade, in the rectangle model, for WT wings.
Figure 10—figure supplement 2
Continuum mechanical model in the hinge.
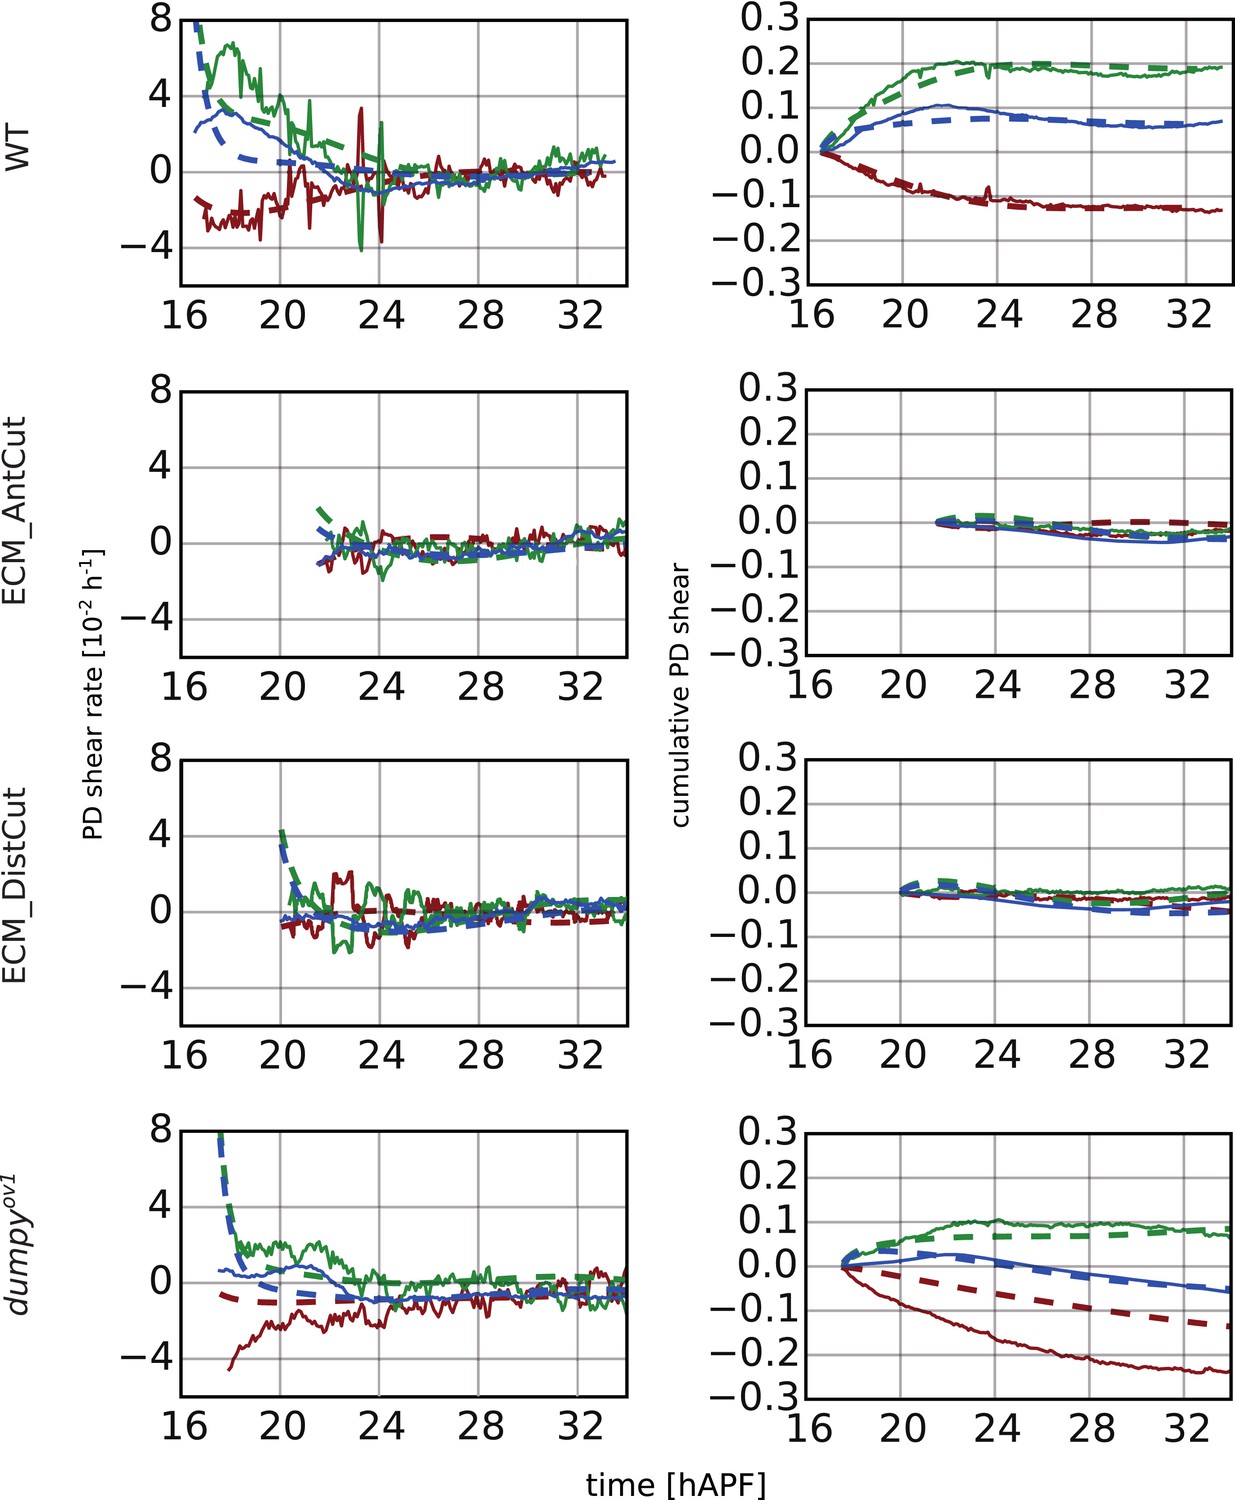
(Left) Experimental and theoretical time courses of tissue shear rate (blue curves), cell elongation change (green curves) and shear due to topological changes (red curves), in the hinge and along the PD axis. (Right) Experimental and theoretical time courses of cumulative tissue shear (blue curve), cell elongation (green curve) and cumulative shear due to topological changes (red curves), in the hinge and along the PD axis. Model parameters were obtained by a fitting procedure to experimental data (Tables 1, 2).
Videos
Video 1
Laser ablations of the apical extracellular matrix present in the space between the tissue and the cuticle.
Green lines indicate the site of ablation right before ablation.
Video 2
Synchronized time-lapses of wild-type (WT) and dumpyov1 wings.
The synchronization is based on the time when histoblast nests merge at ∼26.5 hAPF.
Video 3
Dumpy::YFP distribution in a 40 µm deep z-stack that was manually annotated to identify the regions where the protein is present.
https://doi.org/10.7554/eLife.07090.010
Video 4
Cell outline obtained from the segmentation procedure.
https://doi.org/10.7554/eLife.07090.014
Video 5
High resolution video of a WT wing expressing Ecad::GFP.
https://doi.org/10.7554/eLife.07090.015
Video 6
Dynamic patterns of tissue shear and of its cellular contributions in a WT wing.
Line segments are nematic representations of shear.
Video 7
Dynamic patterns of tissue shear and of its cellular contributions in a dumpyov1 mutant.
Line segments are nematic representations of shear.
Video 8
Video of a WT wing in which the extracellular matrix was laser-ablated anteriorly.
https://doi.org/10.7554/eLife.07090.028
Video 9
Video of a WT wing in which the extracellular matrix was laser-ablated distally.
https://doi.org/10.7554/eLife.07090.029
Video 10
Time evolution of the rectangles obtained from the rectangle model in a WT wing.
https://doi.org/10.7554/eLife.07090.038
Video 11
Time evolution of the rectangles obtained from the rectangle model in a dumpyov1 wing.
https://doi.org/10.7554/eLife.07090.039
Video 12
Time evolution of the rectangles obtained from the rectangle model in a WT wing where the extracellular matrix was ablated distally at the onset of phase II.
https://doi.org/10.7554/eLife.07090.040
Video 13
Time evolution of the rectangles obtained from the rectangle model in a WT wing where the extracellular matrix was ablated anteriorly at the onset of phase II.
Note that length of the hinge is increased by a correction term described in Appendix 4, ‘Fitting of the rectangle model to cell and tissue shape in the hinge and blade’.
Tables
Table 1
Coefficients describing tissue properties in Equation 5 are fitted with single values of time-scales τr and τd in hinge and blade while λxx was allowed to vary among different wings (see Figure 9—figure supplement 2)
| WT #1 | WT #2 | WT #3 | ECMAntCut | ECMDistCut | DP | ||
|---|---|---|---|---|---|---|---|
| Blade | τr [h] | 1.7 ± 0.1 | |||||
| τd [h] | 4.2 ± 0.3 | ||||||
| λxx [h−1] | −0.11 ± 0.01 | −0.11 ± 0.01 | −0.10 ± 0.01 | −0.10 ± 0.01 | −0.068 ± 0.007 | −0.094 ± 0.008 | |
| Hinge | [h] | 4.6 ± 2 | |||||
| [h] | 2.4 ± 1 | ||||||
| [h−1] | −0.05 ± 0.01 | −0.05 ± 0.01 | −0.04 ± 0.01 | −0.03 ± 0.01 | −0.01 ± 0.01 | −0.04 ± 0.01 | |
-
WT; wild type.
Table 2
Parameters of the rectangle model are divided in three groups describing blade tissue properties, hinge tissue properties and external links
| WT | ECMDistCut | ECMAntCut | Dp | ||||
|---|---|---|---|---|---|---|---|
| Tissue | blade | cell autonomous shear stress | 0.333 ± 0.003 | 0.316 ± 0.004 | |||
| shear elastic modulus | 1 | ||||||
| cell area contractility | 0.05 ± 0.03 | ||||||
| area elastic modulus | 2.07 ± 0.09 | ||||||
| area viscosity coefficient | 49 ± 2 | ||||||
| hinge | cell autonomous shear stress | 0 | |||||
| shear elastic modulus | 0 | ||||||
| External links | blade | effective AP elastic constant | 0.5 ± 0.1 | 0 | 0.005 ± 0.007 | ||
| effective PD elastic constant | 4.91 ± 0.04 | 5.3 ± 0.2 | |||||
| friction coefficient | 21.3 ± 0.8 | 22.1 ± 0.6 | |||||
| distal connections | – | Yes | No | Yes | No | ||
| hinge | effective AP elastic constant | 67.8 ± 0.4 | 78 ± 2 | ||||
| effective PD elastic constant | 9.50 ± 0.07 | 16.8 ± 0.6 | |||||
| friction coefficient | 21.3 ± 0.8 | 22.1 ± 0.6 | |||||
-
Cell autonomous shear stress in wing blade of WT and dumpyov1 are determined from circular laser cut experiments. Unperturbed and mechanically perturbed WT wings are first simultaneously fitted using results listed in Table 1. Then, the dumpyov1 wing is fitted keeping the values of hinge and blade tissue parameters the same as in WT. The effective anterior-posterior (AP) and PD elastic constants describe effects of external elastic elements providing resistance to changes in size of blade and hinge along the AP and PD direction. All quantities are normalized by the elastic shear modulus of the blade tissue K. Quantities containing spatial dimensions are also normalized by the initial length L0 of the WT wing. Uncertainties reported for the parameters in this table (expect for the cell autonomous shear stress ζxx) were determined by the fit. Note that they do not reflect uncertainties arising from approximations made in the rectangle model (supplement section 4) and from pre-processing of experimental data (supplement section 1.6).
Download links
A two-part list of links to download the article, or parts of the article, in various formats.
Downloads (link to download the article as PDF)
Open citations (links to open the citations from this article in various online reference manager services)
Cite this article (links to download the citations from this article in formats compatible with various reference manager tools)
Interplay of cell dynamics and epithelial tension during morphogenesis of the Drosophila pupal wing
eLife 4:e07090.
https://doi.org/10.7554/eLife.07090


