Single-fluorophore membrane transport activity sensors with dual-emission read-out
- Carnegie Institution for Science, United States
- Italian National Research Council, Italy
- University of Potsdam, Germany
Figures
Figure 1 with 2 supplements

Steady-state and time-resolved fluorescence analysis of AmTrac sensors.
(A) Scheme of AmTrac sensors showing left (LL) and right linker (RL) positions (top). Table indicates amino acid composition of linkers in AmTrac sensors. (B) Normalized fluorescence spectra, excitation (dashed lines; λem 514 nm), and emission (solid line; λexc 485 nm). Traces in grey represent blank (background fluorescence of untransformed yeast). Values relate to major peak of AmTrac-GS (n = 3). (C) Time-resolved fluorescence decay kinetics of AmTrac-GS and -LE in presence and absence of 1 mM NH4Cl (λexc 475 nm; λem 514 nm; n = 3). (D) Time-resolved fluorescence anisotropy r(t) of AmTrac-GS and -LE in presence and absence of 1 mM NH4Cl (λexc 475 nm; λem 514 nm).
Figure 1—figure supplement 1
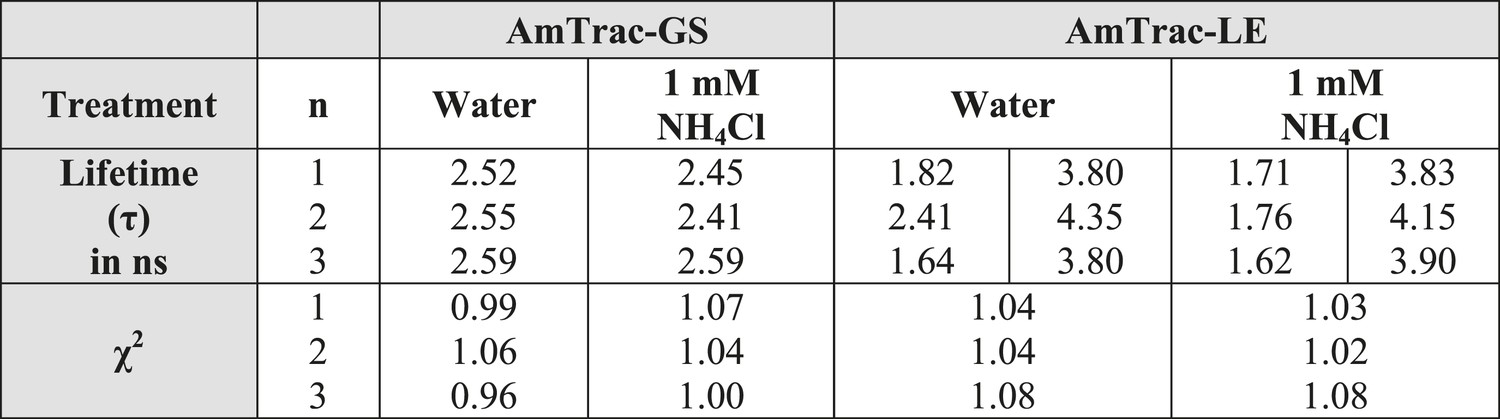
Summary of lifetime components (τ) and χ2 values obtained for AmTrac-GS and -LE treated with water as control or 1 mM NH4Cl.
In case of multiphasic lifetime components, two values are listed. Data were fitted single- and bi-exponentially (n = 3).
Figure 1—figure supplement 2

Time-resolved fluorescence decay kinetics of AmTrac-LE in presence and absence of 1 mM NH4Cl (λexc 475 nm, λem 514 nm).
The according bi-exponential fit curves are shown in green and blue, respectively.
Figure 2 with 1 supplement
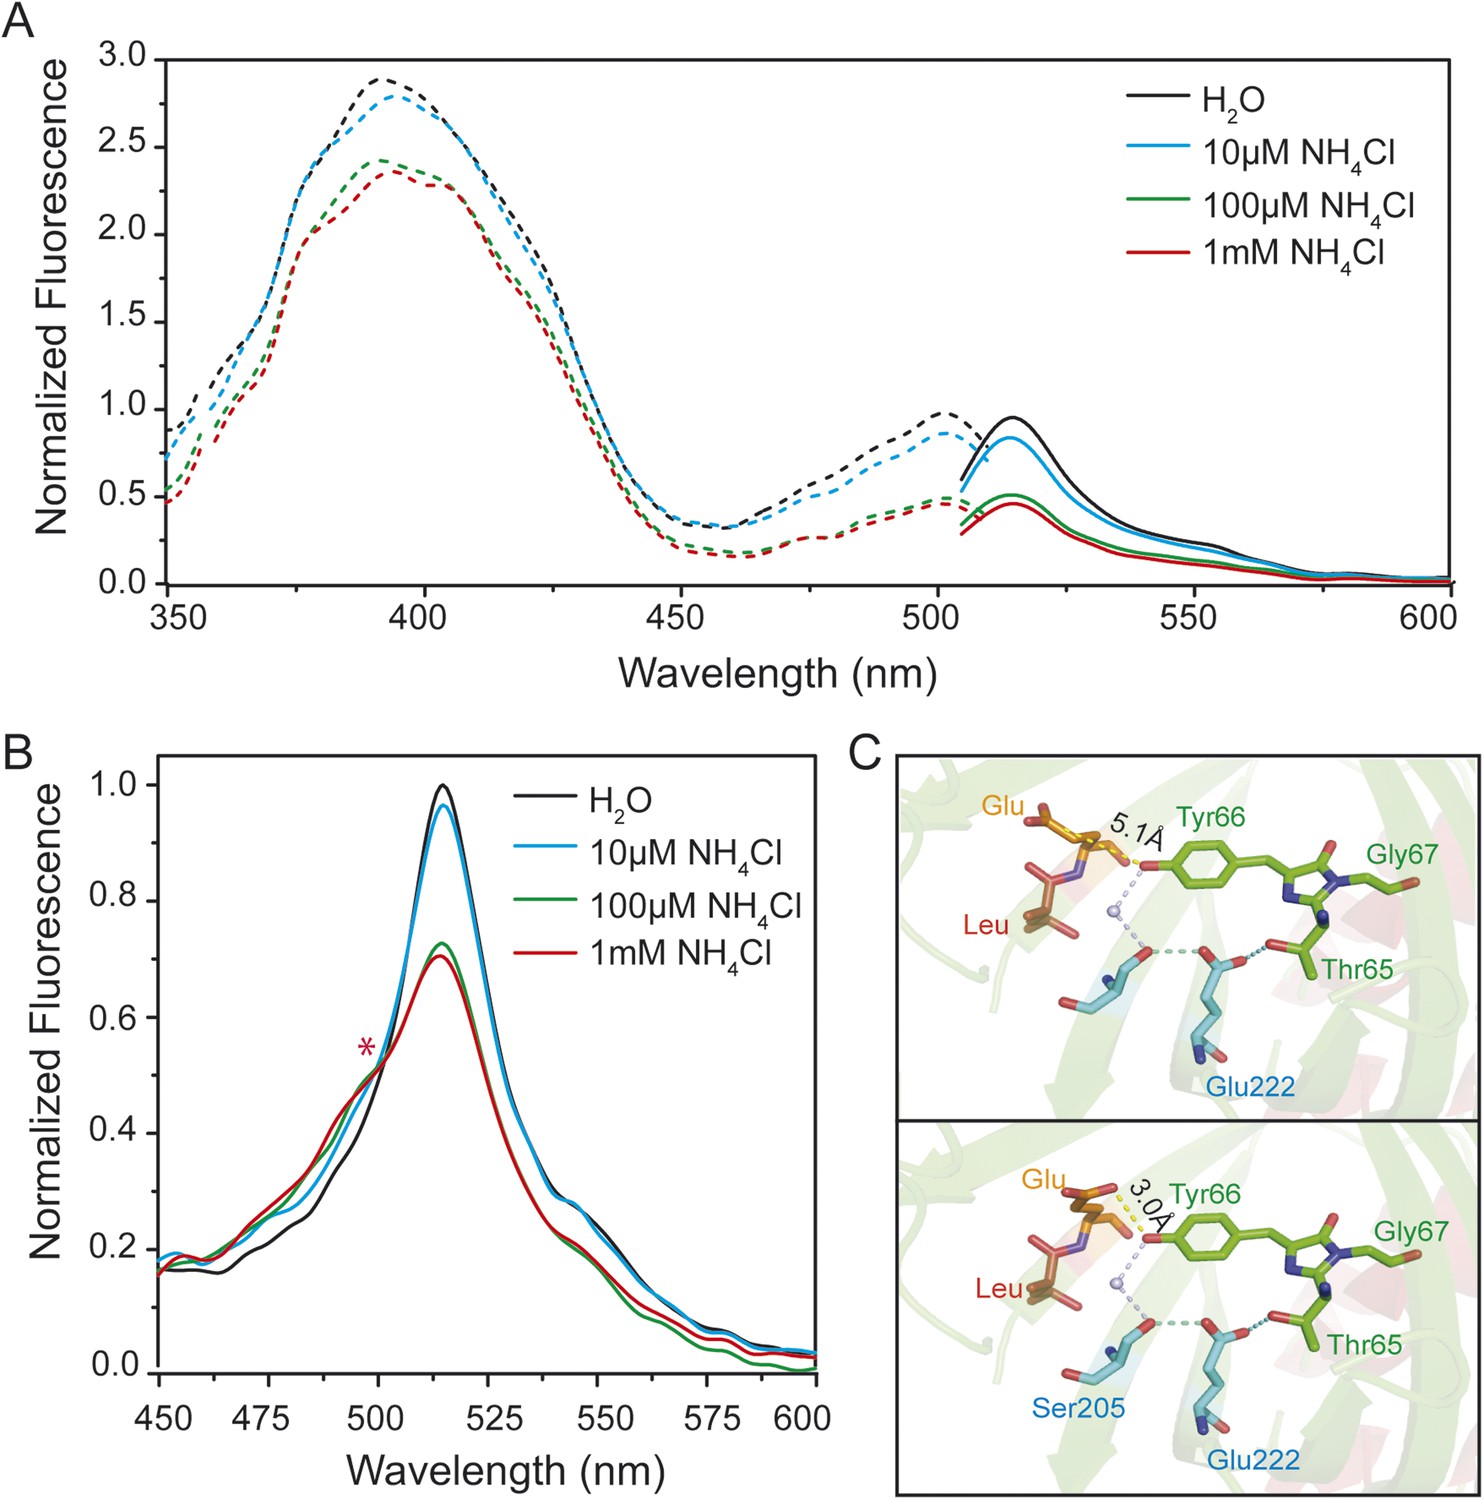
Steady-state fluorescence spectra for excited-state proton transfer (ESPT) analysis of yeast transformed with AmTrac-LE and postulated structural differences.
(A) Fluorescence excitation (dashed line; λem 530 nm) and emission (solid line; λexc 485 nm) after treatment with NH4Cl at indicated concentrations. Values were normalized to the major peak of the B-band (n = 3). (B) Fluorescence emission spectrum (λexc 395 nm). Values normalized to major maximum of the water-treated control (n = 3). Asterisk (*) indicates iso-emissive point. (C) Chromophore environment of crystalized circularly permuted enhanced green fluorescent protein (cpEGFP, PDB 3EVP). Chromophore is depicted in green; residues involved in ESPT via a buried water molecule in blue, left linker residues in orange and red. Top and bottom illustrations show different rotamers of glutamate Glu148 with indicated distances of hydrogen bonds to chromophore.
Figure 2—figure supplement 1
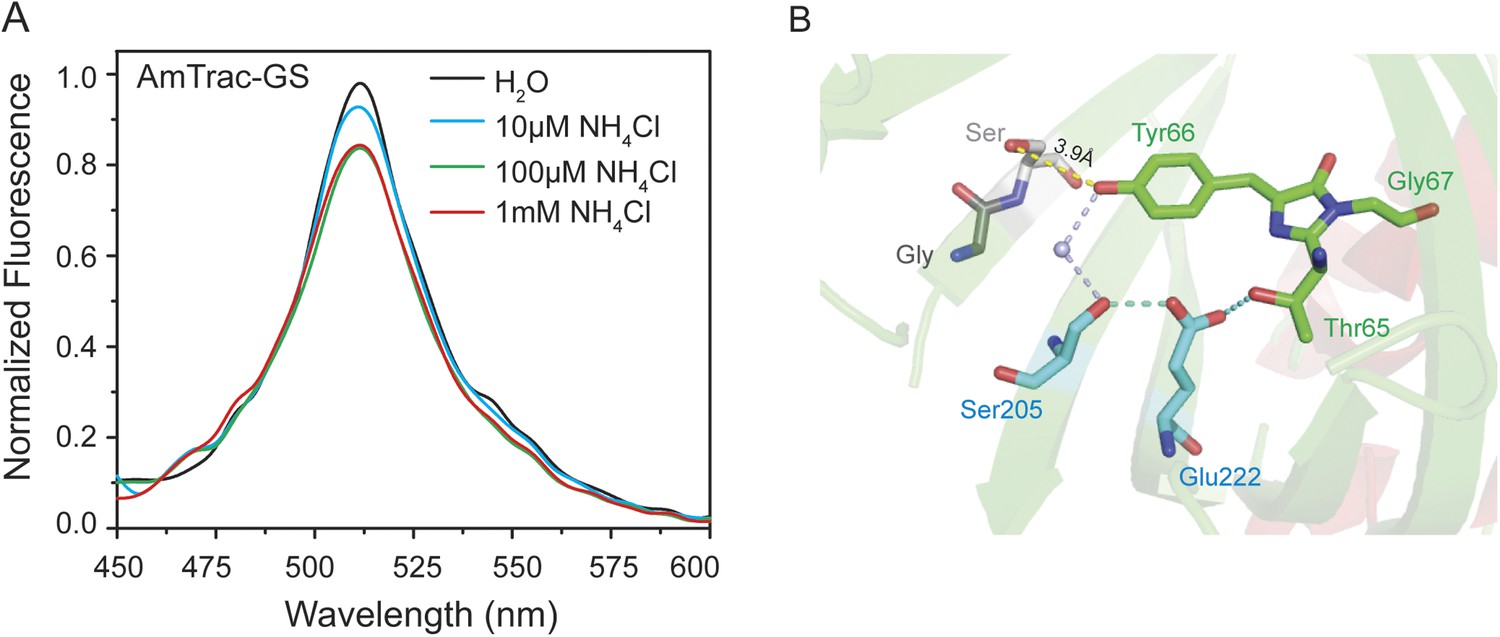
Steady-state fluorescence spectrum for ESPT analysis of intact yeast transformed with AmTrac-GS (n = 3) and postulated structural differences.
(A) Fluorescence emission spectrum with λexc 395 nm after treatment with NH4Cl at the concentrations indicated. Values were normalized to the maximum of the water treatment. (B) Chromophore environment of crystalized cpEGFP (PDB 3EVP). The chromophore is depicted in green, the residues involved in ESPT via a buried water molecule in blue and the left linker residues GS that exchanged the LE linker, in grey. Only one linker orientation can be found, which can theoretically form weak hydrogen bonds with the chromophore (indicated distance of the hydrogen bond to the chromophore).
Figure 3 with 2 supplements
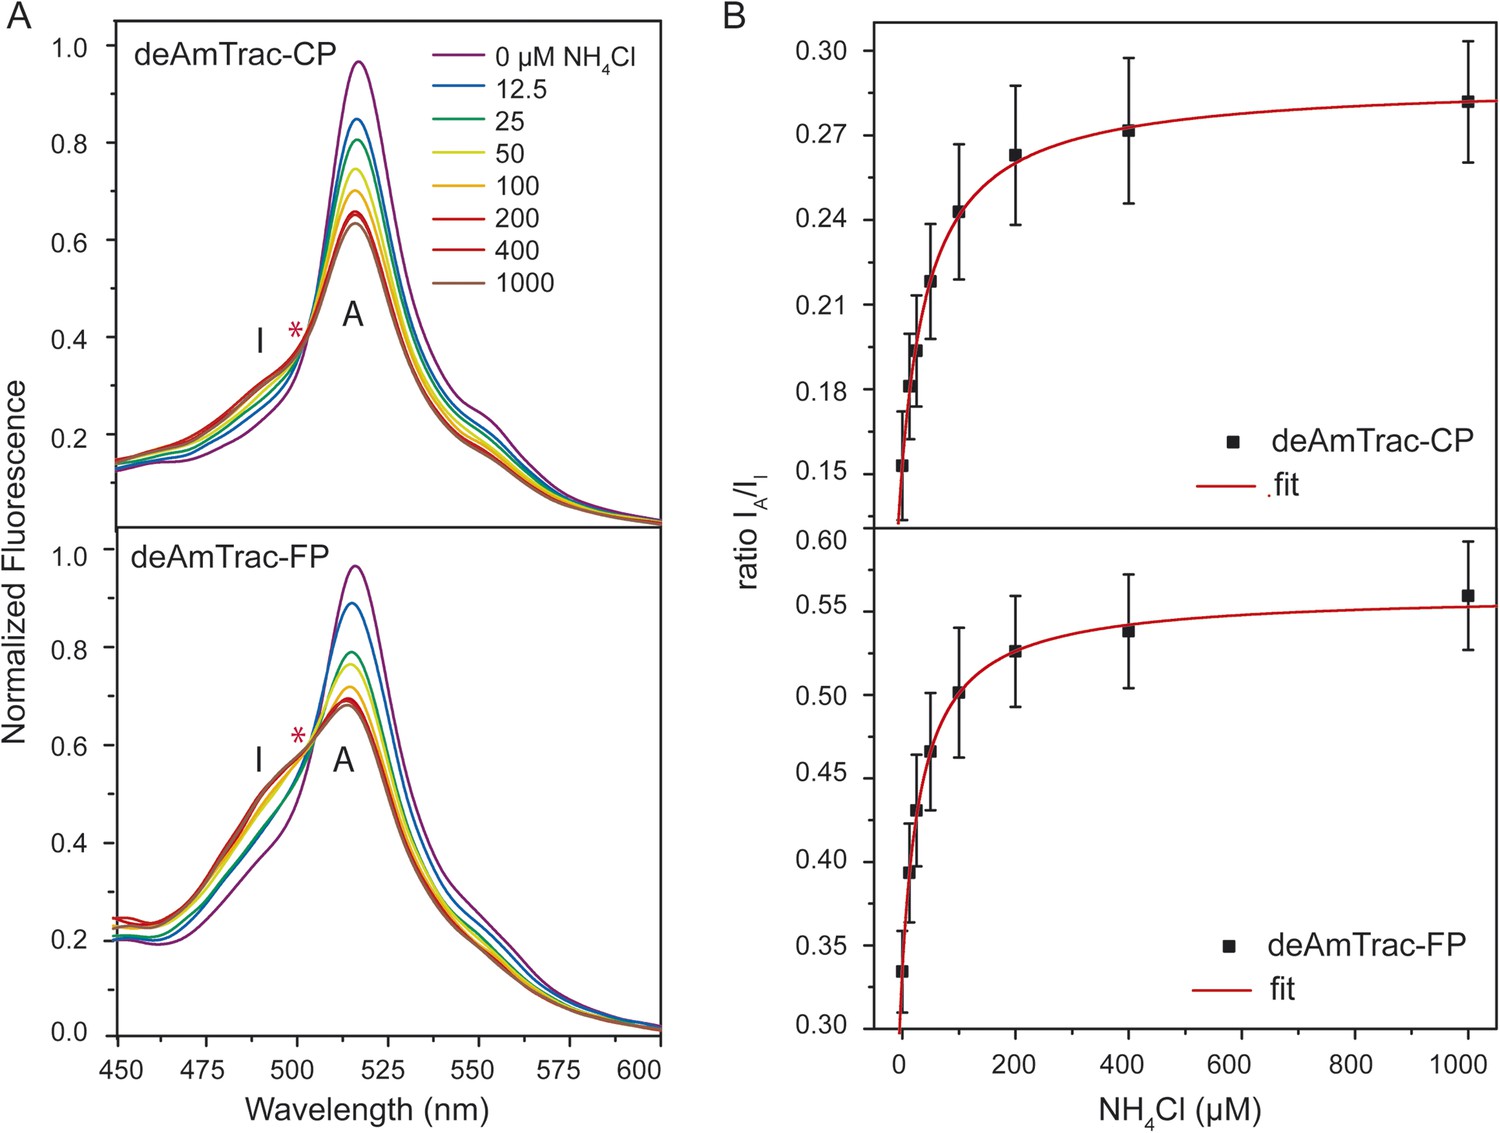
Steady-state fluorescence titration analysis of intact yeast transformed with deAmTrac-CP and -FP.
(A) Fluorescence emission spectrum (λexc 395 nm) recorded after NH4Cl addition (concentrations indicated). Values normalized to maximum of water treated control. Asterisks (*) indicate the iso-emissive point. A refers to the protonated A-state, I is the deprotonated intermediate I-state of the chromophore. (B) Titration of the fluorescence response at indicated NH4Cl concentrations plotted as ratio of the intensity of the A-state /I-state (IA/II) (mean ± SE; n = 5).
Figure 3—figure supplement 1
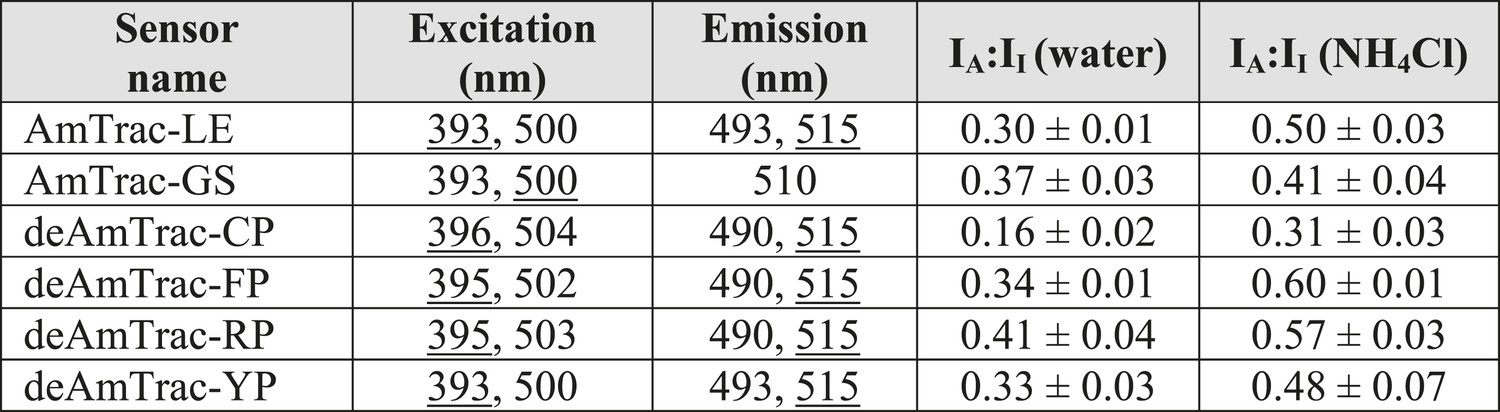
Summary of properties of AmTrac sensor variants in response to water or 1 mM NH4Cl with A-state excition (λexc = 395–400 nm).
In case of two maxima, the major peak is underlined. IA:II is the ratio of the emission intensity of the A-state (λem 490 nm of blue maximum) vs the intensity of the I-state (λem 515 nm of green maximum) (mean ± SE; n ≥ 3).
Figure 3—figure supplement 2
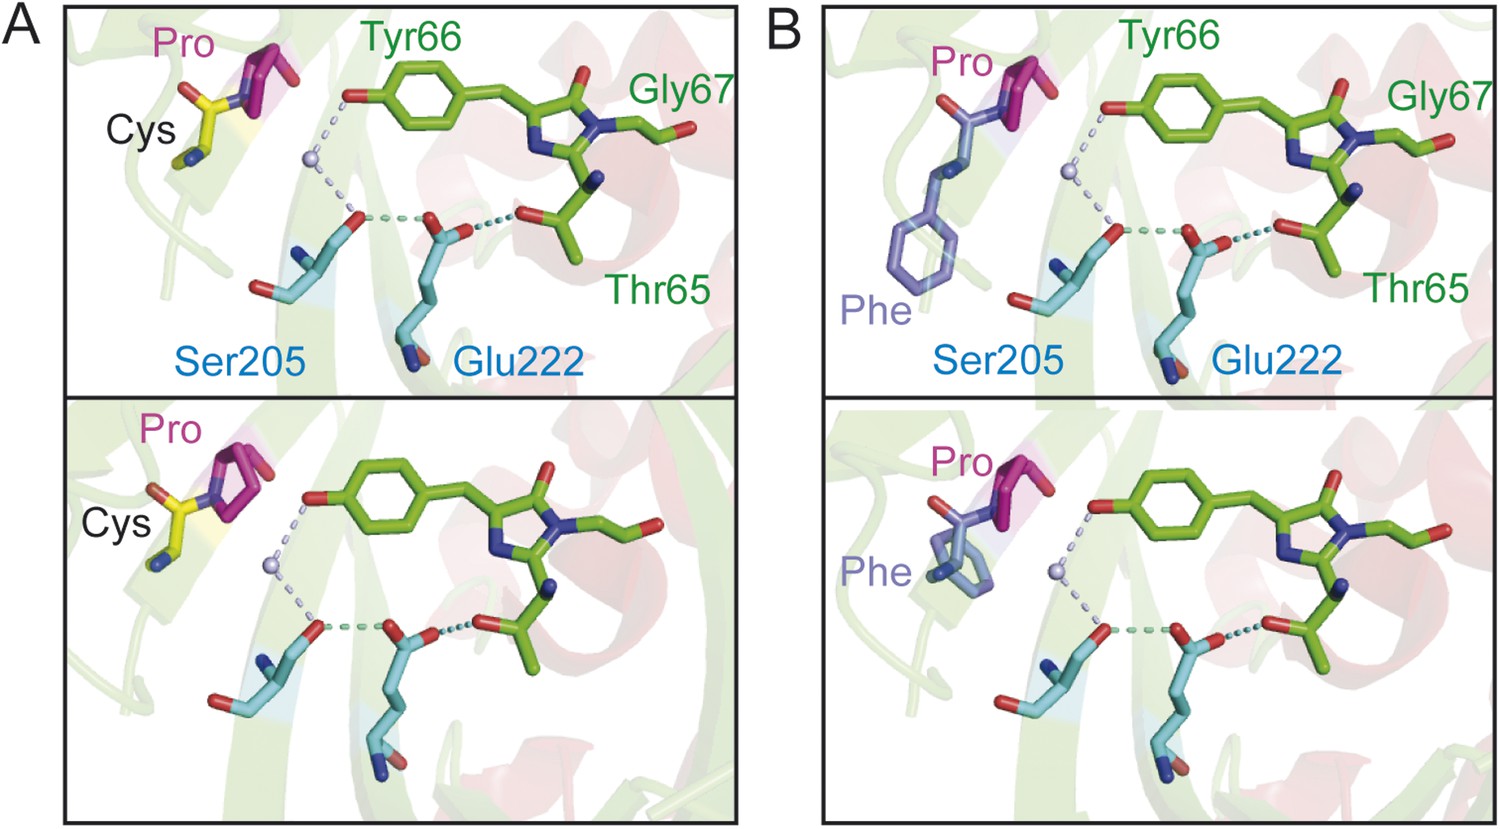
Chromophore environment of crystalized cpEGFP (PDB 3EVP).
The chromophore is depicted in green, the residues involved in ESPT via a buried water molecule in blue. The modified left linker residues are depicted in magenta and yellow for deAmTrac-CP (A) or magenta and purple for deAmTrac-FP (B). Different rotamers are shown for the residues CP and FP when replacing the LE linker in cpEGFP.
Figure 4 with 1 supplement

Response ratio and spectral analysis of mutant deAmTrac-CP and -FP.
(A) Fluorescence response to NH4Cl (indicated concentrations) plotted as ratio of the intensity of the A-state /I-state (IA/II). Data were normalized to water treated control (=1) (mean ± SE; n = 5). (B) Fluorescence emission spectra with λexc 395 nm recorded after treatment with NH4Cl (concentrations indicated). Values are normalized to the maximum of the water treatment (n = 3).
Figure 4—figure supplement 1

Yeast growth assay of Δmep1,2,3 strain (31019b) transformed with mutant deAmTracs.
Transformants were grown for 3 days on solid media containing the indicated ammonium concentrations or 1 mM arginine as growth control. Note, the high capacity mutants T464D + A141E grew weaker on high ammonium concentrations, most likely due to ammonium toxicity.
Figure 5
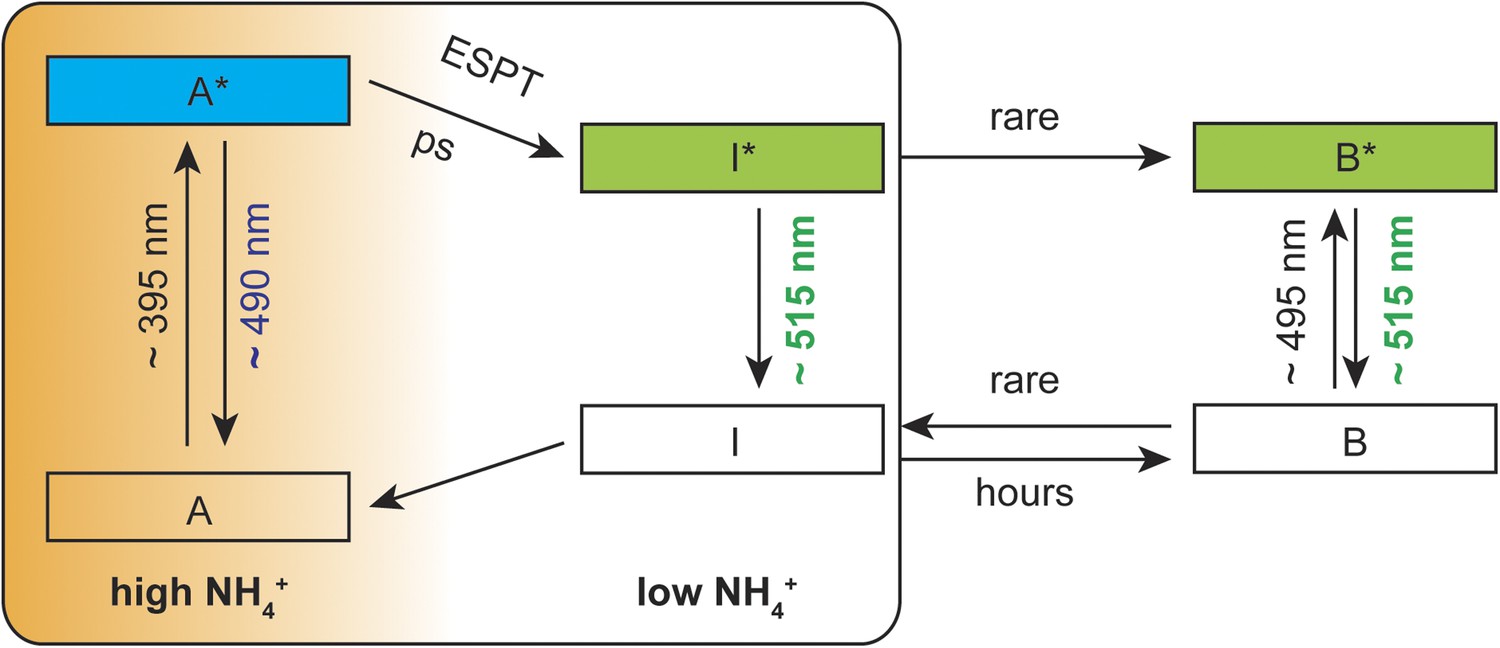
Suggested mechanistic ESPT model to describe the dual-emission in AmTrac-LE and deAmTracs during high and low ammonium transport activity.
A, protonated A-state of the chromophore; I, deprotonated intermediate state; B, deprotonated B-state. Asterisks (*) indicate the excited state upon illumination with the indicated wavelength.
Tables
Table 1
List of mutagenesis primers
| Primer name | Primer sequence |
|---|---|
| AmXX FW | GAAGGTCCTCGTCGTGGTCGGTTCGAGAAANNNNNNAACGTCTATATCAAGGCCG |
| AmFN RV | CCGCGCAGAGCAATAGCGCGACCACC ATTAAA GTTGTACTCCAGCTTGTGCC |
| T464D FW | GCA AGG GAT GGA TAT GGA TCG TCA CGG TGG CTT TGC |
| T464D RV | GCA AAG CCA CCG TGA CGA TCC ATA TCC ATC CCT TGC |
| Q61E FW | CCT TGT CTT CGC CAT GGA GCT CGG CTT CGC TAT GC |
| Q61E RV | GCA TAG CGA AGC CGA GCT CCA TGG CGA AGA CAA GG |
| A141E FW | CAA TGG GCG TTC GCA ATC GAG GCC GCT GGA ATC AC |
| A141E RV | GTG ATT CCA GCG GCC TCG ATT GCG AAC GCC CAT TG |
Download links
A two-part list of links to download the article, or parts of the article, in various formats.
Downloads (link to download the article as PDF)
Open citations (links to open the citations from this article in various online reference manager services)
Cite this article (links to download the citations from this article in formats compatible with various reference manager tools)
Single-fluorophore membrane transport activity sensors with dual-emission read-out
eLife 4:e07113.
https://doi.org/10.7554/eLife.07113


