Malaria-associated atypical memory B cells exhibit markedly reduced B cell receptor signaling and effector function
- National Institutes of Health, United States
- Emory University, United States
- University of Sciences, Technique and Technology of Bamako, Mali
Figures
Figure 1
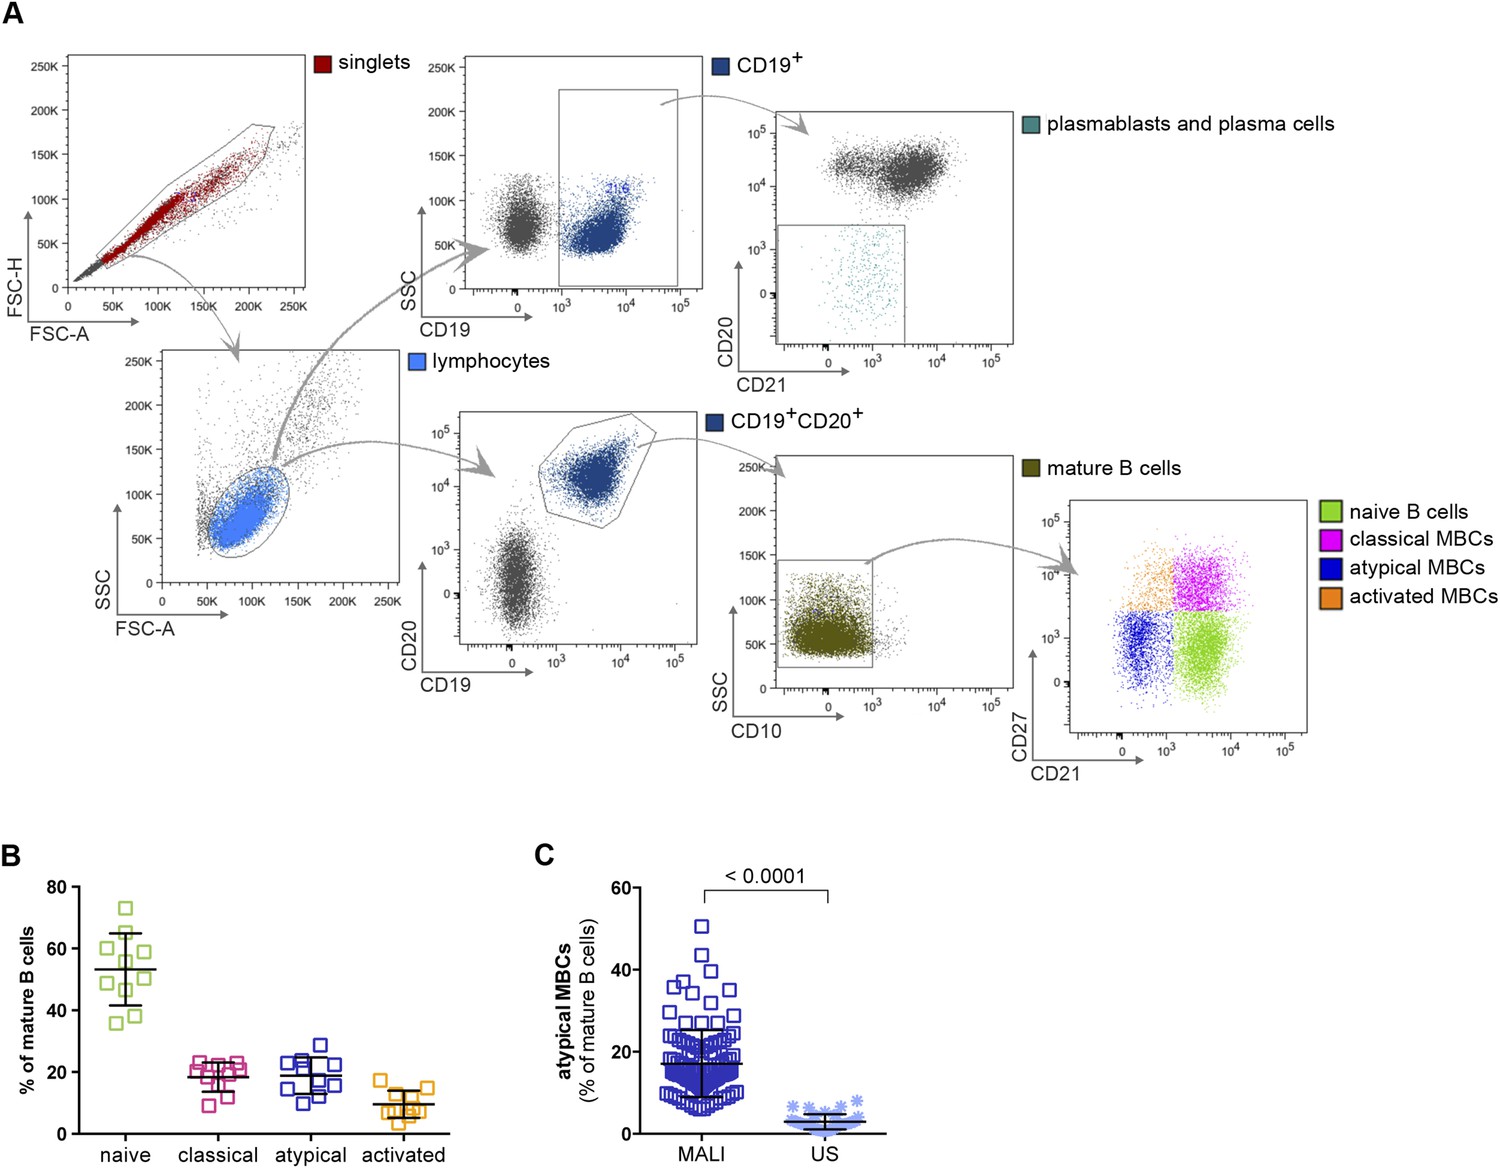
Atypical MBCs are markedly increased in individuals exposed to intense malaria transmission.
(A) Flow cytometry gating strategy to identify B cell subpopulations in a representative Malian adult. (B) Distribution of naïve B cells (CD10−CD19+CD20+CD21+CD27−), classical MBCs (CD10−CD19+CD20+CD21+CD27+), atypical MBCs (CD10−CD19+CD20+CD21−CD27−) and activated MBCs (CD10−CD19+CD20+CD21−CD27+) as a percentage of total mature B cells in representative Malian adults (n = 10 subjects). (C) Atypical MBCs as a percentage of total mature B cells in Malian adults (n = 107) and U.S. adults (n = 37). Horizontal bars and whiskers represent means and SD, respectively. p value determined by unpaired ttest.
Figure 2 with 2 supplements
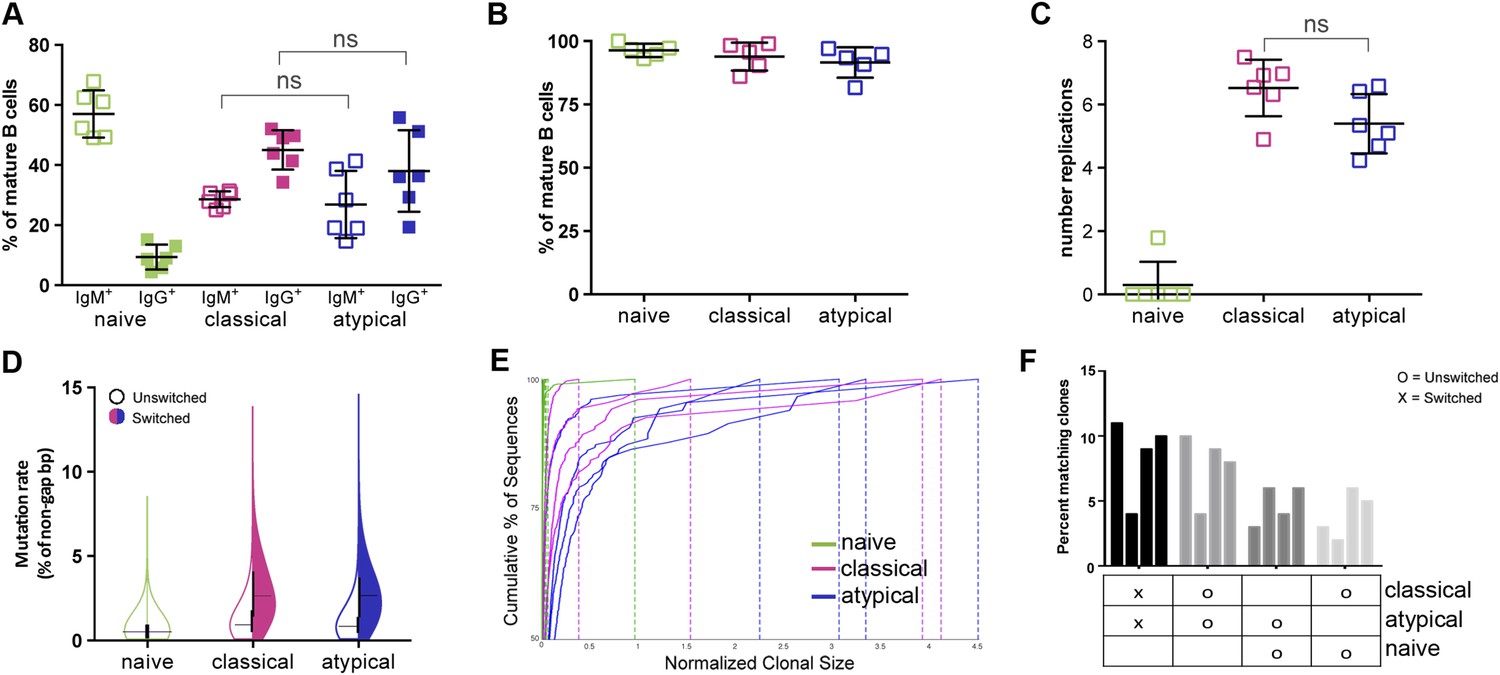
Atypical and classical MBCs are similar in isotype distribution, replication history and Ig repertoire characteristics.
(A) Flow cytometry data showing the distribution of IgM+ and IgG+ cells as a percentage of each B cell subpopulation in Malian adults (n = 7 subjects). (B) Purity of B cell subpopulations as a percentage of mature B cells following FACS sorting. (C) Average number of in vivo replications determined by KREC assay for each B cell subpopulation in Malian adults (n = 6 subjects). (D) Somatic hypermutation rates of unswitched and switched B cell subpopulations based on IgH sequence analysis. Shown is average of 4 Malian adults. (E) Clonality of B cell subpopulations determined by IgH sequence analysis and displayed by size-ranking clonal lineages from top (largest) to bottom (smallest) along the y-axis representing 50% of all sequences from the largest clones. X-axis is the normalized lineage size of each clone (percentage of the total number of sequences). Shown is data from 4 Malian adults. (F) Percentages of IgH sequences in both unswitched and switched B cell subpopulations that are shared by other subpopulations. Each bar represents a different subject (n = 4 subjects). Horizontal bars and whiskers represent means and SD, respectively. Horizontal bars on (D) represent means. p values determined by ANOVA with Tukey's multiple comparisons test (A and C).
Figure 2—figure supplement 1

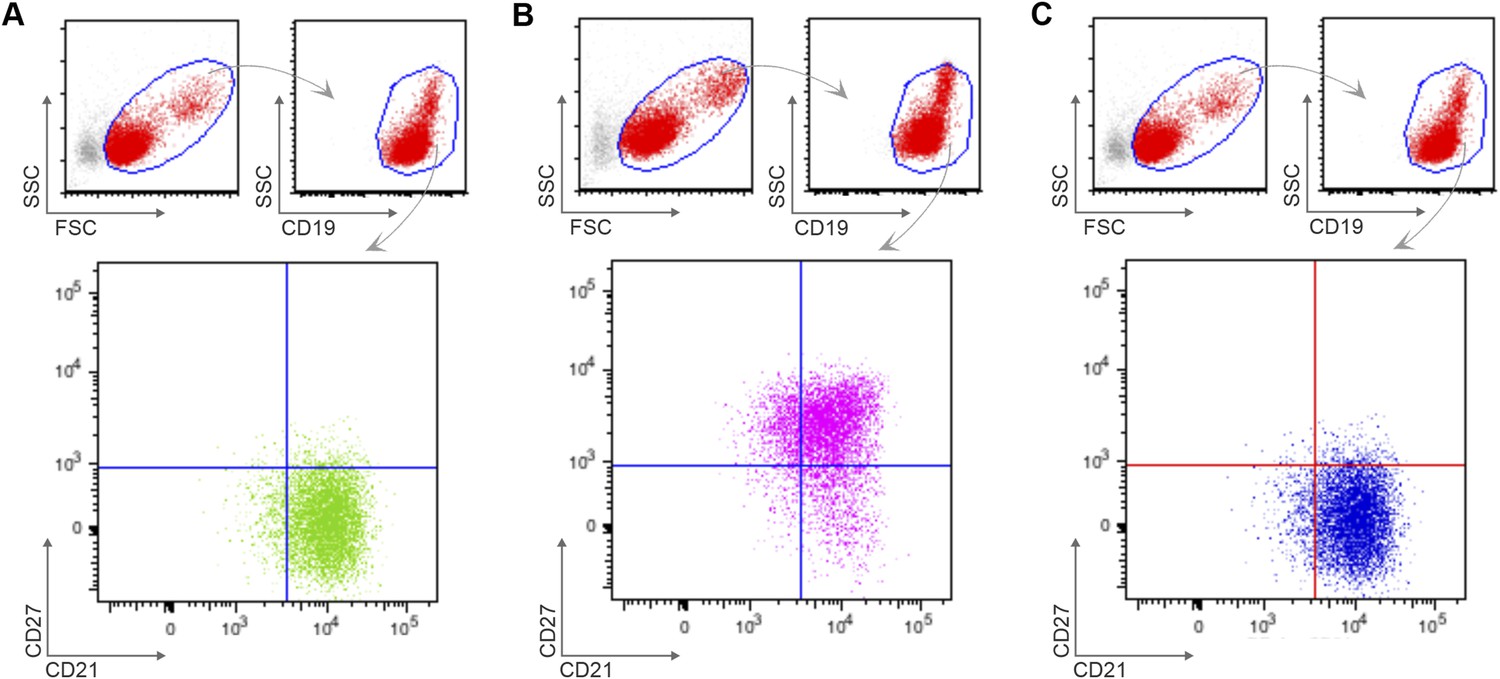
Flow cytometry gating strategy to determine purity of naïve B cells (CD10−CD19+CD20+CD21+CD27−) (A), classical MBCs (CD10−CD19+CD20+CD21+CD27+) (B), and atypical MBCs (10−CD19+CD20+CD21−CD27−) (C) after flow cytometry sorting.
Shown are representative dot-plots of a Malian adult.
Figure 2—figure supplement 2
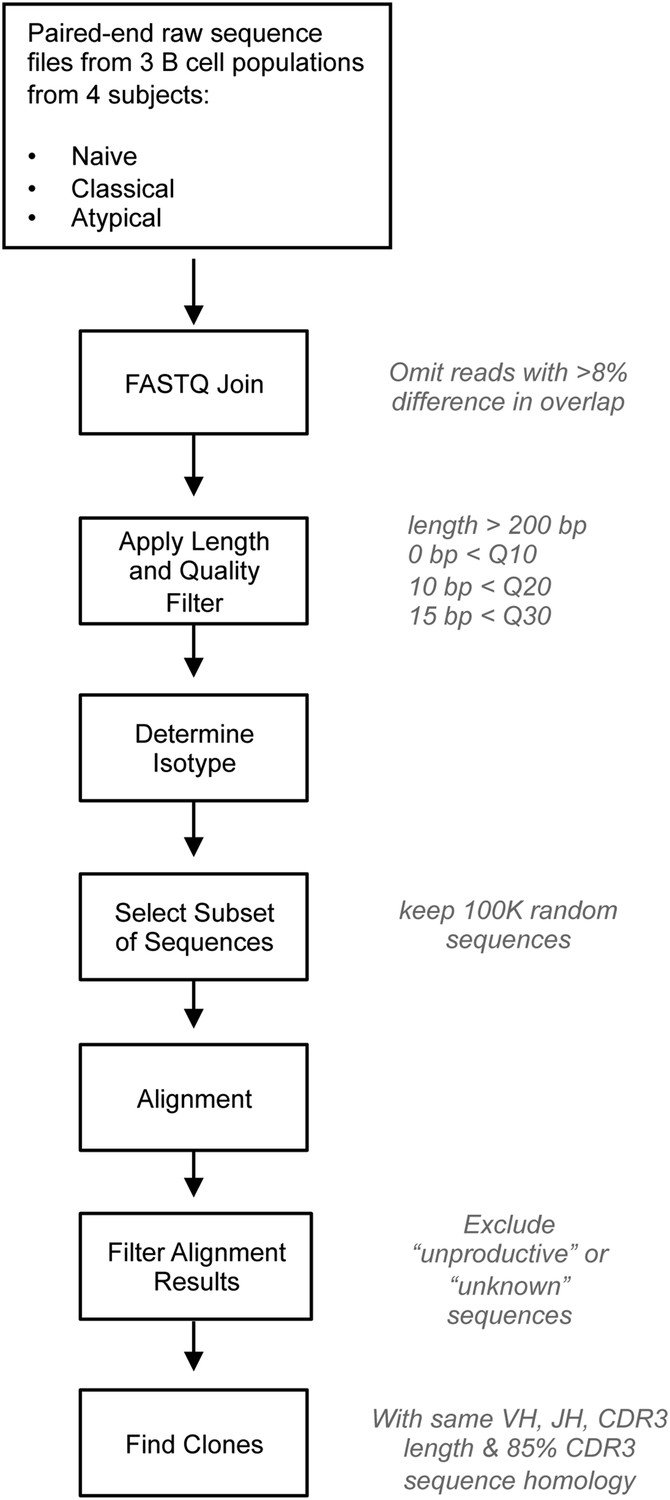
Bioinformatics analysis of NGS data.
IgH repertoire was analyzed using a bioinformatics pipeline written and assembled by Dr Alex Rosenberg and Chris Fucile from University of Rochester School of Medicine. Steps for processing data are presented with individual parameters to the right. The pipeline makes use of publicly available software (fastq-joiner), public resources (IMGT/HighV-Quest) and custom software written in Perl and Matlab. After raw reads are joined, the sequences are run through a strict quality filter that removes any sequences less that 200 bp and/or containing more than 0, 10, and 15bp below Q10, Q20, and Q30 quality thresholds, respectively. The isotype of each sequence is determined based on the identified constant region primer and then 100,000 sequences is randomly selected to be aligned to VH germline genes using IMGT/HighV-Quest. Results of the alignment are filtered for unknown or unproductive sequences and then custom software clusters sequences into clones based on identical VH, JH, HCDR3 length, and 85% HCDR3 similarity. The data obtained from IMGT/HighV-Quest is retained through the process and used for other data analyses.
Figure 3 with 1 supplement
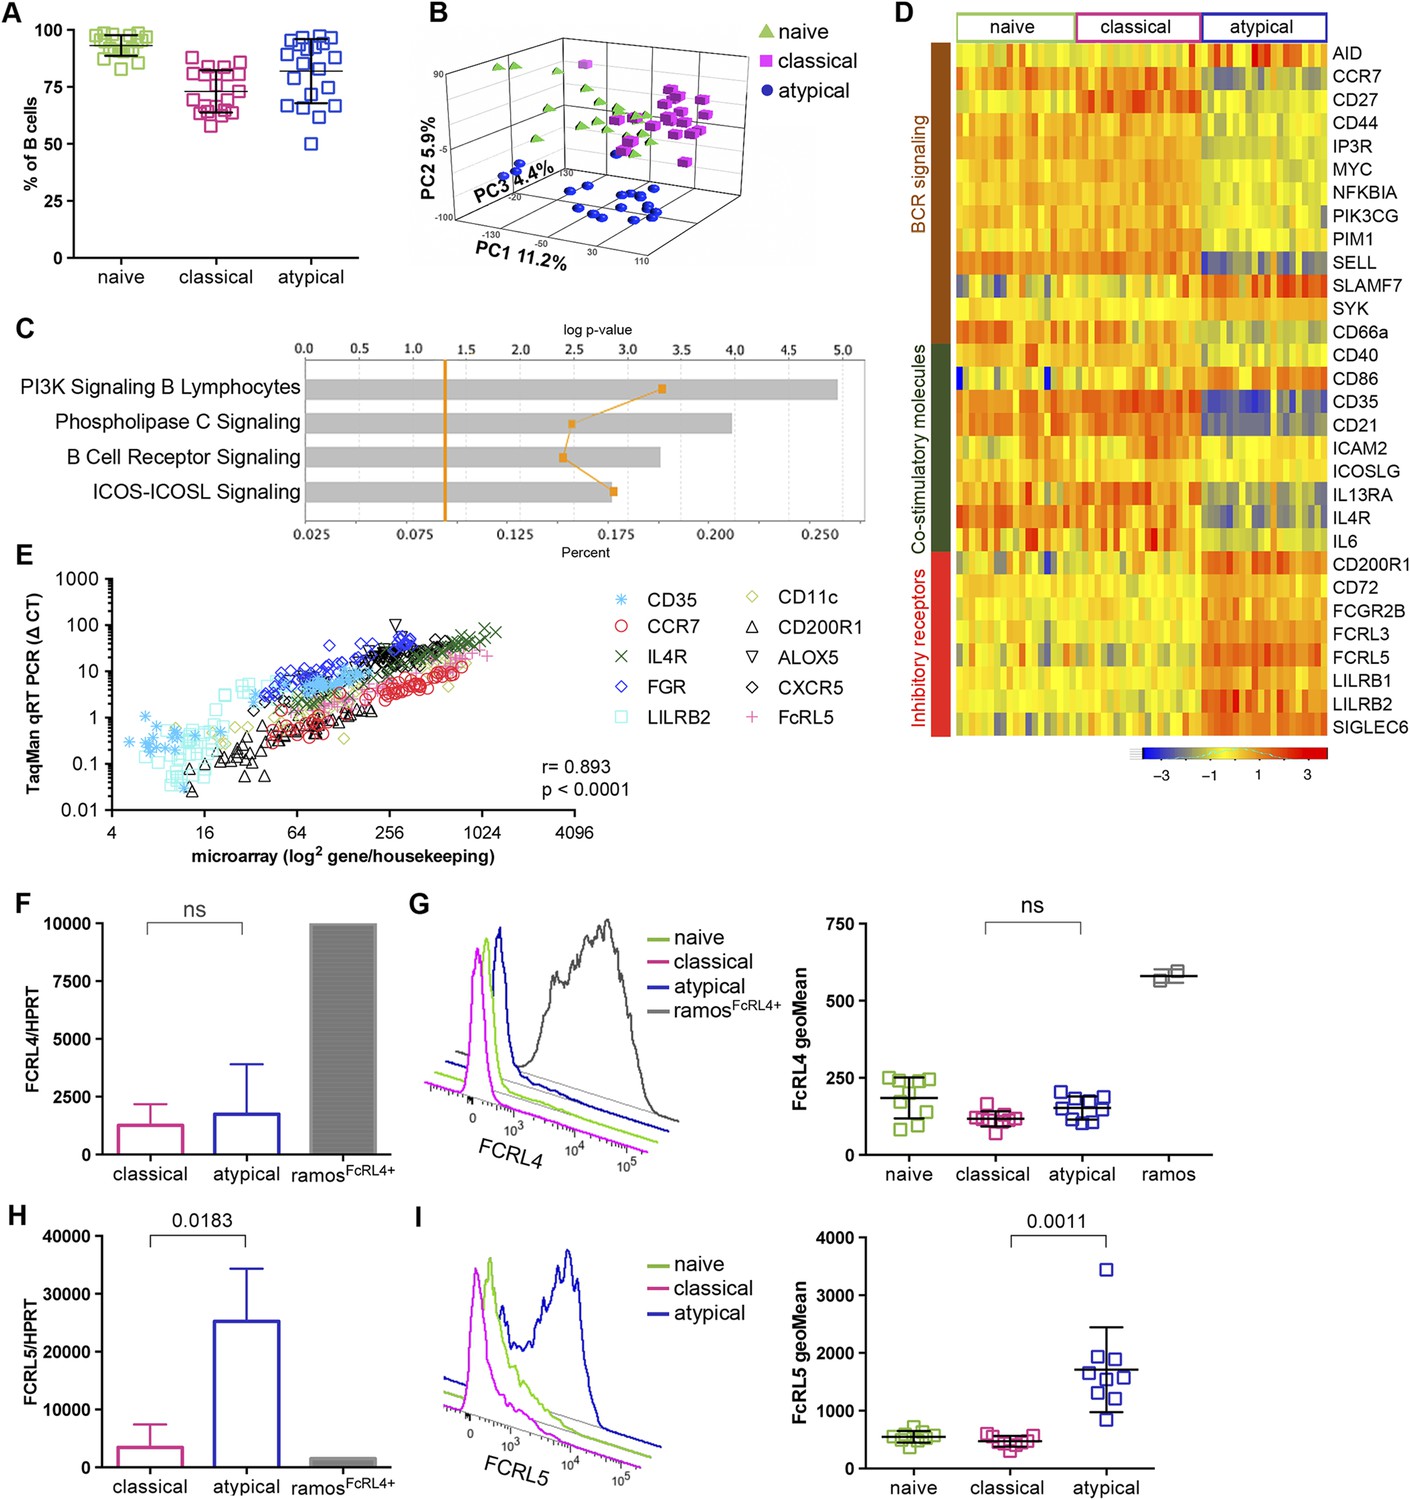
Atypical MBCs upregulate inhibitory receptors and differentially express genes involved in BCR and co-stimulatory signaling.
(A) Naïve B cells (CD19+CD21+CD27−), classical (CD19+CD21+CD27+) and atypical MBCs (CD19+CD21−CD27−) as a percentage of total PBMCs after magnetic fractionation. Fractionation results of 20 Malian adults representative of subpopulations used in B–I. (B) Principal components analysis of gene expression microarray data. (C) IPA summary showing canonical pathways that distinguished atypical and classical MBCs. Yellow line indicates p values of the enrichment of each pathway. Vertical yellow line indicates threshold p value equivalent to 0.05. Gray bars indicate percentage of genes in each pathway that are differentially expressed among total number of genes in each pathway. (D) Heatmap showing ex vivo RMA-normalized log2 values of differentially expressed genes (DEGs) (rows) for each subject (columns) within each B cell subpopulation (n = 20 subjects). (E) qRT-PCR confirmation of microarray data (n = 20 subjects). (F) FCRL4 mRNA levels measured by qRT-PCR in B cell subpopulations and RAMOS-FcRL4+ cells (n = 4 subjects). (G) FcRL4 protein expression measured by flow cytometry on B cell subpopulations and RAMOS-FcRL4+ cells; representative subject (left) and n = 10 subjects (right). (H) FCRL5 mRNA levels measured by qRT-PCR in B cell subpopulations and RAMOS-FcRL4+ cells (n = 4 subjects). (I) FcRL5 protein expression measured by flow cytometry on B cell subpopulations; representative subject (left) and n = 9 subjects (right). Horizontal bars and whiskers represent means and SD, respectively. p values determined by Spearman's (E), paired ttest (F and H) or ANOVA with Tukey's multiple comparisons test (G and I).
Figure 3—figure supplement 1
Flow cytometry gating strategy to determine purity of naïve B cells (CD19+CD21+CD27−) (A), classical MBCs (CD19+CD21+CD27+) (B), and atypical MBCs (CD19+CD21−CD27−) (C) after magnetic sorting.
Shown are representative dot-plots of a Malian adult.
Figure 4 with 1 supplement
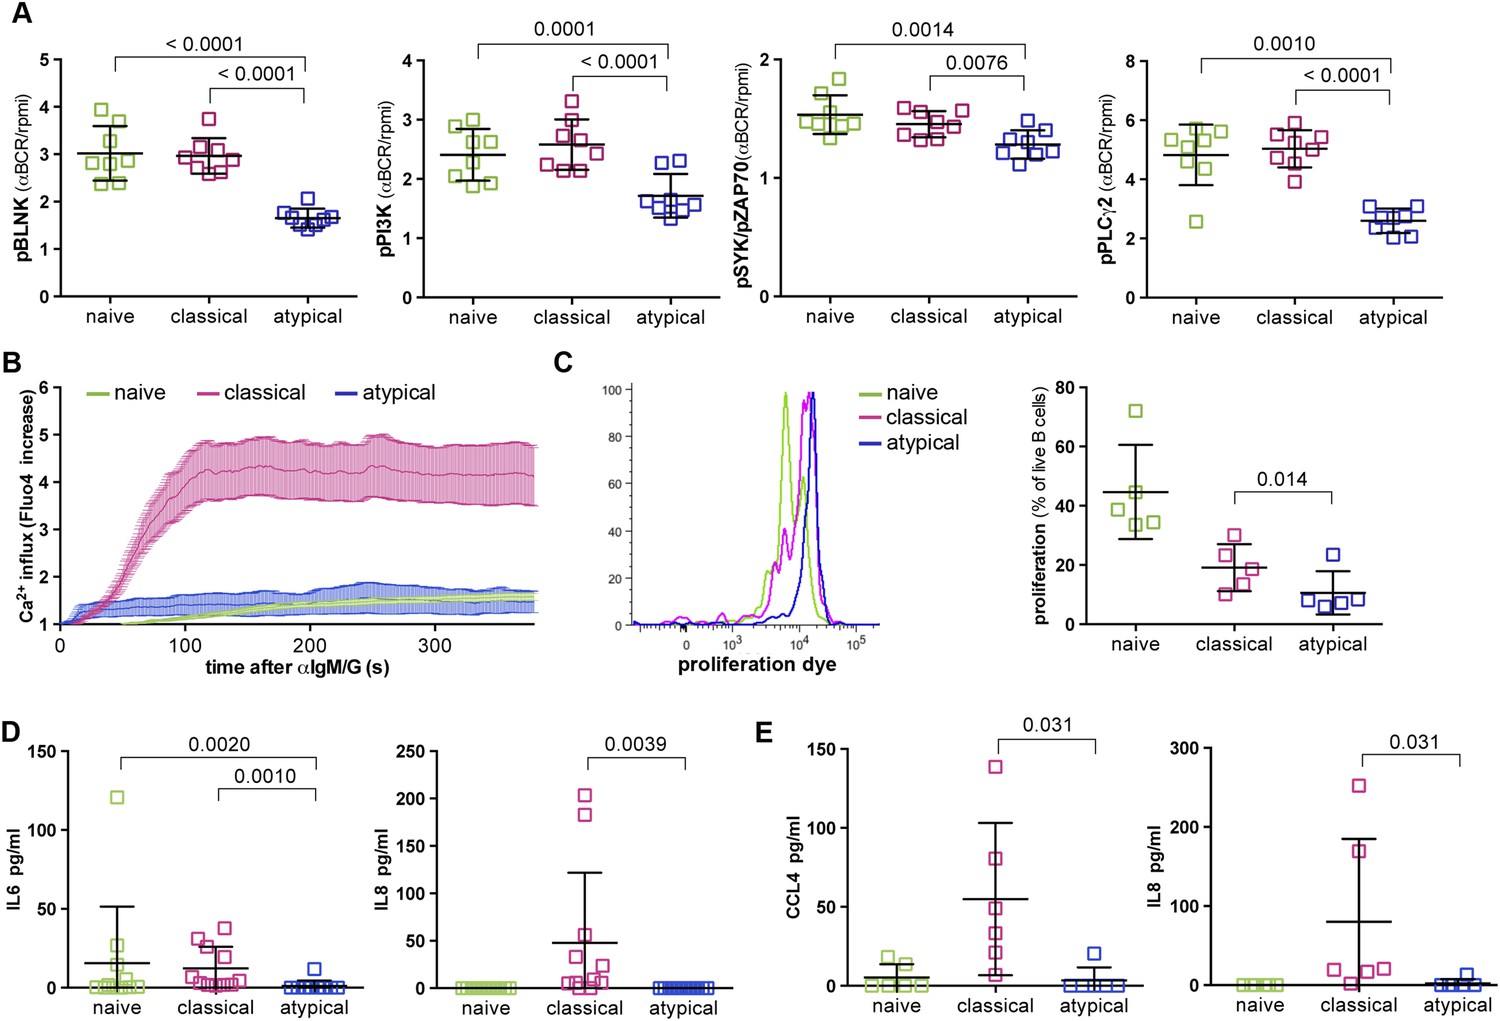
Atypical MBCs exhibit reduced BCR signaling, Ca2+ mobilization, proliferation and cytokine production.
(A) Following 5 min of BCR cross-linking with anti-IgM /G Abs, magnetically sorted naïve B cells (CD19+CD21+CD27−), classical MBCs (CD19+CD21+CD27+) and atypical MBCs (CD19+CD21−CD27−) were incubated with Abs specific for phosphorylated BLNK, PI3K, Syk and PLCγ2 and analyzed by flow cytometry. Shown are ratios of phosphorylation induced by BCR cross-linking over tonic signal fluorescence in RPMI (n = 8 subjects). (B) Flow cytometry analysis of Ca2+ influx in B cell subpopulations following BCR-crosslinking. Plot representative of 4 independent experiments. (C) Proliferation of B cell subpopulations assessed by flow cytometry following stimulation with anti-IgM/anti-IgG, anti-CD40, IL-10, IL-4 and CPG for 96 hr. Representative MFI histogram shown on left. (D) IL-6 and IL-8 production by B cell subpopulations measured in supernatants following 12 hr stimulation with anti-IgM/anti-IgG, anti-CD40 and CPG (n = 6 subjects). (E) CCL4 and IL-8 production by B cell subpopulations measured in supernatants following 12 hr stimulation with LPS (n = 6 subjects). Horizontal bars and whiskers represent means and SD, respectively. p values determined by ANOVA with Tukey's multiple comparisons test (A, D and E) or paired t test (C).
Figure 4—figure supplement 1
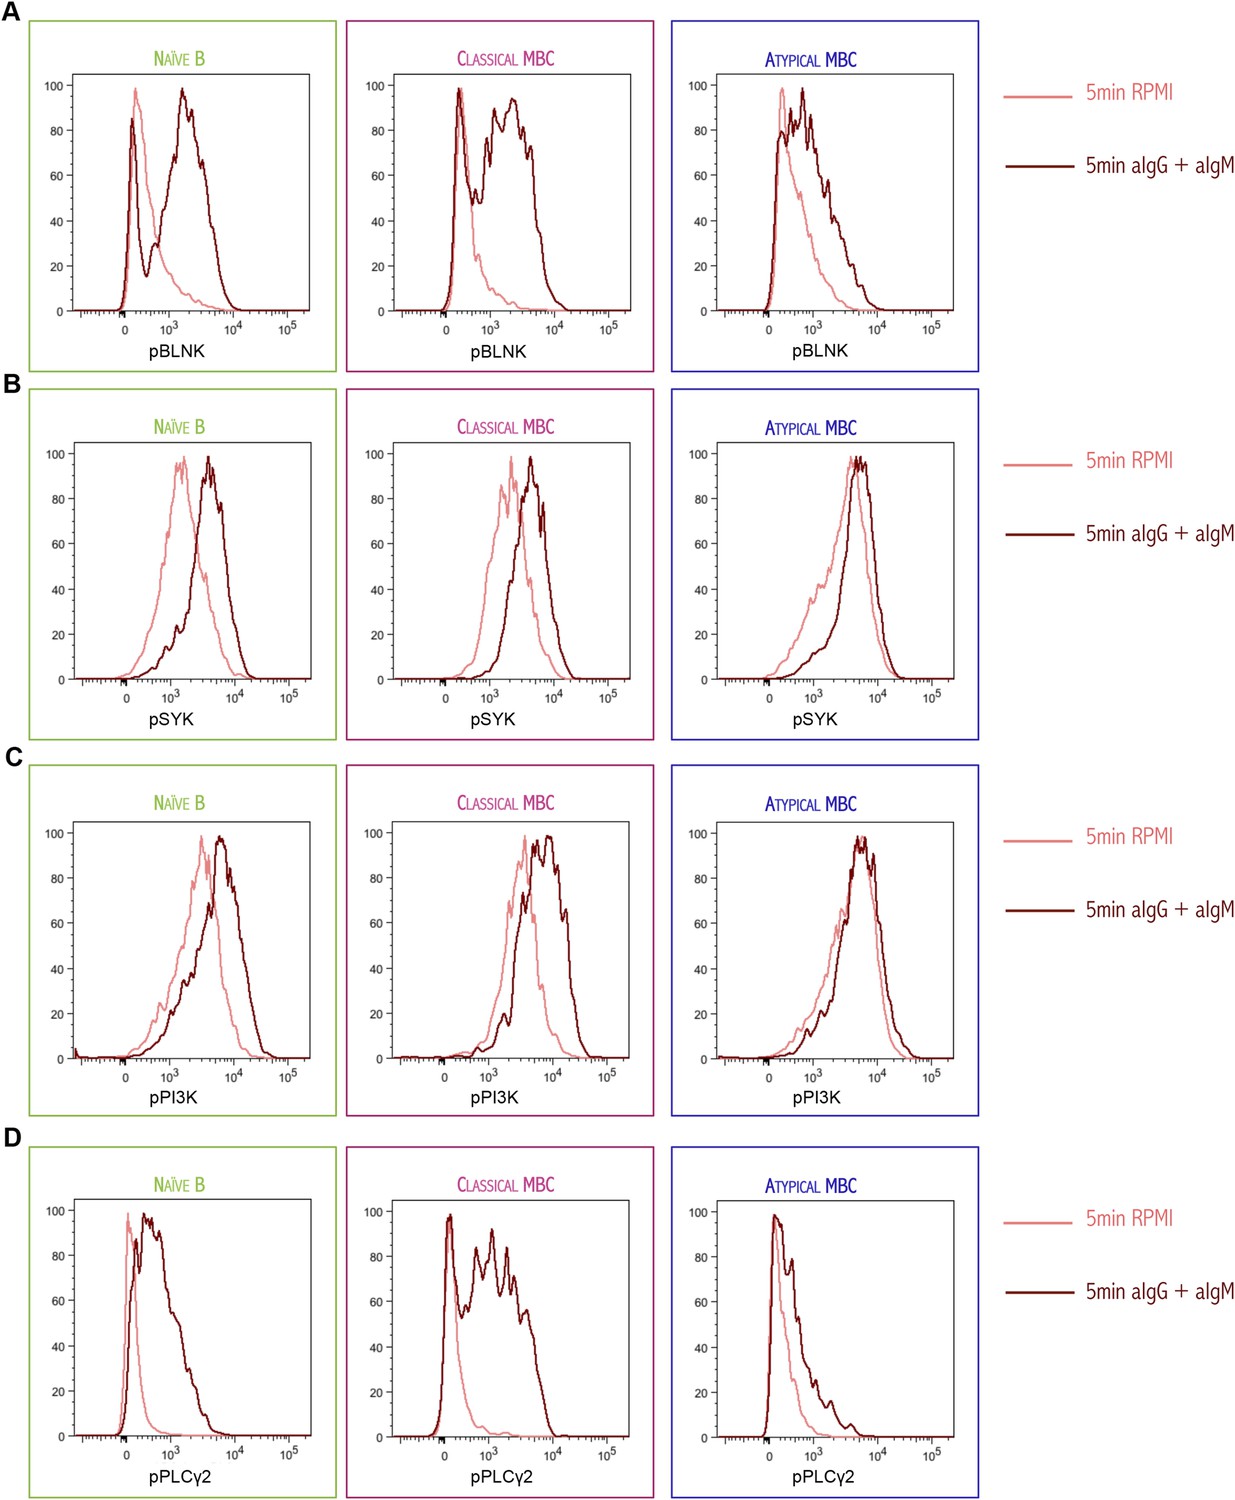
Histogram of phosphorylated BLNK (A), phosphorylated SYK (B), phosphorylated PI3K (C) and phosphorylated PLCγ2 (D) following 5 min of BCR cross-linking with anti-IgM/G Abs (red) or tonic signal in RPMI (salmon) of magnetically sorted naïve B cells (CD10−CD19+CD20+CD21+CD27−), classical MBCs (CD10−CD19+CD20+CD21+CD27+) and atypical MBCs (CD10−CD19+CD20+CD21−CD27−) of a representative Malian adult analyzed by flow cytometry.
https://doi.org/10.7554/eLife.07218.010
Figure 5
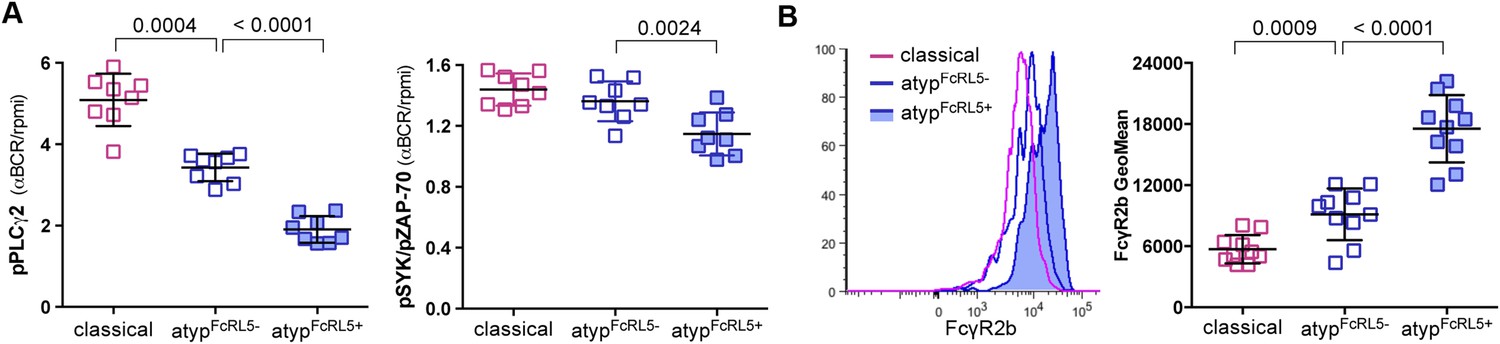
FcRL5 expression on atypical MBCs is associated with markedly reduced BCR signaling.
(A) Following 5 min of BCR cross-linking with anti-IgM and anti-IgG Abs, PBMCs were incubated with Abs specific for phosphorylated PLCγ2 (left) and Syk (right). Classical MBCs, and FcRL5− and FcRL5+ atypical MBCs were analyzed by flow cytometry. Shown are ratios of phosphorylation induced by BCR cross-linking over tonic signal fluorescence in RPMI (n = 7 subjects). (B) MFI of FcγR2b expression by flow cytometry on classical MBCs, and FcRL5− and FcRL5+ atypical MBCs (n = 10 subjects). Representative MFI histogram shown on left. Horizontal bars and whiskers represent means and SD, respectively. p values determined by ANOVA with Tukey's multiple comparisons test (A and B).
Figure 6
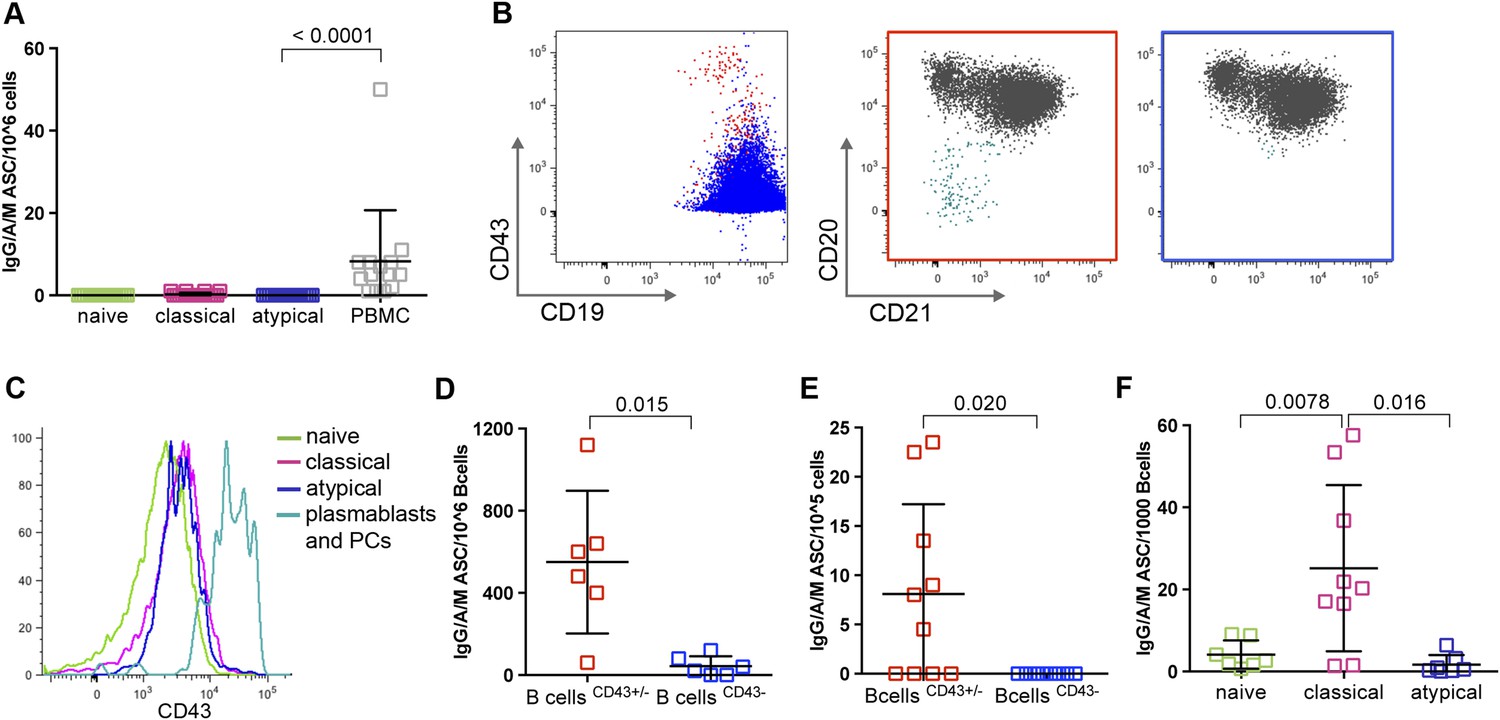
Atypical MBCs do not actively secrete Abs or differentiate into ASCs.
(A) Total PBMCs and magnetically sorted naïve B cells (CD19+CD21+CD27−), classical (CD19+CD21+CD27+) and atypical MBCs (CD19+CD21−CD27−) were cultured for 48 hr without stimulation, then ASCs were quantified by IgM/IgA/IgG ELISPOT (n = 14 subjects). (B) Magnetic sorting strategy for experiments described in D and E. B cells without plasma cells/plasmablasts were negatively selected with Abs to CD2, CD3, CD14, CD16, CD36, CD43, CD56, CD66b, and glycophorin A (left panel, blue population), while total B cells were negatively selected with Abs to CD2, CD3, CD14, CD16, CD56, and glycophorin A (left panel, red population). Red population contains plasma cells/plasmablasts (CD19+CD20−CD21−) (middle panel, aqua population) whereas blue population does not (right panel). (C) Representative histogram showing specificity of CD43 for plasma cells/plasmablasts. (D) Total B cells (CD43+/− fraction) and B cells without plasma cells/plasmablasts (CD43− fraction) were isolated from Malian adults and cultured for 48 hr without stimulation, then ASCs were quantified by IgM/IgA/IgG ELISPOT (n = 6 subjects). (E) Total B cells and B cells without plasma cells/plasmablasts were isolated from children during acute malaria and cultured for 48 hr without stimulation, then ASCs were quantified by IgM/IgA/IgG ELISPOT (n = 10 subjects). (F) Magnetically sorted B cell subpopulations were cultured for 6 days with CpG, IL-10, SAC and PWM and ASCs were quantified by IgM/IgA/IgG ELISPOT (n = 9 subjects). Horizontal bars and whiskers represent means and SD, respectively. p values determined by ANOVA with Tukey's multiple comparisons test (A and F) or paired ttest (D and E).
Additional files
-
Supplementary file 1
Ex vivo DEGs from naïve B cells, classical and atypical MBCs from 20 Malian adults. Transacripts are significant if FDR-adjusted p-value < 0.05 and absolute fold change > 1.5. Transcript ID is the Affymetrix accession number.
- https://doi.org/10.7554/eLife.07218.013
-
Supplementary file 2
A. Microarray expression and qRT-PCR values of 10 selected genes from naive B, classical and atypical MBC from 20 individuals. B. Spearman correlation values of Microarray and qRT‐PCR expression data of 10 selected genes. C. TaqMan primers and probes for qRT‐PCR expression data of 10 selected and 3 housekeeping genes.
- https://doi.org/10.7554/eLife.07218.014
-
Supplementary file 3
Antibodies used in flow cytometry analysis.
- https://doi.org/10.7554/eLife.07218.015
Download links
A two-part list of links to download the article, or parts of the article, in various formats.
Downloads (link to download the article as PDF)
Open citations (links to open the citations from this article in various online reference manager services)
Cite this article (links to download the citations from this article in formats compatible with various reference manager tools)
Malaria-associated atypical memory B cells exhibit markedly reduced B cell receptor signaling and effector function
eLife 4:e07218.
https://doi.org/10.7554/eLife.07218


