Crumbs is an essential regulator of cytoskeletal dynamics and cell-cell adhesion during dorsal closure in Drosophila
- Max-Planck-Institute of Molecular Cell Biology and Genetics, Germany
Figures
Figure 1 with 1 supplement
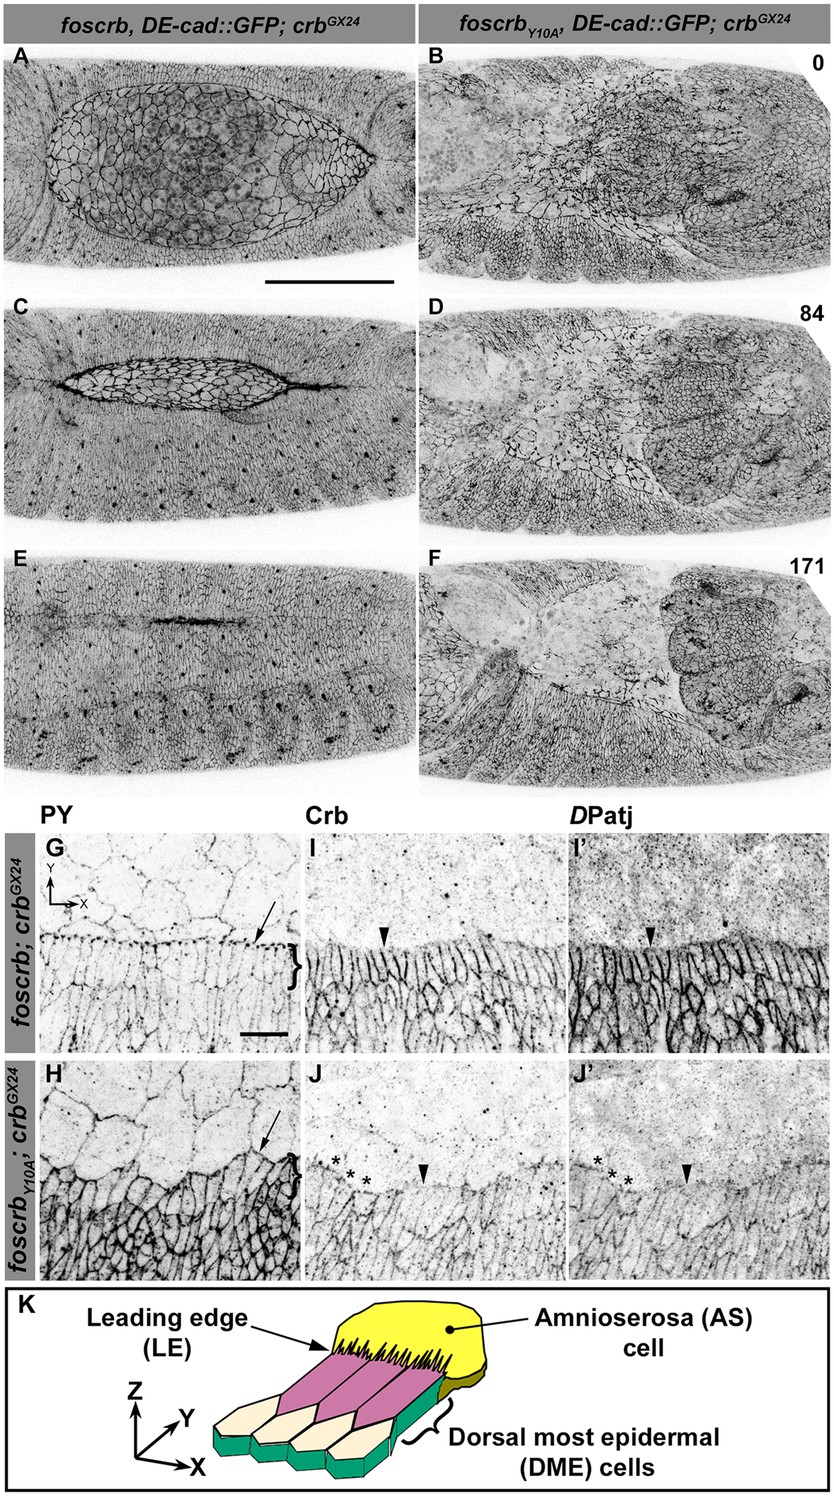
The FERM-binding domain motif (FBM) of Crb is essential for dorsal closure (DC).
(A-F) Stills from dorsal views of live imaging of embryos expressing DE-cad::GFP. In all images the anterior part is towards the left. A, C and E, w;foscrb,DE-cad::GFP;crbGX24 (Video 1). B, D and F, w;foscrbY10A,DE-cad::GFP;crbGX24 (Video 2). All embryos were collected at the same time (1 hr collection), incubated at 28ºC for 7 hr and imaged together. Numbers in (B,D and F) indicate the time in minutes for the corresponding row. While DC is completed in foscrb embryos (E), in foscrbY10A embryos, the amnioserosa (AS) is disorganised and progressively lost (F). Scale bar: 100 μm. (G-J’) Localisation of phosphotyrosine (PY), Crb and DPatj in the dorsal epidermis at the beginning of DC. In all images the AS is at the top (see reference axis in G and in the scheme K). (G, I,I’) w;foscrb;crbGX24. (H, J,J’) w;foscrbY10A;crbGX24. (K) Schematic representation of the dorsal epidermis at the beginning of DC indicating that the leading edge (LE) of the dorsal most epidermal (DME) cells is in contact with the AS. Arrows in (G,H) indicate LE of the DME (row of cells marked by brackets). The arrowheads indicate where the corresponding protein is absent from the LE (I-J’). The asterisks mark LE membranes positive for Crb (J) and DPatj (J’) in foscrbY10A mutant. Scale bar: 10 μm. Representative images from 8–12 different embryos for each genotype.
Figure 1—figure supplement 1
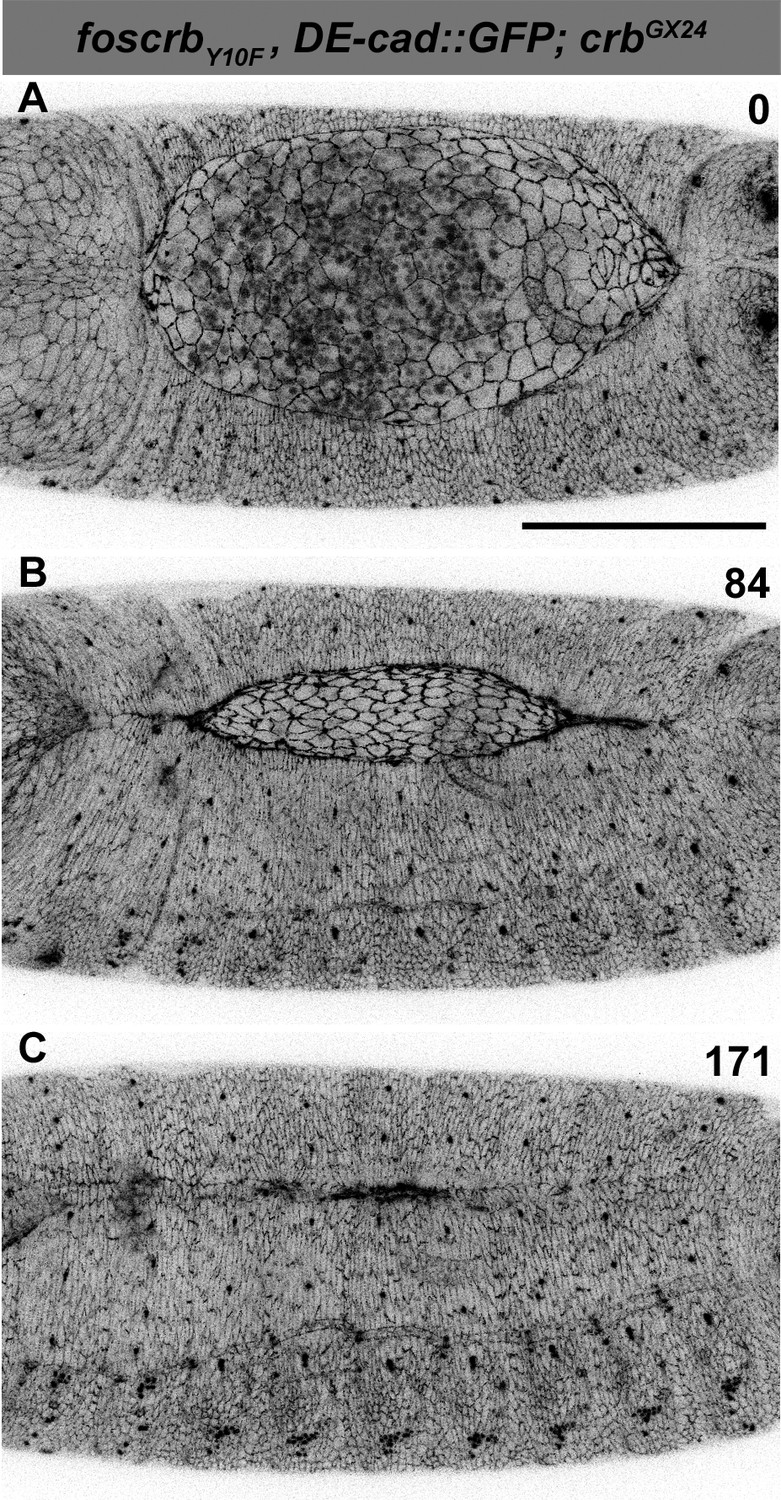
DC in foscrbY10F embryos.
(A-C) Stills from dorsal views of live imaging of embryos expressing DE-cad::GFP in w;foscrbY10F,DE-cad::GFP;crbGX24. Embryos collected and imaged as described in Figure 1. Numbers indicate the time in minutes for the corresponding row. DC proceeds as in foscrb embryos. Scale bar: 100 μm.
Figure 2 with 5 supplements
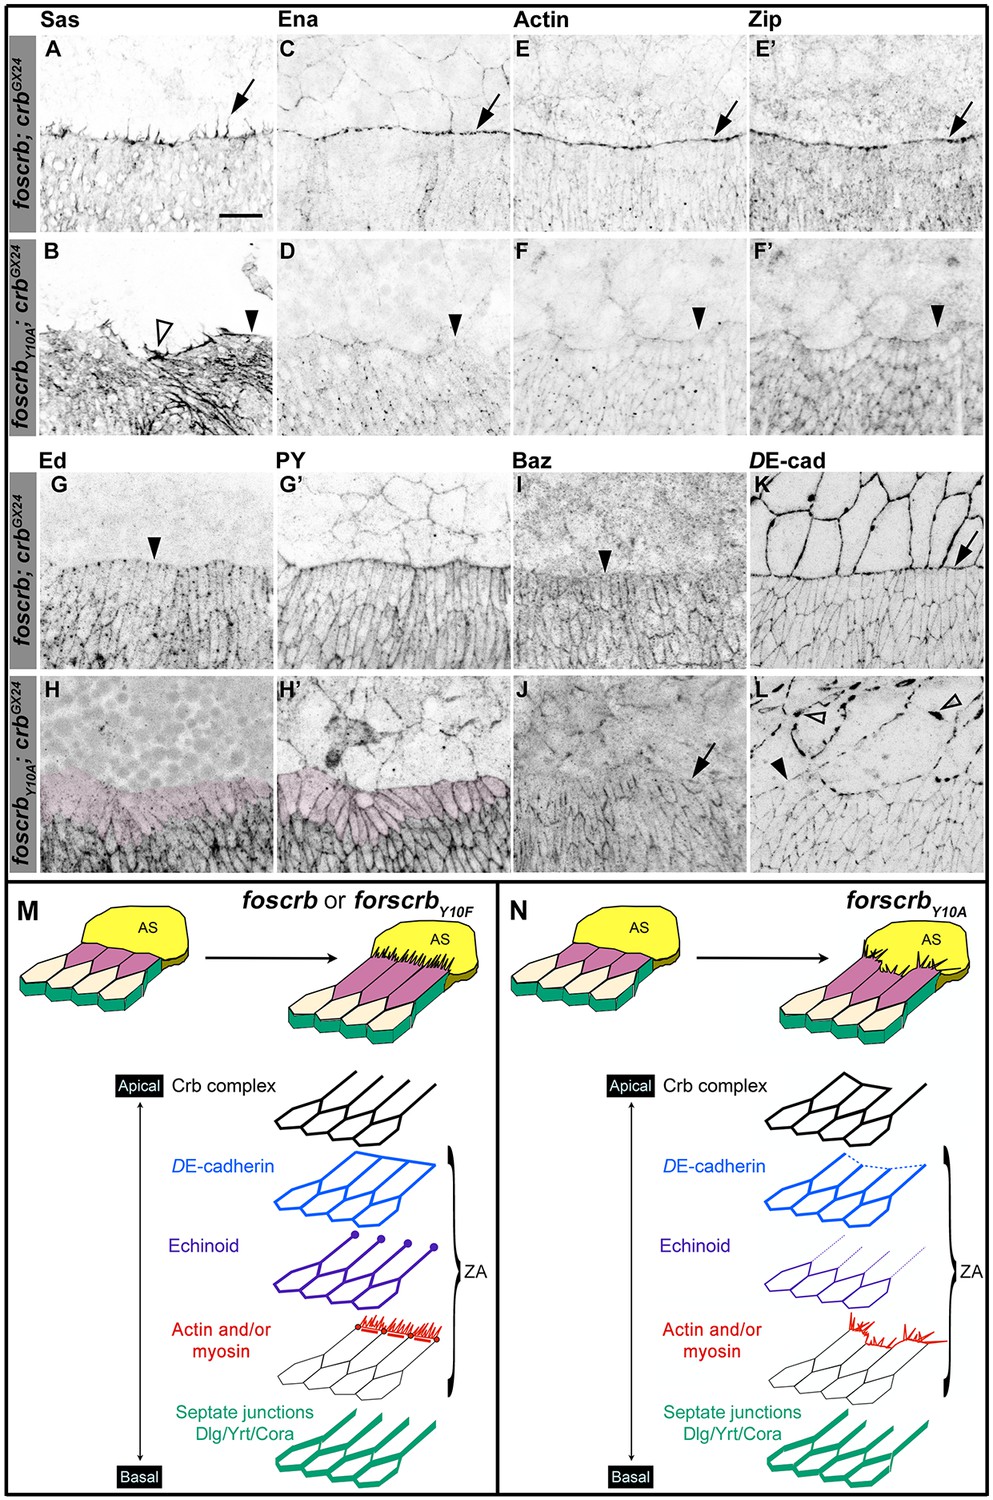
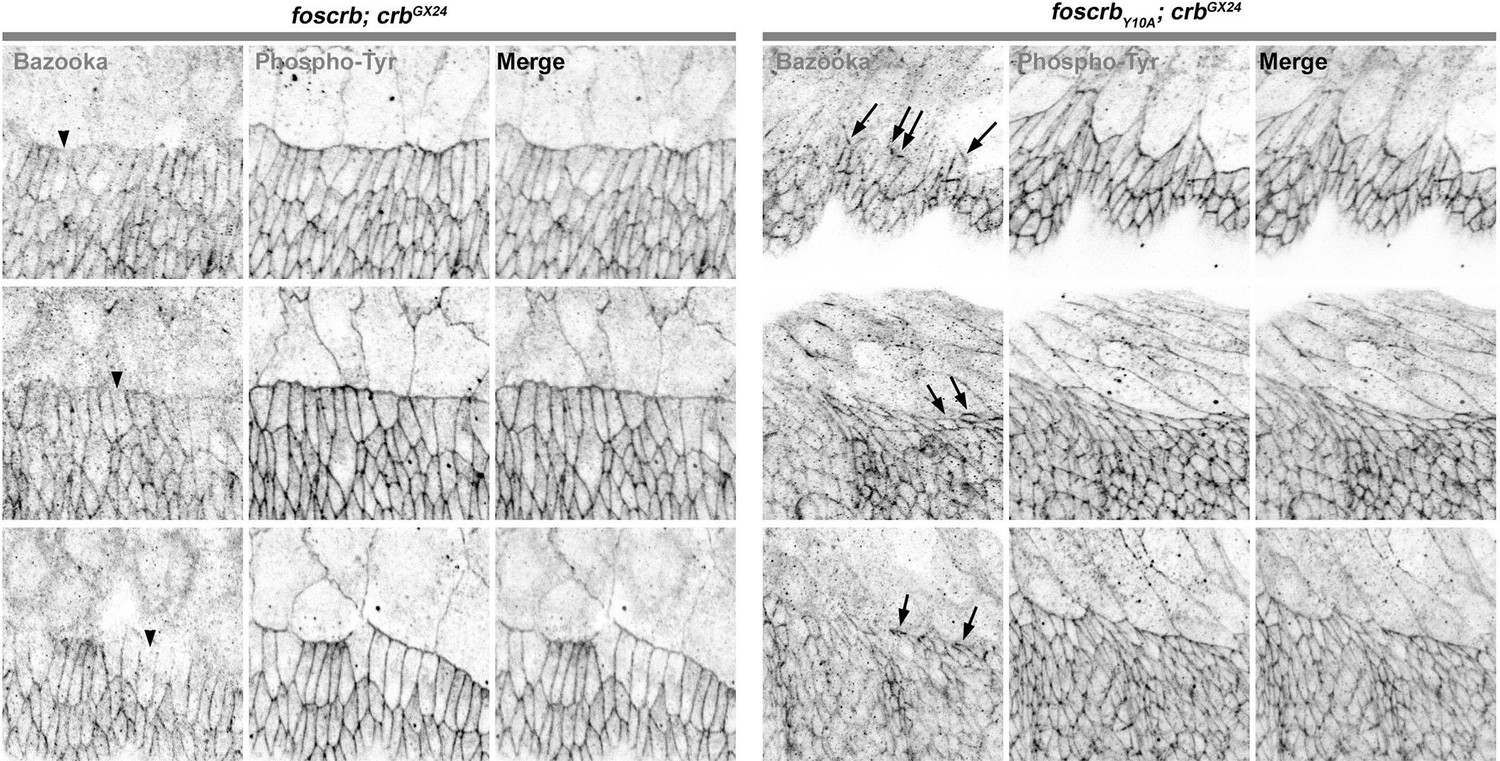
The FBM of Crb is important the establishment of the supracellular actomyosin cable at the LE of the DME cells during DC.
(A-L) Localisation of Stranded at second (Sas, A,B), Enabled (Ena, C,D), Actin (E,F), Zipper (Zip, E’,F’), Echinoid (Ed, G,H), phosphotyrosine (PY, G’,H’), Bazooka (Baz, I,J), and DE-cadherin (DE-cad, K,L) at the beginning of stage 14. In all images the AS is at the top half, for the genotypes w;foscrb;crbGX24 and w;foscrbY10A;crbGX24. Filopodia extend dorsally in foscrb embryos (A, arrow), but in foscrbY10A embryos filopodia are absent (B, arrowhead) or disorganised (B, empty arrowhead). Ena, Actin and Zip concentrate at the LE in foscrb embryos (C,E and E’, arrows), but these proteins are almost absent from the LE in foscrbY10A embryos (D,F and F’, arrowheads). Ed is absent from the LE of foscrb embryos (G, arrowhead), but the DME cells of foscrbY10A embryos show an important decrease of the protein (H, magenta overlay) though the PY staining is still clearly associated with the ZA in the same cells (H’, magenta overlay). Similarly, Baz decreases at the LE of foscrb embryos (I, arrowhead), but in foscrbY10A embryos, the cells that do not elongate keep Baz at the LE (J, arrow), while other DME cells show a reduction of Baz (J, and Figure 2—figure supplement 3). DE-cad (mTomato signal) localises at all cell-cell contacts in foscrb embryos (K). However, in foscrbY10A, the DE-cad localisation is affected in both the dorsal epidermis (L, solid arrowhead) and the AS (L, empty arrowheads). Scale bar: 10 μm. (M) Schematic representation of the changes in DME cells at the beginning of DC in embryos expressing either fosCrb or fosCrbY10F. The elongation of the DME cells is accompanied by the removal of the Crb protein complex, Ed, Baz and the septate junction components from the LE. At the LE a supracellular actomyosin cable is established and filopodia extend dorsally and attach to the AS cells. Representative images from 8–12 different embryos for each genotype. (N) Schematic representation of the defects in the DME cells of embryos expressing the fosCrbY10A variant. At the beginning of DC, the DME cells do not elongate uniformly. In the cells that do not elongate, the Crb protein complex and Baz remain at the LE. Reduced DE-cad suggest defects in the ZA function. Ed is dramatically reduced in DME cells, probably contributing to the absence of the supracellular actomyosin cable. Also, the DME cells exhibit disorganised filopodia. Nevertheless, the septate junction components are properly removed from the LE. The Crb protein complex is apical to the ZA, but Ed and the actomyosin cable are associated with the ZA.
Figure 2—figure supplement 1
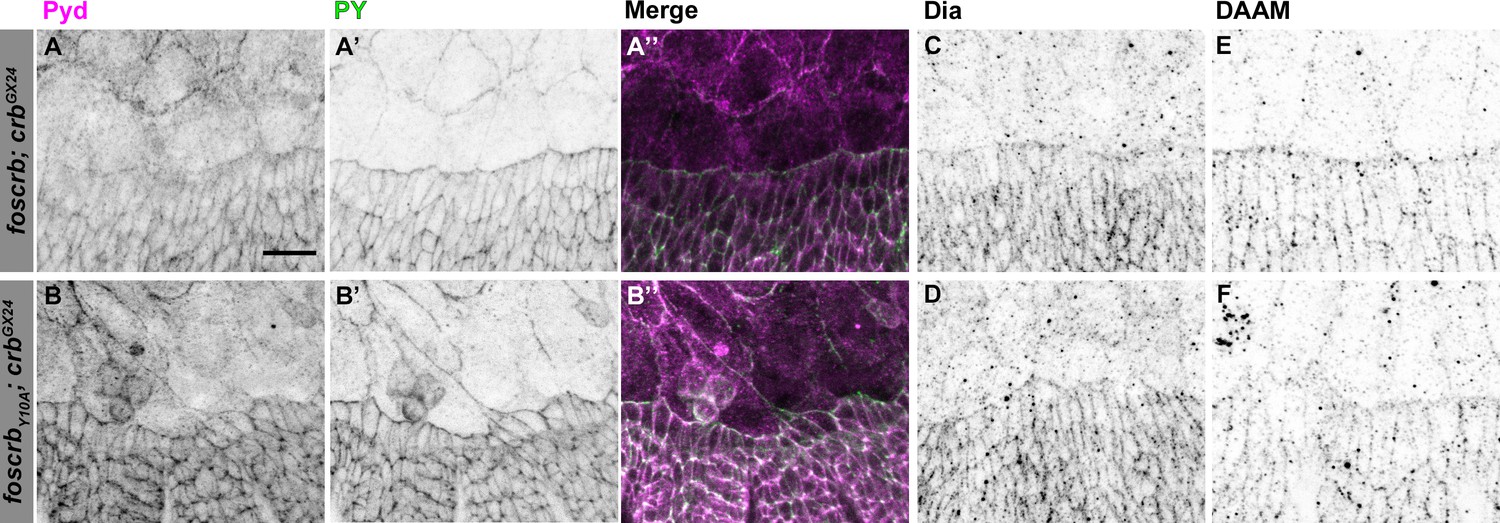
Localisation of Pyd, Dia and DAAM in foscrb and foscrbY10F embryos.
Localisation of Polychaetoid (Pyd, A,B), Phosphotyrosine (PY, A’,B’), Diaphanous (Dia, C,D), and Dishevelled Associated Activator of Morphogenesis (DAAM, E,F) in embryos at the beginning of stage 14. In all images the AS is at the top, for the genotypes w;foscrb;crbGX24, and w;foscrbY10A;crbGX24. The localisation of Pyd (A,B’’) is comparable between the different genotypes, despite the irregularly extended DME cells in w;foscrbY10A;crbGX24 embryos (B,B’,B’’). The PY staining (A’,B’) marks the ZA. The localisation of Dia (C,D) and DAAM (E,F) is similar in the different genotypes. Scale bar: 10 μm. Representative images from 8–12 different embryos for each genotype.
Figure 2—figure supplement 2
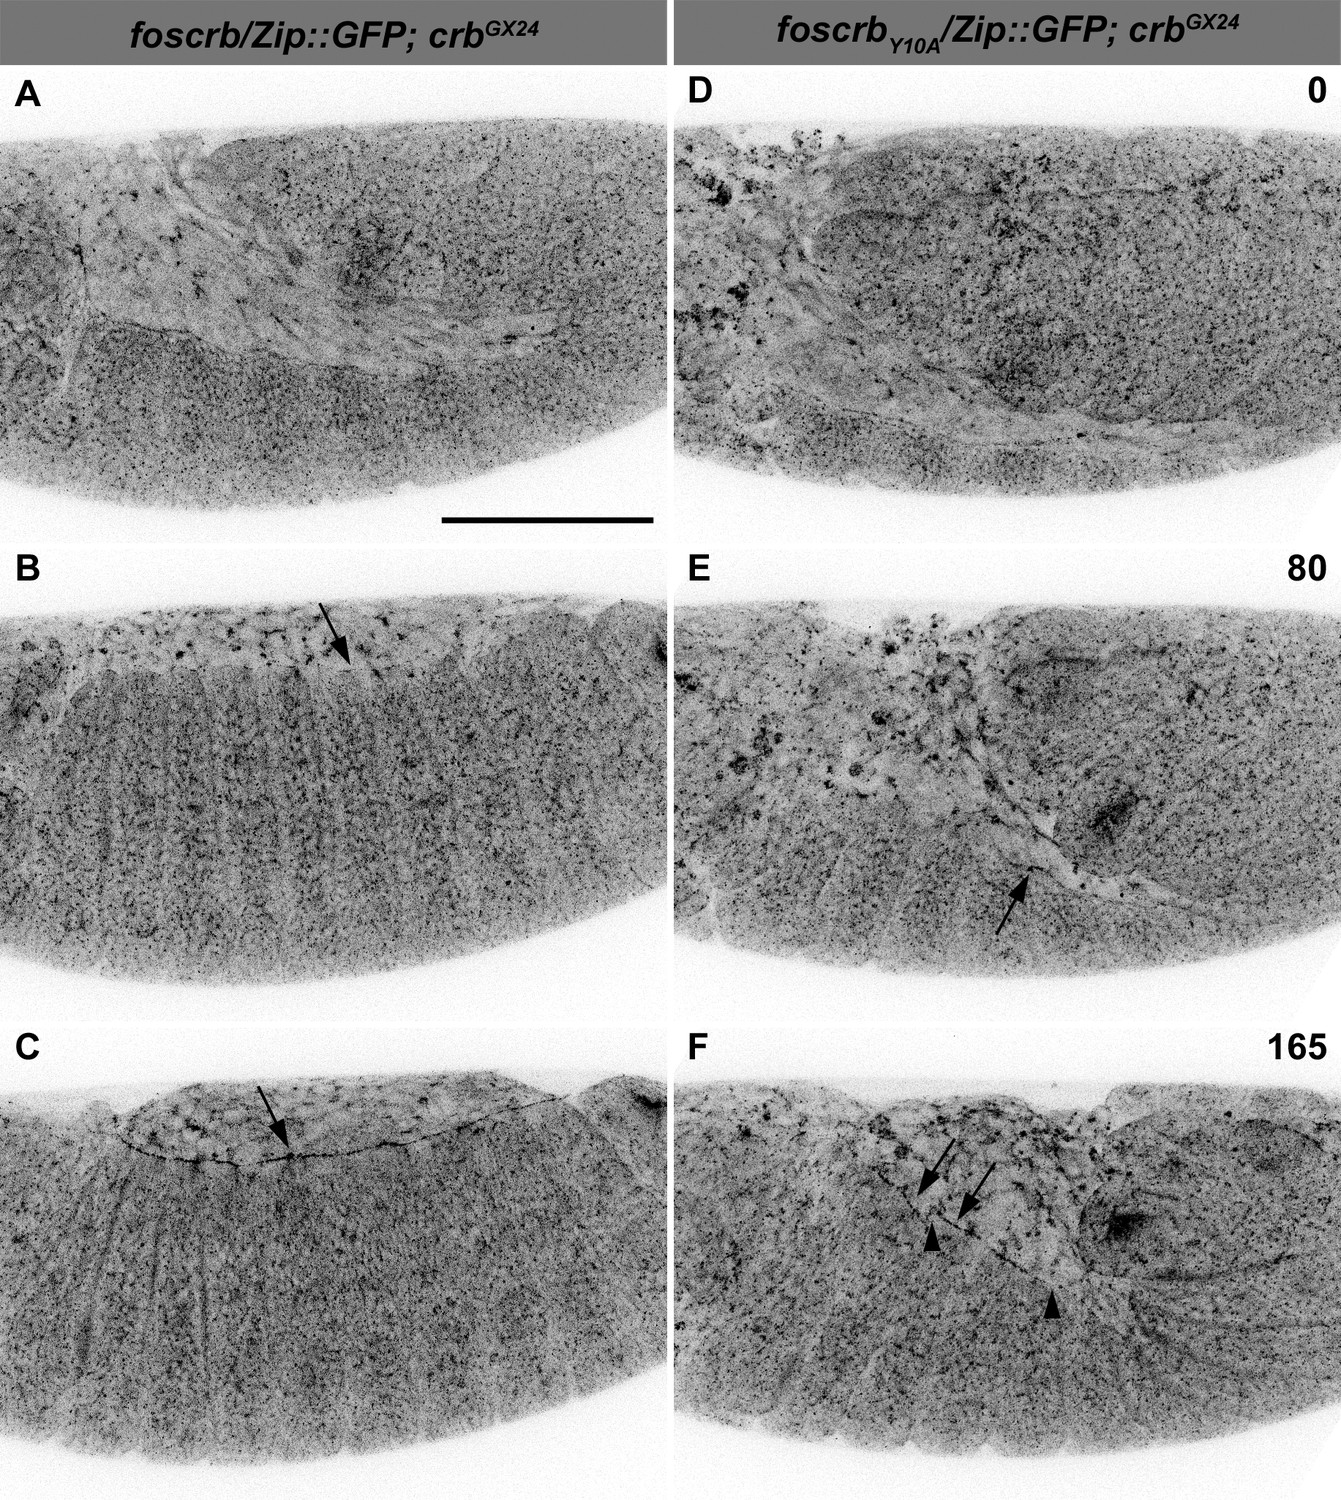
The FBM of Crb is important for the establishment of the supracellular actomyosin cable.
Stills from live imaging of embryos expressing Zip::GFP. In all images the anterior part is to the left. (A-C) w;foscrb/Zip::GFP;crbGX24 and (D-F) w;foscrbY10A/Zip::GFP;crbGX24 embryos were followed during GB retraction. Numbers in (D-F) indicate the time in minutes for the corresponding row. Arrow in (B) marks the incipient formation of the supracellular actomyosin cable in a foscrb embryo. The supracellular actomyosin cable is continuous at later time points (C, arrow). In foscrbY10Aembryos, some segments of the DME cells concentrate Zip::GFP at the LE (E, arrow). At the time when GB retraction should be completed and thereafter, the actomyosin cable forms randomly at the LE (F, arrows), and several discontinuities are present (F, arrowheads). Scale bar: 100 μm. Representative images from 6–8 different embryos for each genotype.
Figure 2—figure supplement 3
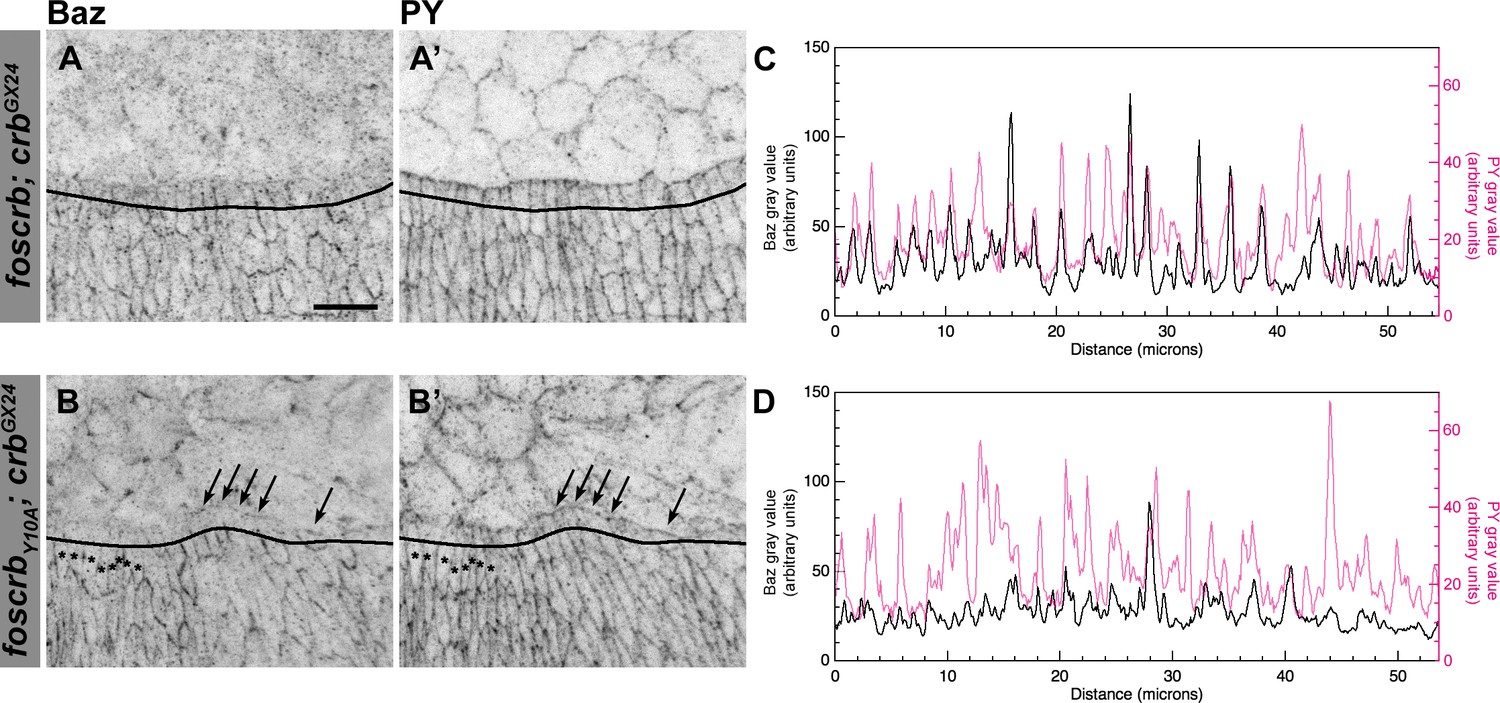
Reduction of Baz in DME cells of foscrbY10A embryos.
Localisation of Bazooka (Baz, A,B), and phosphotyrosine (PY, A’,B’) at the beginning of stage 14 in w;foscrb;crbGX24 and w;foscrbY10A;crbGX24 embryos. The black lines in A-B’ mark the position for the plot profile (C,D) of the Baz signal (C,D, black line) and the PY signal (C,D, magenta line) in the DME cells. Maxima intensities overlap for both markers, but note that the intensity of Baz in foscrbY10A embryos is lower than in foscrb embryos. The arrows indicate where Baz is preserved at the LE of those cells that do not elongate properly, while the asterisks mark the DME cells that extend normally, and have a reduction of Baz signal in the junctions. Scale bar: 10 μm.
Figure 2—figure supplement 4
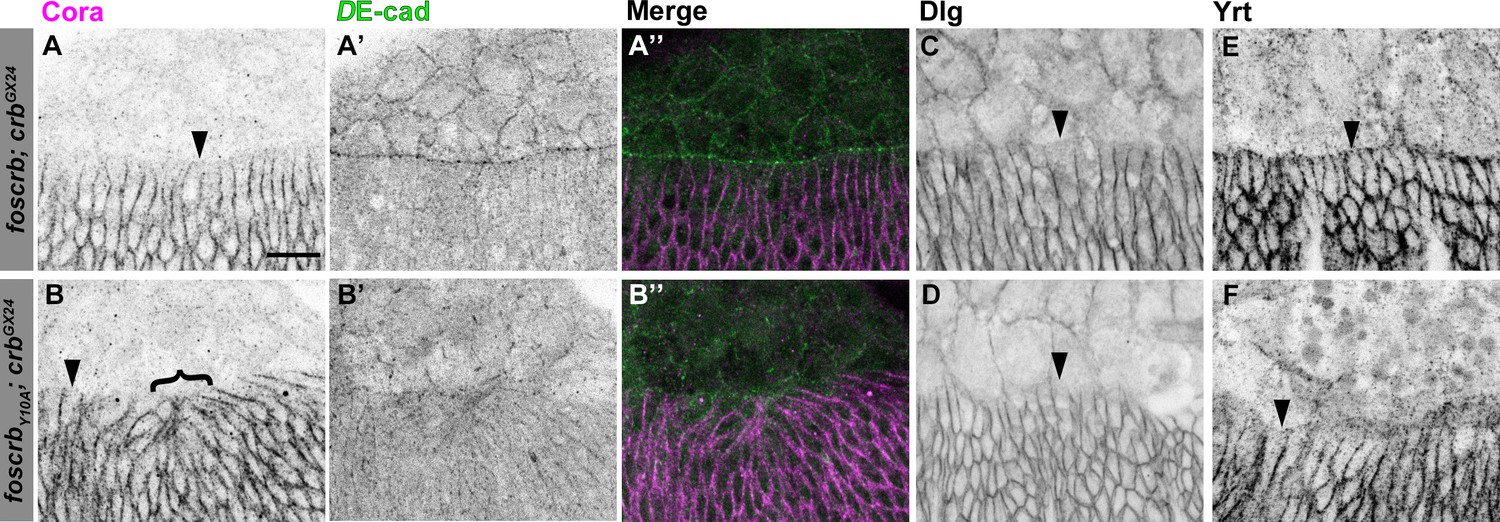
Distribution of septate junction components in DME cells.
Localisation of Coracle (Cora, A,B), DE-cad (A’,B’), Disc large (Dlg, C,D) and Yurt (Yrt, E,F) in embryos at the beginning of stage 14. In all images the AS is at the top, for w;foscrb;crbGX24 and w;foscrbY10A;crbGX24 embryos. The septate junction proteins Cora (A,B), Dlg (C,D) and Yrt (E,F) are absent from the LE in all genotypes (arrowheads). Bracket in (B) marks bunching of dorsal epidermis observed in foscrbY10Aembryos. The DE-cad staining (A’,B’), is a maximal projection of the first ∼1.5 μm from the surface of the embryo, while the Cora staining is a maximal projection of the whole Z-stack. The merge of these projections (A’’,B’’) shows that Cora is mainly present in the epidermis. Scale bar: 10 μm. Representative images from 8–12 different embryos for each genotype.
Figure 2—figure supplement 5
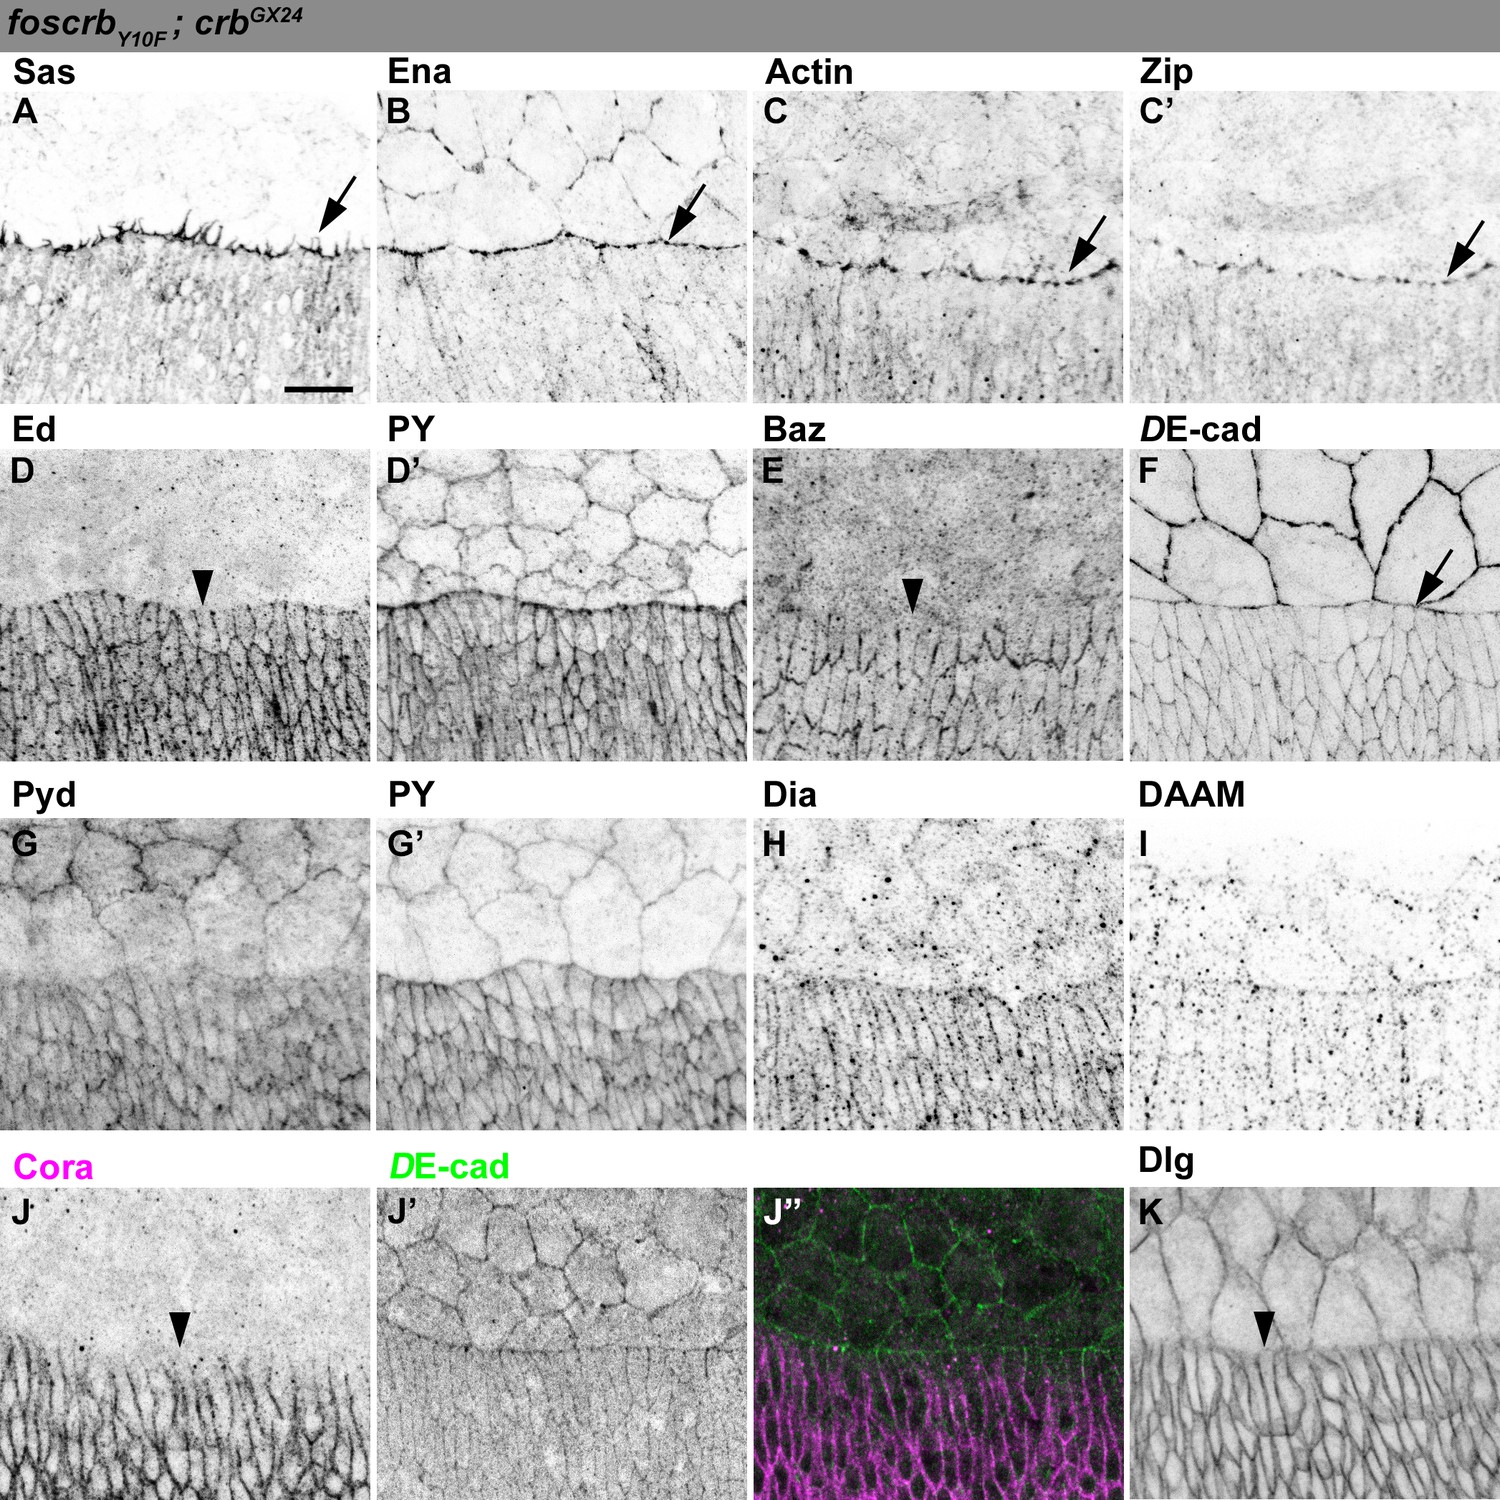
Distribution of actomyosin and junctional components in DME cells of foscrbY10F embryos.
(A-K) Localisation of Sas at the filopodia (A, arrow). Ena (B), Actin (C), and Zip (C’) concentrate at the LE (arrows). Ed (D, and PY, D’), and Baz (E) are absent from the LE (arrowheads). DE-cad::mTomato (F) and Pyd (G, and PY, G’) localise at all cell-cell contacts. Localisation of Dia (H) and DAAM (I). The septate junction components Cora (J, the corresponding DE-cad, J’ and the merge, J’’), and Dlg (K) are absent from the LE (J,K, arrowheads). The localisation of all these proteins is similar to the one observed in foscrb embryos. Scale bar: 10 μm. Representative images from 8–12 different embryos for each genotype.
Figure 3 with 1 supplement
The FBM of Crb is important for the maintenance of the AS.
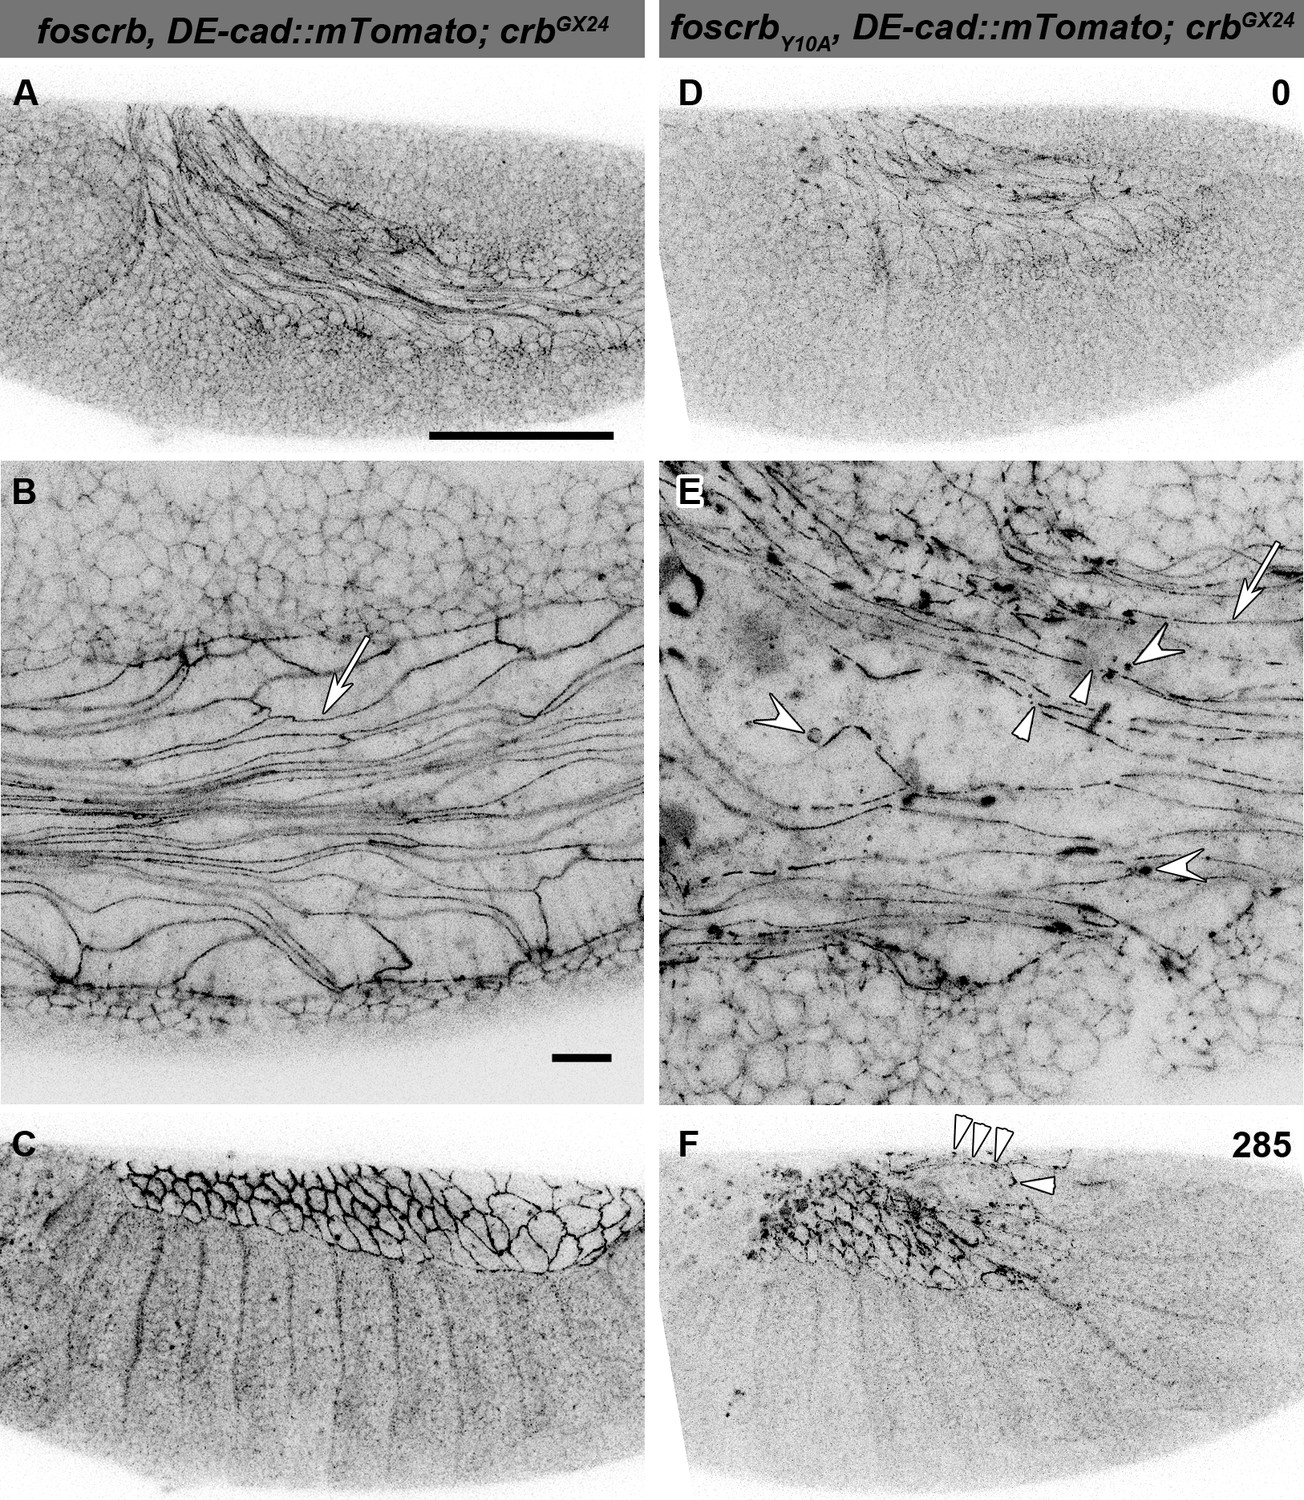
(A-F) Stills from lateral views of live imaging of DE-cad::mTomato knock-in at the beginning of germ band (GB) retraction (Video 4). In all images the anterior part is towards the left, for the genotypes w;foscrb,DE-cad::mTomato;crbGX24 and w;foscrbY10A,DE-cad::mTomato;crbGX24. All embryos were collected at the same time (1 hr collection), incubated at 28ºC for 5 hr and imaged together. The numbers in (D,F) indicate the time in min. for the corresponding row. At stage 11 (A,B,D,E), the AS cells are elongated along the AP-axis, and DE-cad::mTomato localises along the ZA (B,E, arrows); in foscrbY10A mutant, the continuity of DE-cad::mTomato along the ZA is lost (E, arrowhead) and DE-cad::mTomato is also found in large clusters (E, white concave arrowhead). At the end of GB retraction the AS covers the dorsal aspect of foscrb embryos (E), but in foscrbY10A (F), GB retraction is impaired and DE-cad::mTomato signal is fragmented in the AS (F, arrowheads). Scale bar: 100 μm, except for (B,E) 10 μm.
Figure 3—figure supplement 1

The FBM of Crb is important for the integrity of the AS.
(A-B’) Scanning electron micrographs of dorsal views of embryos incubated for 8 hr at 28ºC after egg collection (1 hr collection) for the genotypes w;foscrb;crbGX24 and w;foscrbY10A;crbGX24. The boxed area in (A,B) is shown in (A’,B’) respectively. In foscrb embryos (A’) the AS appears as a flat continuous monolayer, while in foscrbY10Aembryos (B’), the AS is disorganised and some cells exhibit large filopodia (B,B’, arrow). Other cells are completely detached and may be AS cells or haemocytes (B,B’, arrowheads), and some cells have the appearance of apoptotic cells (B’, concave arrowhead). Scale bars: 100 μm (A,B) and 10 μm (A’,B’). Representative images from 17–37 embryos for each genotype.
Figure 4 with 4 supplements
AS detachment in foscrbY10A embryos is accompanied by premature apoptosis.
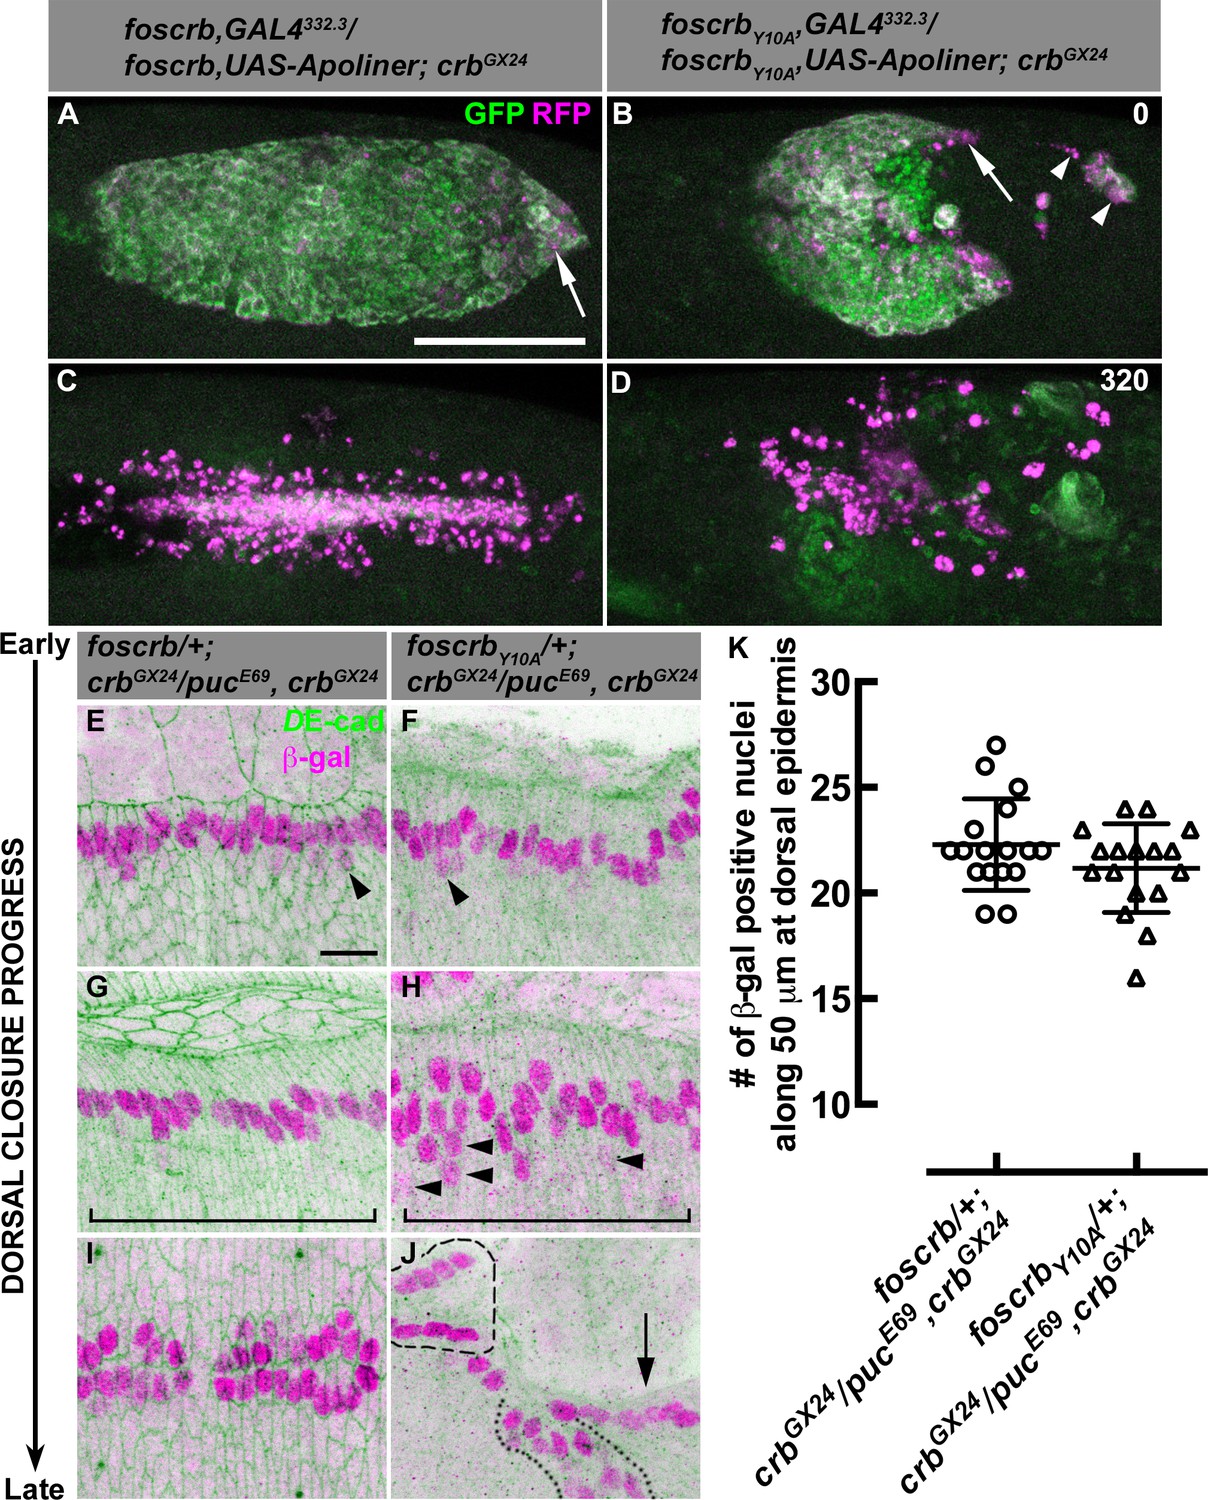
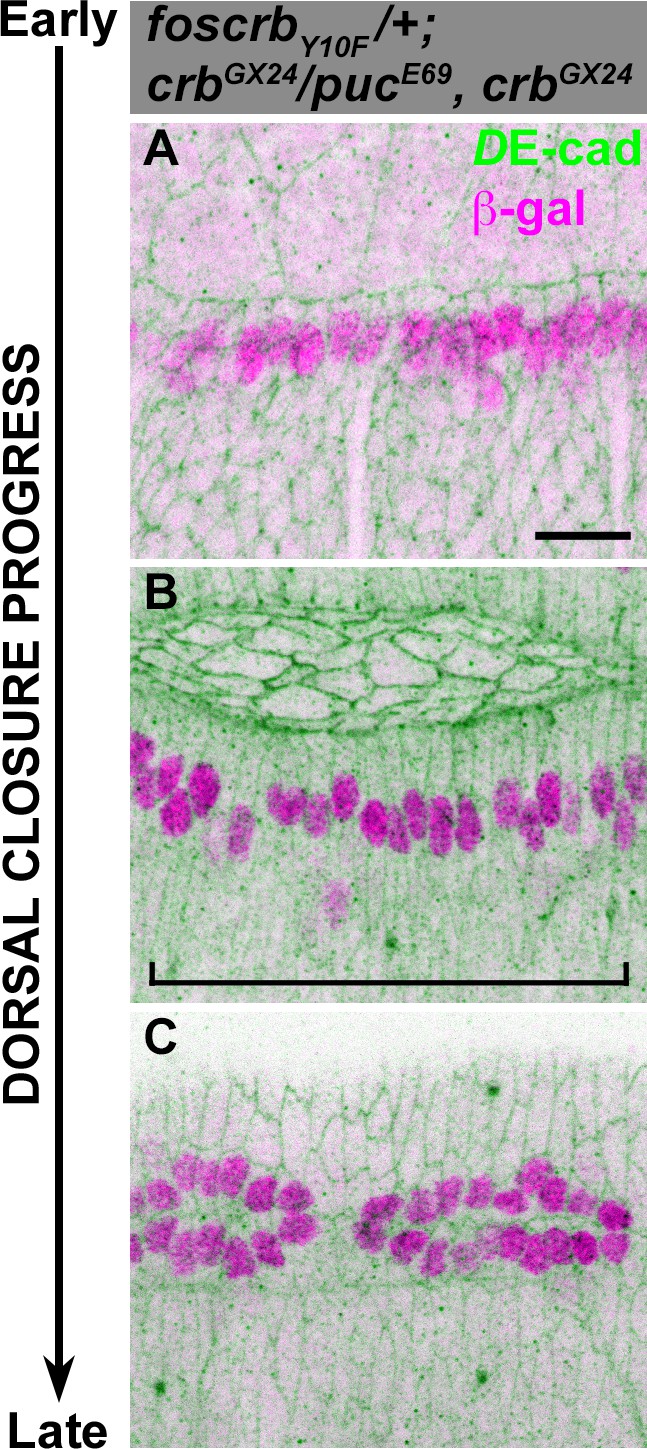
(A-D) Stills from dorsal views of live imaging of embryos in which the apoptotic reporter Apoliner is driven in the AS with the line GAL4332.3 (Video 6). Apoptotic cells in magenta appear more intense than their neighbours. In all images the anterior part is towards the left for the genotypes w;foscrb,GAL4332.3/foscrb,UAS-Apoliner;crbGX24, and w;foscrbY10A,GAL4332.3/foscrbY10A,UAS-Apoliner;crbGX24. All embryos were collected at the same time (1 hr collection), incubated at 28ºC for 7 hr and imaged together. The numbers in (B,D) indicate the time in minutes for the corresponding row. After GB retraction in foscrb embryos (A), some apoptotic cells are found mainly at the posterior canthus (A, arrow). In comparison, in foscrbY10A embryos, some of the cells that have detached from the AS (B, arrowheads), as well as those in the posterior edge of the AS (B, arrow), are apoptotic. As DC is completed in foscrb embryos (C), a significant portion of the internalised AS cells are apoptotic, while the remaining internalised cells are still localised in a rod-like structure along the dorsal part of the embryo. In contrast, in foscrbY10A embryos (D) all the remaining AS cells are apoptotic cells (the GFP signal in (D) does not belong to the AS). Scale bar: 100 μm. Representative images from 8–12 different embryos for each genotype. (E-K) Activation of the JNK pathway in the DME cells analysed with the enhancer trap pucE69 (β–galactosidase staining). DE-cad staining is in green. In all images anterior is to the left for the genotypes w;foscrb/+;crbGX24/pucE69,crbGX24 and w;foscrbY10A/+;crbGX24/pucE69,crbGX24. From the beginning to the end of DC, Puc expression is normally induced on each side of the embryo in the single row of DME cells in both genotypes, and few positive β–gal nuclei appear below the row of DME cells (E,F, arrowheads). In foscrbY10A embryos at middle DC some β–gal positive cells appear below the DME cells (H, arrowheads). When DC is completed in foscrb embryos (I), a single row of cells on each side of the embryo is β–gal positive, even in foscrbY10A embryos, independently of whether the epidermis contacted the corresponding segment of the epidermis on the dorsal midline (J, dashed line), bunched on the same side of the embryo (J, dotted line) or fail to touch the complementing segment (J, arrow). Scale bar: 10 μm. (K) No significant difference in the number of β–gal positive nuclei at middle DC along 50 μm at the dorsal epidermis (indicated by the brackets in G,H), mean ± SD, n= 17 embryos per genotype.
Figure 4—figure supplement 1
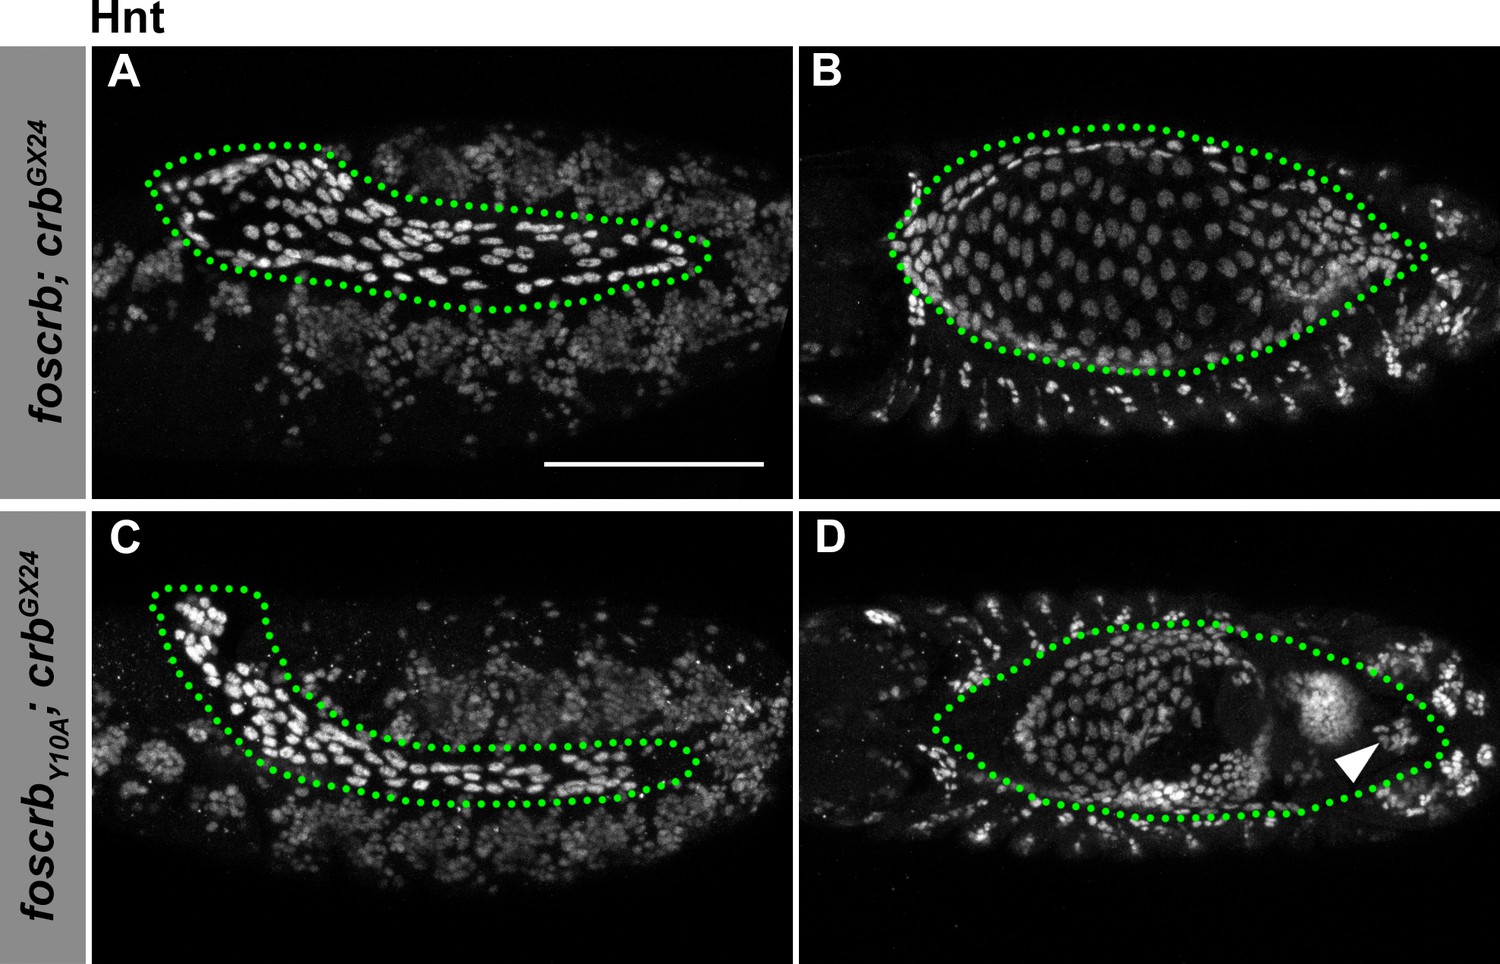
Hindsight expression in foscrb and foscrbY10A embryos.
(A-D) Expression of Hindsight (Hnt) at stage 12 (A,C, lateral view) and stage 14 (B,D, dorsal view). In all images the AS is inside the green dotted line. Note that the AS is properly specified in foscrb and foscrbY10A embryos, and at stage 14, Hnt staining is comparable between the two genotypes (B,D), and Hnt is present even in the cells that have detached from the AS in the foscrbY10A embryos (D, arrowhead). Scale bar: 100 μm.
Figure 4—figure supplement 2
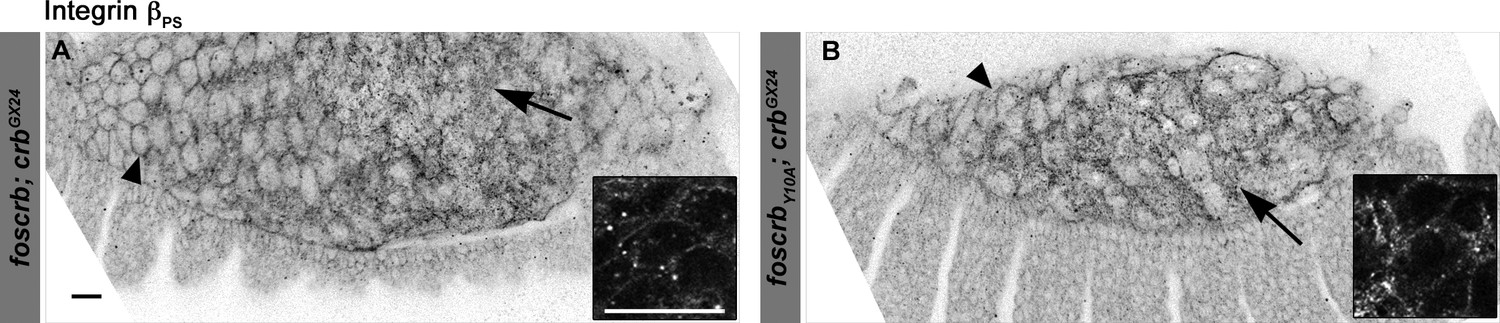
Localisation of integrin βPS in the AS of foscrb and foscrbY10A embryos.
(A,B) The localisation of the integrin-βPS is similar in foscrb and foscrbY10Aembryos. The images are projections of ∼1 μm thickness; thus, in some cells it is possible to see the localisation of the integrin-βPS at the basal membrane (arrows), while in other cells it is possible to see the protein localisation at the lateral membrane (arrowheads). The inserts are magnification of a single confocal plane (0.45 μm) through the middle part of the AS cells in the respective genotypes. Scale bars: 10 μm.
Figure 4—figure supplement 3
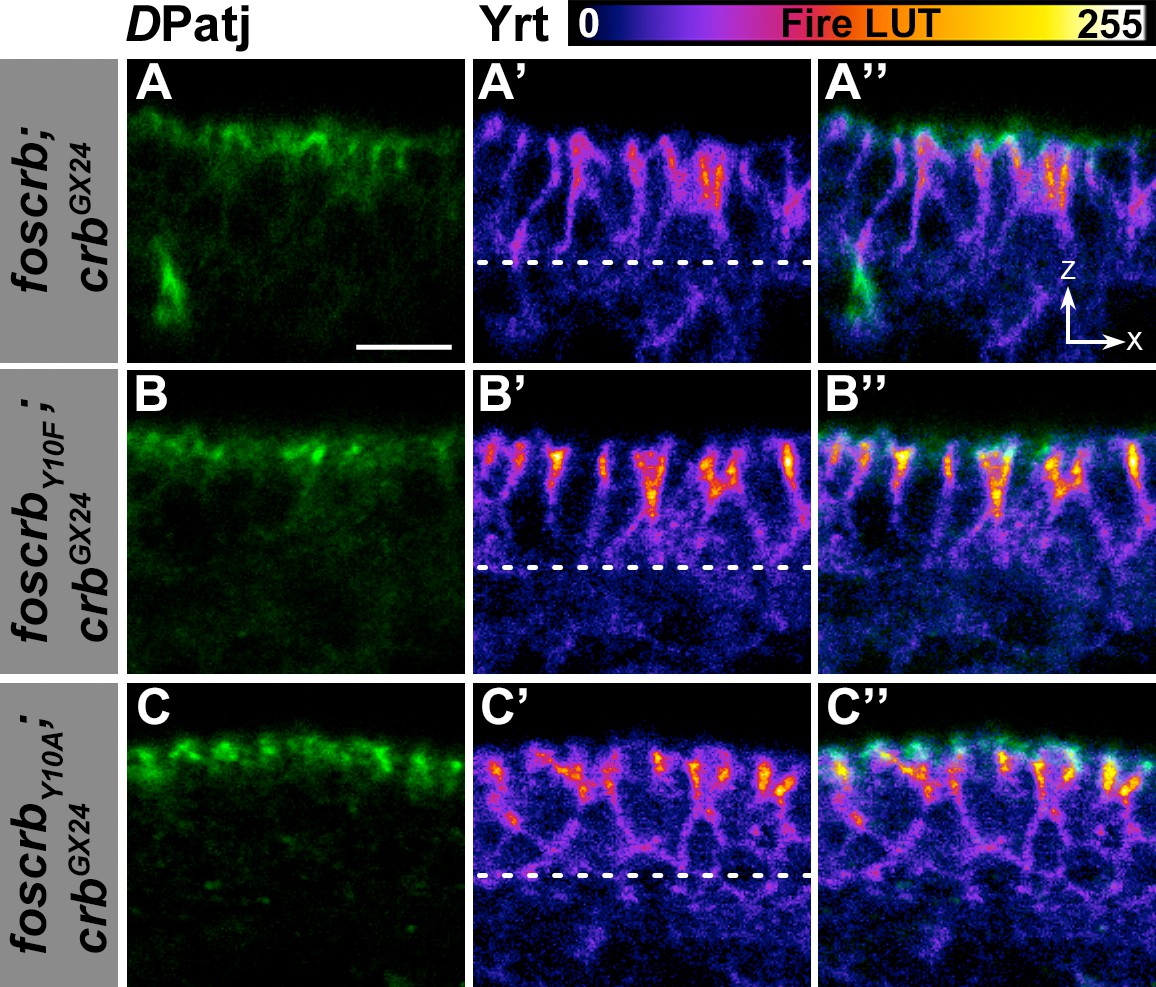
Localisation of DPatj and Yrt in the dorsal epidermis.
(A-C’’) Cross section (ZX view –see reference axis in Figure 1K) of the dorsal epidermis of embryos at stage 14 stained for DPatj (green) and Yrt (fire LUT-pseudocolor). In all images the apical aspect of the cells is at the top and the dotted line marks the basal aspect. (A-A’’) w;foscrb;crbGX24. (B-B’’) w;foscrbY10F;crbGX24. (C-C’’) w;foscrbY10A;crbGX24. Note that Yrt is concentrated toward the apical aspect of the cells in all genotypes. Scale bar: 5 μm. Representative images from 8–12 different embryos for each genotype.
Figure 4—figure supplement 4
JNK signalling is normal in foscrbY10F embryos.
(A-C) Activation of the JNK pathway in the DME cells analysed with the enhancer trap pucE69 (β–galactosidase staining). DE-cad staining is in green. In all images anterior is to the left. From the beginning to the end of DC, Puc expression is normally induced on each side of the embryo in the single row of DME cells. When DC is completed, a single row of cells on each side of the embryo is β–gal positive (C). Scale bar: 10 μm.
Figure 5 with 1 supplement
The FBM of Crb is essential for the regulation of actomyosin activity in the AS.
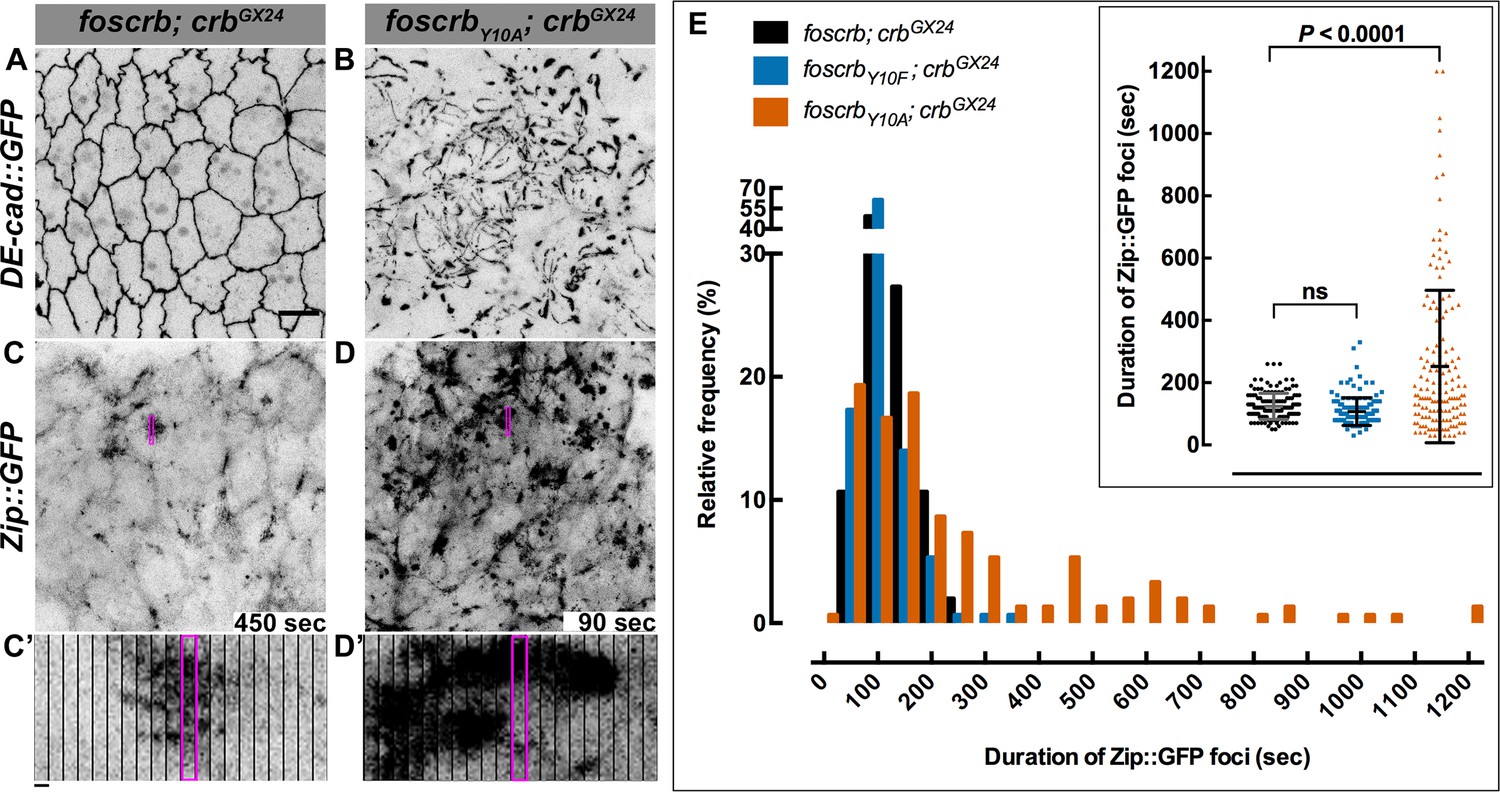
Stills from views of the AS in live imaging of embryos expressing DE-cad::GFP knock-in (A,B, Video 8) or Zip::GFP (C-D’, Video 9). In all images the anterior part is towards the left. Scale bar: 10 μm. (A) w;foscrb,DE-cad::GFP;crbGX24. (B) w;foscrbY10A,DE-cad::GFP;crbGX24. (C) w;foscrb/Zip::GFP;crbGX24. (D) w;foscrbY10A/Zip::GFP;crbGX24. The embryos were collected during 30 min, incubated at 28ºC for 7 hr and imaged under the same conditions. The numbers in (C,D) indicate the time in seconds for the corresponding frame in Video 9. In foscrb embryos (A), DE-cad::GFP is localised at cell-cell junctions; but in foscrbY10A (B) embryos DE-cad::GFP continuity is strongly disturbed. (C’,D’) Kymographs of the Zip::GFP foci in the magenta box in (C,D). Scale bar in (C’) 10 sec. (E) Histogram of the relative frequency of Zip::GFP foci duration during the pulsed contractions of the AS in w;foscrb/Zip::GFP;crbGX24, w;foscrbY10F/Zip::GFP;crbGX24 and w;foscrbY10A/Zip::GFP;crbGX24 embryos. The graph in the insert shows all data points collected, and indicates the mean ± SD. ANOVA test followed by a Dunnett’s multiple-comparison test; ns-not significant difference. n = 150 foci collected from each of the three different embryos.
Figure 5—figure supplement 1
The FBM of Crb regulates the actomyosin activity in the AS.
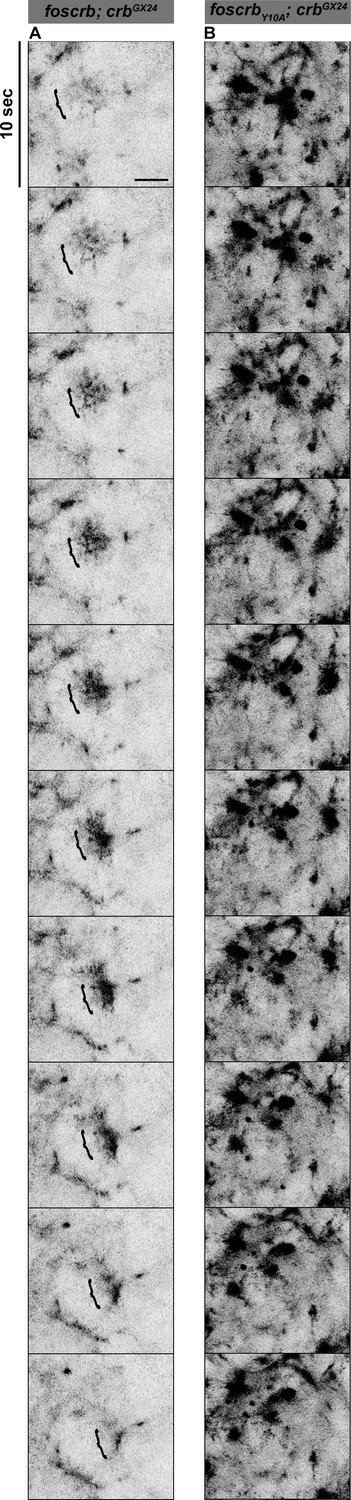
Stills from Video 10 where a Zip::GFP cluster forms and disappears (followed by the bracket) in an AS cell during the pulsed contraction in a w;foscrb/Zip::GFP;crbGX24 embryo (A). In contrast, several Zip::GFP foci are present and do not disappear in the w;foscrbY10A/Zip::GFP;crbGX24 embryo (B). Scale bar: 5 μm.
Figure 6 with 1 supplement
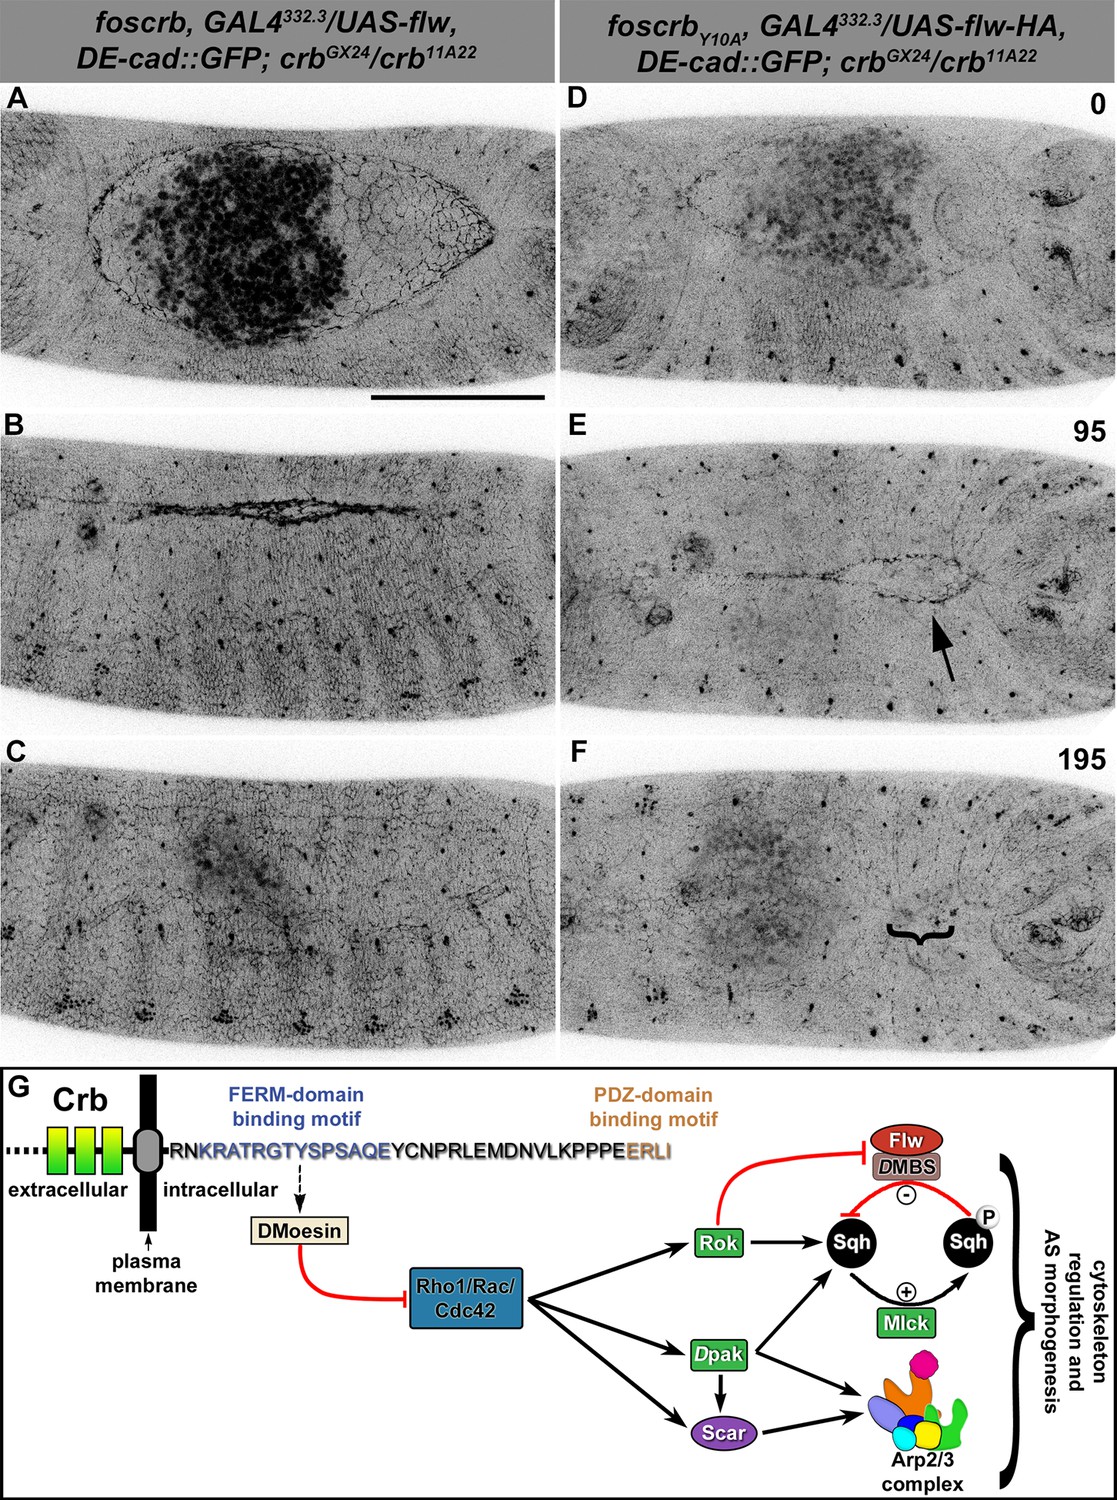
Expression of the myosin phosphatase Flapwing in the AS of foscrbY10A embryos suppresses the DC defects.
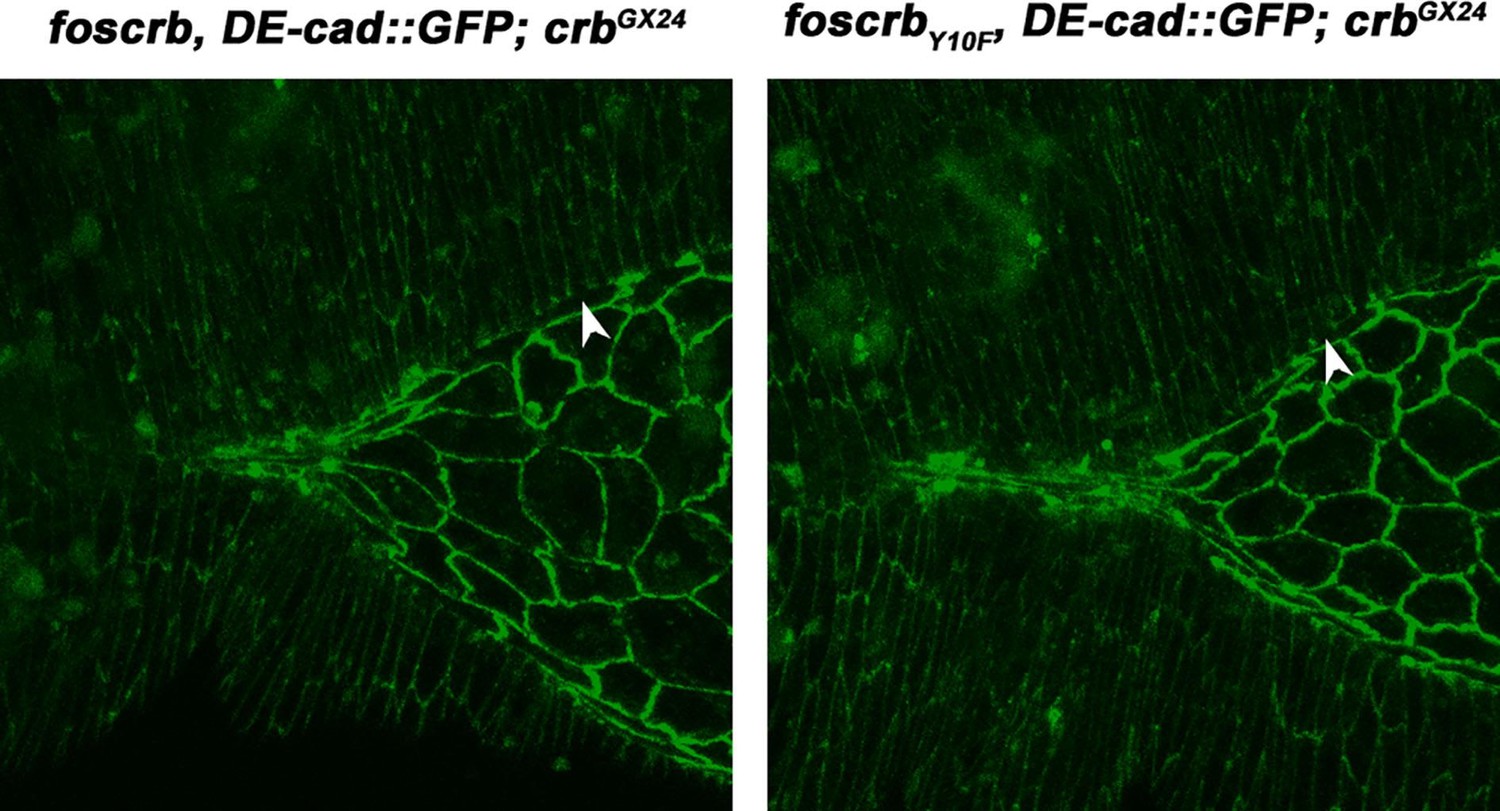
(A-F) Stills from dorsal views of live imaging of embryos expressing DE-cad::GFP knock-in and Flw-HA in the AS cells under the control of the GAL4332.3 driver (Video 11), for the genotypes w;foscrb,GAL4332.3/UAS-flw-HA,DE-cad::GFP;crbGX24/crb11A22,UAS-Act::RFP and w;foscrbY10A,GAL4332.3/UAS-flw-HA,DE-cad::GFP;crbGX24/crb11A22,UAS-Act::RFP. All embryos were collected at the same time (1 hr collection), incubated at 28ºC for 7 hr and imaged together. The numbers on (D-F) indicate the time in minutes for the corresponding row. The over-expression of Flw-HA in the AS cells does not produce any obvious phenotype in foscrb (A-C) embryos, and it suppresses the DC defects in foscrbY10A (D-F) embryos; some defects found include an irregular zippering at the posterior canthus (E, arrow) as well as bunching of the dorsal epidermal (F, bracket). Scale bar: 100 μm. Representative images from 6–9 different embryos for each genotype. (G) Scheme of the possible pathways regulated by the FBM of Crb in the AS. Crb: Crumbs; Rok: Rho-kinase; Dpak: Drosophila p21-activated kinase; Flw: Flapwing; DMBS: Drosophila myosin-binding-subunit; Sqh: spaghetti-squash; Mlck: myosin-light chain kinase.
Figure 6—figure supplement 1
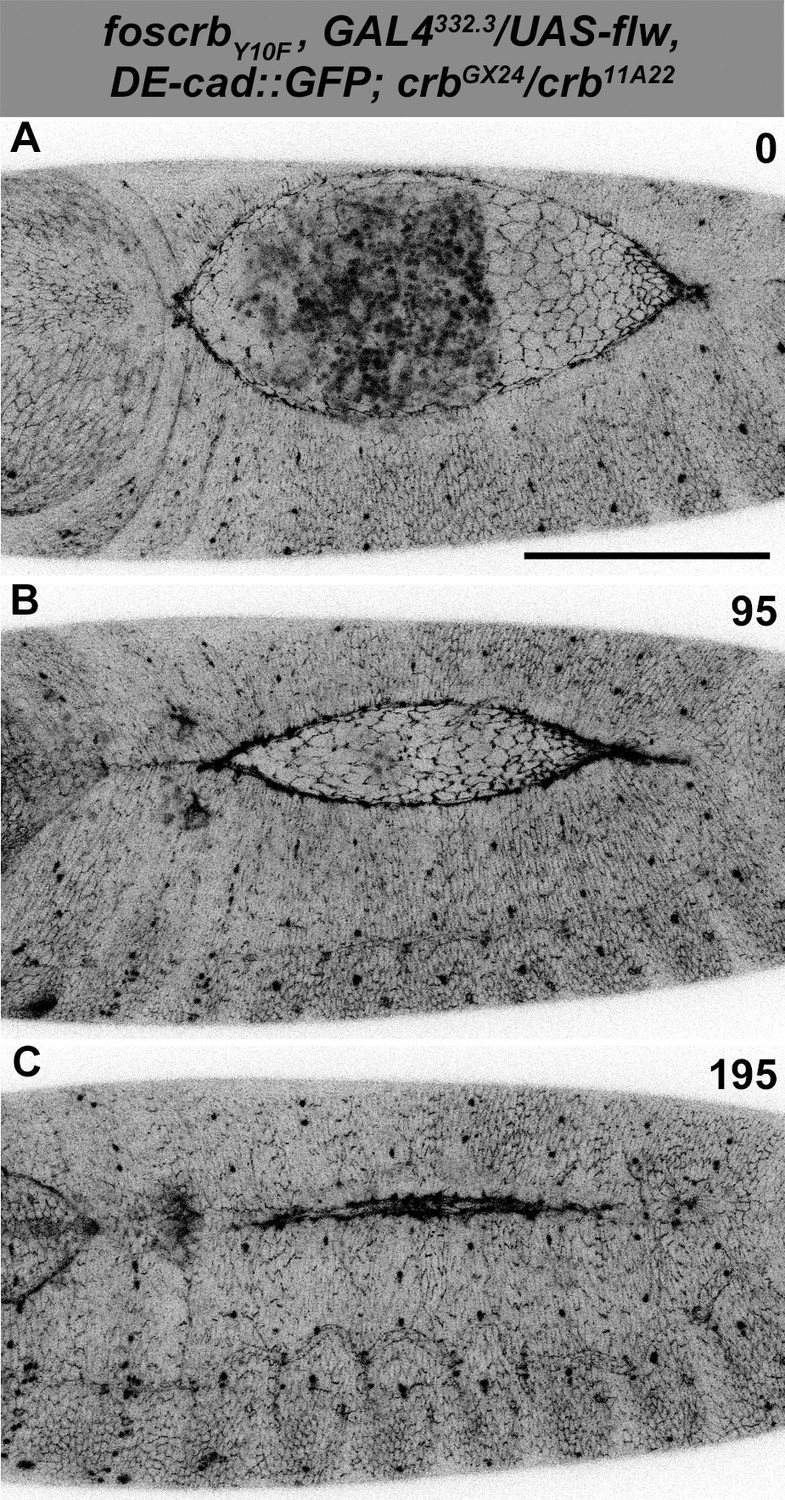
Normal DC after Flapwing expression in the AS of foscrbY10F embryos.
(A-C) Stills from dorsal views of live imaging of embryos expressing DE-cad::GFP knock-in and Flw-HA in the AS cells under the control of the GAL4332.3 driver, for the genotype w;foscrbY10F,GAL4332.3/UAS-flw-HA,DE-cad::GFP;crbGX24/crb11A22,UAS-Act::RFP. Embryo collection, incubation and imaging as described in Figure 6. The numbers on (A-C) indicate the time in minutes for the corresponding row. The over-expression of Flw-HA in the AS cells does not produce any obvious phenotype. Scale bar: 100 μm. Representative images from 7 different embryos.
Figure 7 with 3 supplements
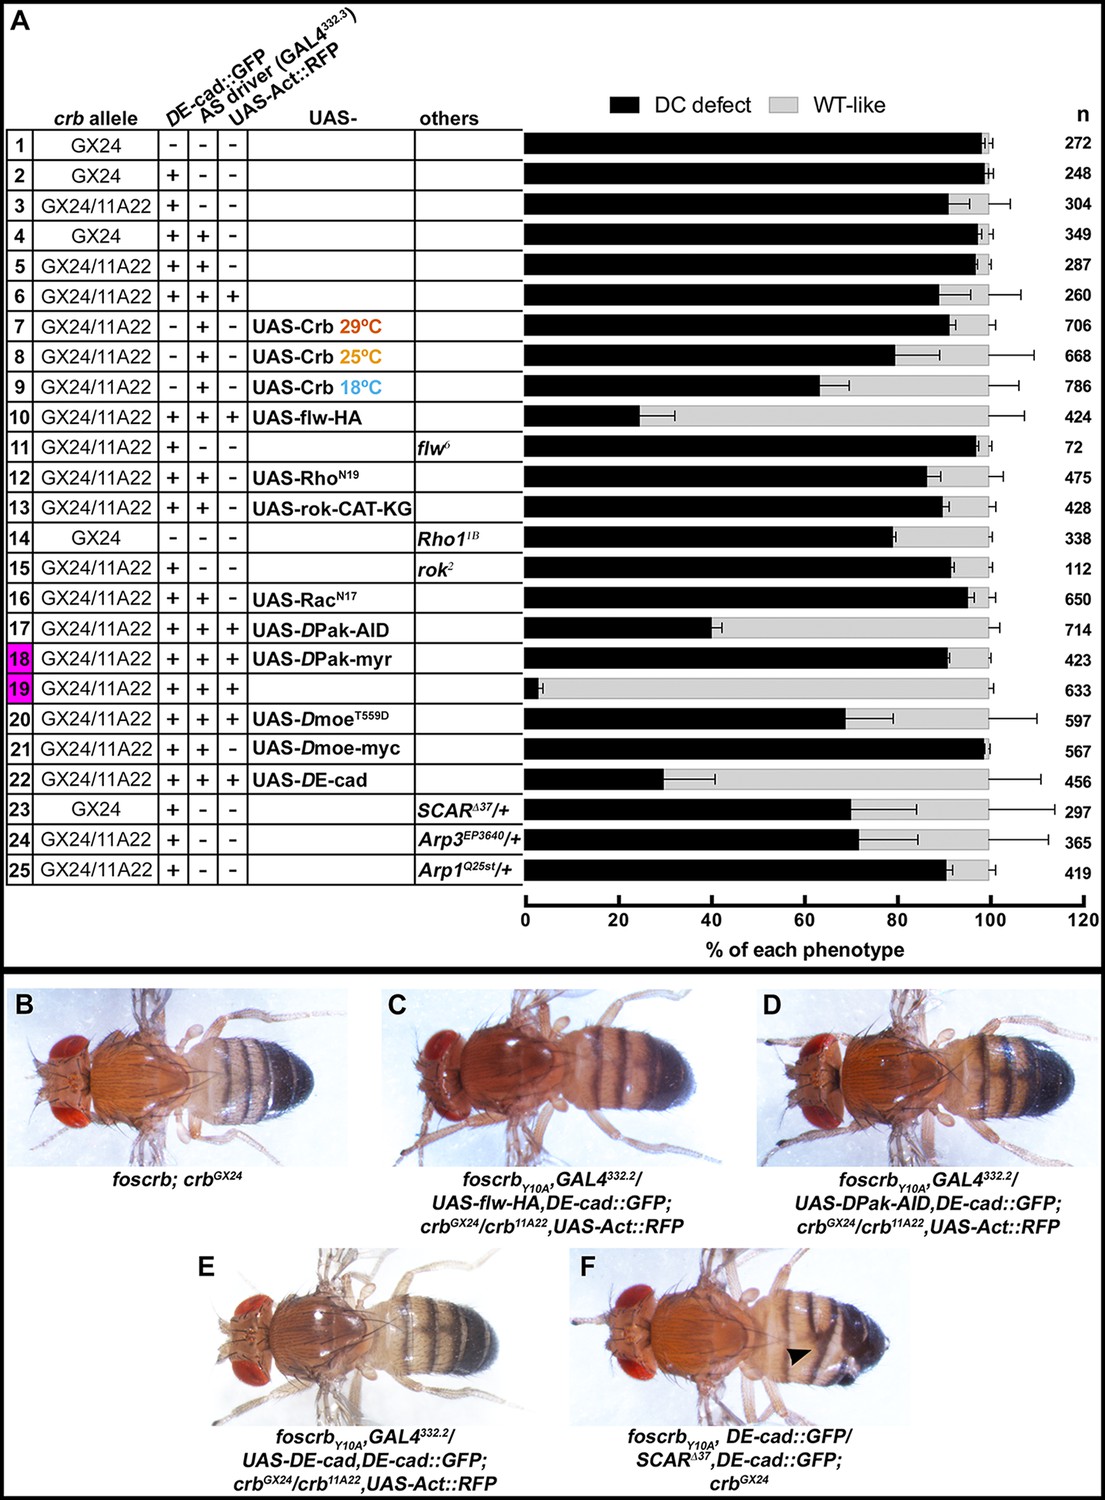
Reduction in actomyosin activity suppresses the DC defects in embryos expressing the foscrbY10A variant.
(A) Quantification of the defects observed in cuticle preparations from the genotypes indicated in the graph. For the complete genotype see Figure 7—figure supplement 1. The category “DC defect” includes a range of defects ranging from cuticles of embryos that completed DC but do not hatch, to cuticles with large DC openings. The category “WT-like” includes all larvae that hatch. For details about the classifications see Figure 7—figure supplement 1. Note that all the genotypes have the foscrbY10A background, except the ones highlighted in magenta, numbers 18 and 19, that have the foscrb background. mean ± SD from 2–4 independent crosses. n = total number of cuticles counted for the indicated genotype. Note that suppression of the DC phenotype in foscrbY10A embryos is particularly evident upon expression of Flw-HA (10), Pak-AID (17), and DE-cad (22). (B-F) Adult flies of the indicated genotypes. In (F), the arrowhead marks the defects in the dorsal abdomen.
Figure 7—figure supplement 1
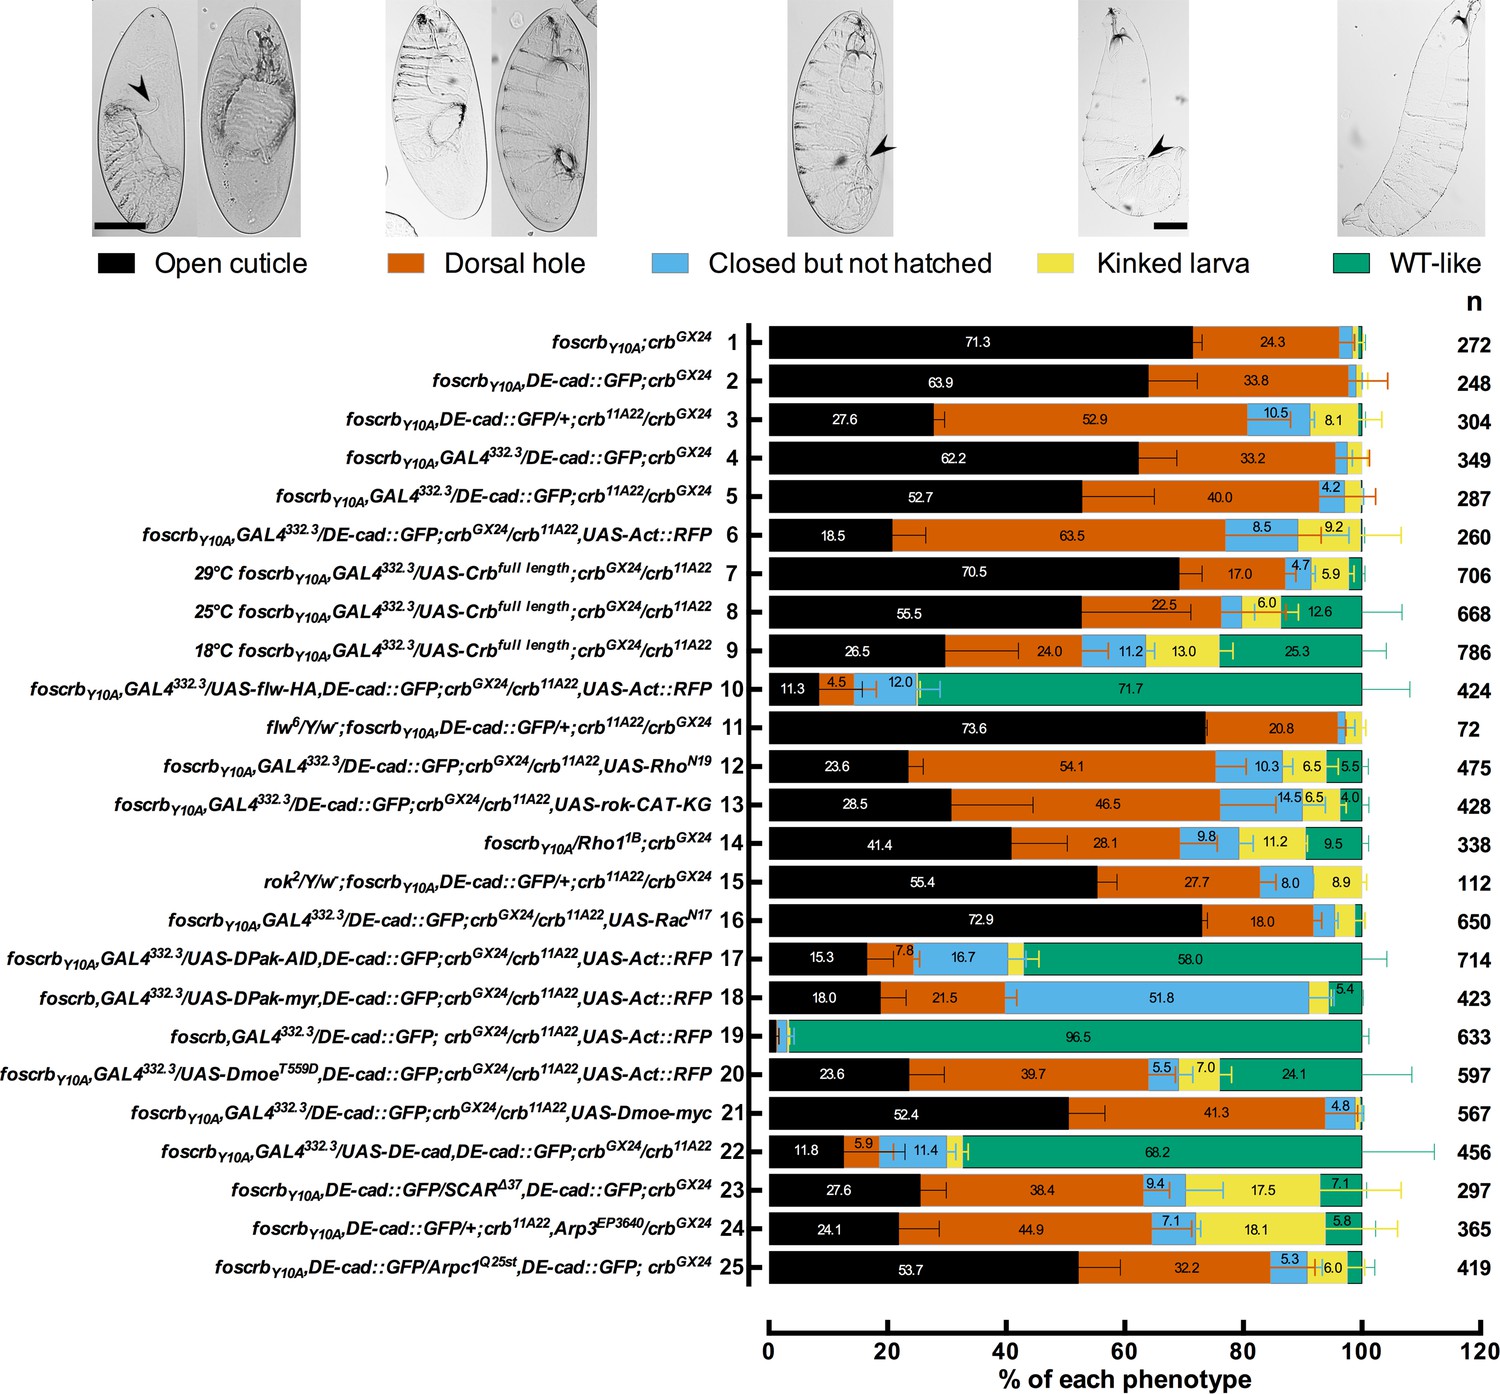
Reduction in the actomyosin activity suppresses the DC defects in embryos expressing the foscrbY10A variant.
Quantification of the defects observed in cuticle preparations from the genotypes indicated in the graph. In the category “Open cuticle”, the dorsal opening is so prominent that in some cases the mouthparts are exposed (arrowhead). Category “Dorsal hole” corresponds to those cuticles in which a medium (left picture) or small (right picture) dorsal hole is present, but the anterior part is closed. In the category “Closed but not hatched”, the closure is complete, the puckering of the epidermis is noticeable (arrowhead), but the larvae fail to hatch. In the category “Kinked larvae”, the puckering of the epidermis (arrowhead) results in larvae with the tail pointing upwards, so the larvae seem to have a kink. In the category “WT-like”, no defects are evident so the larvae are alike to wild type. mean ± SD from 2–4 independent crosses. n = total number of cuticles counted for the indicated genotype. For the statistical analysis see Table 1.
Figure 7—figure supplement 2
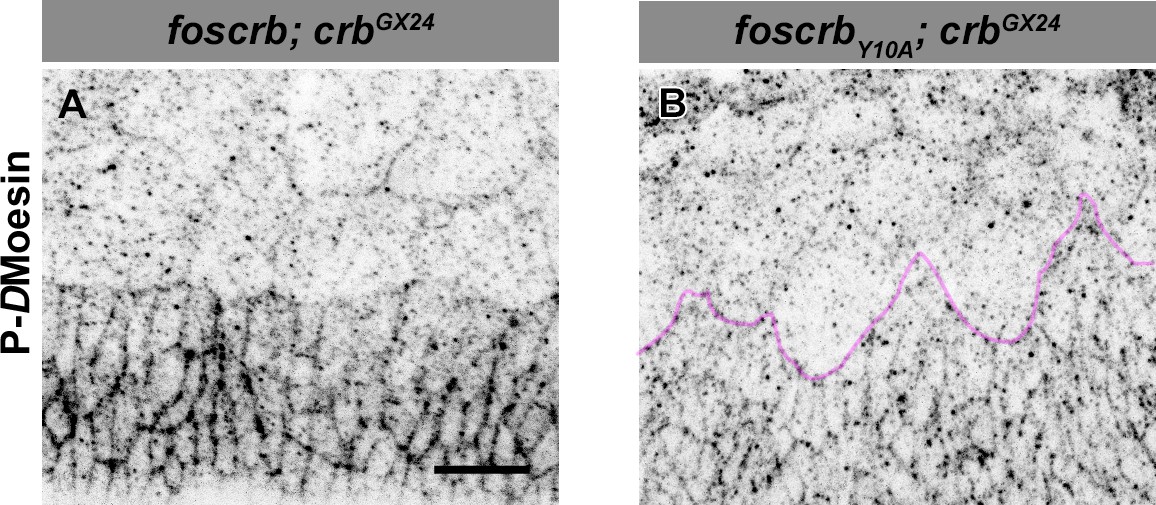
Phosphorylated DMoesin levels are reduced in embryos expressing the foscrbY10A variant.
Localisation of phospho-DMoesin (P-DMoe, A,B) in embryos at the beginning of stage 14. In all images the AS is at the top, for the genotypes w;foscrb;crbGX24 and w;foscrbY10A;crbGX24. The LE of foscrbY10Aembryo is marked with a magenta line (B). Scale bar: 10 μm. Representative images from 9 different embryos for each genotype.
Figure 7—figure supplement 3
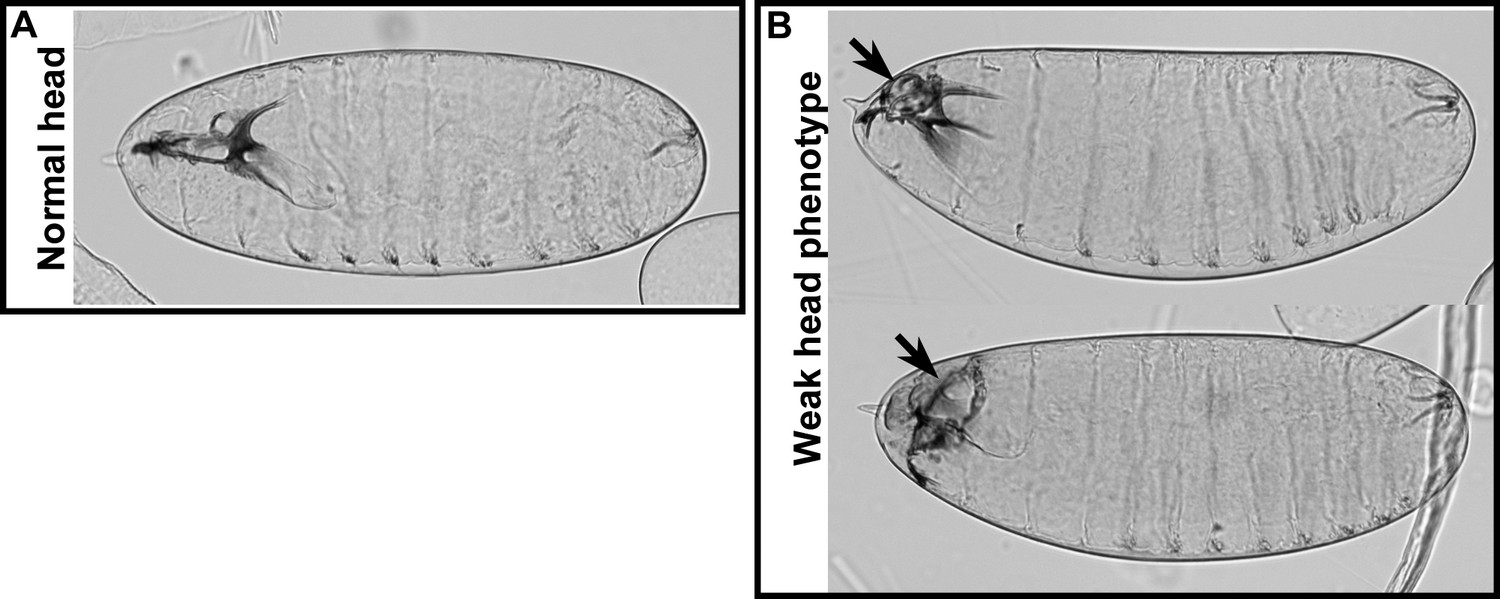
Weak head phenotype of embryos expressing the foscrbY10A variant.
Examples of cuticles with a weak head phenotype: the arrows mark an opening in the anterior part.
Figure 8

Reduction of the SCAR-Arp complex activity suppresses the DC defects and ameliorates the loss of DE-cadherin in the AS of embryos expressing the foscrbY10A variant.
(A-F) Stills from dorsal views of live imaging of embryos expressing DE-cad::GFP knock-in and heterozygous for the SCAR∆37 loss of function allele (Video 13). In all images the anterior is to the left, for the genotypes w;foscrb,DE-cad::GFP/SCAR∆37,DE-cad::GFP;crbGX24 and w;foscrbY10A,DE-cad::GFP/SCAR∆37,DE-cad::GFP;crbGX24. All embryos were collected at the same time (1 hr collection), incubated at 28ºC for 7 hr and imaged together. The numbers in (B,D,F) indicate the time in minutes for the corresponding row. DC occurs normally in foscrb (A,C,D) embryos heterozygous for the SCAR∆37 allele, and DC defects are suppressed in foscrbY10A (B,D,F) embryos; some defects still visible include the impaired GB retraction (compare B with A), asymmetric position of the posterior spiracles (D, arrows), and bunching of the dorsal epidermis (D, bracket). Scale bar: 100 μm. (G,H) Magnified views of AS from (A,B, respectively). Note that, in order to make the localisation of DE-cad::GFP more perceptible, the autofluorescence of the yolk (visible in A,B) was removed from the original stack by hand using Fiji. Scale bar: 100 μm. Representative images from 6–9 different embryos for each genotype.
Author response image 1
Author response image 2
Author response image 3
Videos
Video 1
Dorsal closure (DC) in a w;foscrb,DE-cad::GFP;crbGX24 embryo.
Note that the granules from the yolk are visible because of their strong auto-fluorescence in the green part of the spectrum. Time-lapse: 3.5 min; 12 fps.
Video 2
Defective germ band (GB) retraction and DC phenotype in a w;foscrbY10A,DE-cad::GFP;crbGX24 embryo.
Time-lapse: 3.5 min; 12 fps.
Video 3
Filopodia movement at the leading edge (LE) of the dorsal most epidermal (DME) cells in w;foscrb;crbGX24,Sas::Venus (top) and w;foscrbY10A;crbGX24,Sas::Venus (bottom) embryos.
The filopodia at the DME cells were followed for 5 min and the movie loops 6 times. Note that the filopodia in the foscrbY10A embryo move randomly and some filopodia, like the one label with the arrow (bottom embryo), appear to detach and move out of the plane. Time-lapse: 10 sec; 8 fps.
Video 4
Lateral views during germ band (GB) retraction in w;foscrb,DE-cad::mTomato;crbGX24 (top) and w;foscrbY10A,DE-cad::mTomato;crbGX24 (bottom) embryos.
Time-lapse: 10 min; 8 fps.
Video 5
Dorsal views during GB retraction and the beginning of DC in w;foscrb,DE-cad::GFP;crbGX24 (top) and w;foscrbY10A,DE-cad::GFP;crbGX24 (bottom) embryos.
Note that the yolk aggregates are clearly visible because they have an intense autofluorescence in the green part of the spectrum. Time-lapse: 10 min; 8 fps.
Video 6
Dorsal views during DC in w;foscrb,GAL4332.3/foscrb,UAS-Apoliner;crbGX24 (first row), and two examples of w;foscrbY10A,GAL4332.3/foscrbY10A,UAS-Apoliner;crbGX24 (second and third rows) embryos.
Apoliner GFP signal is on the left (green), the RFP signal on the middle (magenta), and the merge on the right. At the time 210 min, the blinking arrows in the merge of the foscrb embryo indicate some apoptotic AS cells separated clearly. Time-lapse: 10 min; 8 fps.
Video 7
DC in yrt∆75a zygotic mutants expressing the different fosmids. w;foscrb,DE-cad::GFP;yrt∆75acrb11A22 (top) and w;foscrbY10A,DE-cad::GFP;yrt∆75acrb11A22 (bottom) embryos.
The arrow in the top embryo marks the characteristic defects in the posterior canthus observed during DC in yrt∆75a zygotic mutants. In the w;foscrbY10A,DE-cad::GFP;yrt∆75acrb11A22 embryo the GB retraction and the DC phenotypes are comparable to the ones in the w;foscrbY10A,DE-cad::GFP;crbGX24 (Video 2). Time-lapse: 6 min; 12 fps.
Video 8
Dorsal views during the pulsed contractions of AS cells in w;foscrb,DE-cad::GFP;crbGX24 (left) and w;foscrbY10A,DE-cad::GFP;crbGX24 (right).
Time-lapse: 10 sec; 15 fps.
Video 9
Dorsal views during the pulsed contractions of AS cells in w;foscrb/Zip::GFP;crbGX24 (left) and w;foscrbY10A/Zip::GFP;crbGX24 (right).
Time-lapse: 10 sec; 15 fps.
Video 10
Magnifications of a small group of cells shown in the Video 11 to see in more detail the medial foci accumulation of Zip::GFP during the cell contraction.
These magnifications (2X from original) were created using a bicubic algorithm in Fiji. w;foscrb/Zip::GFP;crbGX24 (left) and w;foscrbY10A/Zip::GFP;crbGX24 (right). Time-lapse: 10 sec; 15 fps.
Video 11
Dorsal views during DC in embryos expressing the phosphatase Flw in the AS cells under the control of the GAL4332.3 driver.
The signal from the UAS-Actin::RFP is not shown. w;foscrb,GAL4332.3/UAS-flw-HA,DE-cad::GFP;crbGX24/crb11A22,UAS-Act::RFP (top) and w;foscrbY10A,GAL4332.3/UAS-flw-HA,DE-cad::GFP;crbGX24/crb11A22,UAS-Act::RFP (bottom). Time-lapse: 5 min; 12 fps.
Video 12
Flw expression in the AS of foscrbY10A embryos suppresses the disruption of the ZA.
Dorsal views during the pulsed contractions of AS cells. The signal from the UAS-Actin::RFP is not shown. (A,B) Embryos that do not express the Flw and are trans-heterozygous for DE-cad::GFP; (A) w;foscrb/UAS-flw-HA,DE-cad::GFP;crbGX24/crb11A22,UAS-Act::RFP and (B) w;foscrbY10A/UAS-flw-HA,DE-cad::GFP;crbGX24/crb11A22,UAS-Act::RFP. (C,D) Embryos that express Flw in the AS cells under the control of the GAL4332.3 driver; (C) w;foscrb,GAL4332.3/UAS-flw-HA,DE-cad::GFP;crbGX24/crb11A22,UAS-Act::RFP and (D) w;foscrbY10A,GAL4332.3/UAS-flw-HA,DE-cad::GFP;crbGX24/crb11A22,UAS-Act::RFP. Time-lapse: 10 sec; 15 fps.
Video 13
Dorsal views during DC in embryos heterozygous for the SCAR∆37 allele.
w;foscrb,DE-cad::GFP/SCAR∆37,DE-cad::GFP;crbGX24 (top) and w;foscrbY10A,DE-cad::GFP/SCAR∆37,DE-cad::GFP;crbGX24 (bottom). Time-lapse: 10 min; 8 fps.
Video 14
Dorsal views during DC in embryos heterozygous for the Arp3EP3640 allele.
w;foscrb,DE-cad::GFP/+;crb11A22,Arp3EP3640/crbGX24 (top) and w;foscrbY10A,DE-cad::GFP/+;crb11A22,Arp3EP3640/crbGX24 (bottom). Time-lapse: 10 min; 8 fps.
Author response Video 1
Dorsal closure (DC) in a w;foscrb,DE-cad::GFP;crbGX24 embryo.
Note that the granules from the yolk are visible because of their strong auto-fluorescence in the green part of the spectrum. Time-lapse: 3.5 min; 12 fps.
Author response Video 2
Dorsal closure (DC) in a w;foscrb,DE-cad::GFP;crbGX24 embryo.
Note that the granules from the yolk are visible because of their strong auto-fluorescence in the green part of the spectrum. Time-lapse: 3.5 min; 12 fps.
Tables
Table 1
Statistical analyses of the results shown in the Figure 7—figure supplement 1.
| Open cuticle | Dorsal hole | Closed but not hatched | Kinked larvae | WT-like | |||
|---|---|---|---|---|---|---|---|
| 1 | foscrbY10A;crbGX24 | ||||||
| vs | 14 | foscrbY10A/Rho11B;crbGX24 | ∗∗ | ns | ns | ∗ | ∗∗∗ |
| 2 | foscrbY10A,DE-cad::GFP;crbGX24 | ||||||
| vs | 23 | foscrbY10A,DE-cad::GFP/SCAR∆37,DE-cad::GFP;crbGX24 | ∗∗∗∗ | ns | ns | ∗∗∗∗ | ∗∗∗∗ |
| vs | 25 | foscrbY10A,DE-cad::GFP/Arpc1Q25st,DE-cad::GFP;crbGX24 | ns | ns | ns | ns | ns |
| 3 | foscrbY10A,DE-cad::GFP/+;crb11A22/crbGX24 | ||||||
| vs | 11 | flw6/Y/w*;foscrbY10A,DE-cad::GFP/+;crb11A22/crbGX24 | ∗∗∗∗ | ∗∗ | ∗∗ | ns | ns |
| vs | 15 | rok2/Y/w*;foscrbY10A,DE-cad::GFP/+;crb11A22/crbGX24 | ∗ | ns | ns | ns | ns |
| vs | 24 | foscrbY10A,DE-cad::GFP/+;crb11A22,Arp3EP3640/crbGX24 | ns | ns | ns | ns | ∗∗ |
| 5 | foscrbY10A,GAL4332.3/DE-cad::GFP;crbGX24/crb11A22 | ||||||
| vs | 7 | 29ºC foscrbY10A,GAL4332.3/UAS-Crbfull length;crbGX24/crb11A22 | ns | ns | ns | ns | ns |
| vs | 8 | 25ºC foscrbY10A,GAL4332.3/UAS-Crbfull length;crbGX24/crb11A23 | ns | ns | ns | ns | ∗∗∗∗ |
| vs | 9 | 18ºC foscrbY10A,GAL4332.3/UAS-Crbfull length;crbGX24/crb11A24 | ns | ns | ns | ns | ∗∗∗∗ |
| vs | 12 | foscrbY10A,GAL4332.3/DE-cad::GFP;crbGX24/crb11A22,UAS-RhoN19 | ∗∗ | ns | ns | ns | ∗∗ |
| vs | 13 | foscrbY10A,GAL4332.3/DE-cad::GFP;crbGX24/crb11A22,UAS-rok.CAT-KG | ns | ns | ns | ns | ∗ |
| vs | 16 | foscrbY10A,GAL4332.3/DE-cad::GFP;crbGX24/crb11A22,UAS-RacN17 | ns | ns | ns | ns | ns |
| vs | 21 | foscrbY10A,GAL4332.3/DE-cad::GFP;crbGX24/crb11A22,UAS-Dmoe-myc | ns | ns | ns | ns | ns |
| vs | 22 | foscrbY10A,GAL4332.3/UAS-DE-cad,DE-cad::GFP;crbGX24/crb11A22 | ∗∗∗∗ | ∗∗∗ | ns | ns | ∗∗∗∗ |
| 6 | foscrbY10A,GAL4332.3/DE-cad::GFP;crbGX24/crb11A22,UAS-Act::RFP | ||||||
| vs | 10 | foscrbY10A,GAL4332.3/UAS-flw-HA,DE-cad::GFP;crbGX24/crb11A22,UAS-Act::RFP | ns | ∗∗∗∗ | ns | ∗ | ∗∗∗∗ |
| vs | 17 | foscrbY10A,GAL4332.3/UAS-DPak-AID,DE-cad::GFP;crbGX24/crb11A22,UAS-Act::RFP | ns | ∗∗∗∗ | ns | ns | ∗∗∗∗ |
| vs | 20 | foscrbY10A,GAL4332.3/UAS-DmoeT559D,DE-cad::GFP;crbGX24/crb11A22,UAS-Act::RFP | ns | ∗ | ns | ns | ∗∗∗∗ |
| 18 | foscrb,GAL4332.3/UAS-Dpak-myr,DE-cad::GFP;crbGX24/crb11A22,UAS-Act::RFP | ||||||
| vs | 19 | foscrb,GAL4332.3/DE-cad::GFP;crbGX24/crb11A22,UAS-Act::RFP | ∗∗ | ∗∗∗ | ∗∗∗∗ | ns | ∗∗∗∗ |
-
One-way-ANOVA analysis followed by a Dunnet’s multiple comparisons test between the indicated categories of the different genotypes. Statistical significant difference indicated as follows: ns p>0.05; *p≤0.05; **p≤0.01; ***p≤0.001; ****p≤0.0001.
Table 2
List of fly stocks used in this study.
| Fly stock | Description |
|---|---|
| w | All stocks have the w* or w1118 background |
| w;foscrb w;foscrbY10F w;foscrbY10A | Flies expressing fosmid variants of crb under the control of the endogenous promoter and inserted into the landing site attP40 on 2nd chromosome; described in (Klose et al., 2013) |
| w;;crb11A22/TTG | crb null allele; BSC 3448 |
| w;;crbGX24/TTG | crb null allele (Huang et al., 2009) |
| w;;yrt∆75acrb11A22/TTG | yrt protein null allele recombined with the crb11A22 allele (Laprise et al., 2006) |
| w;;pucE69/TTG | lacZ enhancer trap in the puc locus, a read-out of JNK signalling (Ring and Martinez Arias, 1993; Martín-Blanco et al., 1998) |
| w;SCAR∆37/CTG | Loss of function allele (Zallen et al., 2002); BSC 8754 |
| w;;Arp3EP3640/TTG | generated by Berkeley Drosophila Genome Project (Hudson and Cooley, 2002); BSC 17149 |
| w;ex697/CTG | lacZ enhancer trap in the ex locus; kindly provided by Nick Tapon |
| w;nub1Arpc1Q25st FRT40A/CTG | Nonsense mutation at Gln25 (CAG→TAG); behaves as a null mutant (Hudson and Cooley, 2002); BSC 9135 |
| w flw6/FTG | Amorphic allele (Raghavan et al., 2000); BSC 23693 |
| y w rok2 FRT19A/FTG | Encodes the first 21 amino acids of rok followed by a 35 aa random peptide and a stop codon (Winter et al., 2001); BSC 6666 |
| w;Rho11B/CTG | Rho1 loss of function allele; BSC 9477 |
| w;DE-cad::GFP | DE-cadherin fused with GFP knock-in allele; homozygous viable (Huang et al., 2009) |
| w;DE-cad::mTomato | DE-cadherin fused with mTomato knock-in allele; homozygous viable (Huang et al., 2009) |
| w;Zipper::GFP | Protein trap line: Zipper fused with GFP under endogenous promoter; homozygous viable; BSC 51564. |
| w;sqh::Utrophin::GFP | Actin binding domain of human Utrophin fused with GFP under the control of the sqh promoter (Rauzi et al., 2010). |
| w;;Sas::Venus | On 3rd; Stranded at Second fused with Venus under tubulin promoter (Firmino et al., 2013) |
| w; GAL4332.2 | On 2nd; expresses GAL4 in amnioserosa; BSC 5398 |
| w; UAS-Apoliner | On 2nd; engineered apoptotic reporter (Bardet et al., 2008); BSC 32122 |
| w; UAS-flw-HA | On 2nd; HA-tagged flw protein under UAS control; BSC 23703 |
| w;; UAS-Rho1N19 | On 3rd; dominant negative Rho1 under the control of UAS; BSC 7328 |
| w;; UAS-RacN17 | On 3rd; dominant negative Rac under the control of UAS; BSC 6292 |
| w; UAS-Cdc47N17 | On 2nd; negative Cdc42 under the control of UAS; BSC 6288. The stock w;DE-cad::GFP,UAS-Cdc42N17/(CTG);crb11A22,UAS-Actin::RFP/TM6B-YFP or TTG was not possible to obtain, probably because the expression of CdcN17, induced by the GAL4 from the balancer chromosome is detrimental. |
| w;; UAS-moeT559D-myc | On 2rd; phosphomimetic Moesin under the control of UAS; BSC 8630 |
| w;; UAS-moe-myc | On 3rd; myc-tagged Moesin under the control of UAS; BSC 52236 |
| w; UAS-Pak-myr | On 2nd: constitutively-active, membrane-bound Pak under UAS control; BSC 8804 |
| w; UAS-Pak-AID | On 2nd; Pak autoinhibitory domain under UAS control; kindly provided by Nicholas Harden (Conder et al., 2004) |
| w;; UAS-Act::RFP | On 3rd; RFP-tagged Act5C under UAS control; BSC 24779 |
| w;; UAS-rok-CAT-KG | On 3rd; a kinase-dead rok under UAS control; BSC 6671 |
| FTG | Balancer on 1st FM7c, twi-GAL4 UAS-EGFP; from BSC 6873 |
| CTG | Balancer on 2nd CyO, twi-GAL4 UAS-EGFP; from BSC 6662 |
| TTG | Balancer on 3rd TM3, twi-GAL4 UAS-EGFP Sb1 Ser1; from BSC 6663 |
| TM6B-YFP | Balancer on 3rdTM6B, Dfd-EYFP, Sb1 Tb1 ca1; from BSC 8704 |
-
BSC - Bloomington stock center; DGRC - Drosophila Genetic Resource Center.
Table 3
Antibodies and probes employed.
| Dilution | Source | |
|---|---|---|
| Phalloidin Alexa Fluor 555 | 1:500 | Invitrogen |
| Alexa Fluor 488-, 568-, and 647-conjugated | 1:500 | Invitrogen |
| Rat antibodies | ||
| anti-Crb2.8 | 1:500 | (Richard et al., 2006) |
| anti-DE-cadherin | 1:20 | DSHB DCAD2 |
| anti-Yurt | 1:100 | (Laprise et al., 2006) |
| Mouse antibodies | ||
| anti-α-Spectrin | 1:25 | DSHB 3A9 |
| anti-β-galactosidase | 1:200 | DSHB 40-1a |
| anti-Coracle | 1:25 | DSHB C566.9 |
| anti-Crb-Cq4 | 1:300 | DSHB Cq4 |
| anti-Disc large | 1:100 | DSHB 4F3 |
| anti-Enabled | 1:100 | DSHB 5G2 |
| anti-GFP | 1:500 | Roche 11814460001 (Mannheim, Germany) |
| anti-Hindsight | 1:100 | DSHB 1G9 |
| anti-Integrin βPS | 1:2 | DSHB CF.6G11 |
| anti-Phosphotyrosine | 1:100 | BD Transduction Laboratories cat. no. 610000 |
| anti-SCAR | 1:25 | DSHB P1C1 |
| Rabbit antibodies | ||
| anti-Bazooka | 1:500 | kindly provided by A. Wodarz |
| anti-DAAM | 1:3000 | kindly provided by József Mihály (unpublished) |
| anti-Diaphanous | 1:5000 | kindly provided by Steven A. Wasserman (Afshar et al., 2000) |
| anti-DPatj | 1:1000 | (Richard et al., 2006) |
| anti-Echinoid | 1:5000 | kindly provided by Laura Nilson (Laplante and Nilson, 2006) |
| anti-Expanded | 1:300 | (Boedigheimer and Laughon, 1993) |
| anti-GFP | 1:500 | Invitrogen |
| anti-DPak | 1:8000 | kindly provided by Nicholas Harden (Harden et al., 1996) |
| anti-Polychaetoid | 1:5000 | kindly provided by Sarah Bray (Djiane et al., 2011) |
| anti-Phospho-Moesin | 1:100 | Cell Signaling Technology 3150 (Danvers, Massachusetts, USA) |
| anti-Stranded at second | 1:500 | kindly provided by E. Organ and D. Cavener |
-
Invitrogen, Molecular Probes (Eugene, Oregon, USA); DSHB - Developmental Studies Hybridoma Bank (Iowa city, Iowa, USA)
Download links
A two-part list of links to download the article, or parts of the article, in various formats.
Downloads (link to download the article as PDF)
Open citations (links to open the citations from this article in various online reference manager services)
Cite this article (links to download the citations from this article in formats compatible with various reference manager tools)
Crumbs is an essential regulator of cytoskeletal dynamics and cell-cell adhesion during dorsal closure in Drosophila
eLife 4:e07398.
https://doi.org/10.7554/eLife.07398


