The Caenorhabditis elegans protein SAS-5 forms large oligomeric assemblies critical for centriole formation
- University of Oxford, United Kingdom
- Swiss Federal Institute of Technology, Switzerland
Figures
Figure 1 with 5 supplements
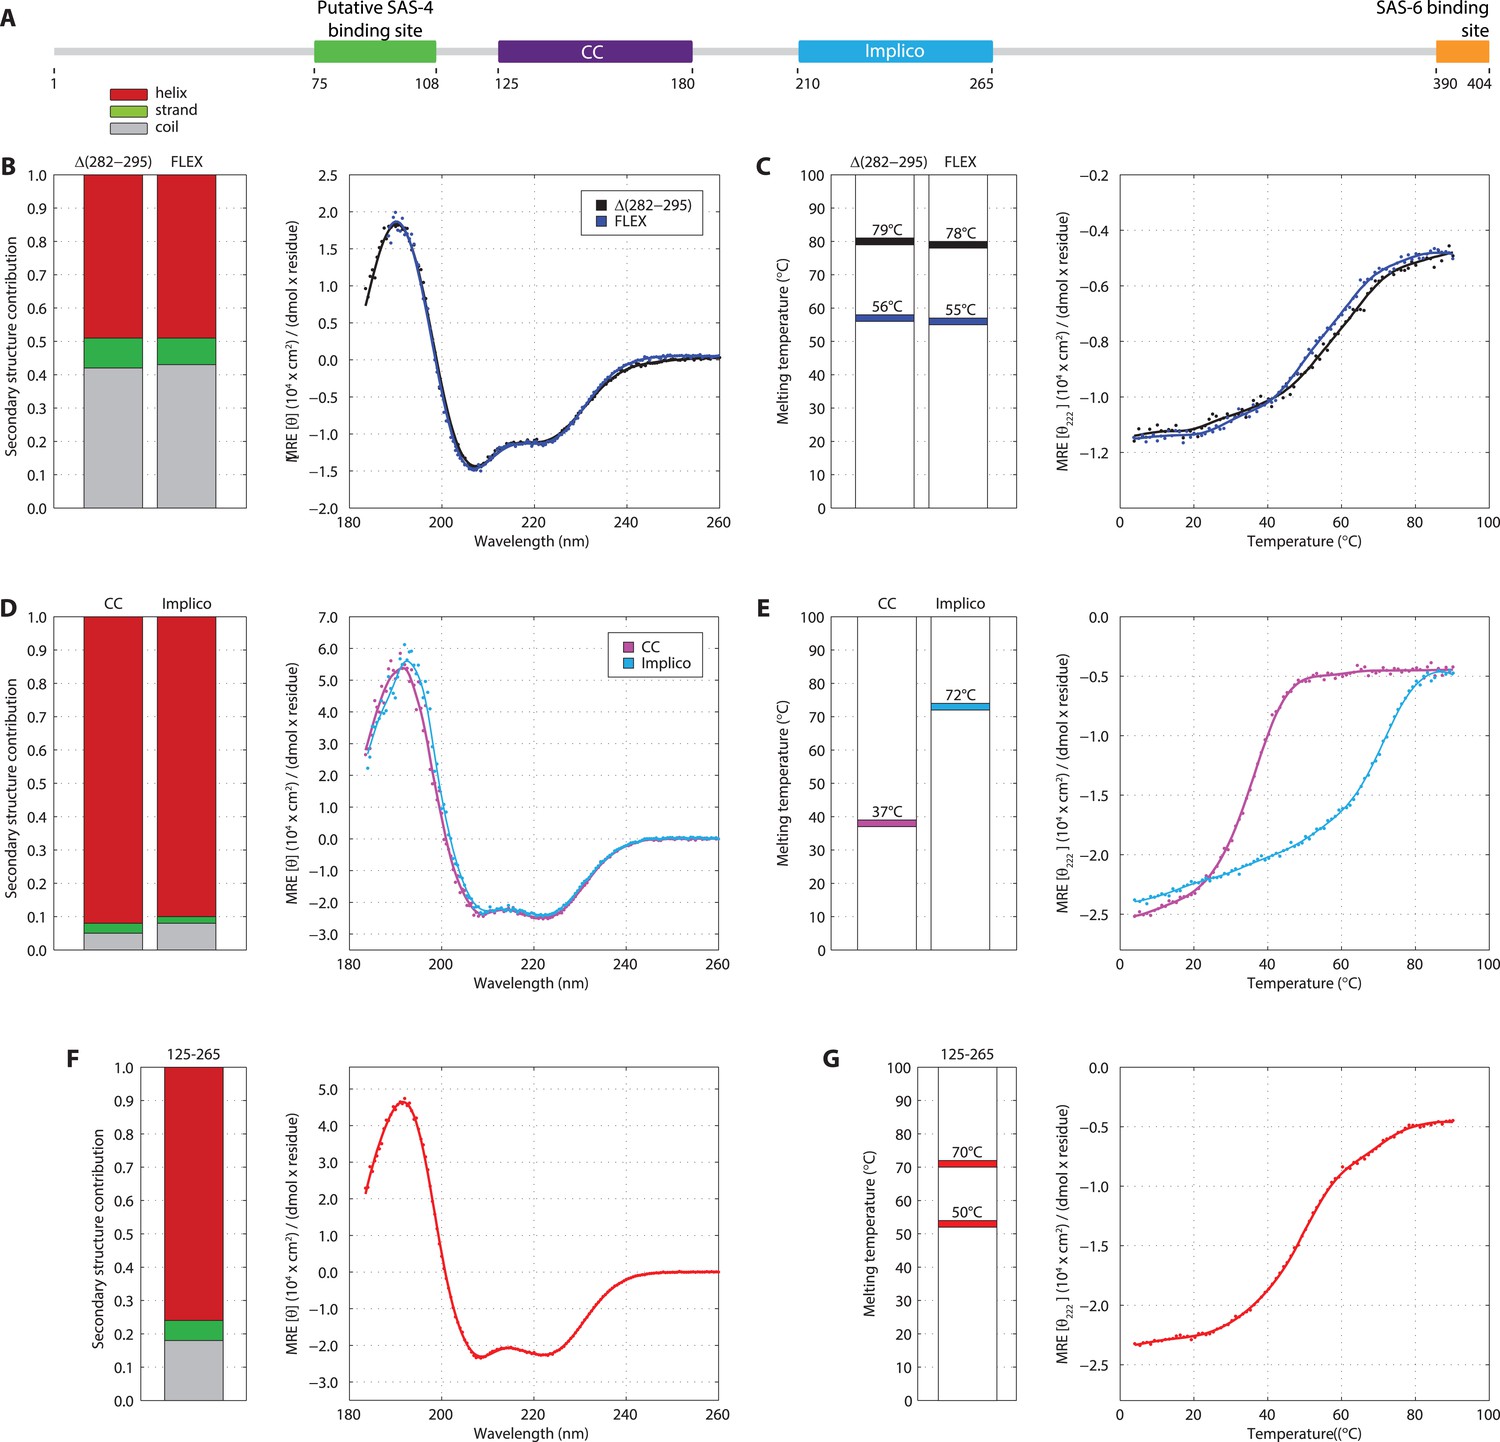
SAS-5 comprises two independently folded domains.
(A) Schematic representation of SAS-5 architecture showing the relative locations and residue boundaries of the coiled-coil and Implico domains, the putative SAS-4 binding site (Hatzopoulos et al., 2013) and the SAS-6 binding site (Qiao et al., 2012; Hilbert et al., 2013). (B) Overlaid CD spectra of SAS-5Δ282–295 and SAS-5FLEX samples recorded at 10°C, shown as per residue molar elipticity vs wavelength. The semi-quantitative contribution of secondary structure elements in each spectrum is deconvoluted in the bar charts on the left. Grey color corresponds to random coil, green to β-strand and red to α-helical segments. (C) Thermal unfolding profiles of the same samples monitored by recording molar elipticity at 222 nm as a function of temperature, and graphical representation of the melting transition temperatures observed in each sample. (D–G) Similar CD spectra and thermal unfolding profiles of (D,E) SAS-5CC and SAS-5Imp, and (F,G) SAS-5125–265 samples.
Figure 1—figure supplement 1
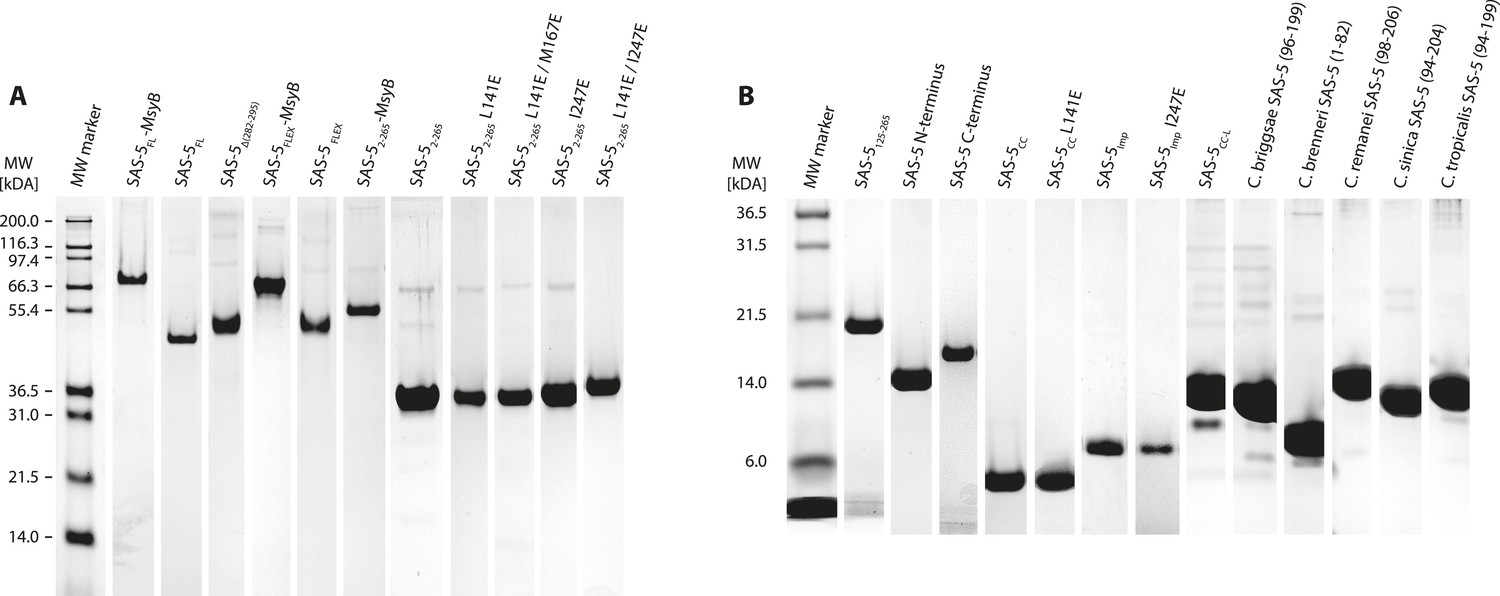
Recombinant proteins sample quality.
(A,B) Sections of SDS-PAGE showing Coomassie-stained samples of recombinant proteins used in this study. Panel A groups proteins with molecular weight over 30 kDa; panel B shows smaller proteins. Individual gel sections have been compressed or expanded along the vertical axis to match the molecular weight marker, and their contrast levels have been equalized.
Figure 1—figure supplement 2
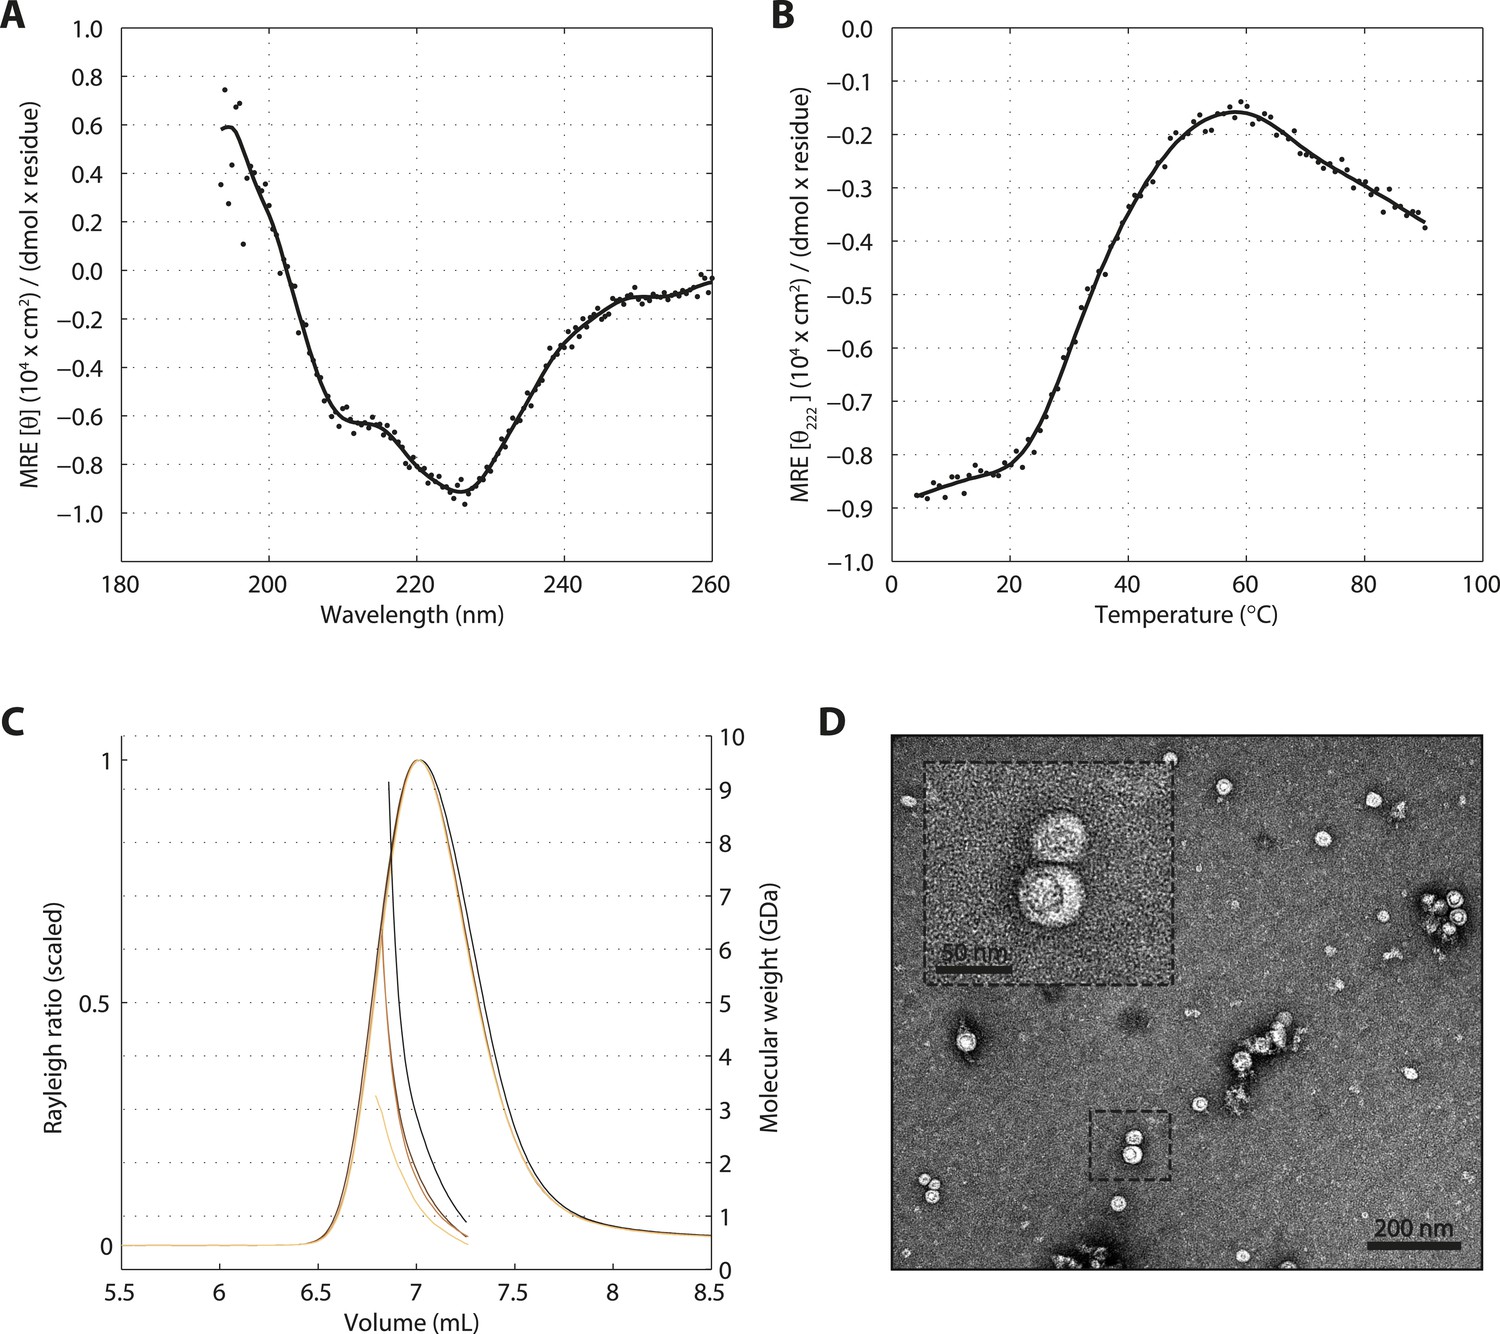
SAS-5 forms protein aggregates in vitro.
(A) CD spectrum of SAS-5FL at 10°C shown as per residue molar elipticity against wavelength, and (B) thermal unfolding profile of the same protein monitored by recording molar elipticity at 222 nm as a function of temperature. The CD spectrum is highly similar to that of protein aggregates characterized elsewhere (Digambaranath et al., 2010). (C) Overlay of SEC-MALS chromatograms of SAS-5FL samples at multiple concentrations, showing scaled light scattering intensity vs elution volume. (D) Representative negative stain electron micrograph of SAS-5FL and high-magnification view of the boxed section.
Figure 1—figure supplement 3
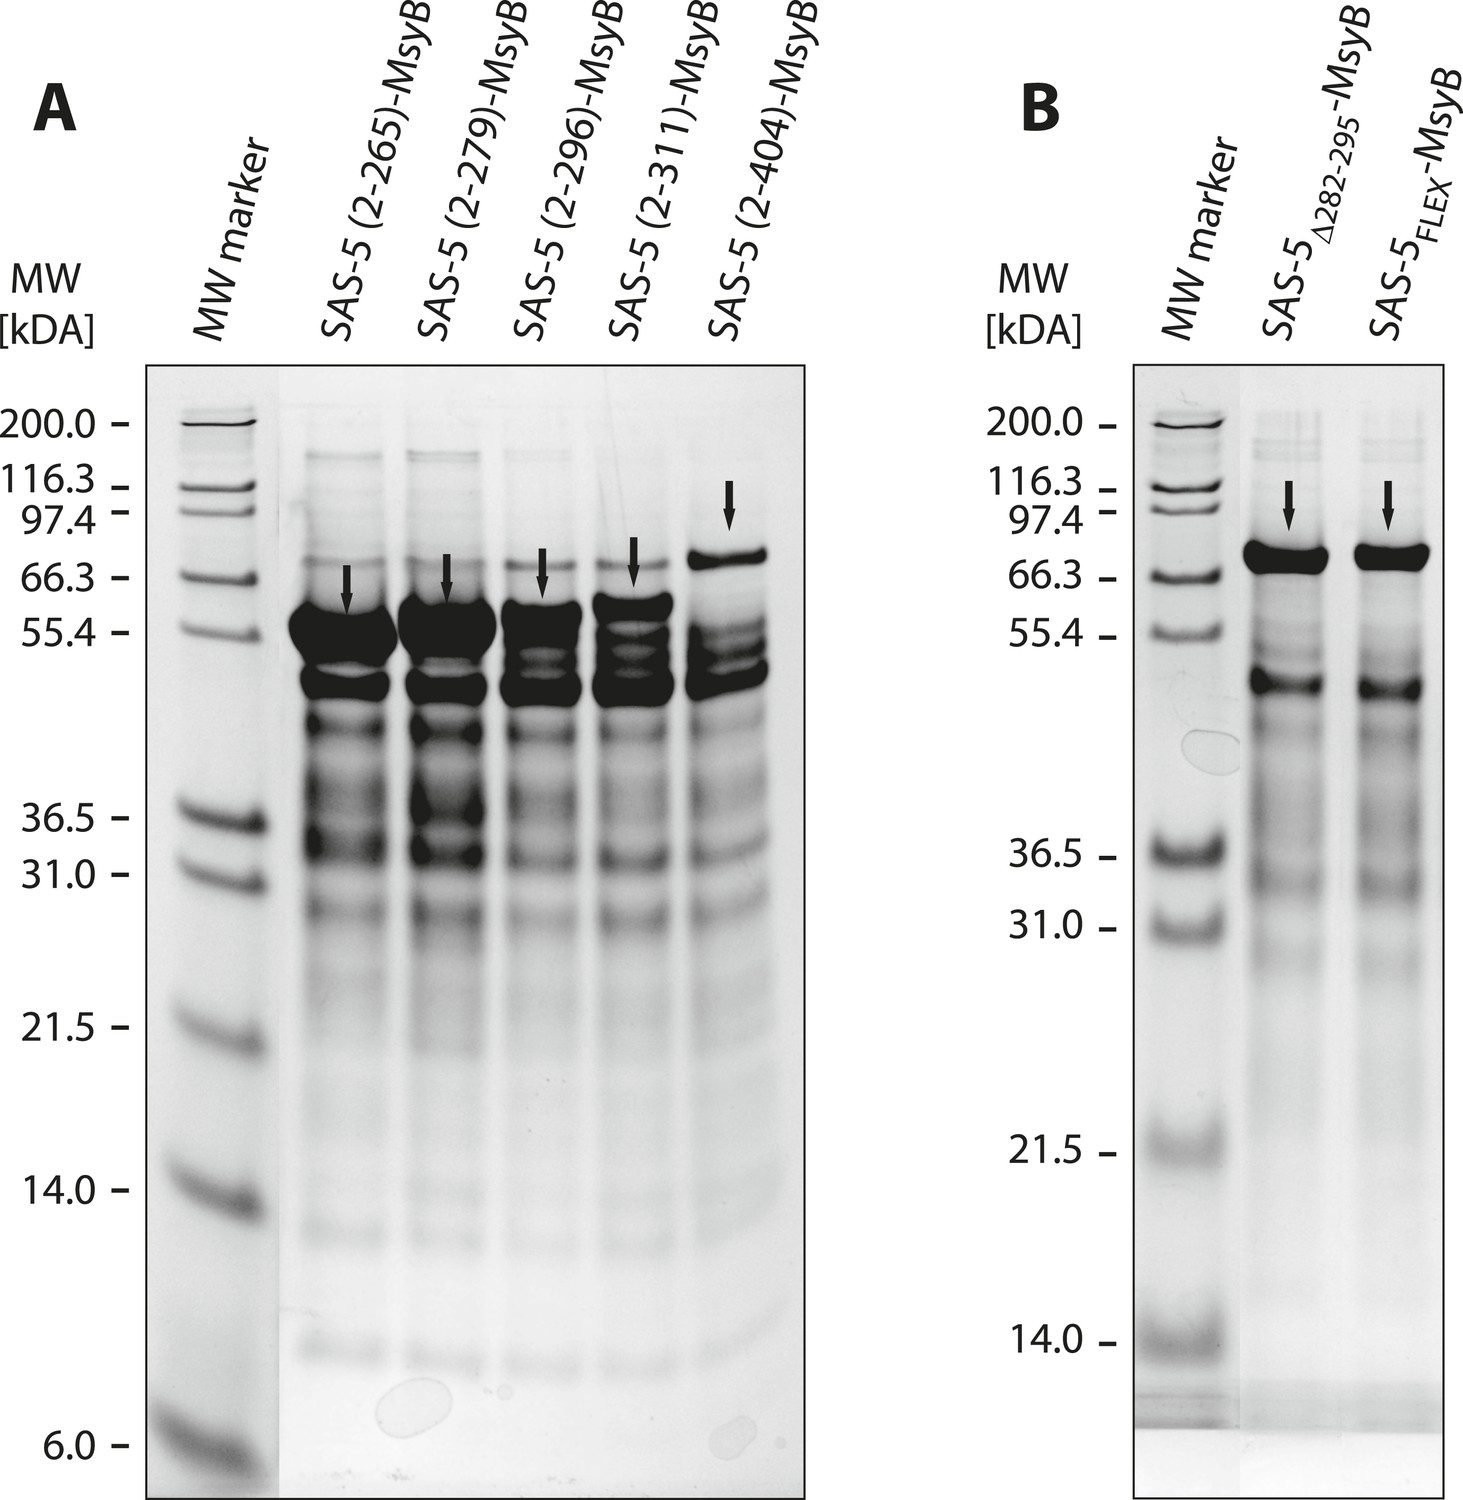
A short SAS-5 segment promotes protein aggregation.
(A, B) Coomassie-stained SDS-PAGE of metal-affinity purified SAS-5 variants, corresponding to MsyB-tagged full-length protein and C-terminal truncations (A). The expected SAS-5-MsyB protein bands are indicated by black arrows. Soluble protein yields increased significantly upon truncation of residues 280–296 (compare lanes 3 and 4). Excision of this protein segment (SAS-5Δ282–295-MsyB) or substitution by a flexible linker (SAS-5FLEX-MsyB) improved soluble yields of the full-length protein (B, compare to right-most lane of panel A).
Figure 1—figure supplement 4
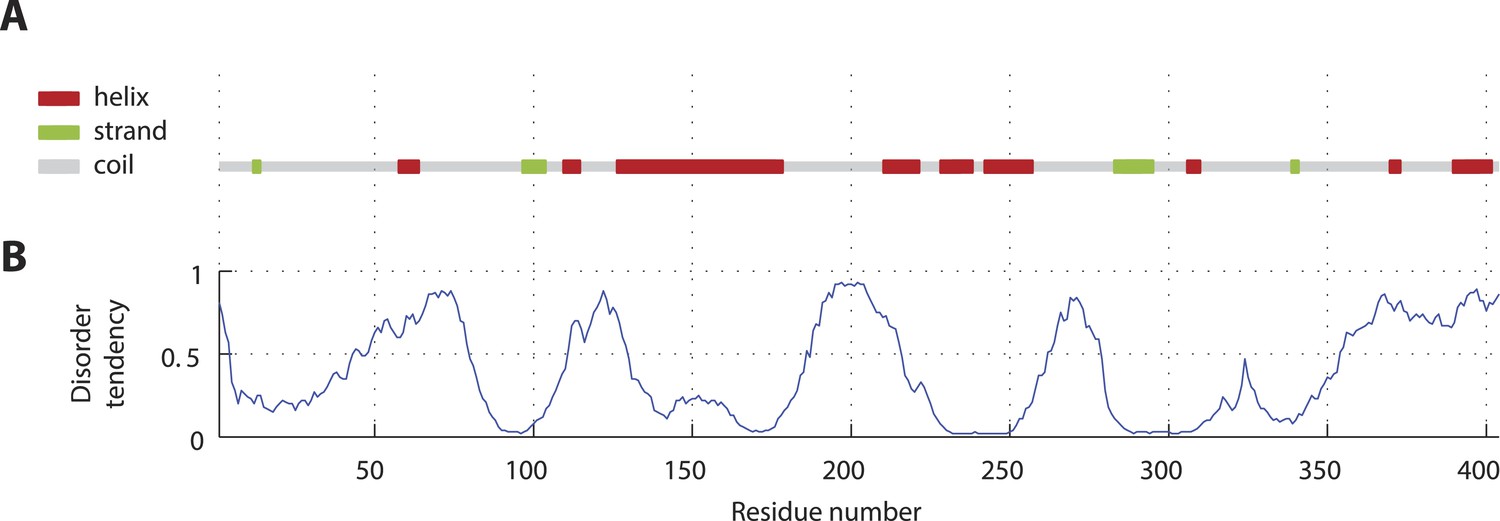
SAS-5 secondary structure and disorder predictions.
(A) Schematic representation and relative locations of secondary structure elements predicted from the SAS-5 amino acid sequence by PSIPRED (Jones, 1999). (B) Disorder probability per amino acid residue predicted from the SAS-5 sequence by DISOPRED3 (Jones and Cozzetto, 2014).
Figure 1—figure supplement 5
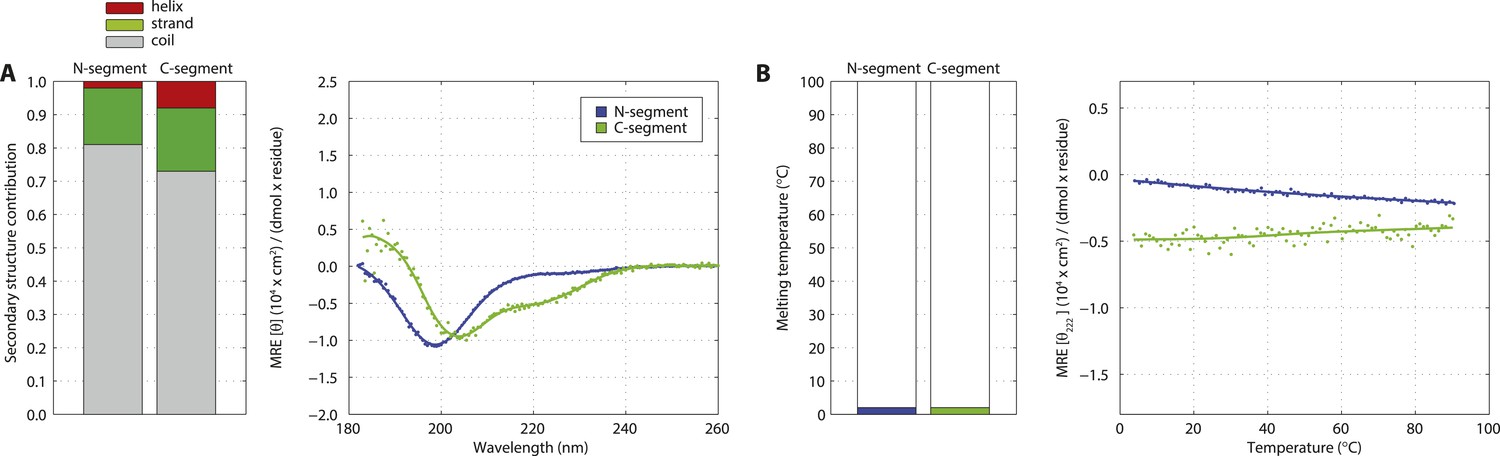
The SAS-5 N- and C-terminal segments are unstructured in isolation.
(A) Overlaid CD spectra of SAS-5 N-terminal (residues 2–122) and C-terminal (residues 269–404) fragments recorded at 10°C. The semi-quantitative contribution of secondary structure elements in each spectrum is deconvoluted in the bar chart left. Grey colour corresponds to random coil, green to β-strand and red to α-helical segments. (B) Thermal unfolding profiles of the same samples based on their CD signal at 222 nm.
Figure 2 with 2 supplements
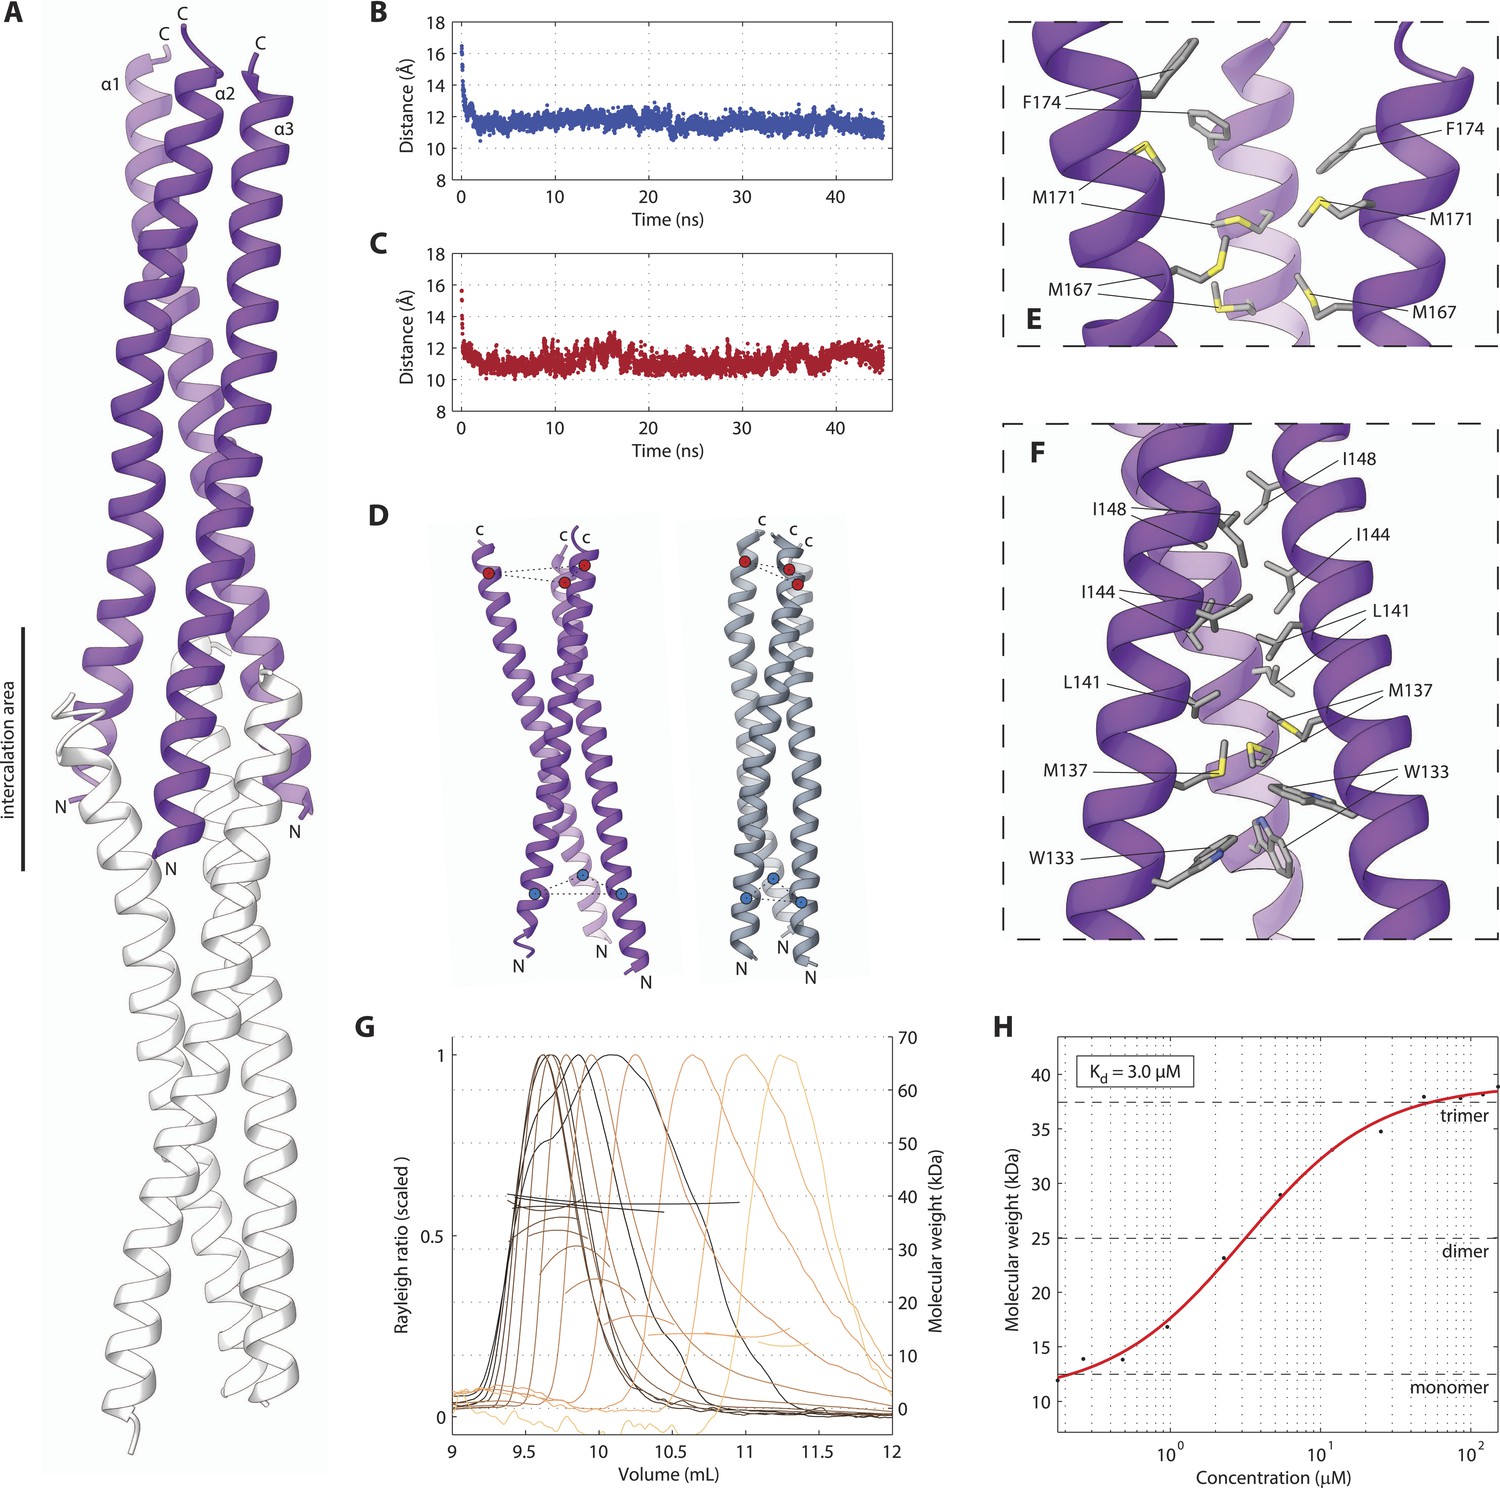
The SAS-5 coiled coil forms a parallel trimer.
(A) Schematic representation of the SAS-5CC crystallographic structure in purple. The protein N- and C-termini are indicated, as is the area where successive molecules intercalate in the crystal, leading to distortions of the coiled-coil structure; an intercalating molecule is shown here in white. (B,C) Average distance between the centers of the three α-helices at the N-terminus (B) or the C-terminus (C) of the coiled coil as a function of time in MD simulations. The distances at the initially frayed ends of the coiled coil decreased rapidly from ∼16 nm to ∼11 nm as the structure converged to a canonical trimeric arrangement. (D) Schematic representation of the coiled-coil structure at the start (left, purple) and the end (right, grey) of MD simulations. The helix centers whose distances are plotted in panels B and C are shown as blue and red spheres, respectively. (E,F) Magnified view of the coiled-coil hydrophobic core from the crystallographic structure. Residues at the C-terminus (E) and N-terminus (F) of the coiled coil are shown as sticks; charged substitutions at L141 and M167 disrupted coiled-coil oligomerization. (G) Overlay of SEC-MALS chromatograms of SAS-5CC-L at multiple concentrations, showing scaled light scattering intensity vs elution volume. The calculated molecular weight for each trace is shown as continuous line over the chromatogram peak, and corresponds to the right–hand axis. Chromatograms of samples at the highest two concentrations show evidence of protein overloading on the size-exclusion column. (H) Plot of average molecular weight from SEC-MALS analysis as a function of on-column protein concentration. The apparent Kd, and molecular sizes of monomers, dimers and trimers are indicated.
Figure 2—figure supplement 1
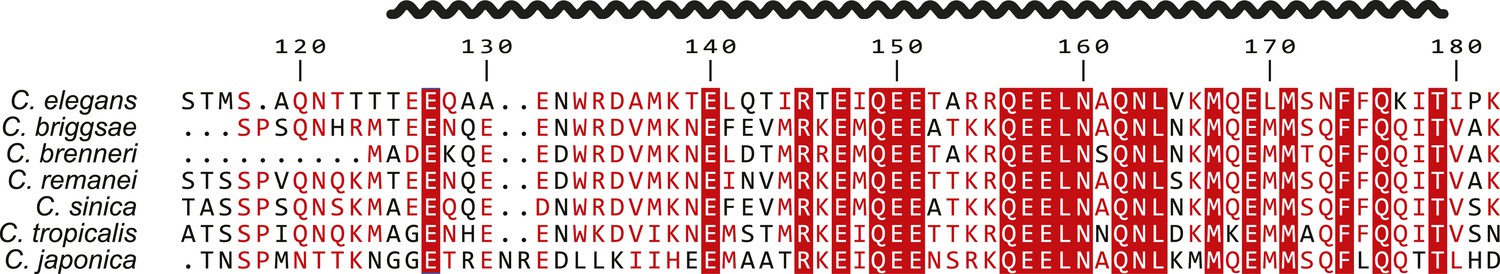
Alignment of SAS-5 coiled coils from the Caenorhabditis genus.
Alignment of nematode SAS-5 coiled-coil sequences from the Caenorhabditis genus by MergeAlign (Collingridge and Kelly, 2012) and plotted by ESPript (Robert and Gouet, 2014). The protein secondary structure inferred from the crystallographic structure of SAS-5CC is shown schematically on top. Universally conserved residues are highlighted in red; conservatively substituted residues are shown in red.
Figure 2—figure supplement 2
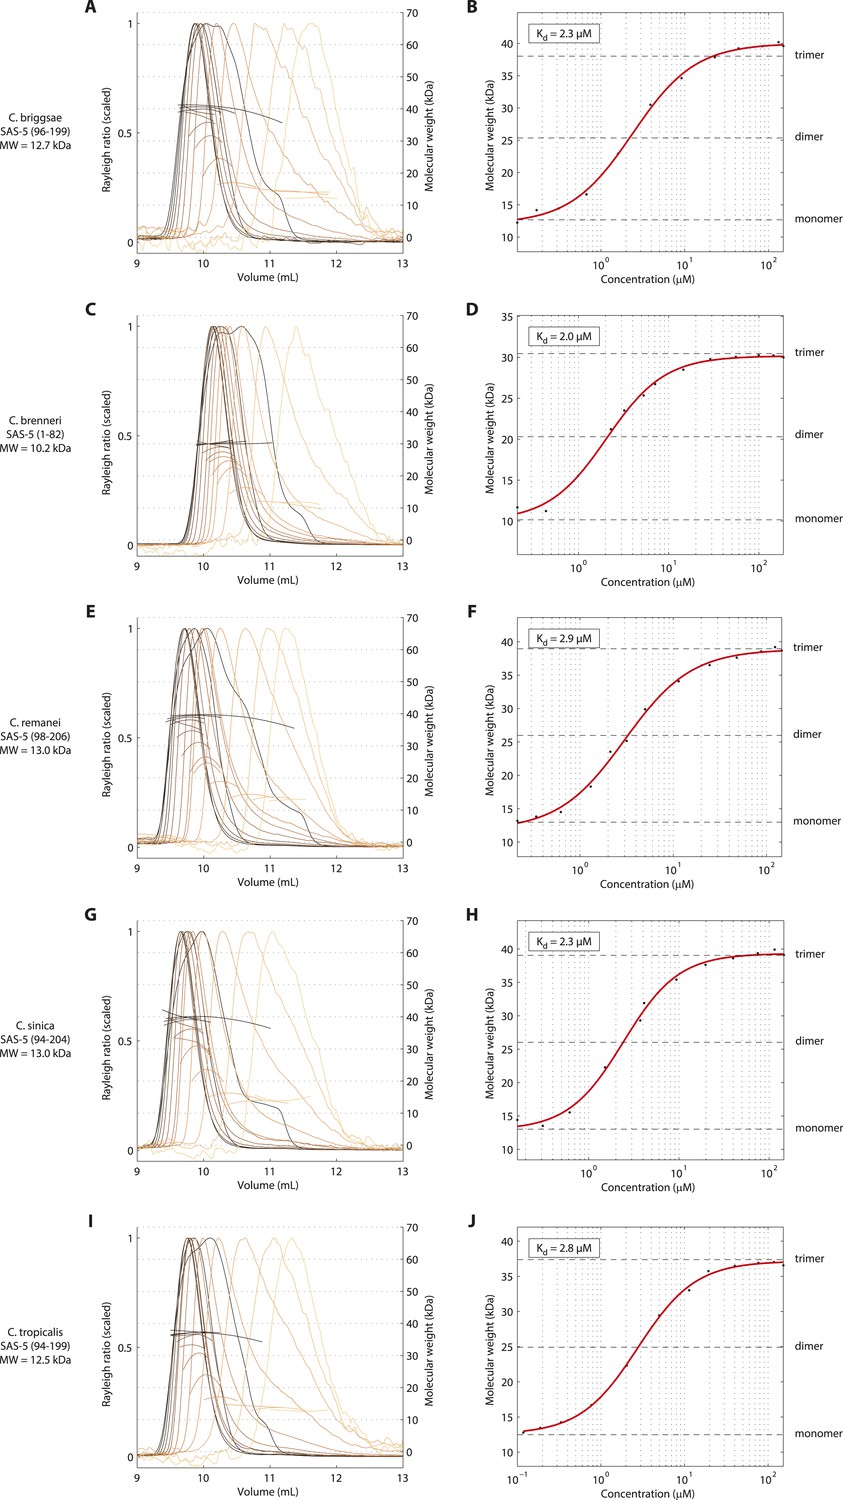
The trimeric SAS-5 coiled coil is an evolutionary conserved feature.
(A) Overlay of SEC-MALS chromatograms of a C. briggsae SAS-5 construct spanning residues 96–199, equivalent to C. elegans SAS-5CC-L, in multiple concentrations, and (B) plot of average molecular weight calculated from SEC-MALS analysis as a function of on-column protein concentration. The apparent Kd and molecular sizes of monomers, dimers and trimers are indicated. Chromatograms of samples at the highest protein concentration show evidence of overloading the size exclusion column. (C–J) Similar chromatograms and plots of C. brenneri SAS-5 residues 1–82 (C, D), C. remanei SAS-5 residues 98–206 (E, F), C. sinica SAS-5 residues 94–204 (G, H) and C. tropicalis SAS-5 residues 94–199 (I, J).
Figure 3 with 1 supplement
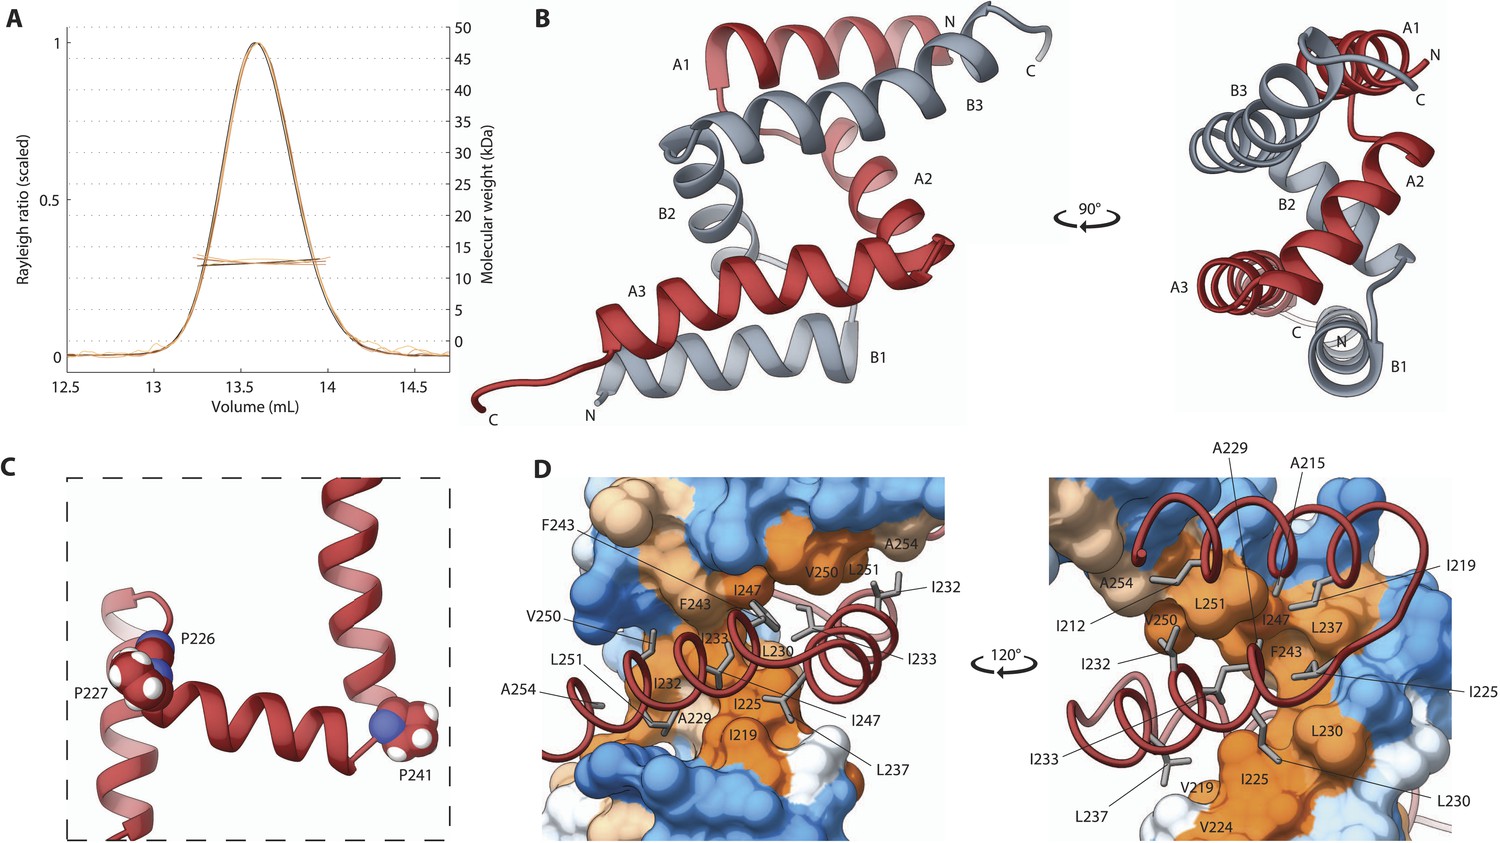
The SAS-5 Implico domain comprises a novel type of protein dimer.
(A) Overlay of SEC-MALS chromatograms of SAS-5Imp in multiple concentrations showing formation of a stable dimer. (B) Two orthogonal views of the SAS-5Imp crystallographic structure in schematic representation. The α-helices are denoted A1–A3 and B1–B3 for the two protein chains (red and grey, respectively). The N- and C-termini are indicated. (C) Magnified view of a single SAS-5Imp protein chain in schematic representation, showing the proline residues (space-filling representation) at the tight turns between α-helices. (D) Two views of the SAS-5Imp dimeric interface, with one chain represented as surface and the other as ribbon. Hydrophobic residues at the dimer interface are shown as sticks on the ribbon chain, and their location is indicated on the surface. Surface colors are a gradient from blue to orange representing residue hydrophobicity in the Kyte-Doolittle scale (Kyte and Doolittle, 1982). Blue corresponds to −4.5 in this scale (most hydrophilic), white to 0 and orange to 4.5 (most hydrophobic).
Figure 3—figure supplement 1
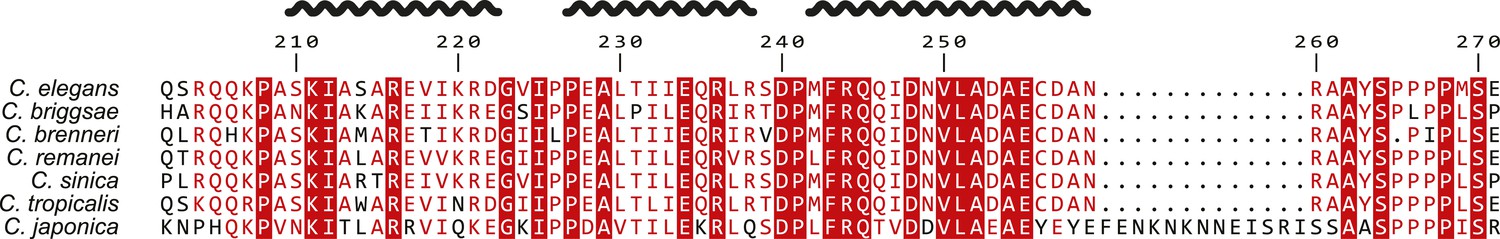
Alignment of SAS-5 Implico domains from the Caenorhabditis genus.
Alignment of nematode SAS-5 Implico domain sequences from the Caenorhabditis genus by MergeAlign (Collingridge and Kelly, 2012). The protein secondary structure inferred from the crystallographic structure of SAS-5Imp is shown schematically on top. Universally conserved residues are indicated by red highlight; conservatively substituted residues are shown in red.
Figure 4

SAS-5 forms higher-order assemblies in solution.
(A) Overlay of SEC-MALS chromatograms of MsyB-tagged SAS-5FLEX in multiple concentrations and (B) plot of average molecular weight from SEC-MALS analysis as a function of on-column protein concentration. The apparent Kd and molecular sizes of dimers, tetramers and hexamers are indicated. SAS-5FLEX-MsyB reaches an equimolar hexamer to tetramer ratio at the highest concentration we could assess. Fitting the experimental data under the assumption of ultimate hexamer formation yielded Kd values comparable to those of the SAS-5 coiled coil in isolation (compared B with Figure 2H). (C,D) Similar SEC-MALS analysis of MsyB-tagged SAS-52–265. SAS-52–265-MsyB reaches a 3:1 hexamer to tetramer ratio at the highest concentration point. (E) Native mass-spectrometry electrospray ionization spectrum of a 20 μM sample of SAS-52–265, showing relative abundance of protein species as a function of mass to charge ratio. The charged states and protein oligomeric forms corresponding to specific peaks are indicated. Odd-numbered oligomeric forms (monomers, trimers etc) likely correspond to in-flight breakdown of higher- order protein assemblies.
Figure 5 with 1 supplement
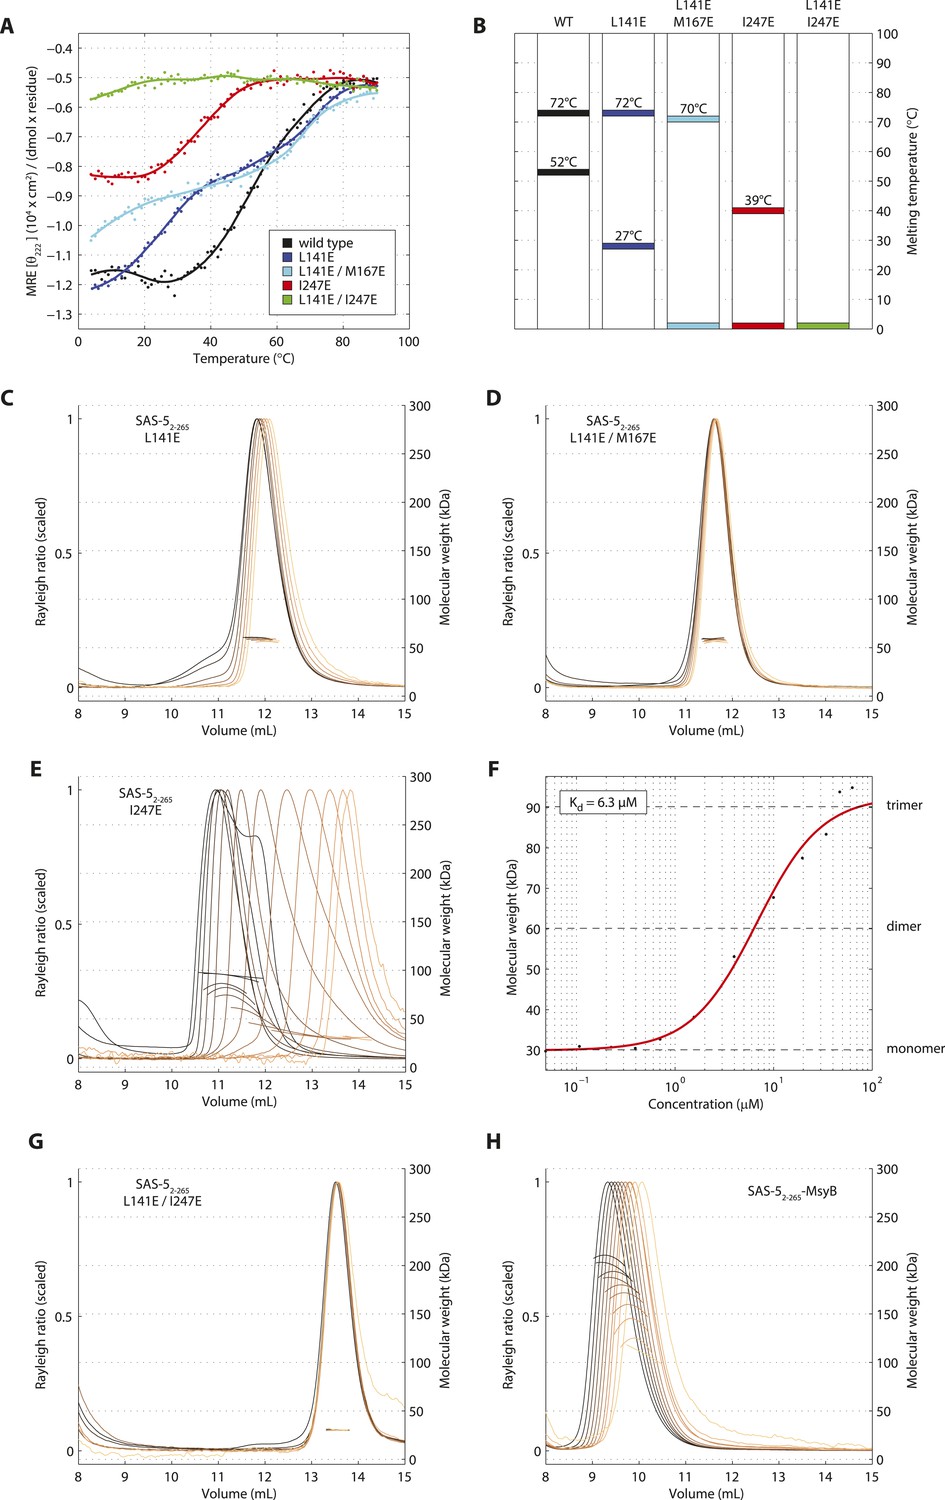
Sequential disruption of SAS-5 oligomeric interfaces.
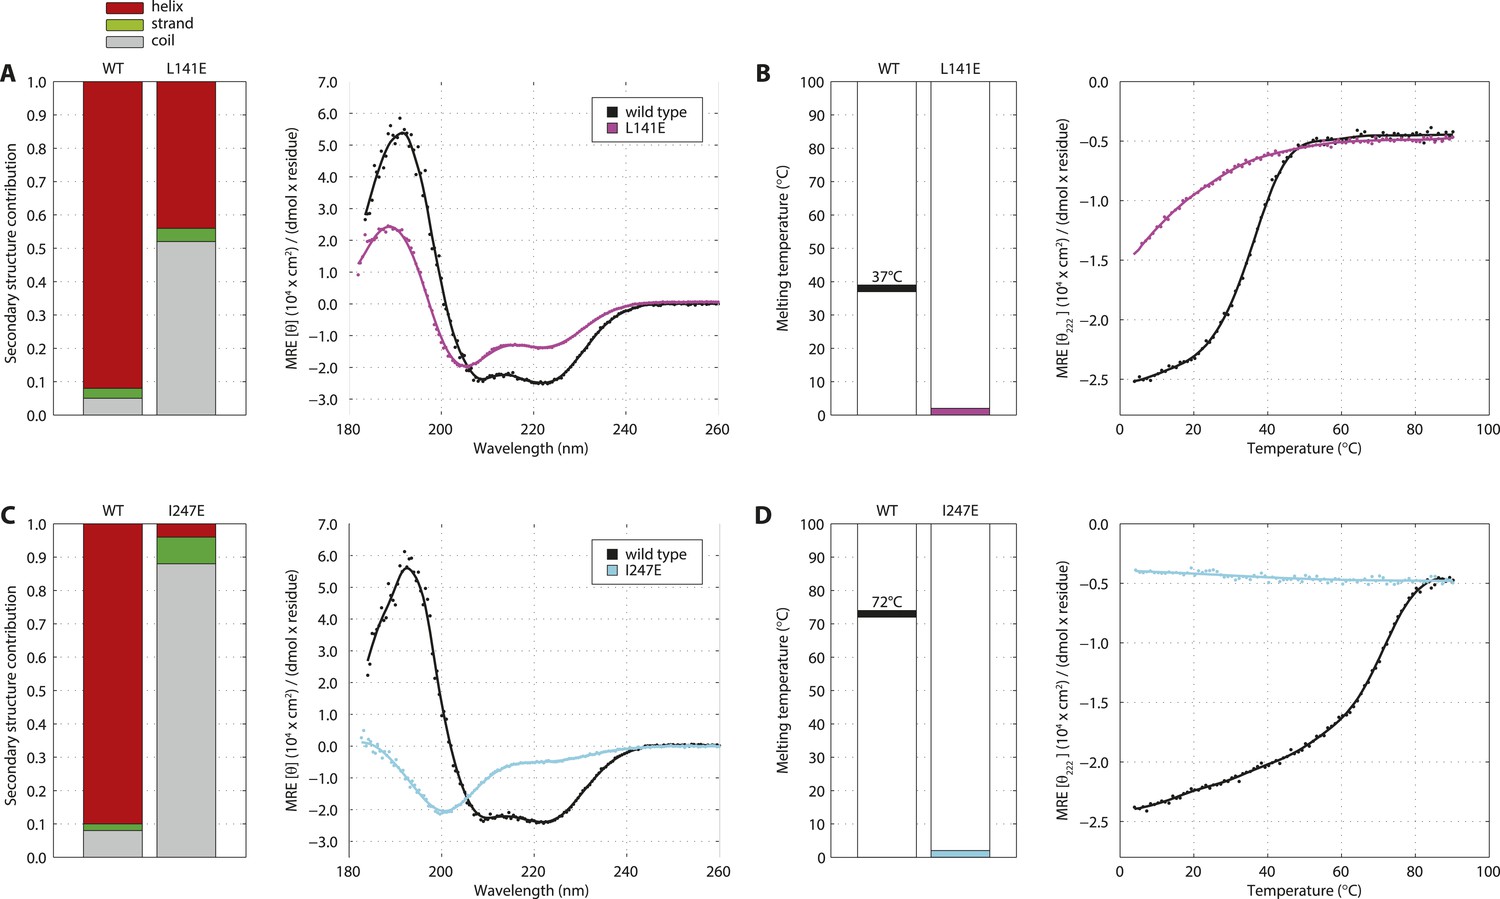
(A) Thermal unfolding profiles monitored by CD of SAS-52–265 wild-type and mutants that disrupt the coiled coil (L141E, L141E/M167E) or the Implico (I247E) oligomerization interface. (B) Graphical representation of the melting transition temperatures observed in each SAS-52–265 variant. (C,D) Overlay of SEC-MALS chromatograms of SAS-52–265 L141E (C) or L141E/M167E (D) variants in multiple concentrations. (E) Similar SEC-MALS analysis of SAS-52–265 I247E and (F) plot of average molecular weight from SEC-MALS analysis of this variant as a function of on-column protein concentration. The apparent Kd and molecular sizes of monomers, dimers and trimers are indicated. (G,H) Overlay of SEC-MALS chromatograms from the SAS-52–265 L141E/I247E variant (G), and the MsyB-tagged SAS-52–265 wild-type as reference (H).
Figure 5—figure supplement 1
Single amino acid mutations disrupt the SAS-5CC and SAS-5Imp domains.
(A) Overlaid CD spectra of SAS-5CC wild-type and L141E mutant samples recorded at 10°C. The semi-quantitative contribution of secondary structure elements in each spectrum is deconvoluted in the bar charts on the left. Grey color corresponds to random coil, green to β-strand and red to α-helical segments. (B) Thermal unfolding profiles of the same samples from their CD signal at 222 nm, and graphical representation of the melting transition temperatures observed in each sample. (C, D) Similar CD spectra and thermal unfolding profiles of SAS-5Imp wild-type and I247E mutant samples.
Figure 6 with 1 supplement
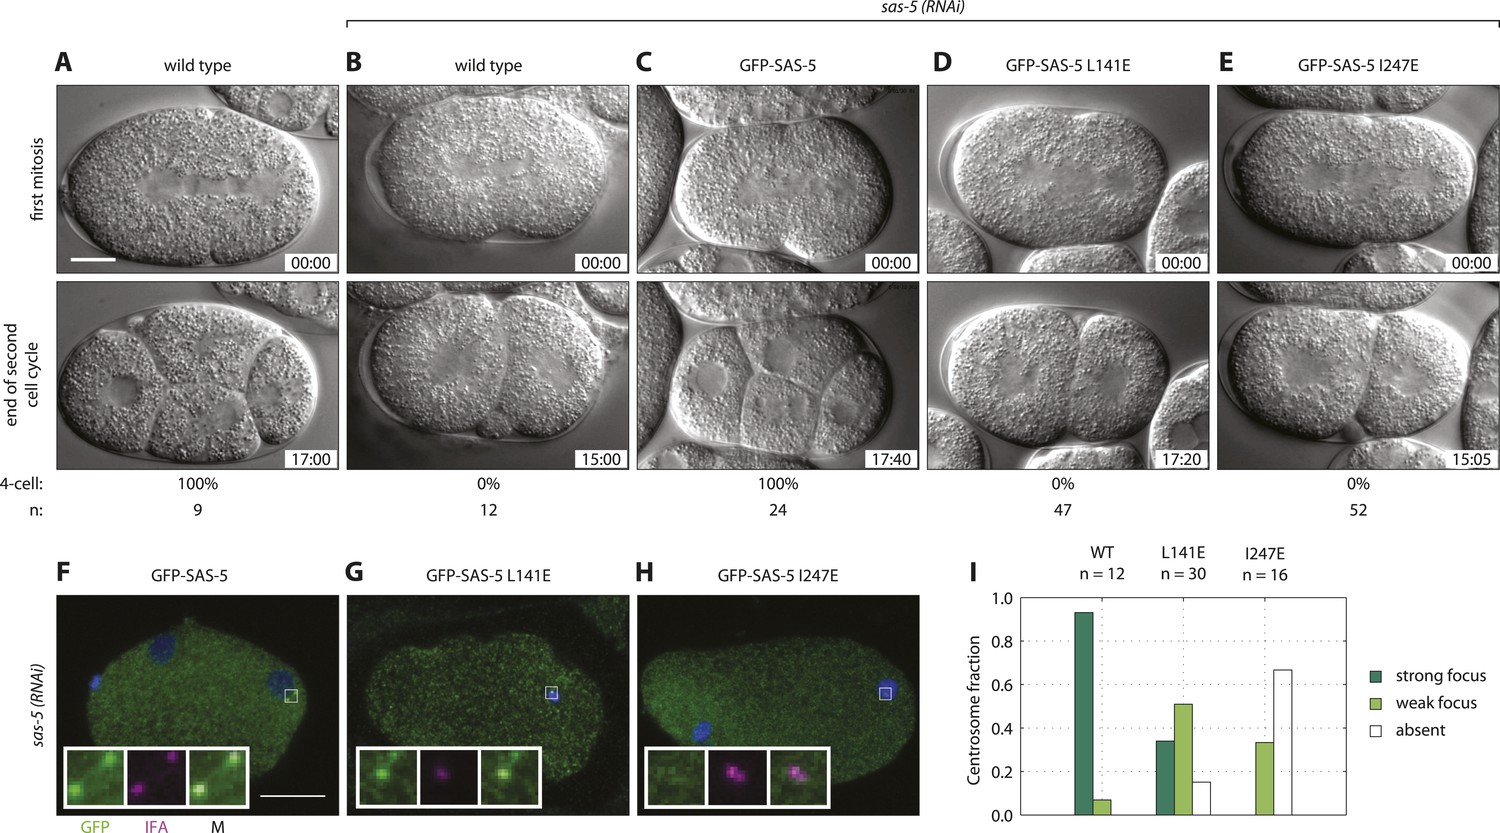
Both SAS-5 oligomerization interfaces are essential for centriole duplication in C. elegans embryos.
Wild type (A,B), gfp::sas-5 (C), gfp::sas-5[L141E] (D), and gfp::sas-5[I247E] (E) adult worms were subjected to sas-5(RNAi) or left untreated (A). The resulting embryos were imaged by time-lapse DIC microscopy (A–E, see corresponding Videos 1–5) or fixed and analyzed by immunofluorescence (F–H). (A–E) Embryos at the onset of cleavage furrow ingression (top) and at the end of the second cell cycle (bottom); time stamp in mm:ss from the beginning of cleavage furrow ingression at the first mitosis. The percentage of embryos that reach the four-cell stage is shown below each image, along with the number of embryos (n) analyzed per condition. (F–H) Embryos stained with antibodies against GFP (green) and the centriolar marker IFA (magenta); DNA is visualized in blue. Scale bar 10 μm. Insets are fivefold enlargements of boxed regions. (I) Centrosomal GFP localization was scored in one-cell stage embryos as shown in panels F–H as absent, weak focus or strong focus.
Figure 6—figure supplement 1
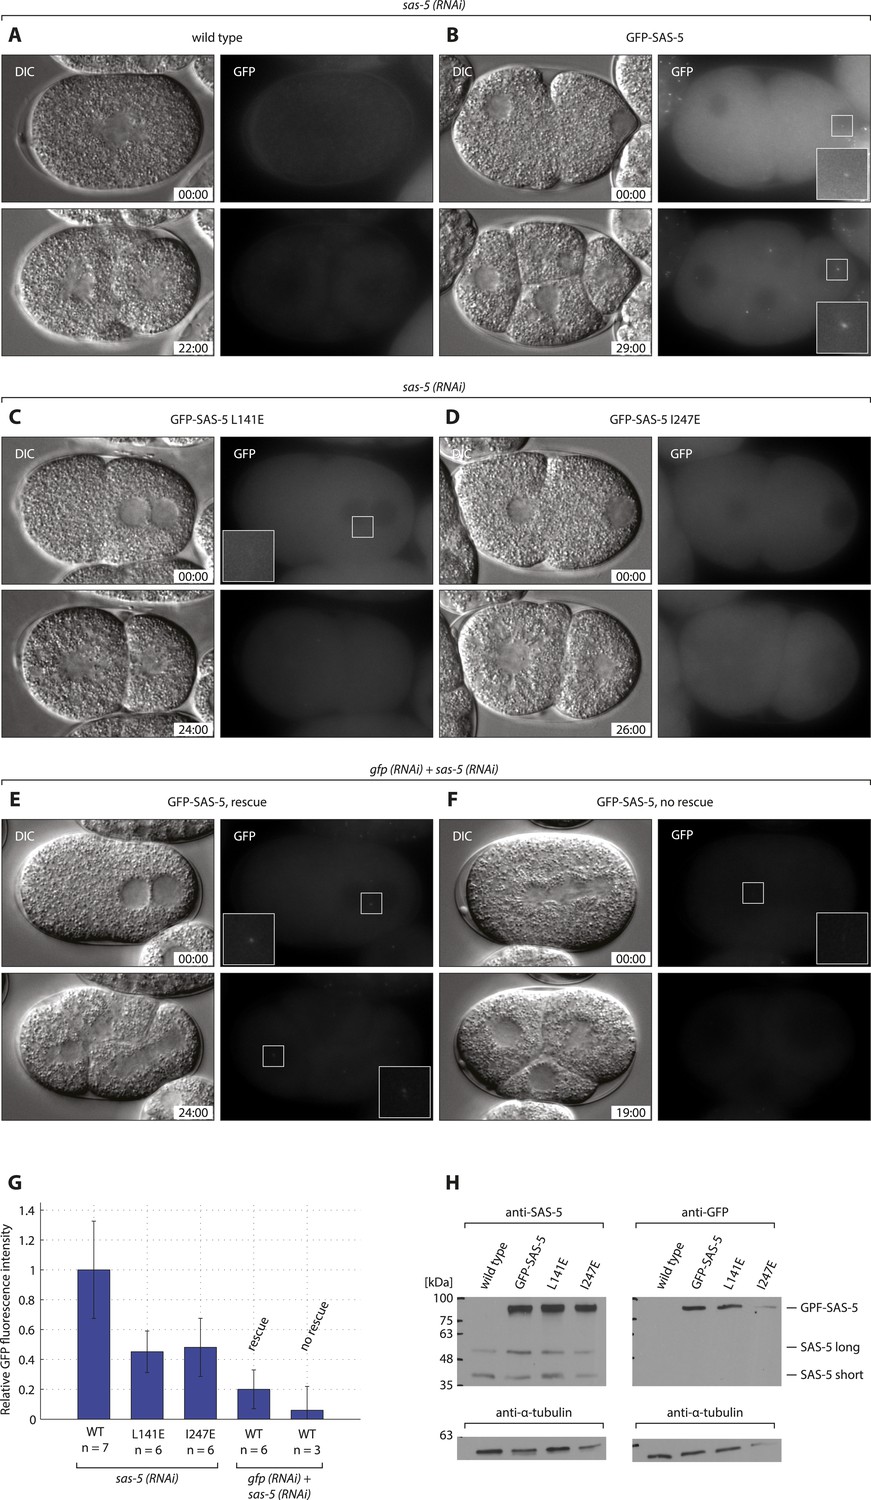
GFP-SAS-5 and mutants are expressed, and resistant to sas-5 RNAi.
Wild type (A, E, F), gfp::sas-5 (B), gfp::sas-5 L141E (C), and gfp::sas-5 I247E (D) worms were treated with sas-5 RNAi (A–D) or simultaneous gfp and sas-5 RNAi (E, F), and the resulting embryos imaged by dual DIC and fluorescence time-lapse microscopy. Top panels: one-cell stage embryos, bottom panels: same embryo ∼25 min later. GFP images are maximum intensity projections of 8 z-sections taken at 0.5 μm intervals. Time from the first image is shown in mm:ss. Insets in panels B, C, E and F show 2.5 fold enlargements of boxed regions. (G) Quantification of GFP fluorescence intensity in live one-cell stage embryos, shown as a percentage of the average value for wild-type GFP-SAS-5. Rescue of endogenous sas-5 depletion upon dual RNAi treatment depended on the level of exogenous GFP-SAS-5 expression. Importantly, note that levels of GFP-SAS-5 below those of either of the GFP-SAS-5 mutants, reduced using gfp RNAi, were able to rescue the sas-5 (RNAi) phenotype, indicating that the lack of rescue in the latter two strains is not due to insufficient expression levels. To rule out the possibility of sas-5 (RNAi) rescue being due to dilution of the sas-5 RNAi with gfp RNAi, embryos expressing GFP-SAS-5 L141E were scored under the same conditions, with all embryos showing the sas-5 (RNAi) phenotype (data not shown) Furthermore, GFP-SAS-5 levels at only ∼5% of the levels in the sas-5 (RNAi) condition, failed to rescue, further indicating that sas-5 (RNAi) is functional under these conditions. (H) Western blots of 50 adult worms from each indicated strain probed with antibodies against SAS-5 or GFP, as indicated, and against α-tubulin as loading control. Molecular weight markers are indicated as black dashes. Endogenous SAS-5 exists as two isoforms: the long 404 amino acid isoform and a shorter 288 amino acid isoform, which is likely the result of trans-splicing (Wormbase, F35B12.5c). Note that exogenous gfp::sas-5 results in the expression of the longer isoform only.
Figure 7
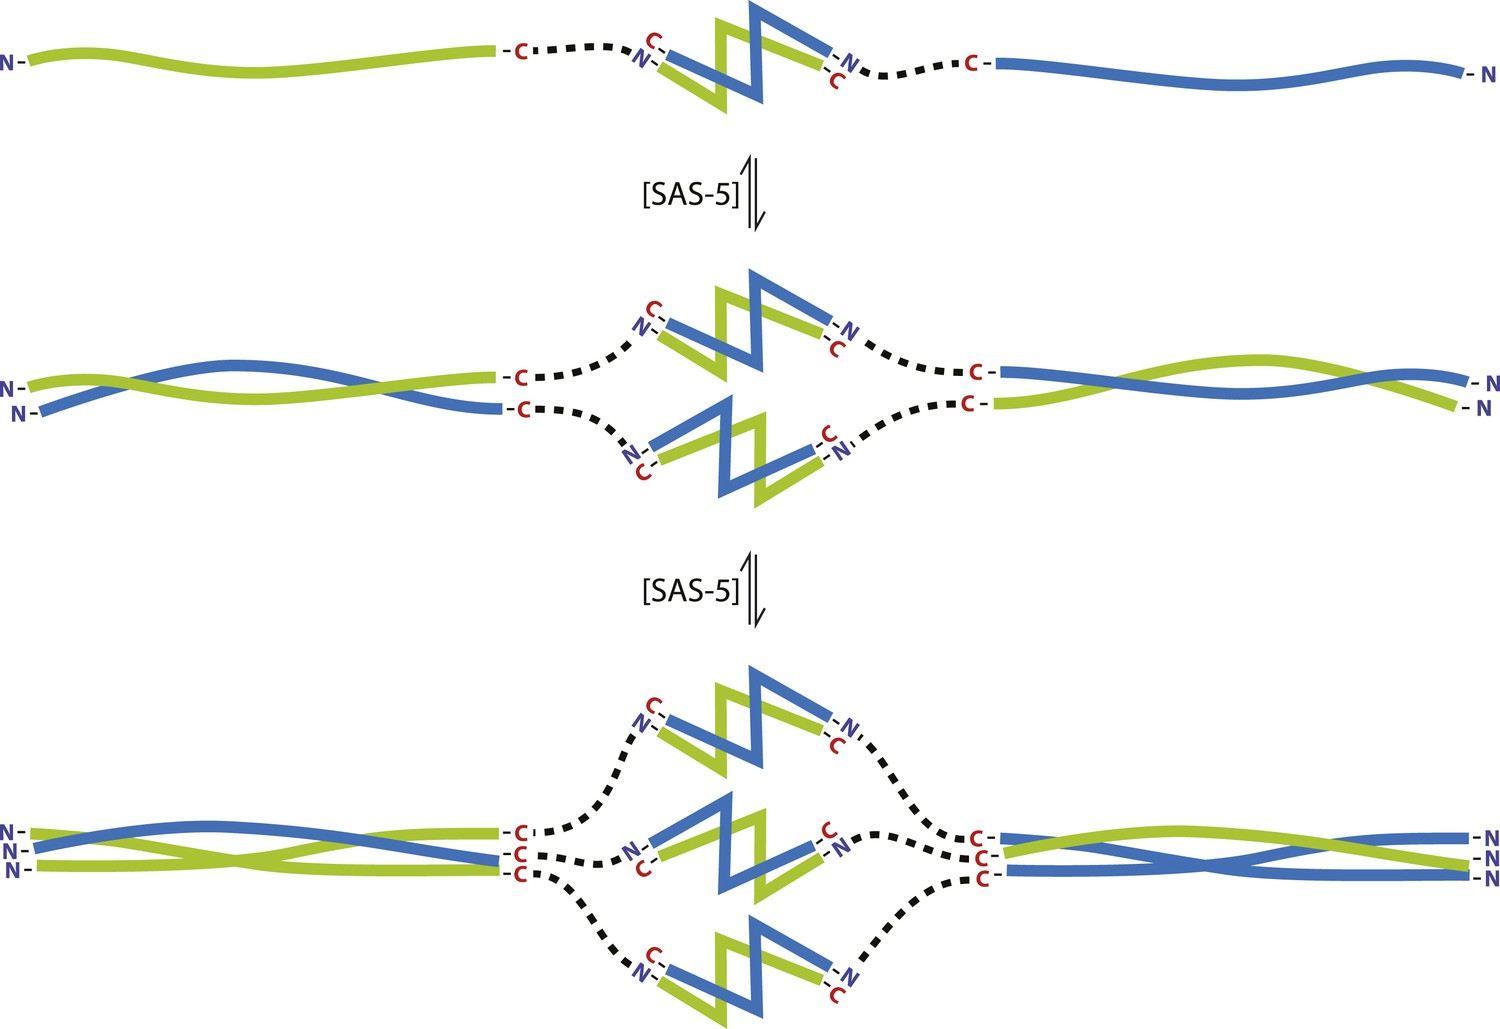
The SAS-5 architecture allows formation of higher oligomers.
Schematic representation of SAS-5 oligomerization, showing the coiled-coil and Implico domains, without the disordered N- and C-termini of this protein. Tight dimers of SAS-5, mediated by the Implico domain, could come together through the coiled coil to form, first, a tetramer and ultimately a hexamer in a concentration-dependent manner. This oligomerisation model does not take into account protein aggregation mediated by the predicted β-strand at the SAS-5 C-terminus.
Figure 8
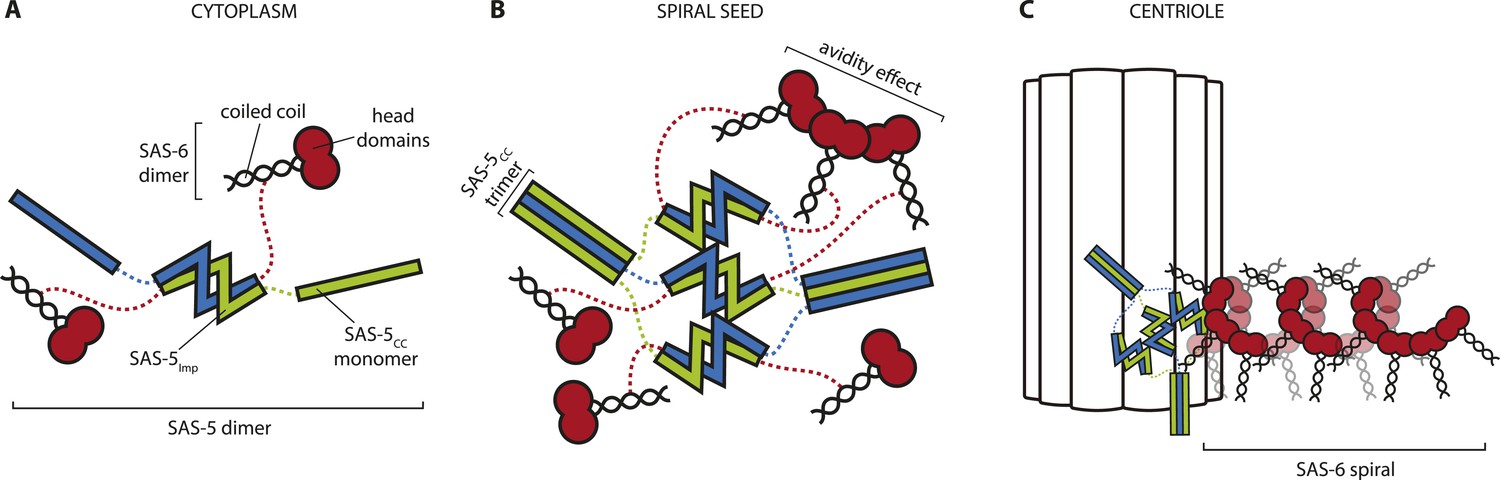
Hypothetical mechanism of SAS-5 function.
(A) SAS-5 forms tight dimers in the cytoplasm, and it may also associate with SAS-6 dimers depending on the relative levels of each protein. (B) SAS-5 localizes at the centriole, where it forms higher-order assemblies. These assemblies bring together multiple SAS-6 dimers in close proximity to one another, thereby increasing the local SAS-6 concentration. Thus, SAS-5 assemblies create a seeding point from which the SAS-6 oligomer forms (C); the first step in creating the C. elegans central tube.
Videos
Video 1
Time-lapse DIC microscopy of C. elegans embryo over the first two cell cycles.
Untreated wild type embryo. Frames were captured every 5 s and the movie is played at 12 frames/s. Embryo is oriented with anterior to the left and posterior to the right; elapsed time is shown in minutes and seconds.
Video 2
Time-lapse DIC microscopy of C. elegans embryo over the first two cell cycles.
Wild type embryo subjected to sas-5 (RNAi). Frames were captured every 5 s and the movie is played at 12 frames/s. Embryo is oriented with anterior to the left and posterior to the right; elapsed time is shown in minutes and seconds.
Video 3
Time-lapse DIC microscopy of C. elegans embryo over the first two cell cycles.
Embryo expressing GFP-SAS-5 treated with sas-5 (RNAi). Frames were captured every 5 s and the movie is played at 12 frames/s. Embryo is oriented with anterior to the left and posterior to the right; elapsed time is shown in minutes and seconds.
Video 4
Time-lapse DIC microscopy of C. elegans embryo over the first two cell cycles.
Embryo expressing GFP-SAS-5 L141E treated with sas-5 (RNAi). Frames were captured every 5 s and the movie is played at 12 frames/s. Embryo is oriented with anterior to the left and posterior to the right; elapsed time is shown in minutes and seconds.
Video 5
Time-lapse DIC microscopy of C. elegans embryo over the first two cell cycles.
Embryo expressing GFP-SAS-5 I247E treated with sas-5 (RNAi). Frames were captured every 5 s and the movie is played at 12 frames/s. Embryo is oriented with anterior to the left and posterior to the right; elapsed time is shown in minutes and seconds.
Tables
Table 1
Crystallographic data collection and refinement statistics
| Protein | SAS-5CC | SAS-5CC (Pb-derivative) | SAS-5Imp | SAS-5Imp (Hg-derivative) |
|---|---|---|---|---|
| PDB code | 4YV4 | – | 4YNH | – |
| Space group | P 21 21 21 | P 21 21 21 | P 1 21 1 | P 1 21 1 |
| Unit cell (Å, °) | a = 46.52; | a = 46.32; | a = 27.18; | a = 27.85; |
| b = 55.10; | b = 52.99; | b = 36.29; | b = 36.65; | |
| c = 191.50 | c = 191.55 | c = 42.60; | c = 42.13; | |
| β = 97.50 | β = 97.74 | |||
| Beamline | DLS/I04 | DLS/I03 | ESRF ID14-4 | DLS/I02 |
| Wavelength (Å) | 0.9795 | 0.947 | 0.900 | 1.007 |
| Resolution range (Å) | 41.90-1.80 | 41.70-1.90 | 18.49-1.00 | 41.75-1.70 |
| High resolution shell (Å) | 1.84-1.80* | 1.95-1.90† | 1.05-1.00 | 1.74-1.70 |
| Rmerge‡ | 0.047 (1.092) | 0.089 (1.088) | 0.108 (0.763) | 0.065 (0.541) |
| Rpim‡ | 0.034 (0.988) | 0.014 (0.680) | 0.044 (0.314) | 0.017 (0.151) |
| Completeness‡ (%) | 98.1 (97.8) | 80.1 (33.6)§ | 99.4 (98.3) | 85.6 (39.4)# |
| Multiplicity‡ | 2.9 (2.9) | 9.3 (3.6) | 6.9 (6.8) | 18.4 (13.6) |
| Mean I/σ(I)‡ | 7.4 (0.7) | 13 (0.9) | 12.0 (4.2) | 26.5 (4.5) |
| Phasing | ||||
| No. of heavy atom sites | – | 9 | – | 2 |
| Resolution | – | 41.70-1.90 | – | 41.75-1.70 |
| FOM initial¶ | – | 0.39 | – | 0.39 |
| FOM DM** | – | 0.61 | – | 0.75 |
| Refinement statistics | ||||
| Rwork (reflections) | 20.9% (30,118) | – | 12.8% (42,016) | – |
| Rfree(reflections) | 23.8% (1600) | – | 14.9% (2232) | – |
| Number of atoms | ||||
| Protein atoms | 3647 | – | 2040 (including H) | – |
| Ligands | 25 | – | – | – |
| Water | 261 | – | 124 | – |
| Average B factors (Å2) | ||||
| Protein atoms | 50.9 | – | 10.9 | – |
| Water | 46.5 | – | 23.5 | – |
| RMSD from ideal values | ||||
| Bonds / angles (Å/°) | 0.01 / 0.95 | – | 0.007 / 1.152 | – |
| MolProbity statistics†† | ||||
| Ramachandran favored (%) | 99.5% | – | 99.2% | – |
| Ramachandran disallowed (%) | 0% | – | 0% | – |
| Clashscore (percentile) | 2.49 (99th) | – | 0.98 (98th) | – |
| MolProbity score (percentile) | 1.11 (100th) | – | 0.79 (99th) | – |
-
*
Anisotropic diffraction of 2.17 Å, 2.59 Å and 1.73 Å highest resolution along the a*, b* and c* axes, respectively, based on a mean I/σ(I) > 2.0 criterion.
-
†
Anisotropic diffraction of 2.18 Å, 3.03 Å and 2.17 Å highest resolution along the a*, b* and c* axes, respectively, based on a mean I/σ(I) > 2.0 criterion.
-
‡
By Aimless (Evans and Murshudov, 2013), values in parentheses correspond to the high resolution shell.
-
§
98.0% complete to 2.26 Å
-
#
98.8% complete to 2.03 Å
-
¶
From PHASER (Mccoy et al., 2007).
-
**
From RESOLVE (Terwilliger, 2000).
-
††
From MolProbity (Chen et al., 2010).
Table 2
Anisotropy correction statistics* for native SAS-5CC crystallographic data
| Resolution (Å) | Number of observed reflections | Redundancy | Completeness (%) | Rmerge (%) | Mean I/σ(I) | |||||
|---|---|---|---|---|---|---|---|---|---|---|
| Before | After | Before | After | Before | After | Before | After | Before | After | |
| 8.05 | 1428 | 1428 | 2.3 | 2.3 | 92.3 | 92.3 | 2.9 | 2.9 | 22.3 | 21.9 |
| 5.69 | 2617 | 2598 | 2.5 | 2.5 | 92.1 | 92.2 | 3.3 | 3.3 | 22.3 | 21.9 |
| 4.65 | 3322 | 3317 | 2.6 | 2.6 | 94.4 | 94.4 | 4.0 | 4.0 | 22.4 | 22 |
| 4.03 | 3949 | 3923 | 2.6 | 2.6 | 93.3 | 93.2 | 3.6 | 3.6 | 22.7 | 22.3 |
| 3.6 | 4581 | 4527 | 2.7 | 2.7 | 95.8 | 95.8 | 3.7 | 3.8 | 21.7 | 21.3 |
| 3.29 | 4925 | 4957 | 2.6 | 2.6 | 95.1 | 95.3 | 4.1 | 4.1 | 19.8 | 19.4 |
| 3.04 | 5760 | 5703 | 2.8 | 2.8 | 96.9 | 96.7 | 5.0 | 5.0 | 17.1 | 16.8 |
| 2.85 | 6026 | 6003 | 2.8 | 2.8 | 96.3 | 96.4 | 5.1 | 5.1 | 14.2 | 13.9 |
| 2.68 | 6696 | 6649 | 2.9 | 2.9 | 97.8 | 97.8 | 6.5 | 6.4 | 12.1 | 11.9 |
| 2.55 | 7098 | 7098 | 2.9 | 3 | 98.6 | 98.5 | 7.5 | 7.5 | 10.1 | 9.9 |
| 2.43 | 7178 | 7136 | 2.8 | 2.8 | 98.2 | 98.1 | 9.4 | 9.3 | 8.2 | 8.1 |
| 2.32 | 7824 | 7781 | 3 | 3 | 98.9 | 99.1 | 11.8 | 11.7 | 6.8 | 6.7 |
| 2.23 | 7844 | 7233 | 2.8 | 2.6 | 97.4 | 91.1 | 15.9 | 14.9 | 5.2 | 5.4 |
| 2.15 | 8551 | 6609 | 3 | 2.3 | 99.0 | 79.6 | 20.4 | 15.9 | 4.4 | 5.3 |
| 2.08 | 8757 | 5726 | 3 | 2 | 99.0 | 66.9 | 29.3 | 20.0 | 3.1 | 4.4 |
| 2.01 | 8707 | 4542 | 2.9 | 1.5 | 98.7 | 51.8 | 41.8 | 22.9 | 2.3 | 4.1 |
| 1.95 | 9329 | 3355 | 3 | 1.1 | 99.1 | 33.9 | 59.1 | 24.0 | 1.7 | 4.2 |
| 1.9 | 9150 | 2341 | 2.9 | 0.7 | 98.1 | 20.5 | 93.3 | 30.2 | 1.1 | 3.8 |
| 1.85 | 9824 | 1532 | 3 | 0.5 | 99.2 | 11.6 | 114.0 | 28.6 | 0.9 | 4.5 |
| 1.8 | 9748 | 502 | 2.8 | 0.1 | 97.9 | 3.9 | 143.1 | 31.8 | 0.8 | 3.9 |
| total | 133314 | 92,960 | 2.9 | 2 | 97.6 | 68.2 | 4.9 | 4.4 | 8.2 | 11.3 |
-
*
Derived from the UCLA Diffraction Anisotropy Server (Strong et al., 2006).
Table 3
CD and SEC-MALS experimental details
| CD | ||
|---|---|---|
| Protein name | Concentration (μM) | |
| SAS-5FL | 1.5 | |
| SAS-5Δ282–295 | 3 | |
| SAS-5FLEX | 3 | |
| SAS-52–265 | 6 | |
| SAS-52–265 L141E | 6 | |
| SAS-52–265 L141E/M167E | 6 | |
| SAS-5–265 I247E | 6 | |
| SAS-52–265 L141E/I247E | 6 | |
| SAS-5125–265 | 10 | |
| SAS-5CC | 20 | |
| SAS-5CC L141E | 20 | |
| SAS-5Imp | 20 | |
| SAS-5Imp I247E | 20 | |
| SAS-5 N-terminus | 20 | |
| SAS-5 C-terminus | 5 | |
| SEC-MALS | ||||
|---|---|---|---|---|
| Protein name | Monomeric MW (kDa) | Size exclusion column | Minimum concentration (μM)* | Maximum concentration (μM)* |
| SAS-5FL | 46 | Superose6 | 0.10 | 0.57 |
| SAS-5FLEX-MsyB | 62 | Superose6 | 0.03 | 9.5 |
| SAS-52–265-MsyB (Figure 4) | 46 | Superose6 | 0.02 | 41 |
| SAS-52–265-MsyB (Figure 5) | 46 | Superdex200 | 0.05 | 41 |
| SAS-52–265 L141E | 46 | Superdex200 | 1.32 | 63 |
| SAS-52–265 L141E/M167E | 46 | Superdex200 | 1.16 | 63 |
| SAS-52–265 I247E | 46 | Superdex200 | 0.05 | 63 |
| SAS-52–265 L141E/I247E | 46 | Superdex200 | 0.82 | 63 |
| SAS-5Imp | 6.5 | Superdex75 | 2.9 | 292 |
| SAS-5CC-L | 12.5 | Superdex75 | 0.18 | 152 |
| C. briggsae SAS-5 (96–199) | 12.7 | Superdex75 | 0.10 | 149 |
| C. brenneri SAS-5 (1–82) | 10.2 | Superdex75 | 0.21 | 186 |
| C. remanei SAS-5 (98–206) | 13 | Superdex75 | 0.21 | 146 |
| C. sinica SAS-5 (94–204) | 13 | Superdex75 | 0.16 | 145 |
| C. tropicalis SAS-5 (94–199) | 12.5 | Superdex75 | 0.12 | 152 |
-
*
Refers to on-column concentration calculated from the protein differential refractive index.
Download links
A two-part list of links to download the article, or parts of the article, in various formats.
Downloads (link to download the article as PDF)
Open citations (links to open the citations from this article in various online reference manager services)
Cite this article (links to download the citations from this article in formats compatible with various reference manager tools)
The Caenorhabditis elegans protein SAS-5 forms large oligomeric assemblies critical for centriole formation
eLife 4:e07410.
https://doi.org/10.7554/eLife.07410


