The enterococcal cytolysin synthetase has an unanticipated lipid kinase fold
- University of Illinois at Urbana-Champaign, United States
- Howard Hughes Medical Institute, University of Illinois at Urbana-Champaign, United States
- Cornell High Energy Synchrotron Source, United States
Figures
Figure 1 with 2 supplements
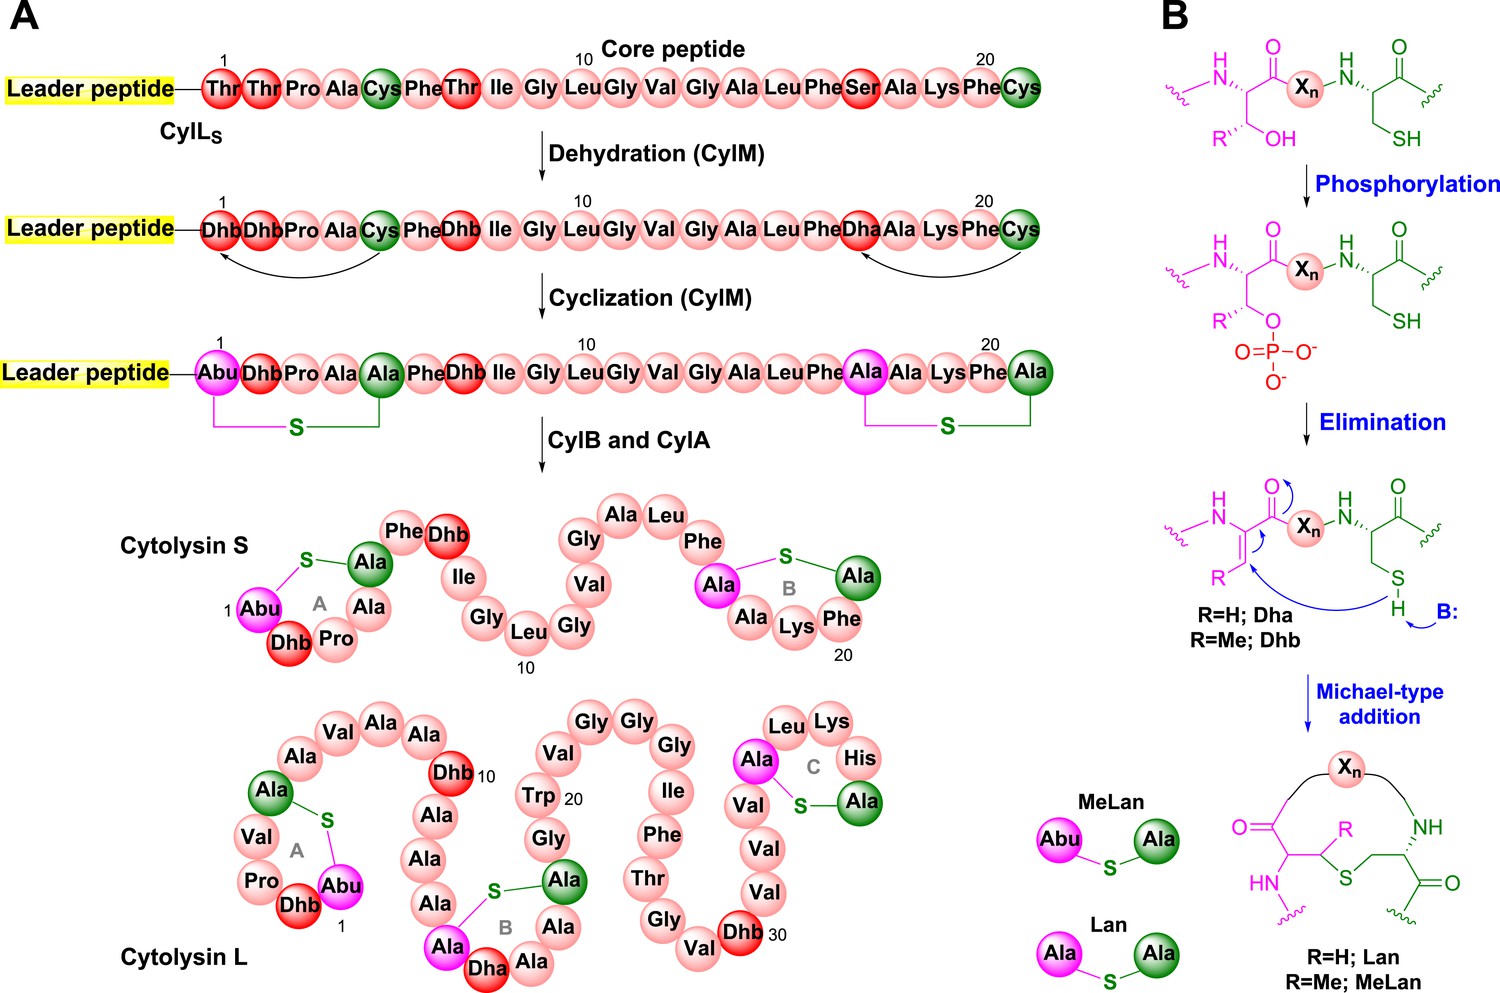
Biosynthesis of the enterococcal cytolysin.
(A) Biosynthetic route to cytolysin S (small subunit of cytolysin) and the structure of cytolysin L (large subunit of cytolysin). CylM dehydrates three Thr and one Ser in the precursor peptide CylLS to generate three Dhb residues and one Dha. The enzyme also catalyzes the conjugate addition of the thiols of Cys5 to Dhb1 and Cys21 to Dha17. The proteases CylB and CylA then remove the leader peptide in a step-wise manner to provide cytolysin S. In similar fashion, CylM catalyzes seven dehydrations of Ser and Thr residues and three cyclization reactions during the biosynthesis of the large subunit of cytolysin. Abu-S-Ala = methyllanthionine (MeLan); Ala-S-Ala = lanthionine (Lan); Dha = dehydroalanine; Dhb = dehydrobutyrine. (B) Post-translational modifications carried out by CylM during cytolysin biosynthesis. Xn = peptide linker.
Figure 1—figure supplement 1
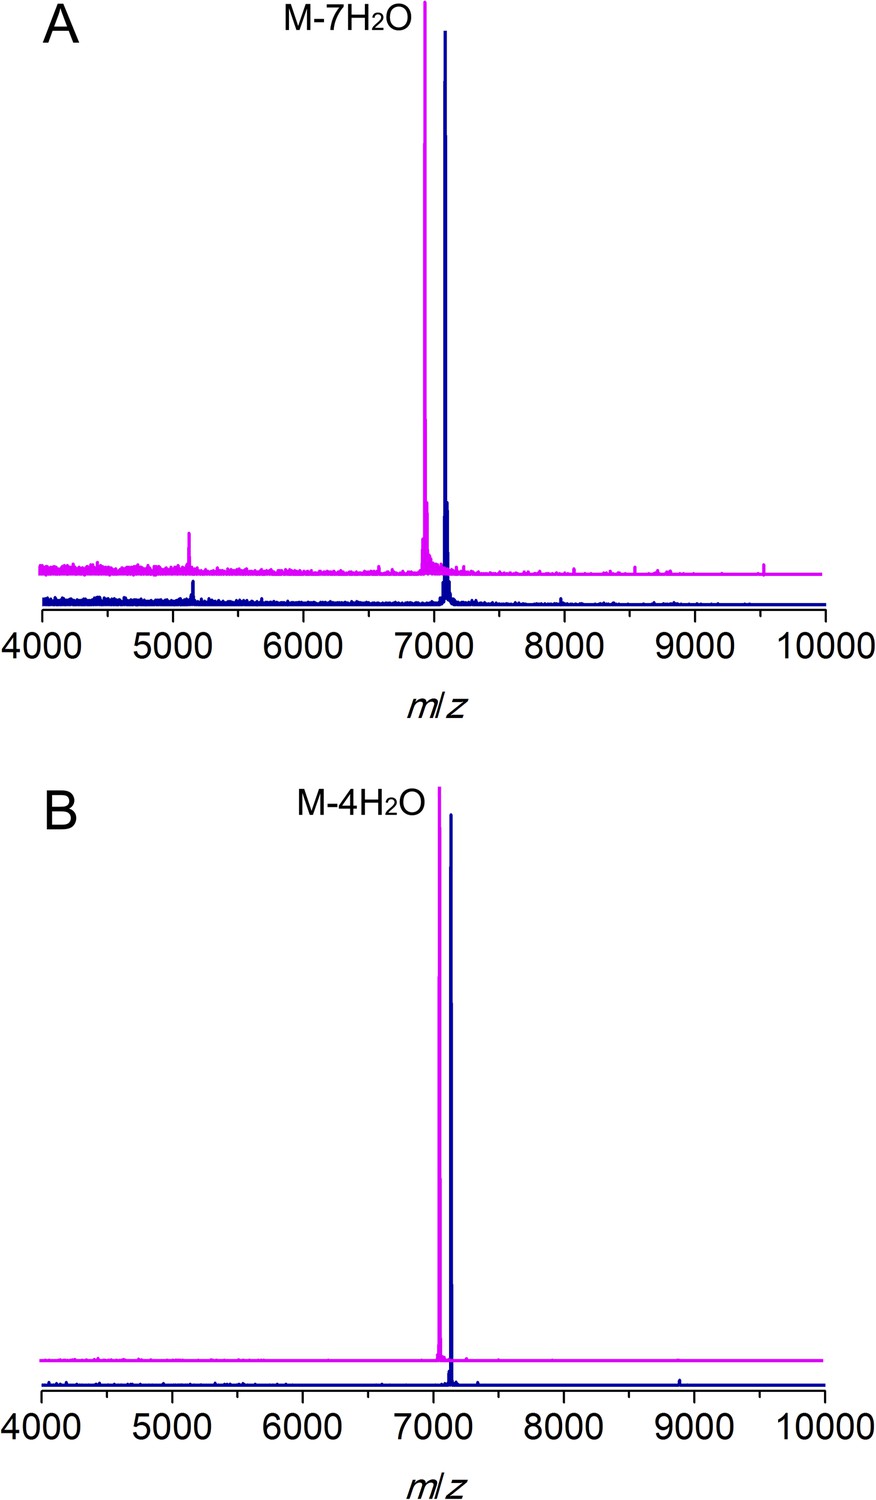
MALDI/TOF mass spectra for CylLL (A) and CylLS (B) peptides incubated with (magenta traces) or without (blue traces) CylM.
Linear CylLL, calculated M: 7,082, average mass; observed M + H+: 7084, average mass. CylM modified CylLL, calculated M—7 H2O: 6956, average mass; observed M—7 H2O + H+: 6958, average mass. CylLS, calculated M: 7132, average mass; observed M + H+: 7134, average mass. CylM modified CylLS, calculated M—4 H2O: 7060, average mass; observed M—4 H2O + H+: 7062, average mass. The observed masses are consistent with the expected post-translational modifications shown in Figure 1.
Figure 1—figure supplement 2
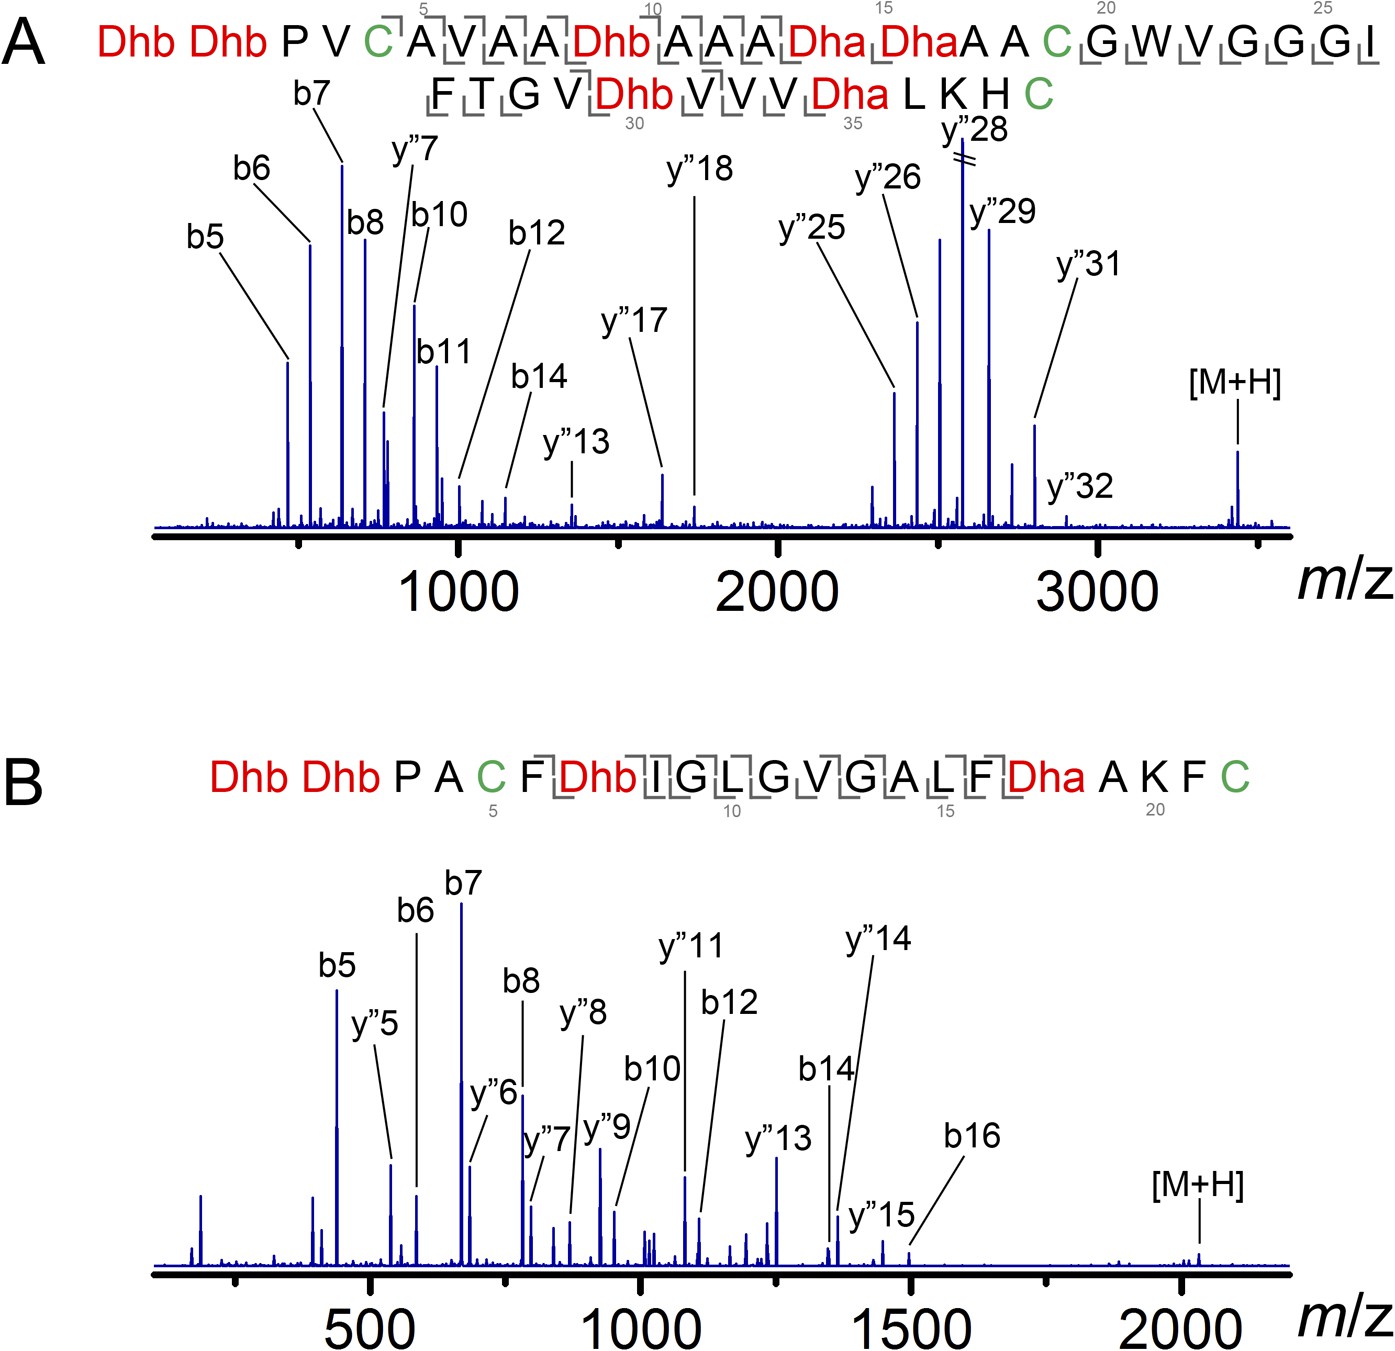
ESI MS/MS analysis of CylLL (A) and CylLS (B) core peptides modified by CylM in vitro and treated with the protease CylA that removes the leader peptide.
The fragmentation pattern verifies the expected ring topology. The parent ions provided masses consistent with the expected structure and the MS/MS data corroborate the ring topology. CylM-modified CylLL core peptide, calculated (M—7 H2O + 3 H)3+: 1146.2, monoisotopic mass; observed (M—7 H2O + 3 H)3+: 1146.2, monoisotopic mass. CylM-modified CylLS core peptide, calculated (M—4 H2O + 2 H)2+: 1016.5, monoisotopic mass; observed (M—4 H2O + 2 H)2+: 1016.5, monoisotopic mass.
Figure 2 with 3 supplements
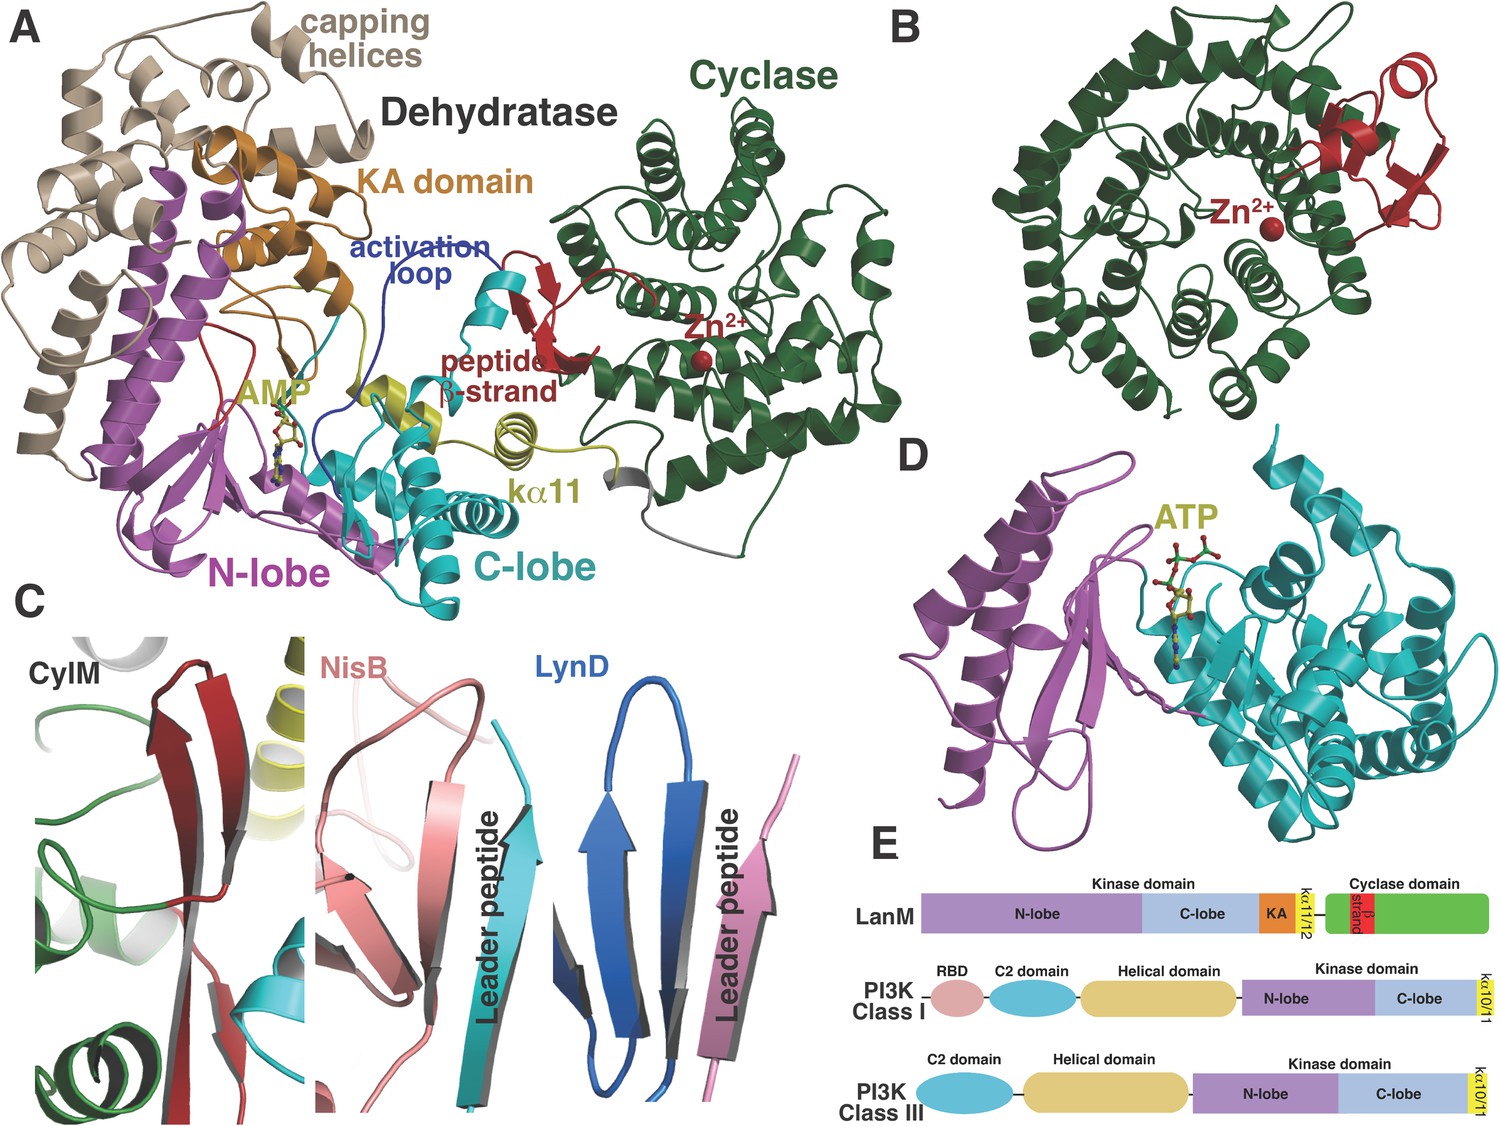
(A) Overall structure of CylM.
(B) Structure of the class I lanthipeptide cyclase NisC illustrating the structural homology with the C-terminus of CylM. (C) Comparison of the putative peptide-binding β-strands of CylM with the peptide binding regions of other RiPP biosynthetic enzymes including NisB (involved in nisin biosynthesis, PDB 4WD9) and LynD (involved in cyanobactin biosynthesis; PDB 4V1T). (D) Structure of the lipid kinase PI3K that shares homology with the dehydration domain of CylM. (E) Domain organization of LanMs in comparison with that of lipid kinases. RBD, Ras-binding domain.
Figure 2—figure supplement 1
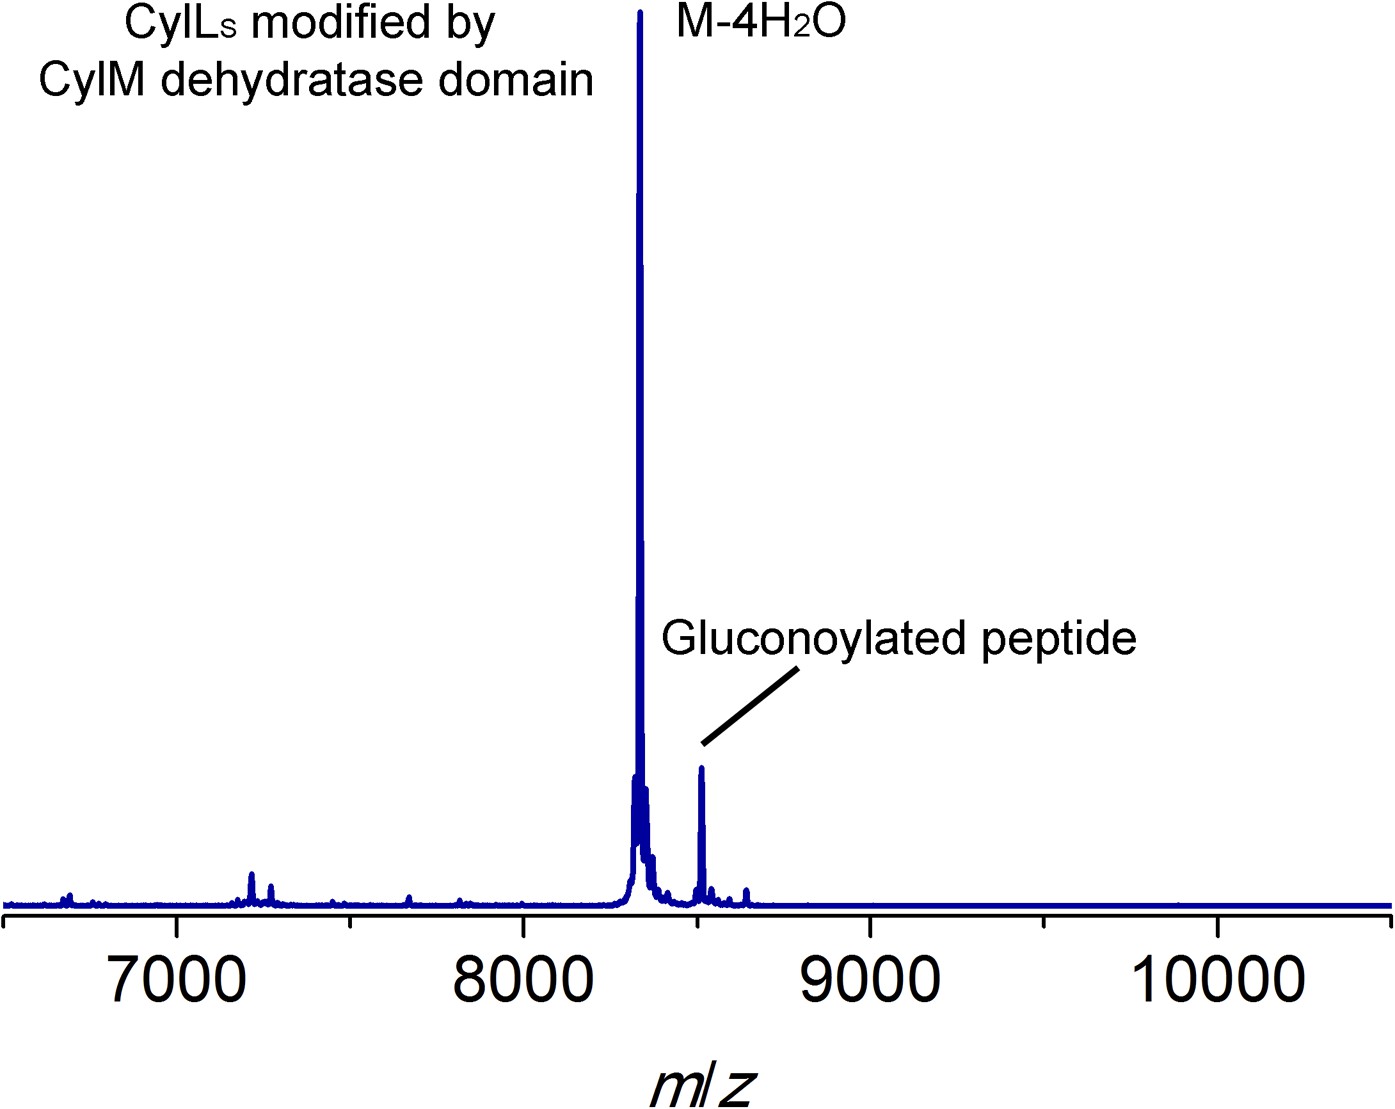
MALDI-TOF mass spectrum for CylLS modified by the CylM dehydratase domain in Escherichia coli.
Calculated M—4 H2O: 8330, average mass; observed M—4 H2O + H+: 8334, average mass. Partial gluconoylation at the N-terminus of dehydrated CylLS occurred when expressing the peptide in E. coli BL21(DE3), resulting in a +178 Da peak in addition to the desired peptide mass (Aon et al., 2008).
Figure 2—figure supplement 2
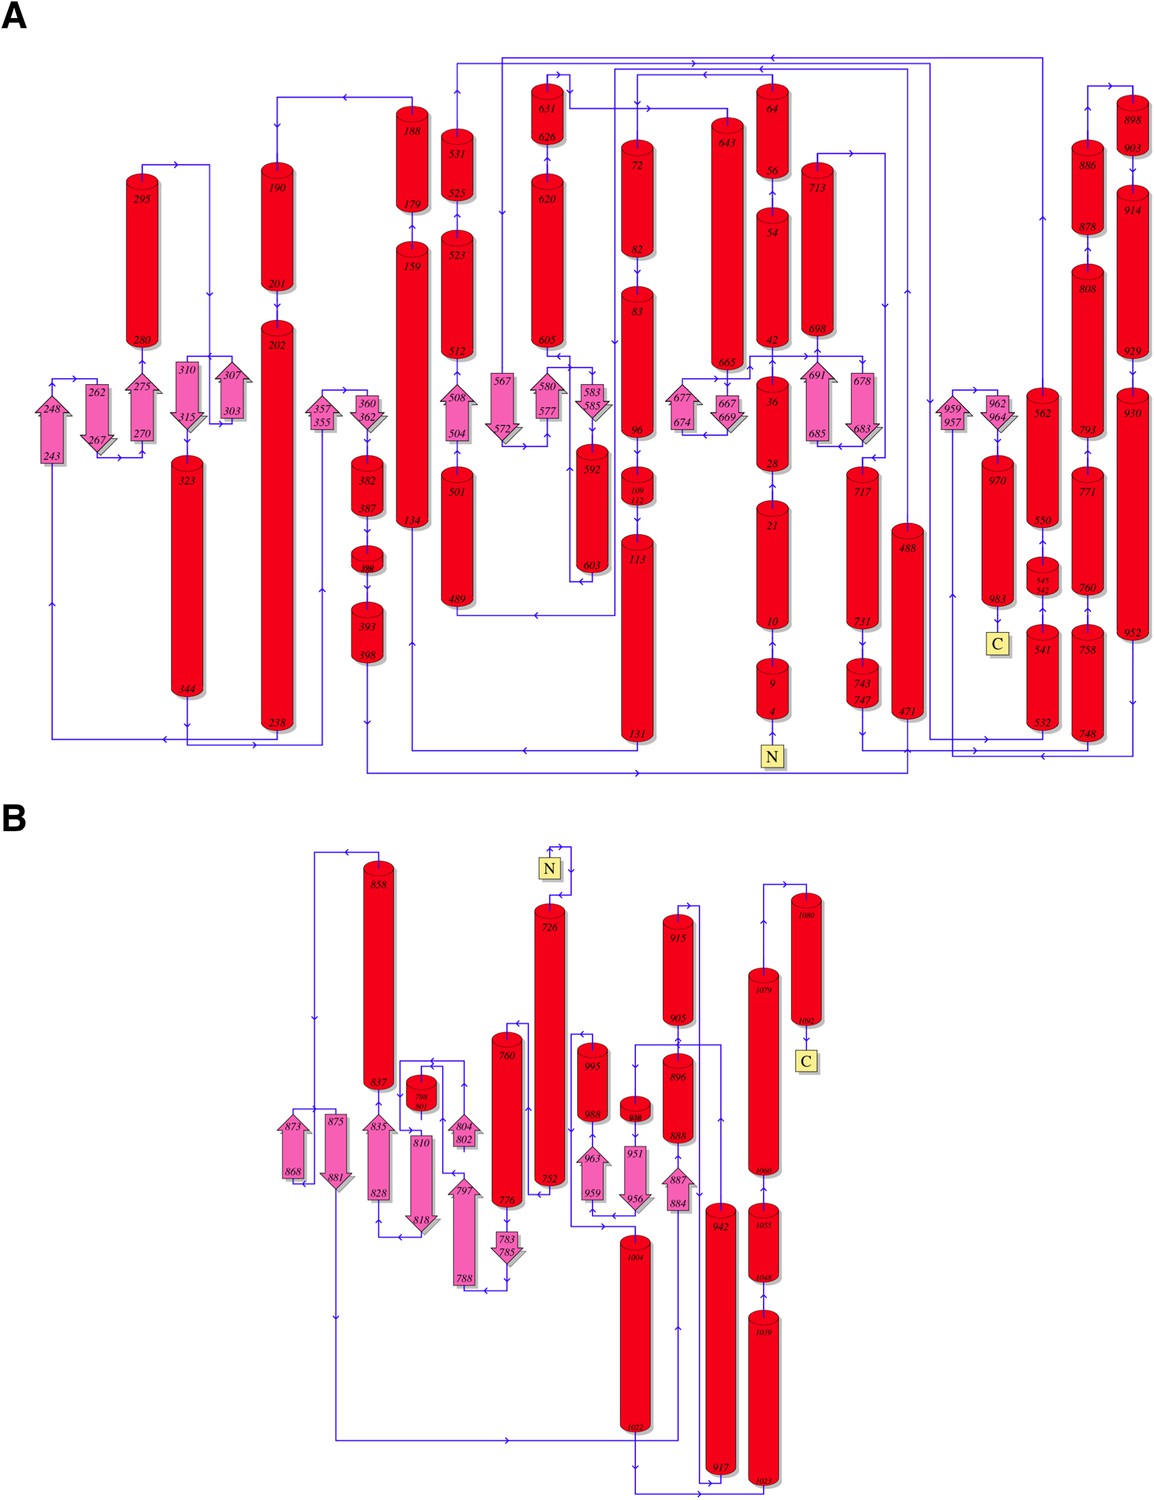
Topology diagrams for (A) CylM and (B) PI3 kinase P110γ.
https://doi.org/10.7554/eLife.07607.008
Figure 2—figure supplement 3
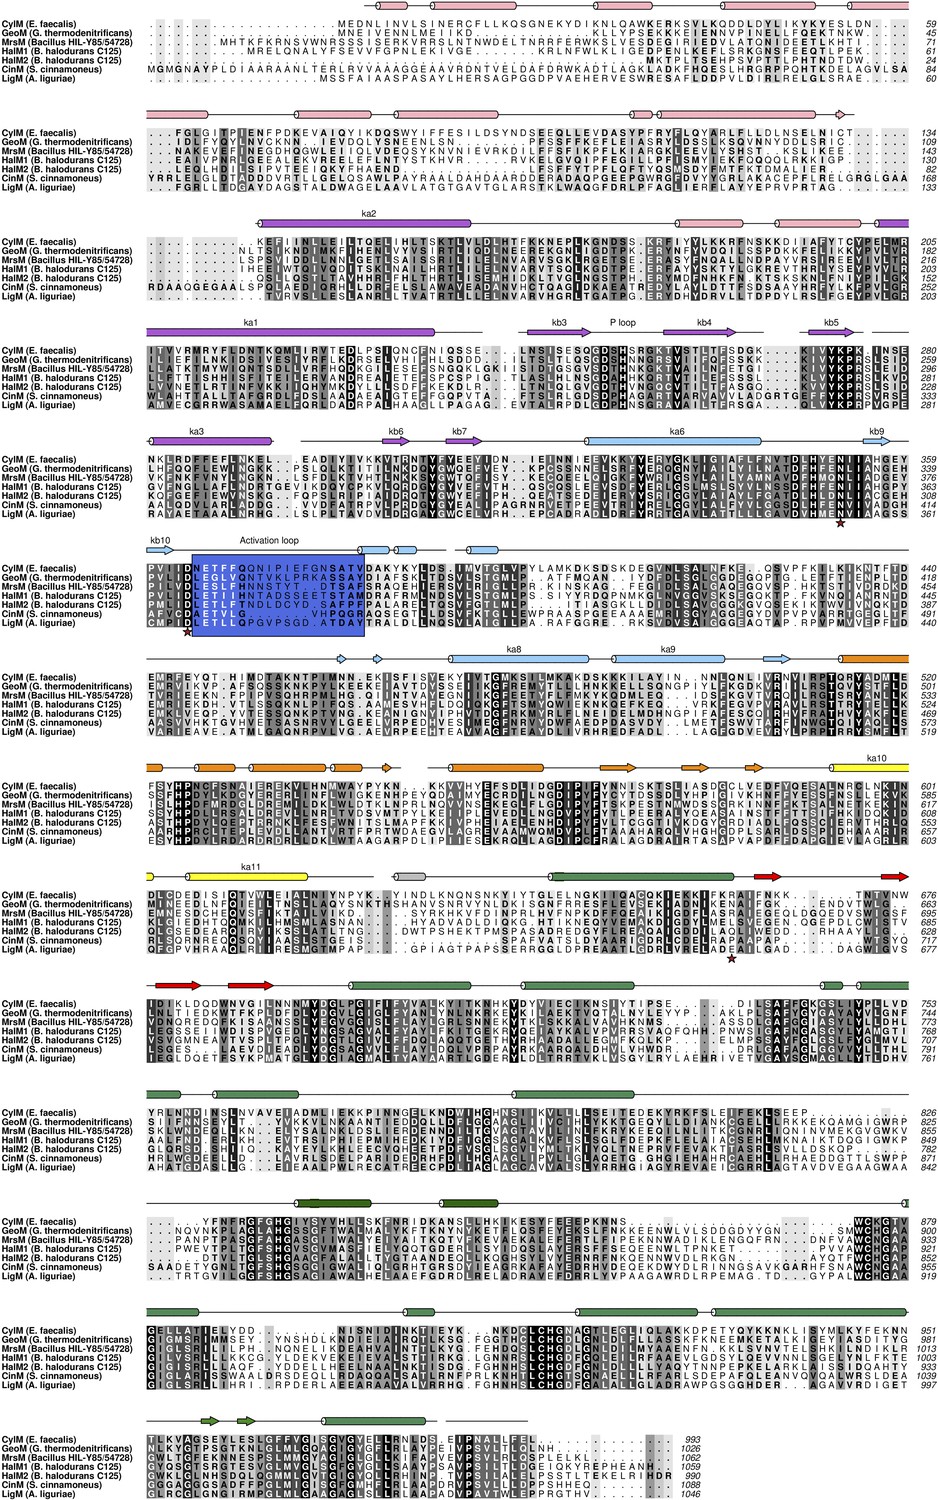
Structure based alignment of biochemically characterized LanM enzymes.
Secondary structural elements are colored as in Figures 2A, 3A.
Figure 3 with 3 supplements
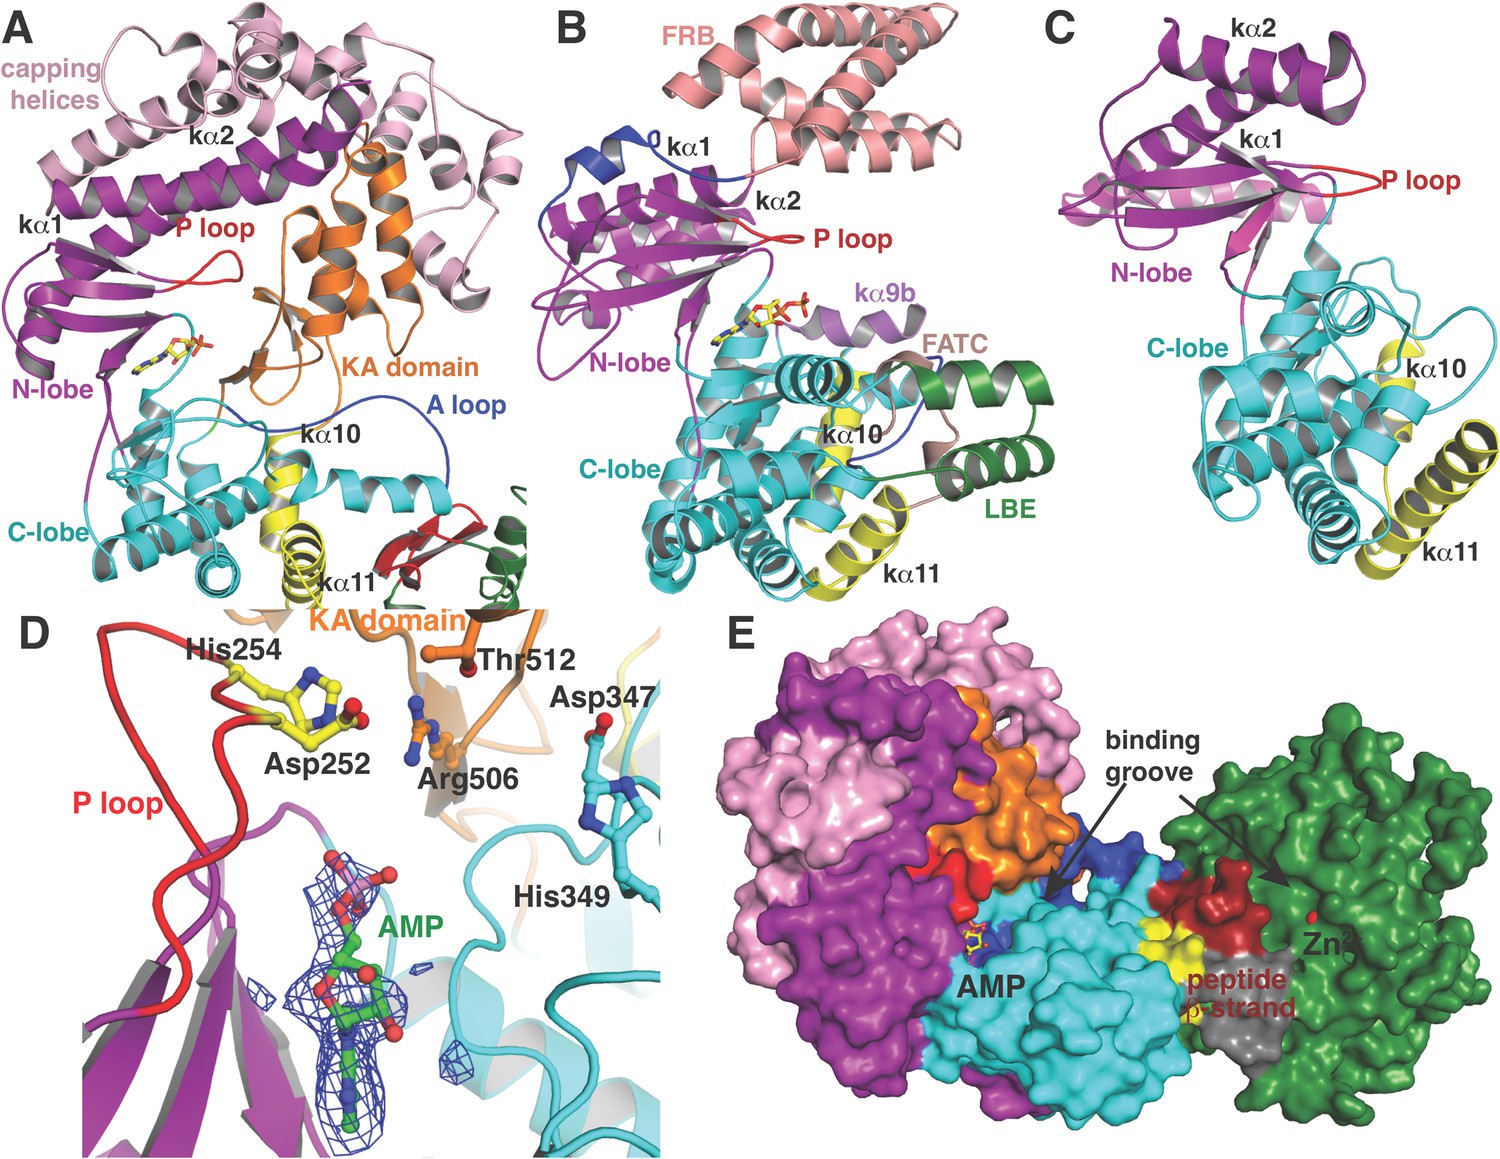
(A–C) Comparison of the kinase domains of (A) CylM, with those of (B) mammalian target of rapamycin (mTOR) and (C) DNA-PKc (a PI3 kinase).
Secondary structural elements are colored as in Figure 2A and structurally unique insertions are designated. (D) Close up of the CylM dehydratase active site showing the bound nucleotide, and the proximity of residues important for phosphorylation and phosphate elimination. A simulated annealing difference Fourier map (calculated without the nucleotide) is superimposed in blue mesh. (E) Solvent occluded surface showing the two possible peptide-binding grooves that flank the peptide β-strand element (red). A loop = activation loop.
Figure 3—figure supplement 1
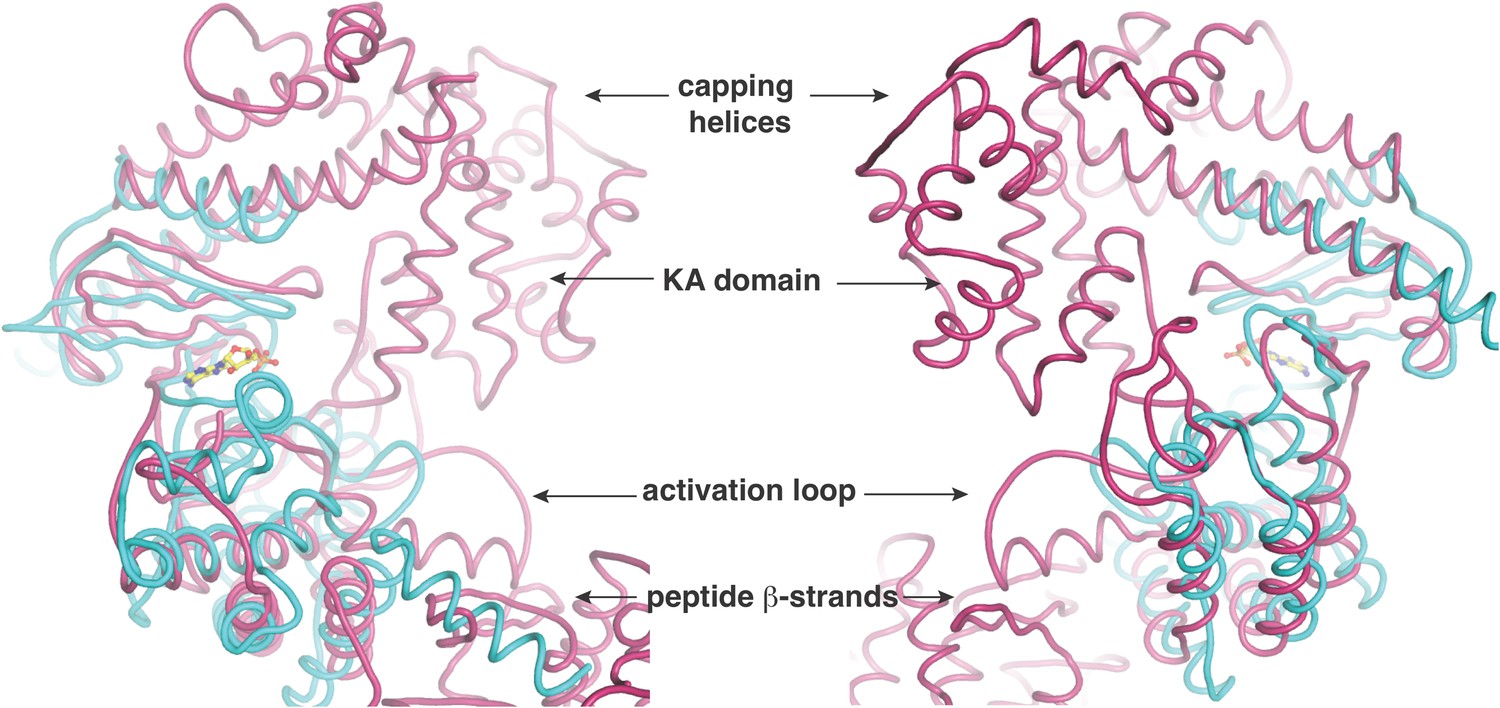
Two views, rotated by 180o, of the superposition of the kinase active site of CylM (in purple) with the kinase domain of PI3 kinase (in cyan).
Relevant structural and functional elements are noted.
Figure 3—figure supplement 2
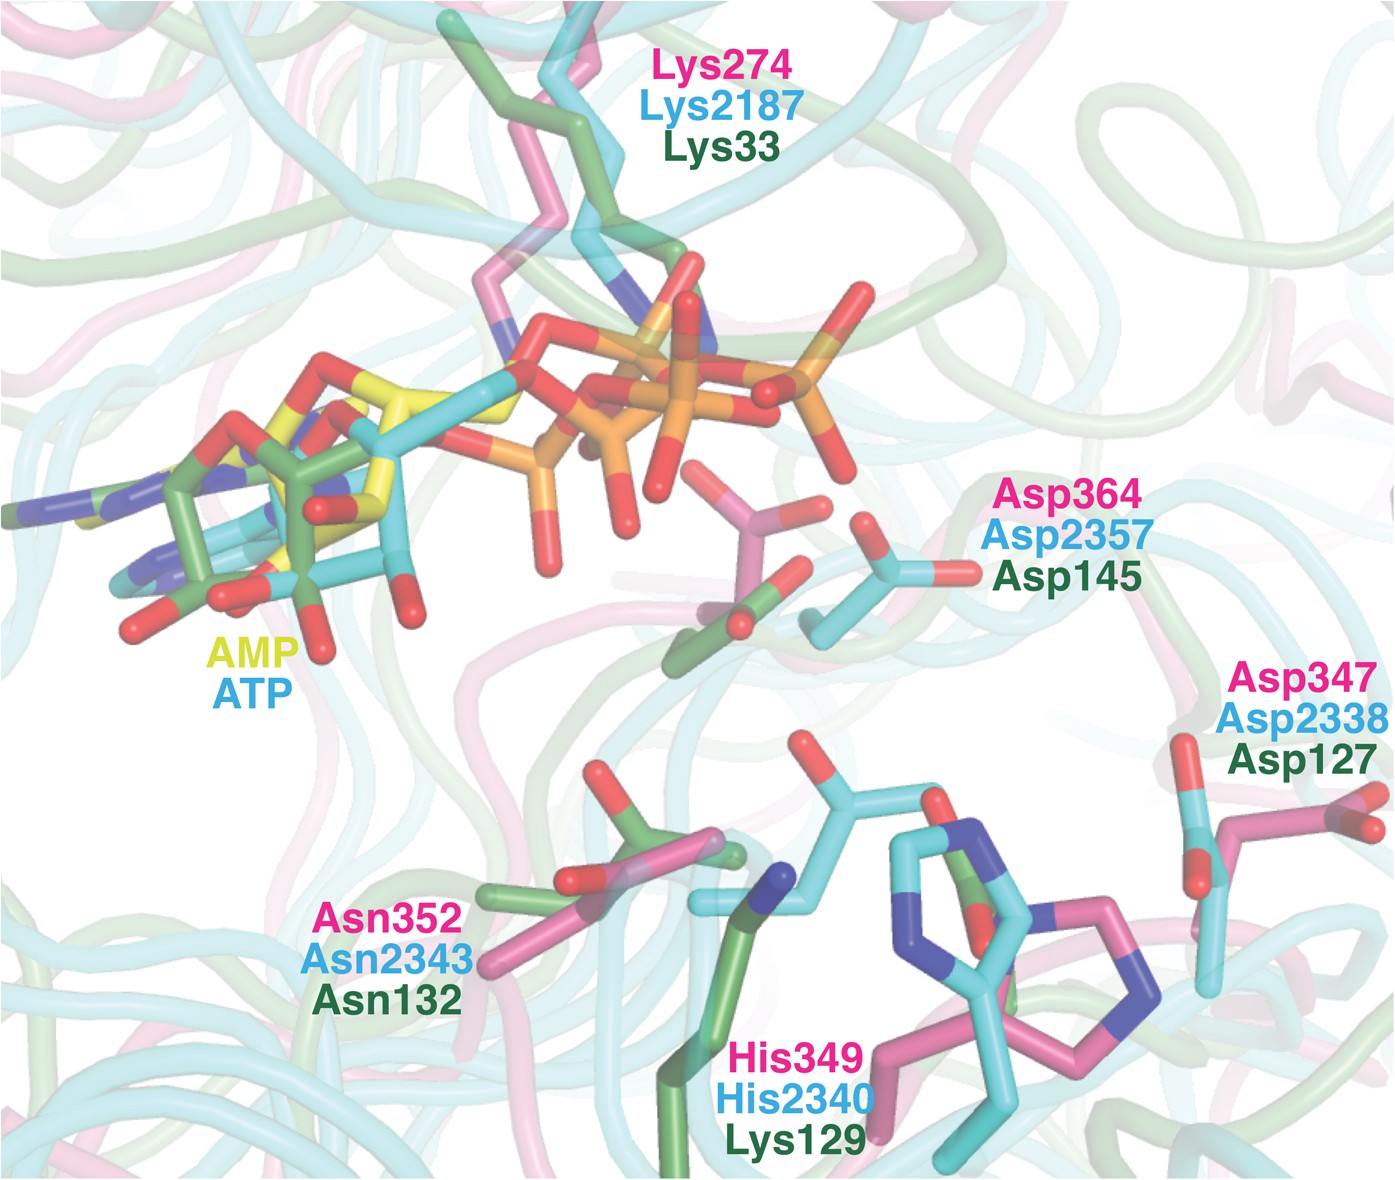
Superposition of the active sites of CylM (pink) with the co-crystal structures of transition state mimics bound to mTOR (cyan) and cyclin-dependent protein kinase CDK2 (green).
Conserved active site residues implicated in the catalytic mechanism are labeled using the same color-coding as for the polypeptides.
Figure 3—figure supplement 3
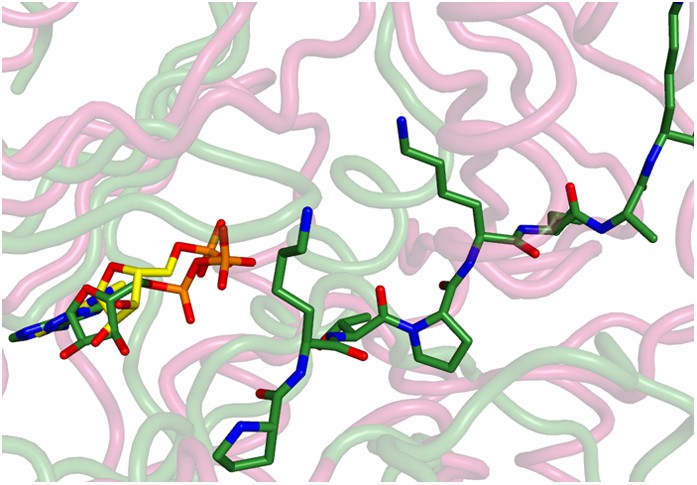
Superposition of the active sites of CylM (pink) with cyclin-dependent protein kinase CDK2 bound to a peptide substrate (green).
The insertions in the kinase domain of CylM preclude binding of the CylA peptide substrate in a similar pose.
Figure 4
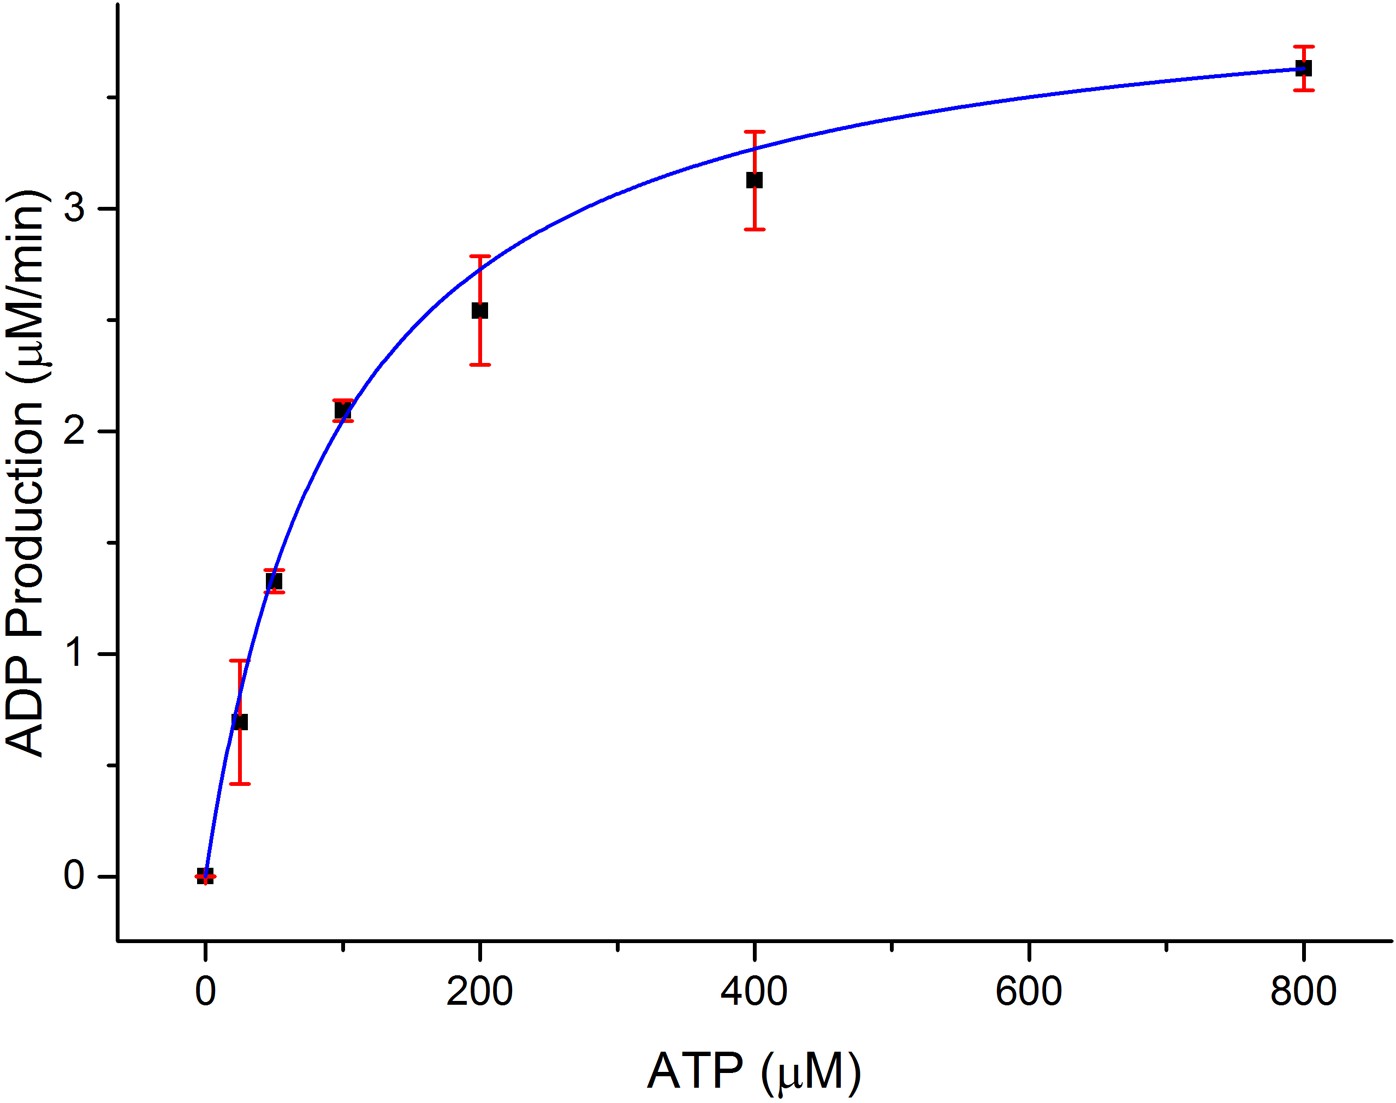
Dependence of the rate of ADP production by CylM (1 μM) on ATP concentration in the presence of 100 μM CylLS.
https://doi.org/10.7554/eLife.07607.014
Figure 5 with 2 supplements
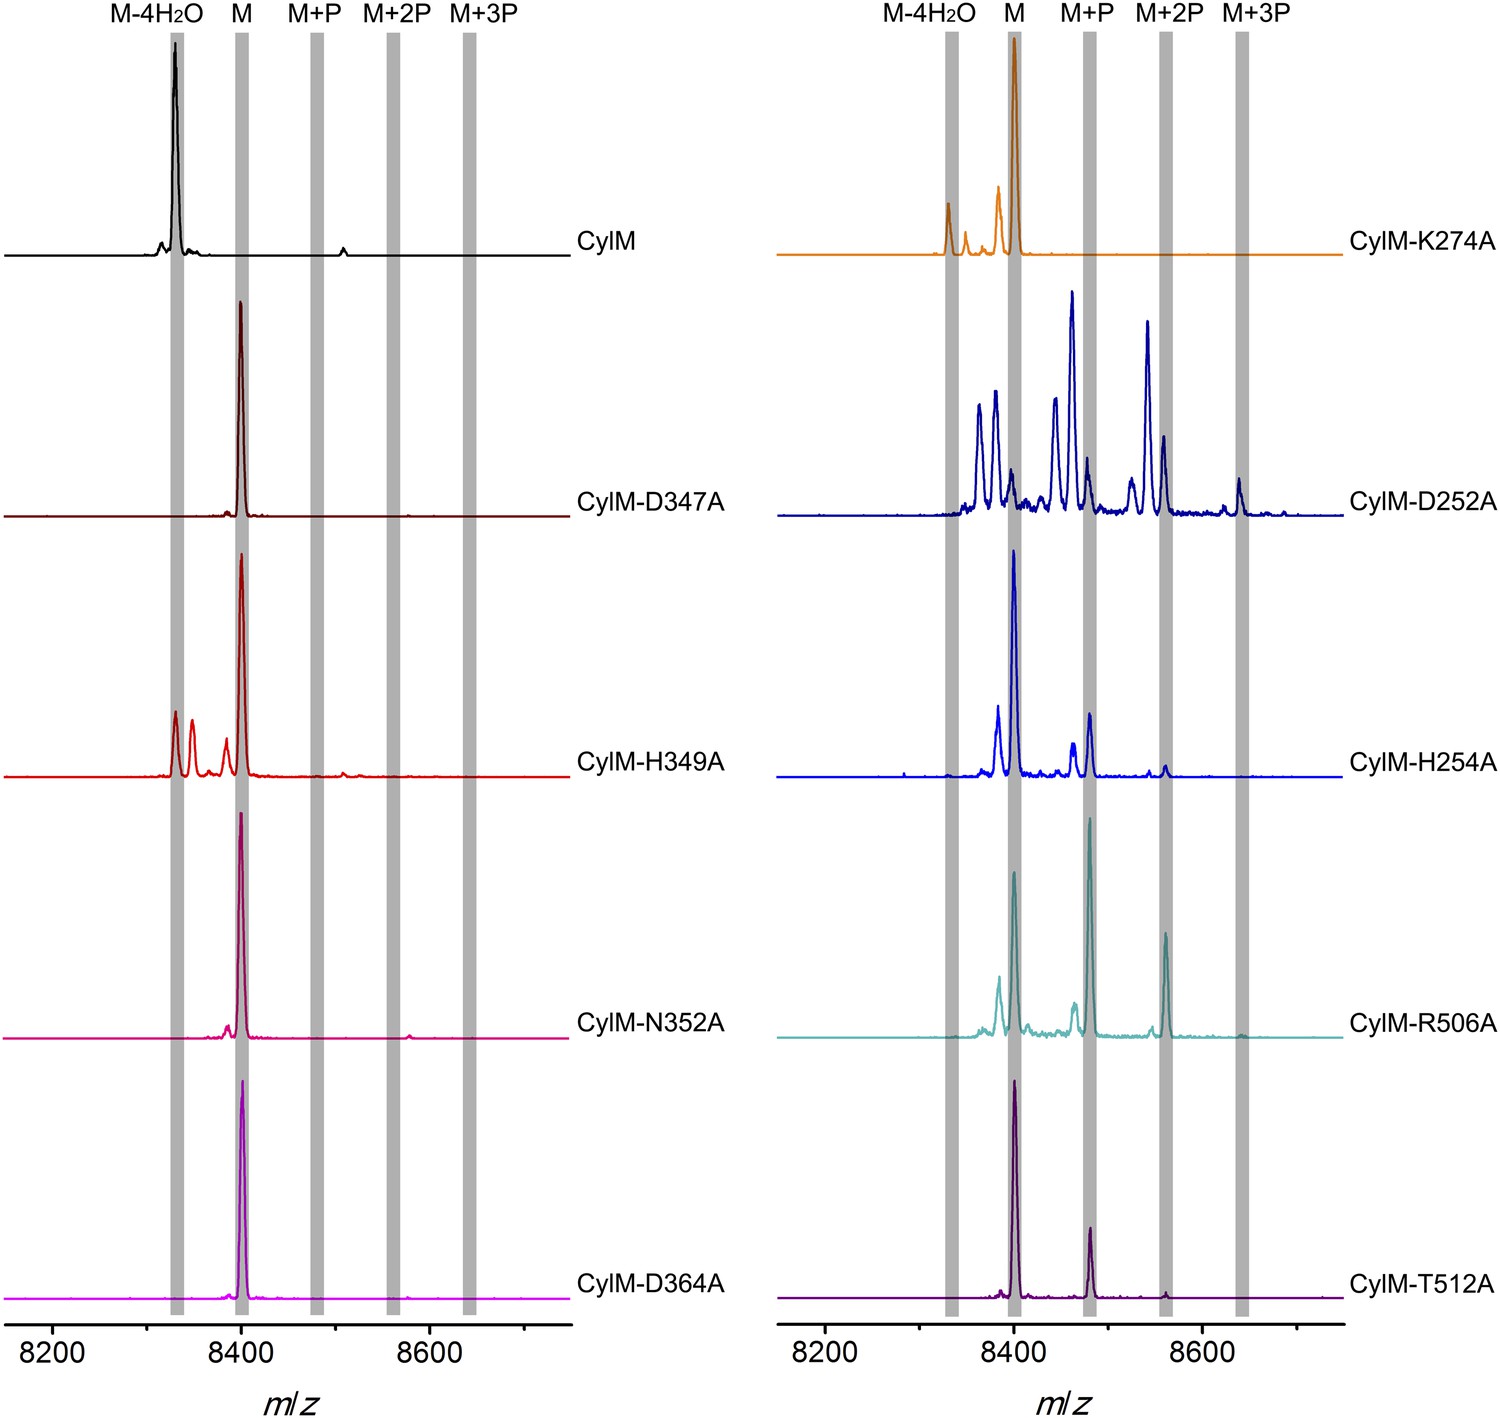
MALDI-TOF mass spectra of CylLS peptides co-expressed with CylM and CylM mutants in E. coli. M = unmodified CylLs; P = phosphorylation.
Peaks between the highlighted masses of multiply phosphorylated CylLS correspond to intermediates resulting from both phosphorylation and partial dehydration. A table showing the calculated and observed masses of each intermediate is provided in Figure 5—source data 1.
-
Figure 5—source data 1
Calculated and observed masses of CylLS peptides modified by CylM and CylM mutants in E. coli.
All calculated masses are [M + H]. -: not observed.
- https://doi.org/10.7554/eLife.07607.016
-
Figure 5—source data 2
Calculated and observed masses of CylLS peptides incubated with CylM and CylM mutants in vitro for 30 min.
All calculated masses are [M + H]. -: not observed.
- https://doi.org/10.7554/eLife.07607.017
-
Figure 5—source data 3
Calculated and observed masses of CylLS peptides incubated with CylM and CylM mutants in vitro for 10 hr.
All calculated masses are [M + H]. -: not observed.
- https://doi.org/10.7554/eLife.07607.018
Figure 5—figure supplement 1
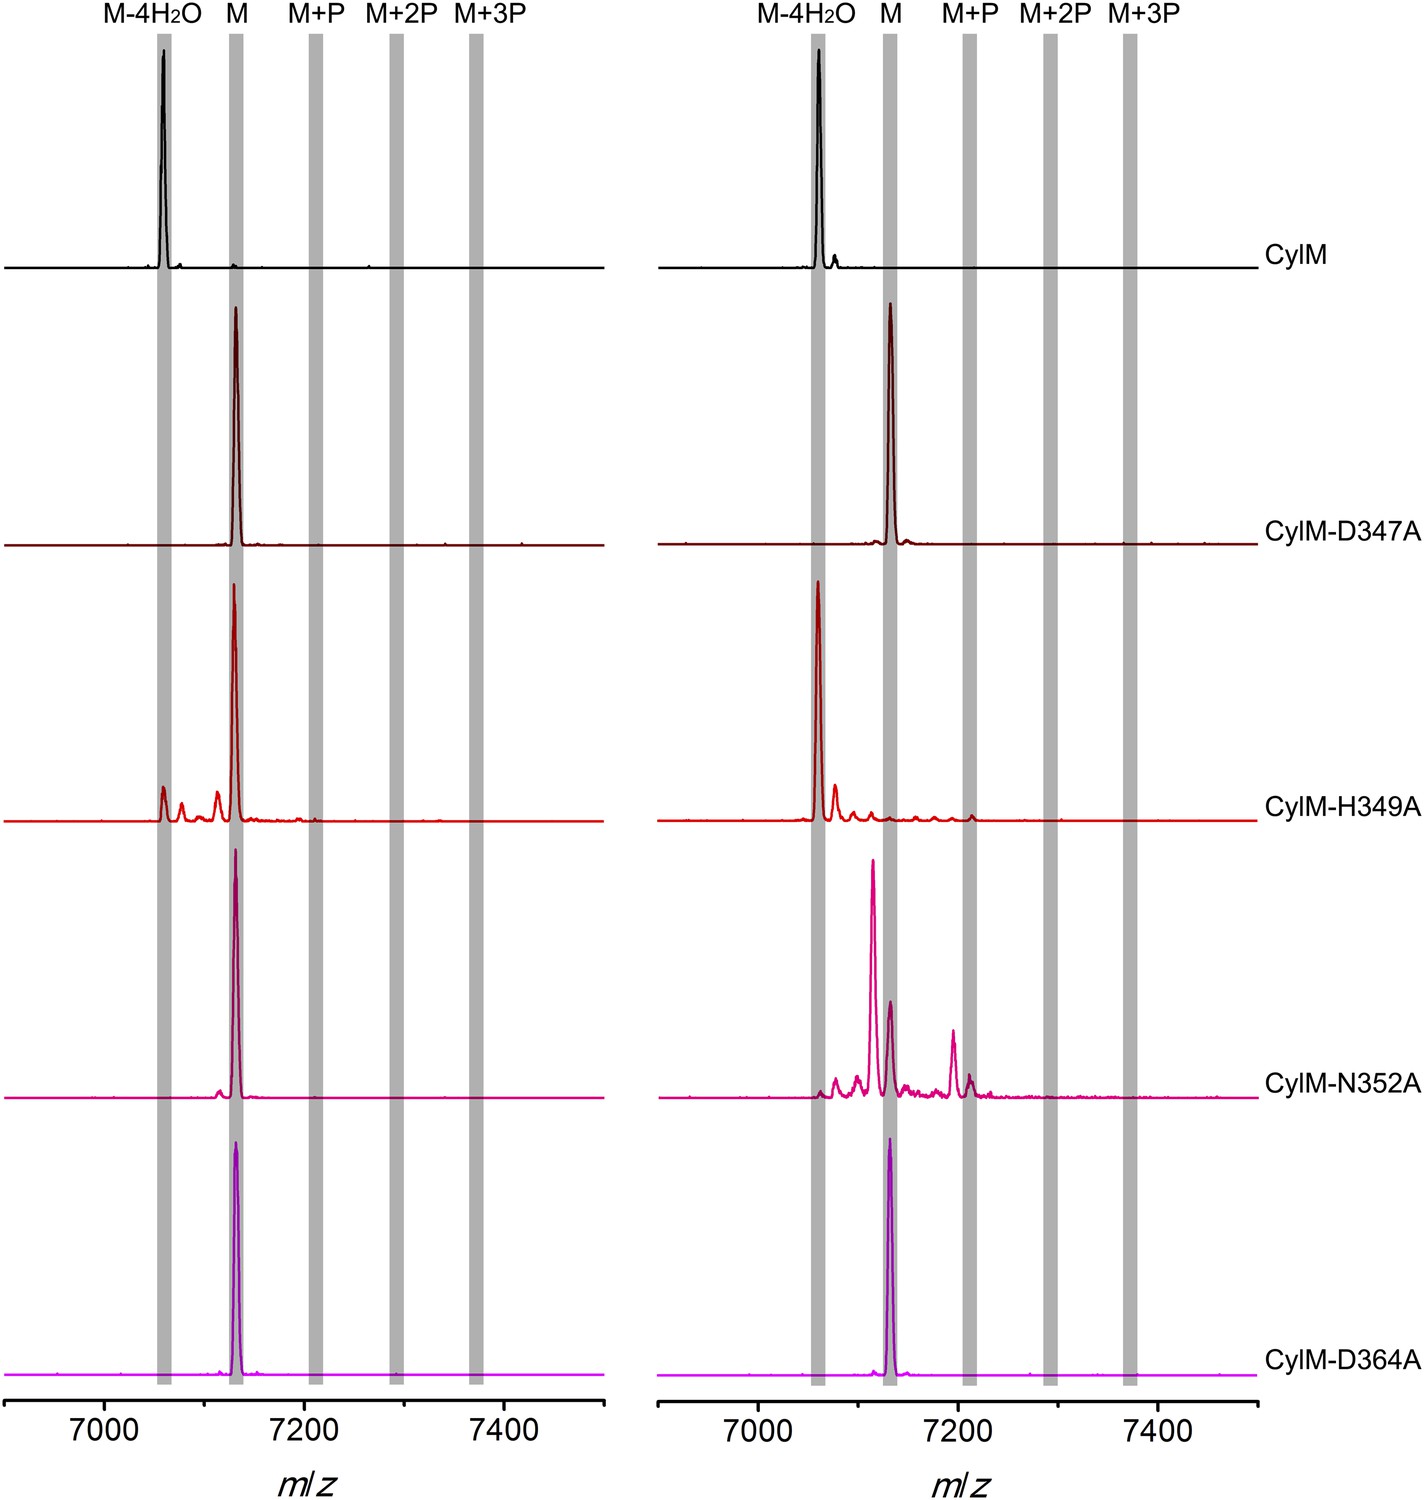
MALDI-TOF mass spectra of CylLS peptides incubated with CylM and CylM phosphorylation-deficient mutants in vitro for 30 min (left) and 10 hr (right).
M = unmodified CylLs; P = phosphorylation. Peaks between the masses of the highlighted multiply phosphorylated CylLS correspond to intermediates resulting from both phosphorylation and partial dehydration. A table showing the calculated and observed masses of each intermediate is provided in Figure 5—source data 2.
Figure 5—figure supplement 2
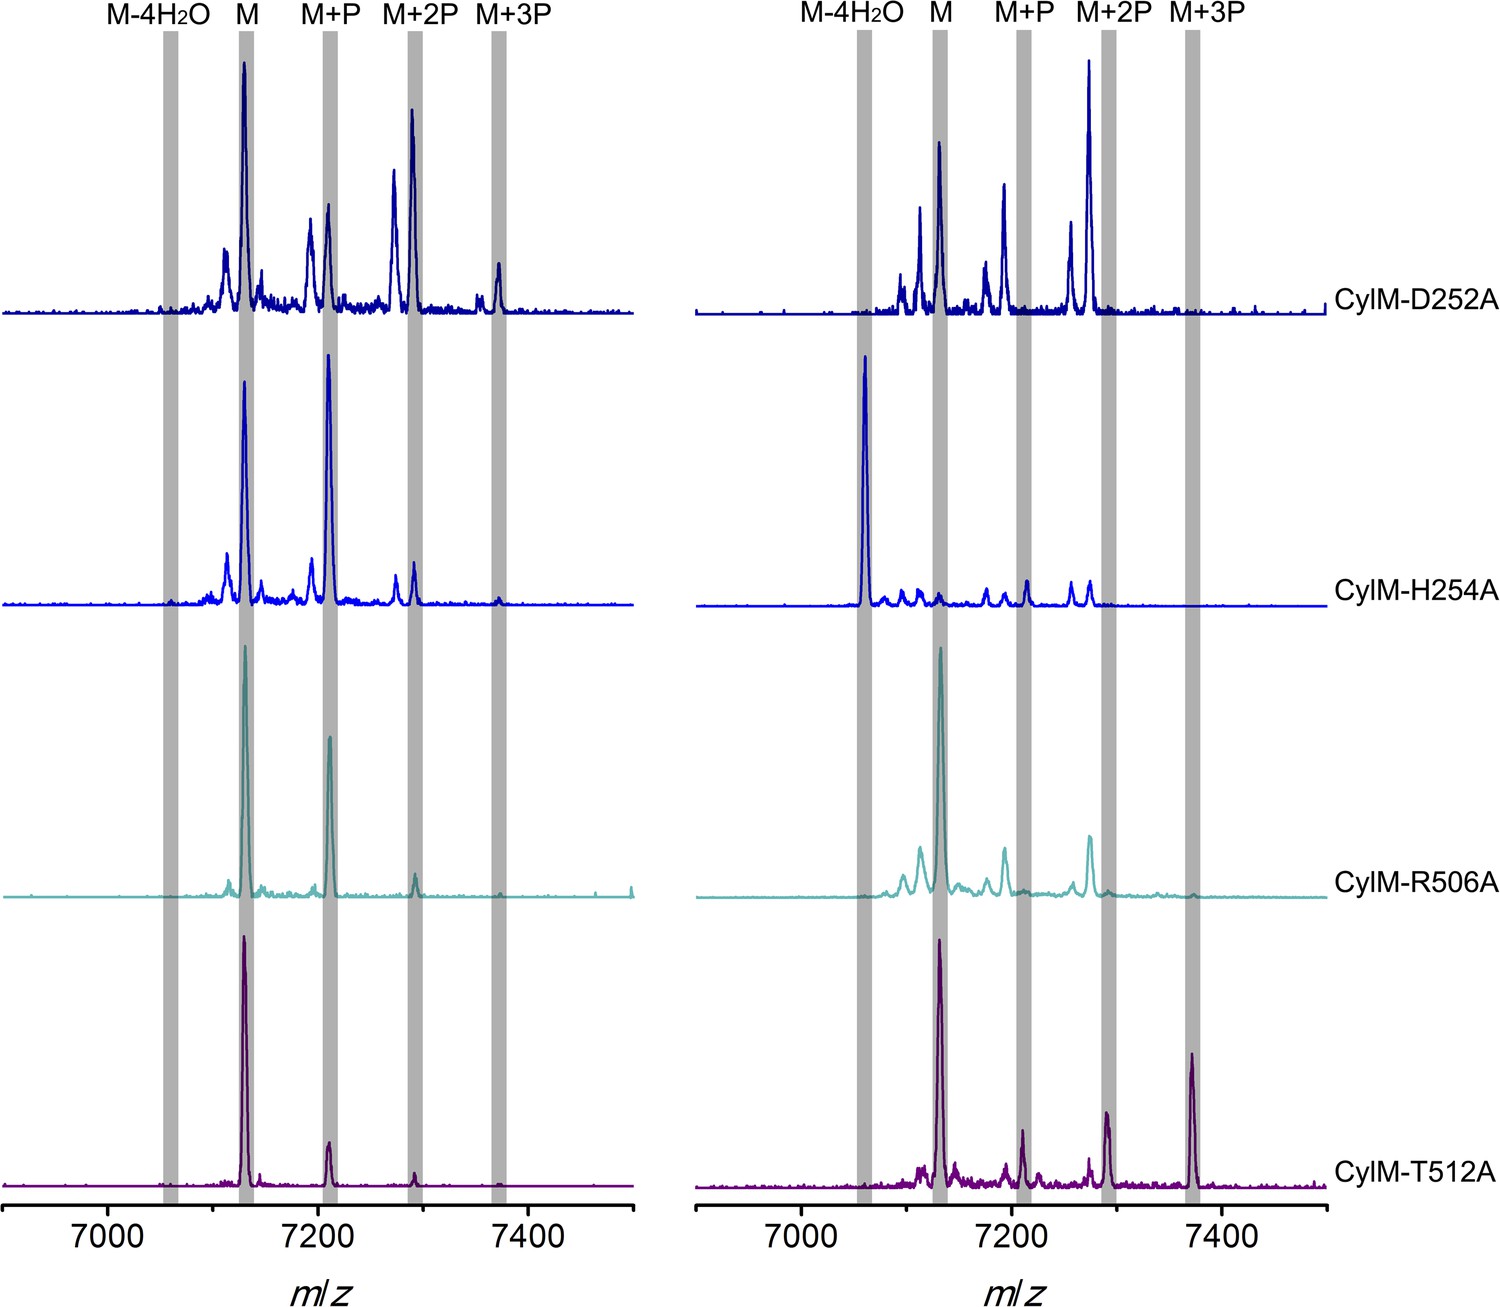
MALDI-TOF mass spectra of CylLS peptides incubated with CylM elimination-deficient mutants in vitro for 30 min (left) and 10 hr (right).
M = unmodified CylLs; P = phosphorylation. Peaks between the highlighted masses of multiply phosphorylated CylLS correspond to intermediates resulting from both phosphorylation and partial dehydration. A table showing the calculated and observed masses of each intermediate is provided in Figure 5—source data 3.
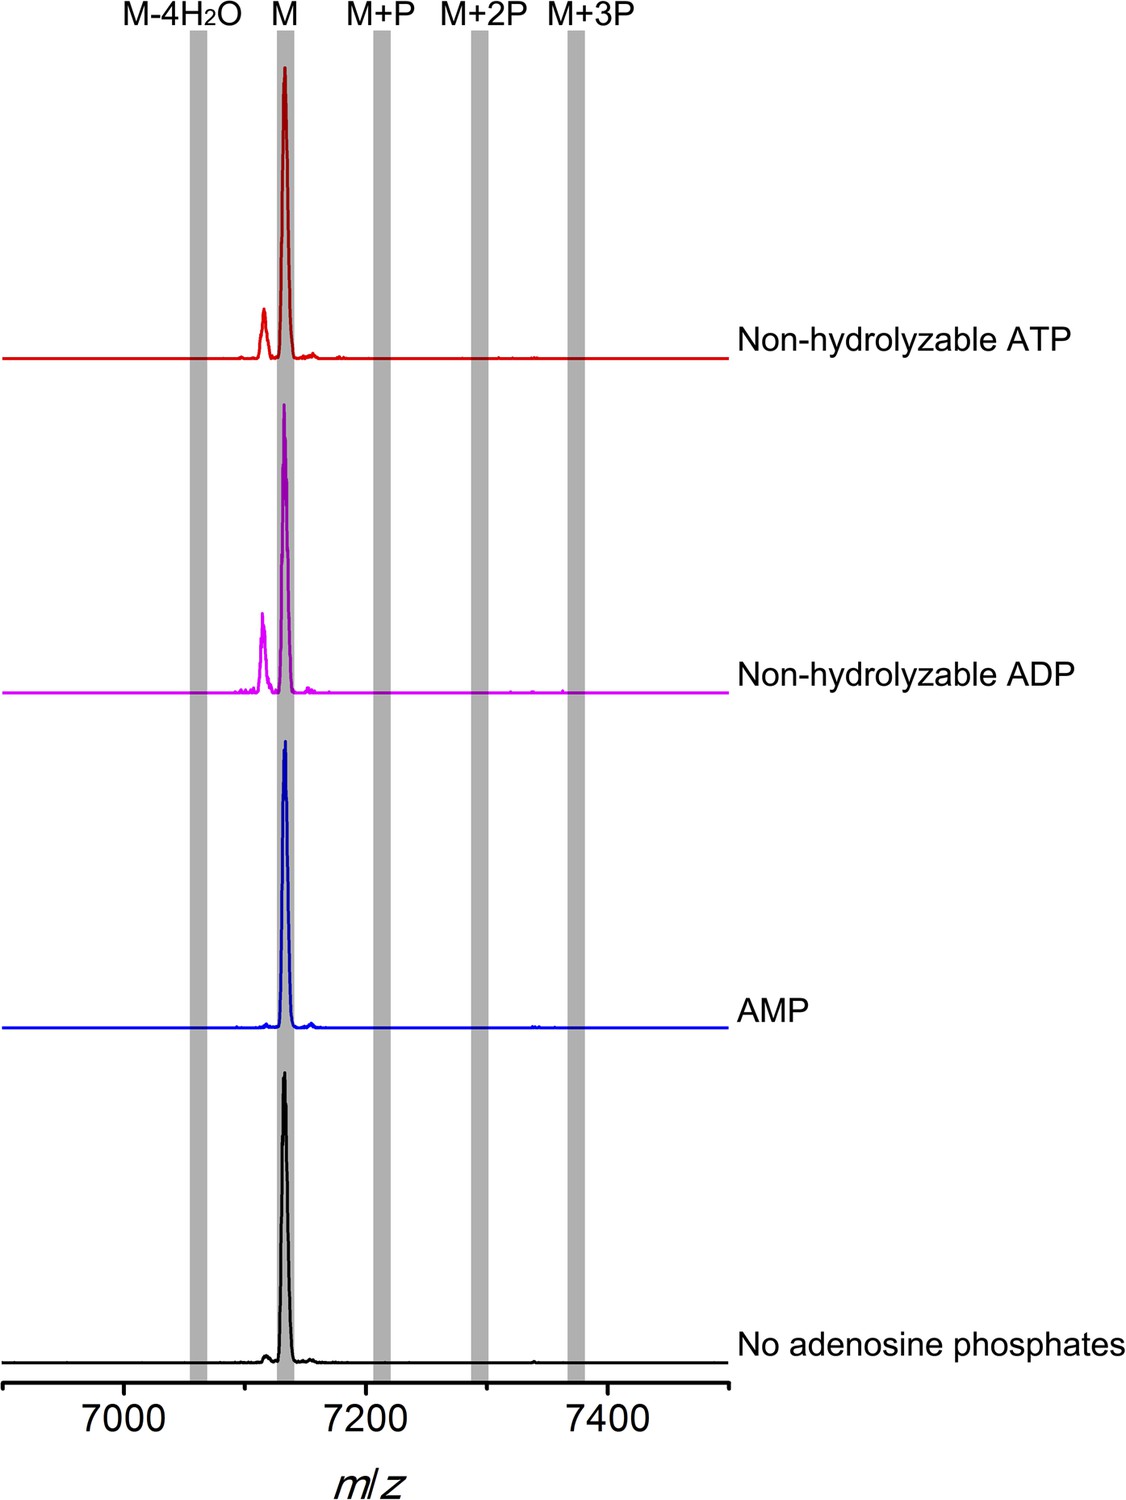
Figure 6 with 2 supplements
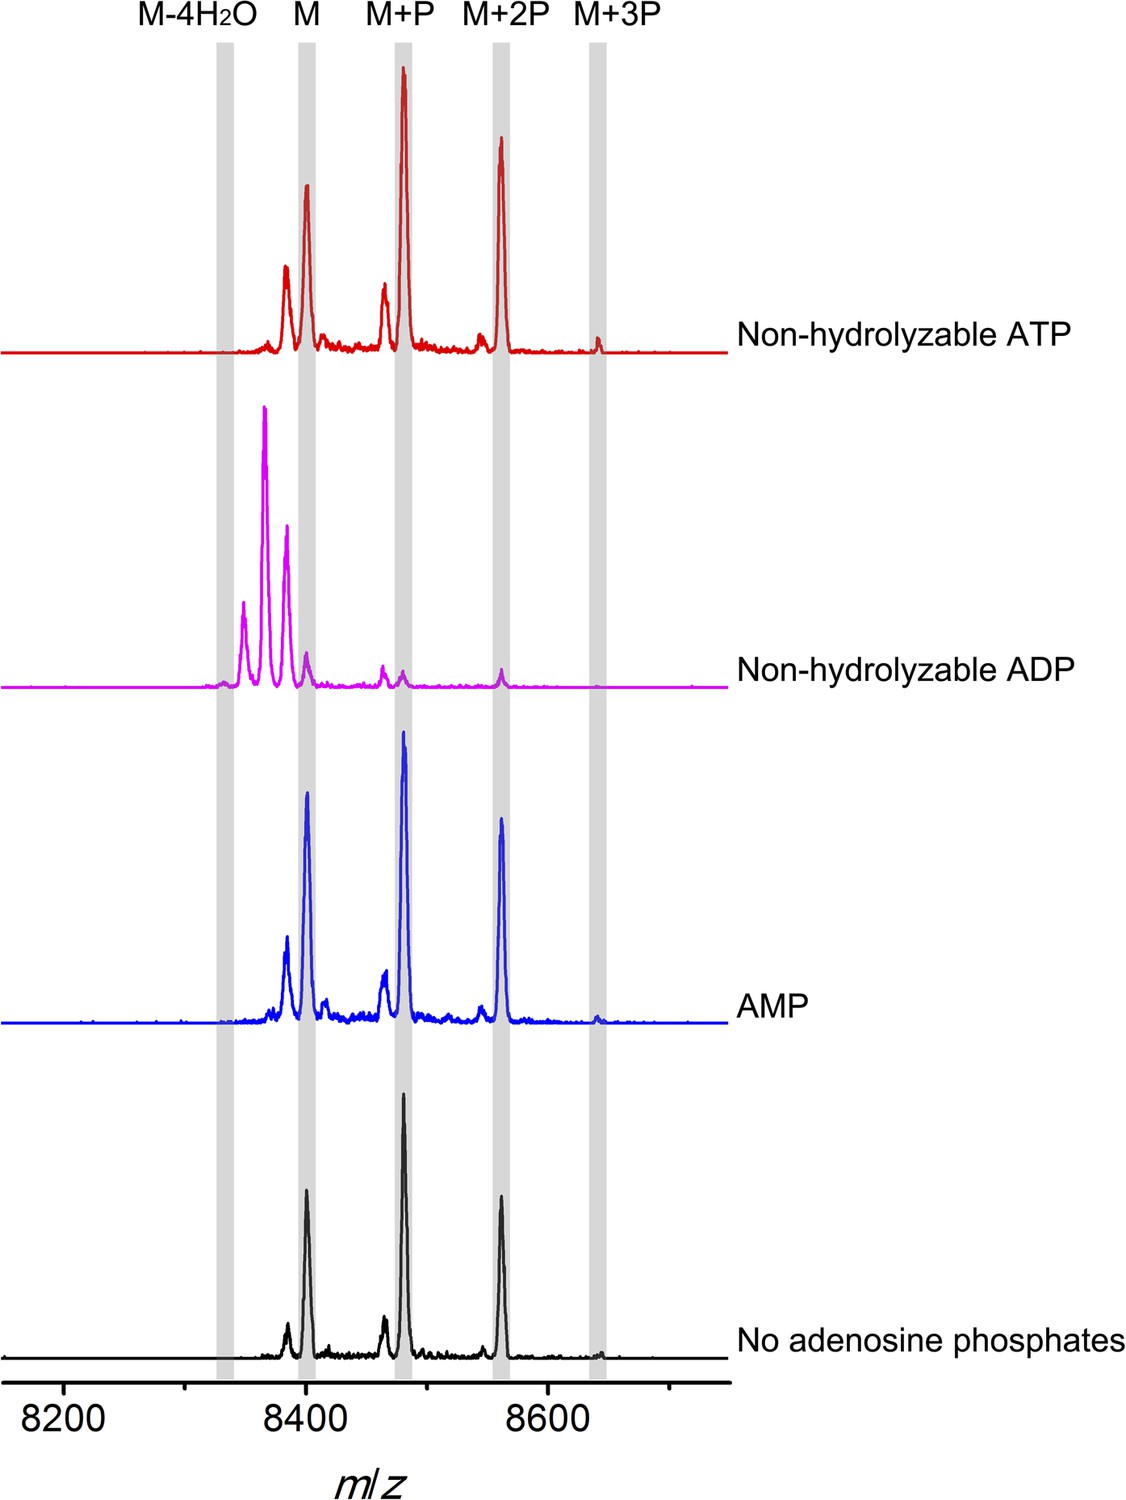
MALDI-TOF mass spectra of phosphorylated CylLS intermediates incubated with CylM in the absence of nucleotides (black trace), and in the presence of AMP (adenosine 5′-monophosphate disodium salt) (blue trace), non-hydrolyzable ADP (adenosine 5′-(β-thio)diphosphate trilithium salt) (magenta trace), or non-hydrolyzable ATP (adenosine 5′-(β,γ-imido)triphosphate lithium salt hydrate) (red trace).
M = unmodified CylLs; P = phosphorylation. The data are shown for non-hydrolyzable analogs of ADP and ATP to distinguish whether the observed activity is due to the presence of these nucleotides, or to the activated phosphor-anhydride groups of ADP/ATP (see ‘Materials and methods’ for more information). See also Figure 6—figure supplement 1.
Figure 6—figure supplement 1
MALDI-TOF mass spectra of CylLS peptides incubated with CylM in the absence of nucleotides (black trace), and in the presence of AMP (adenosine 5′-monophosphate disodium salt) (blue trace), non-hydrolyzable ADP (adenosine 5′-(β-thio)diphosphate trilithium salt) (magenta trace), or non-hydrolyzable ATP (adenosine 5′-(β,γ-imido)triphosphate lithium salt hydrate) (red trace).
M = unmodified CylLs; P = phosphorylation.
Figure 6—figure supplement 2
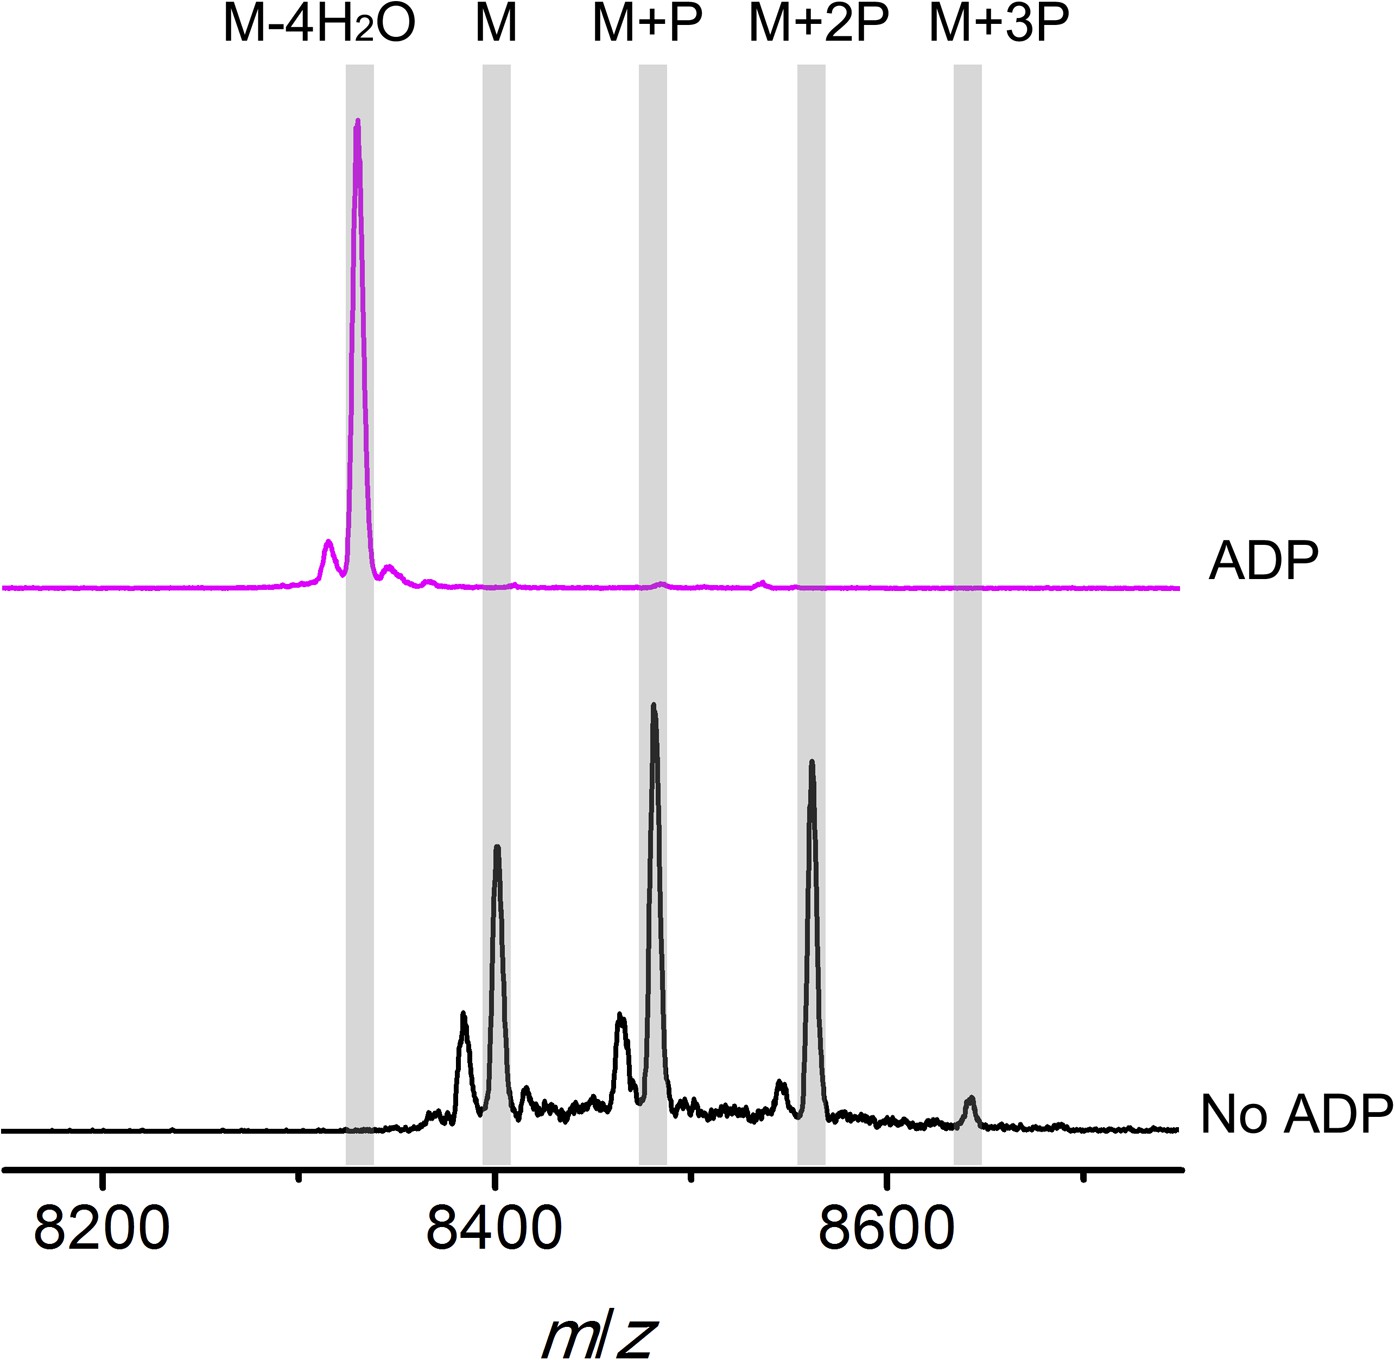
MALDI-TOF mass spectra of phosphorylated CylLS intermediates incubated with CylM in the absence (black trace) or presence of ADP (magenta trace).
M = unmodified CylLs; P = phosphorylation. Not only are the phosphates eliminated from pSer/pThr, ADP also is used to dehydrate non-phosphorylated Ser/Thr to afford fully, fourfold dehydrated peptide. See ‘Materials and methods’ for further discussion.
Tables
Table 1
Primer sequences used for cloning of cylM and its mutants
| Primer name | Primer sequence (5′-3′) |
|---|---|
| CylM_EcoRI_Duet_FP | AAAAA GAATTCG GAAGATA ATCTGATTAA T |
| CylM_NotI_Duet_RP | AAAAA GCGGCCGC TTACAGT TCAAACAGCA G |
| CylM_D252A_QC_FP | AGGGT GCA AGCCAT AGCCGTGGTAAAACCGTT AGC |
| CylM_D252A_QC_RP | ATGGCT TGC ACCCT GGC TTTCGCTAAT GCTATTCAGT |
| CylM_H254A_QC_FP | GATAGC GCT AGCCGT GGT AAAACCGTT AGCACCCTG |
| CylM_H254A_QC_RP | ACGGCT AGC GCTA TC ACCCTGGC TTTCGCTAAT G |
| CylM_D347A_QC_FP | GTTACC GCT CTGCAT TATGAAAACATCATTGCCCATGGC |
| CylM_D347A_QC_RP | AT GCAG AGC GGT AAC ATTAAAC AGAAAGGCAA TGCCAATCAG |
| CylM_H349A_QC_FP | CCGATCTG GCT TATGAAAA CATCATTGCCCATGGCGAATA |
| CylM_H349A_QC_RP | TTTTCATA AGC CAGATCGG T AACATTAAAC AGAAAGGCAA TGCCAAT |
| CylM_N352A_QC_FP | CATTATGAA GCC ATCATTGC CCATGGCGAATATCCG GTGATT |
| CylM_N352A_QC_RP | GCAATGAT GGC TTCATAATG CAGATCGGT AACATTAAAC AGAAAGGC |
| CylM_D364A_QC_FP | GTGATTATT GCT AATGAAACC TTTTTTCAGCAGAATATTCCGATTGAATTT |
| CylM_D364A_QC_RP | GGTTTC ATT AGC AATA ATCAC CGGAT ATTCGCCATG GGC |
| CylM_R506A_QC_FP | TGATTGTG GCC AATGTTAT TCGTCCGACCCAGCGTTA |
| CylM_R506A_QC_RP | A TAACATT GGC CACAATCA GA TTCTGCAGAT TATTATTAAT ATAGGCCAGA |
| CylM_T512A_QC_FP | GTCCG GCC CAG C GTTATGCAGATATGCTGGAA TTTAGC |
| CylM_T512A_QC_RP | CTG GGCCGGAC GAA TAACATTGCG CACAATCAGA |
| CylM_NdeI_FP | AAAAA CATATG GAAGATA ATCTGATTAA T |
| CylM625_KpnI_RP | AAAAA GGTACC TTA GTACGGGTTA TAAATATTCA G |
Table 2
Data collection, phasing, and refinement statistics
| Native | SeMet | |
|---|---|---|
| Data collection | ||
| Space group | P212121 | P212121 |
| Unit cell: a, b, c (Å) | 51.2, 90.7, 246.4 | 51.2, 90.9, 246.2 |
| Resolution (Å)* | 50.00–2.2 (2.24–2.2) | 50.00–2.8 (2.85– 2.8) |
| Total reflections | 359,303 | 169,660 |
| Unique reflections | 58,180 | 25,354 |
| Rsym (%) | 6.3 (67.0) | 6.1 (53.8) |
| I/σ(I) | 19.1 (1.7) | 16.7 (2.1) |
| Completeness (%) | 97.9 (87.6) | 96.0 (88.4) |
| Redundancy | 6.2 (5.1) | 6.0 (5.9) |
| Refinement | ||
| Resolution (Å) | 25.0–2.2 | |
| No. reflections used | 51,874 | |
| Rwork/Rfree‡ | 23.7/26.8 | |
| Number of atoms | ||
| Protein | 7251 | |
| Solvent | 160 | |
| Metal/Nucleotide | 1/23 | |
| B-factors | ||
| Protein | 52.9 | |
| Solvent | 32.4 | |
| Metal/Nucleotide | 54.1/62.3 | |
| R.m.s deviations | ||
| Bond lengths (Å) | 0.011 | |
| Bond angles (°) | 1.54 | |
-
*
Highest resolution shell is shown in parenthesis.
-
‡
R-factor = Σ(|Fobs| − k|Fcalc|)/Σ |Fobs|and R-free is the R value for a test set of reflections consisting of a random 5% of the diffraction data not used in refinement.
Download links
A two-part list of links to download the article, or parts of the article, in various formats.
Downloads (link to download the article as PDF)
Open citations (links to open the citations from this article in various online reference manager services)
Cite this article (links to download the citations from this article in formats compatible with various reference manager tools)
The enterococcal cytolysin synthetase has an unanticipated lipid kinase fold
eLife 4:e07607.
https://doi.org/10.7554/eLife.07607


