An open-source computational and data resource to analyze digital maps of immunopeptidomes
- ETH Zürich, Switzerland
- University of Tübingen, Germany
- German Cancer Consortium, Germany
- University of Oxford, United Kingdom
- Spanish National Biotechnology Centre, Spain
- Monash University, Australia
- La Jolla Institute for Allergy and Immunology, United States
- University Medical Center of the Johannes Gutenberg University Mainz, Germany
- Pacific Northwest National Laboratory, United States
- Hong Kong University of Science and Technology, China
- Institute for Systems Biology, United States
- University of Zurich, Switzerland
Figures
Figure 1 with 3 supplements
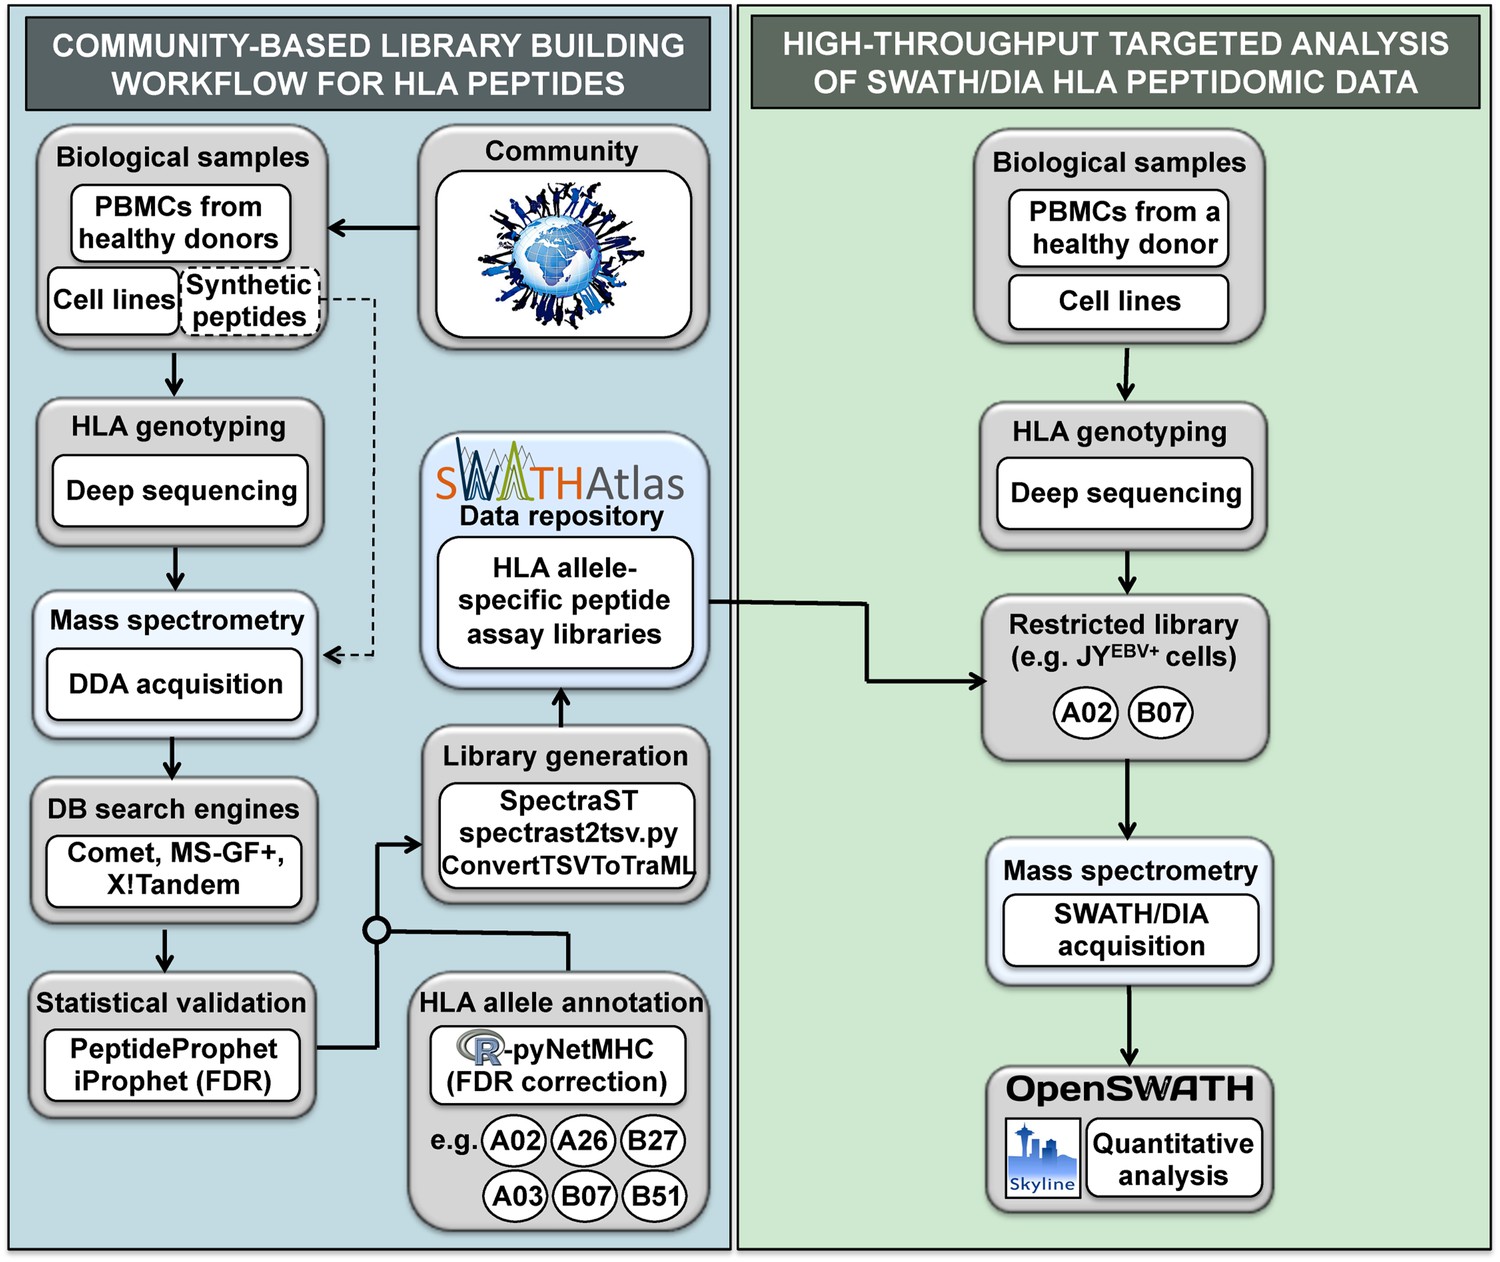
General workflow for building HLA allele-specific peptide assay libraries and for analyzing SWATH-MS HLA peptidomic data.
(Left panel) A community-based repository of HLA class I allele-specific peptide spectral and assay libraries was created and stored in the SWATHAtlas database. HLA typed-biological samples and synthetic HLA peptides were used to build the repository. Our workflow integrates (1) data-dependent acquisition (DDA) of HLA peptidomic data, (2) multiple open-source database search engines and statistical validation tools, (3) HLA allele annotation of the identified peptides, and (4) spectral and assay library generation tools. (Right panel) HLA peptidomic data from HLA-typed biological samples were acquired in data-independent acquisition (DIA) mode. The matching HLA class I allele-specific peptide assay libraries were combined and DIA data were analyzed using the OpenSWATH and the Skyline software.
-
Figure 1—source data 1
Comparative analysis of DDA and SWATH-MS for the identification of HLA class I peptides.
- https://doi.org/10.7554/eLife.07661.004
Figure 1—figure supplement 1
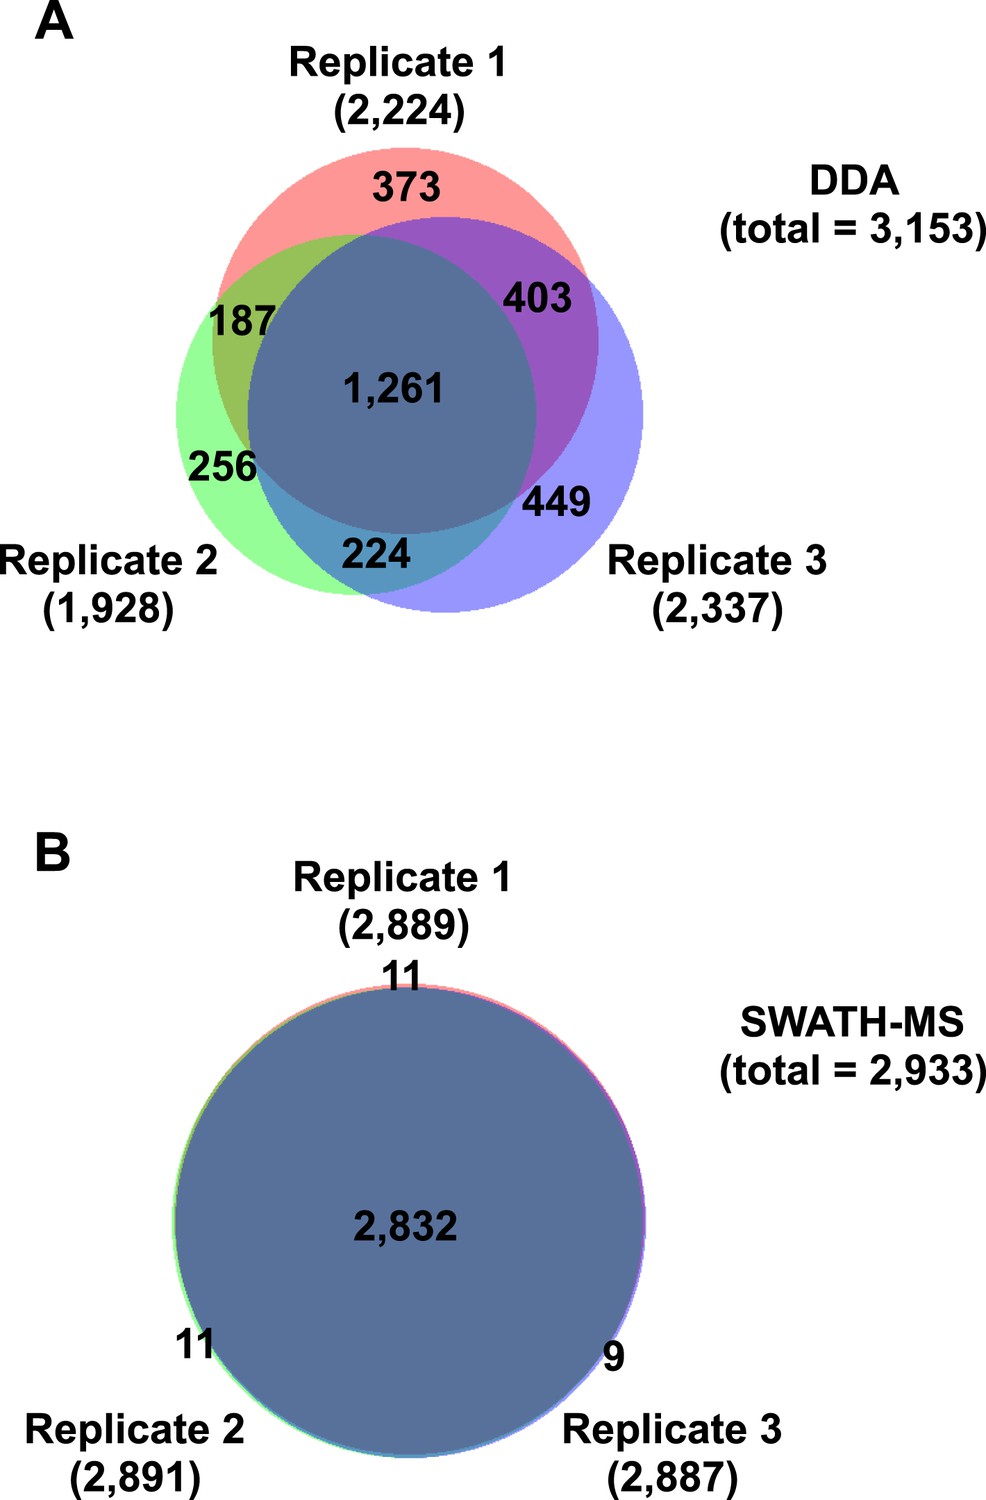
Reproducibility of DDA and SWATH-MS for the identification of HLA class I peptides.
HLA class I peptides were isolated from JYEBV+ cells. Six technical replicates were consecutively injected in a TripleTOF 5600 MS. The Venn diagrams indicate the number of peptides identified in each analysis and the number of peptides shared between the runs. (A) Three datasets were acquired in DDA mode and the peptides were identified using the open source database search engines (1% peptide-level FDR). (B) Three datasets were acquired in SWATH mode and the peptides were identified using OpenSWATH and a combined HLA-A and -B peptide assay library (1% peptide-level FDR).
Figure 1—figure supplement 2
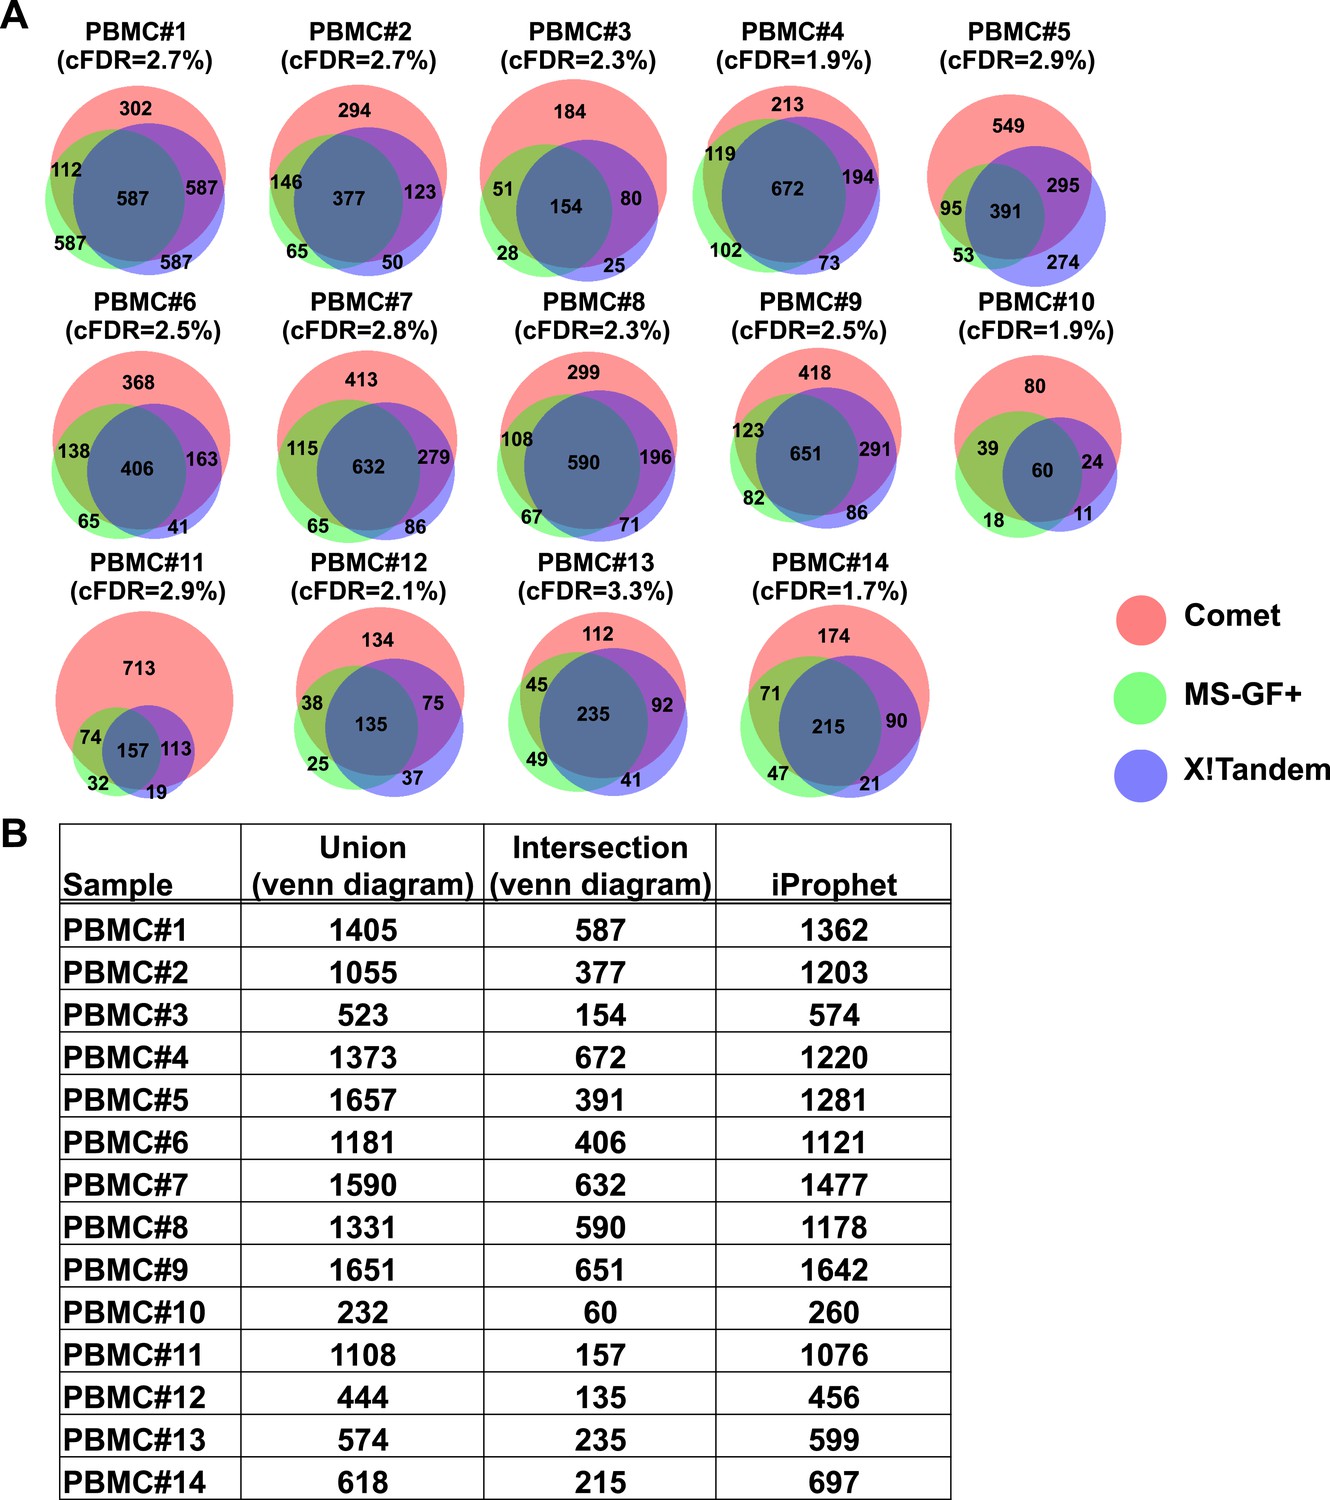
Combining results of three open-source database search engines in immunopeptidomics using iProphet.
(A) The HLA peptidome of fourteen PBMC samples were analyzed. Venn diagrams show the search results obtained from three database search engines (i.e., Comet, MS-GF+ and X!Tandem) at 5% peptide-level FDR. The search identifications were combined and statistically scored using PeptideProphet and iProphet within the Trans-Proteomic Pipeline (TPP). Following annotation of all identified peptides to their respective HLA allele, all nonannotated peptides were removed from the iProphet combined search result and a corrected false discovery rate (cFDR) was manually calculated based on the target-decoy approach. cFDR is indicated for each PBMC sample. At peptide-level FDR 1%, the cFDR was estimated on average at 0.5%. At peptide-level FDR 5%, the cFDR was estimated at 2.5%. (B) The table shows the number of HLA class I peptides identified from the iProphet combined search results that were used to build the spectral libraries. The sum of peptides identified by the three search engines (Union) as well as the number of overlapping peptides (Intersection) for each venn diagram/sample is also indicated.
Figure 1—figure supplement 3
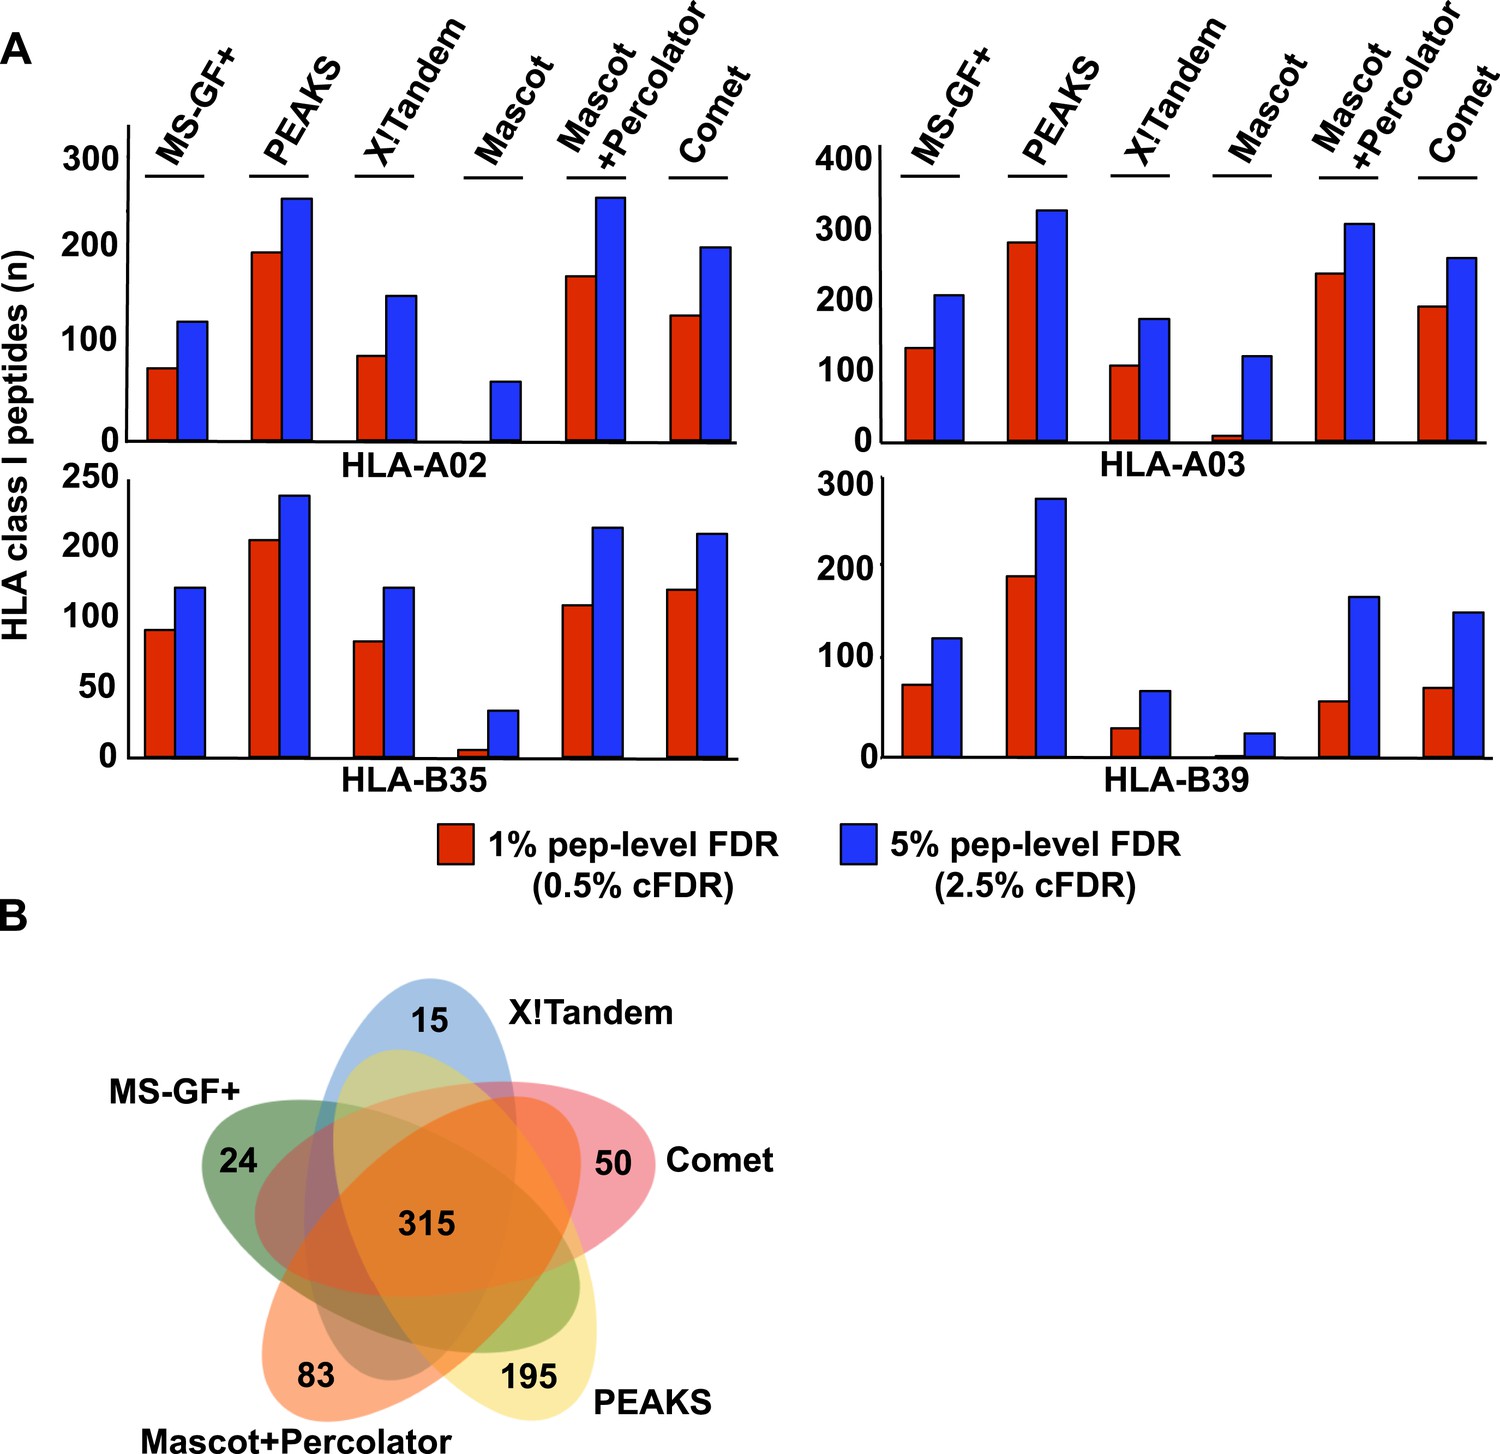
Combining both open-source and commercial database search engines in immunopeptidomics.
Analysis of PBMC#2 is shown here as an example. (A) Comparison of search results obtained from multiple search engines and for different class I HLA alleles at 1% and 5% peptide-level FDR. Performance of two commercial search engines (Mascot+Percolator or Mascot alone, and PEAKS) is also shown here for comparison. (B) Venn diagram showing the performance of the search engines at 5% pep-level FDR (2.5% cFDR).
Figure 2 with 6 supplements
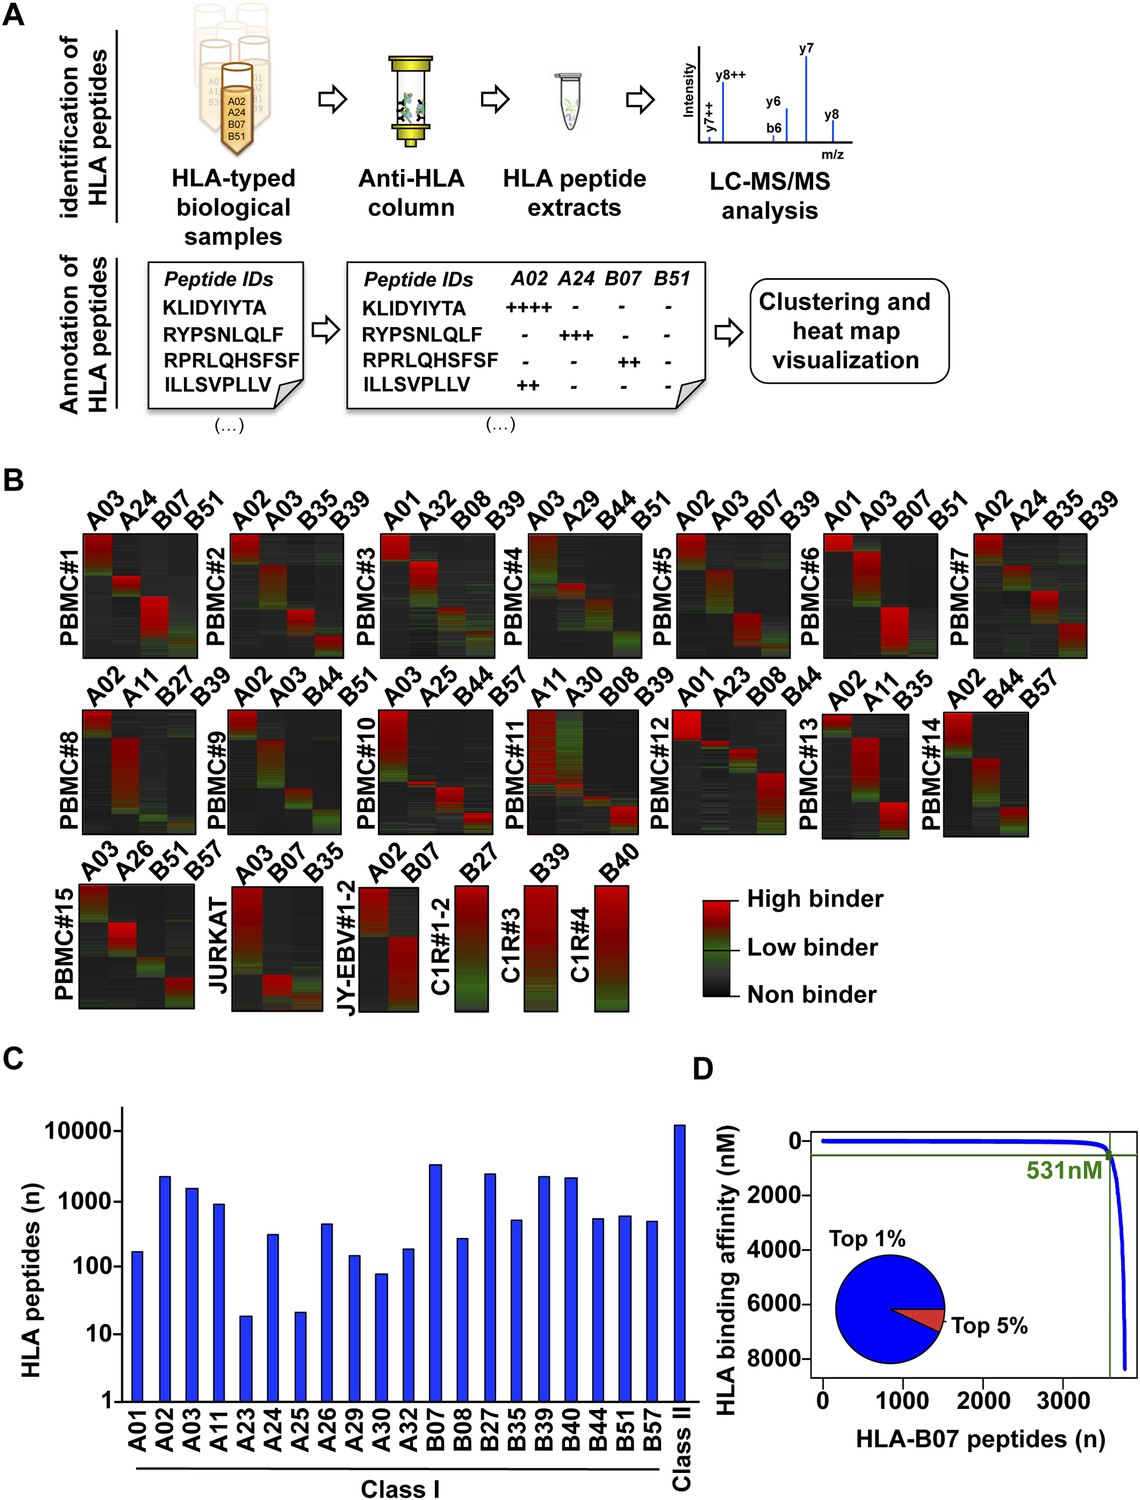
Content and analysis of the pilot repository.
(A) HLA peptides were isolated by immunoaffinity chromatography and were annotated to their respective HLA alleles following DDA mass spectrometry. (B) Heat map visualization of HLA class I peptides identified from 20 HLA-typed biological samples. HLA-A and -B alleles are indicated for each sample. (C) 35,812 distinct class I and class II HLA peptides were identified, annotated, and used to build 32 and 11 HLA allele-specific peptide spectral and SWATH assay libraries, respectively. (D) The distribution curve shows that 95% of the HLA-B07-annotated peptides were predicted to bind the HLA molecule with an IC50 below 531 nM. Inner pie chart: we assessed the predicted HLA binding affinity of all peptides contained in individual source proteins. The pie chart shows that 92% of naturally presented HLA-B07 peptides were ranked in the top 1% (blue) of predicted peptides (see also Figure 2—figure supplement 6).
-
Figure 2—source data 1
Sources of HLA peptides used in this study.
- https://doi.org/10.7554/eLife.07661.009
-
Figure 2—source data 2
Annotation of HLA peptides.
- https://doi.org/10.7554/eLife.07661.010
-
Figure 2—source data 3
List of eluted HLA class I peptides that were identified at 1% and 5% peptide-level FDR.
- https://doi.org/10.7554/eLife.07661.011
-
Figure 2—source data 4
HLA class I allele-specific peptide spectral libraries stored in PeptideAtlas.
- https://doi.org/10.7554/eLife.07661.012
-
Figure 2—source data 5
HLA class I and II allele-specific peptide assay libraries stored in the SWATHAtlas database.
- https://doi.org/10.7554/eLife.07661.013
Figure 2—figure supplement 1

Automated NetMHC-based method for annotating and visualizing HLA allele-specific peptides.
PBMC#2 was typed positive for HLA-A02, -A03, -B35, -B39, and is shown here as a representative sample. (A) The stand-alone software package of the HLA binding prediction algorithm NetMHC 3.4 was used to predict the binding affinity of all identified peptides to HLA-A02, -A03, -B35 and -B39 (four peptides are shown for simplicity). For each peptide, an annotation score was calculated by dividing the second lowest IC50 value (second best predicted allele) by the lowest IC50 value (best predicted allele). Peptides with a score ≥3 were annotated to the HLA allele predicted to bind best. Peptides with a score below 3 were considered as non-annotated. Non-annotated peptides were curated in the output files in Figure 2—source data 2 and correspond to 1) non-HLA peptides/contaminants, 2) peptides predicted to strongly bind more than one HLA allele (supertype peptides), 3) peptides predicted to bind HLA-C alleles, 4) exceptional HLA peptides with no known binding motifs. Annotation scores of all eluted peptides are shown in Figure 2—source data 2. Additional information is provided in Supplementary file 1. (B) Curves showing the distribution of the predicted HLA binding affinities for all HLA-A03-annotated peptides with a score ≥3. Overall, 91% of all HLA-A03-annotated peptides are predicted to have a binding affinity below 500 nM for the HLA-A03 molecule (see also Figure 2—figure supplement 4 and Figure 2—figure supplement 5). The same peptides are predicted to be non-binders for the other alleles – i.e., HLA-A02, -B35 and -B39. (C) Heat map visualization following clustering of predicted HLA binding affinity values. The white box highlights HLA-A03-annotated peptides. The four peptides in the table in (a) are indicated by arrows and their respective predicted binding affinity for the HLA-A03 molecule is indicated in parenthesis.
Figure 2—figure supplement 2
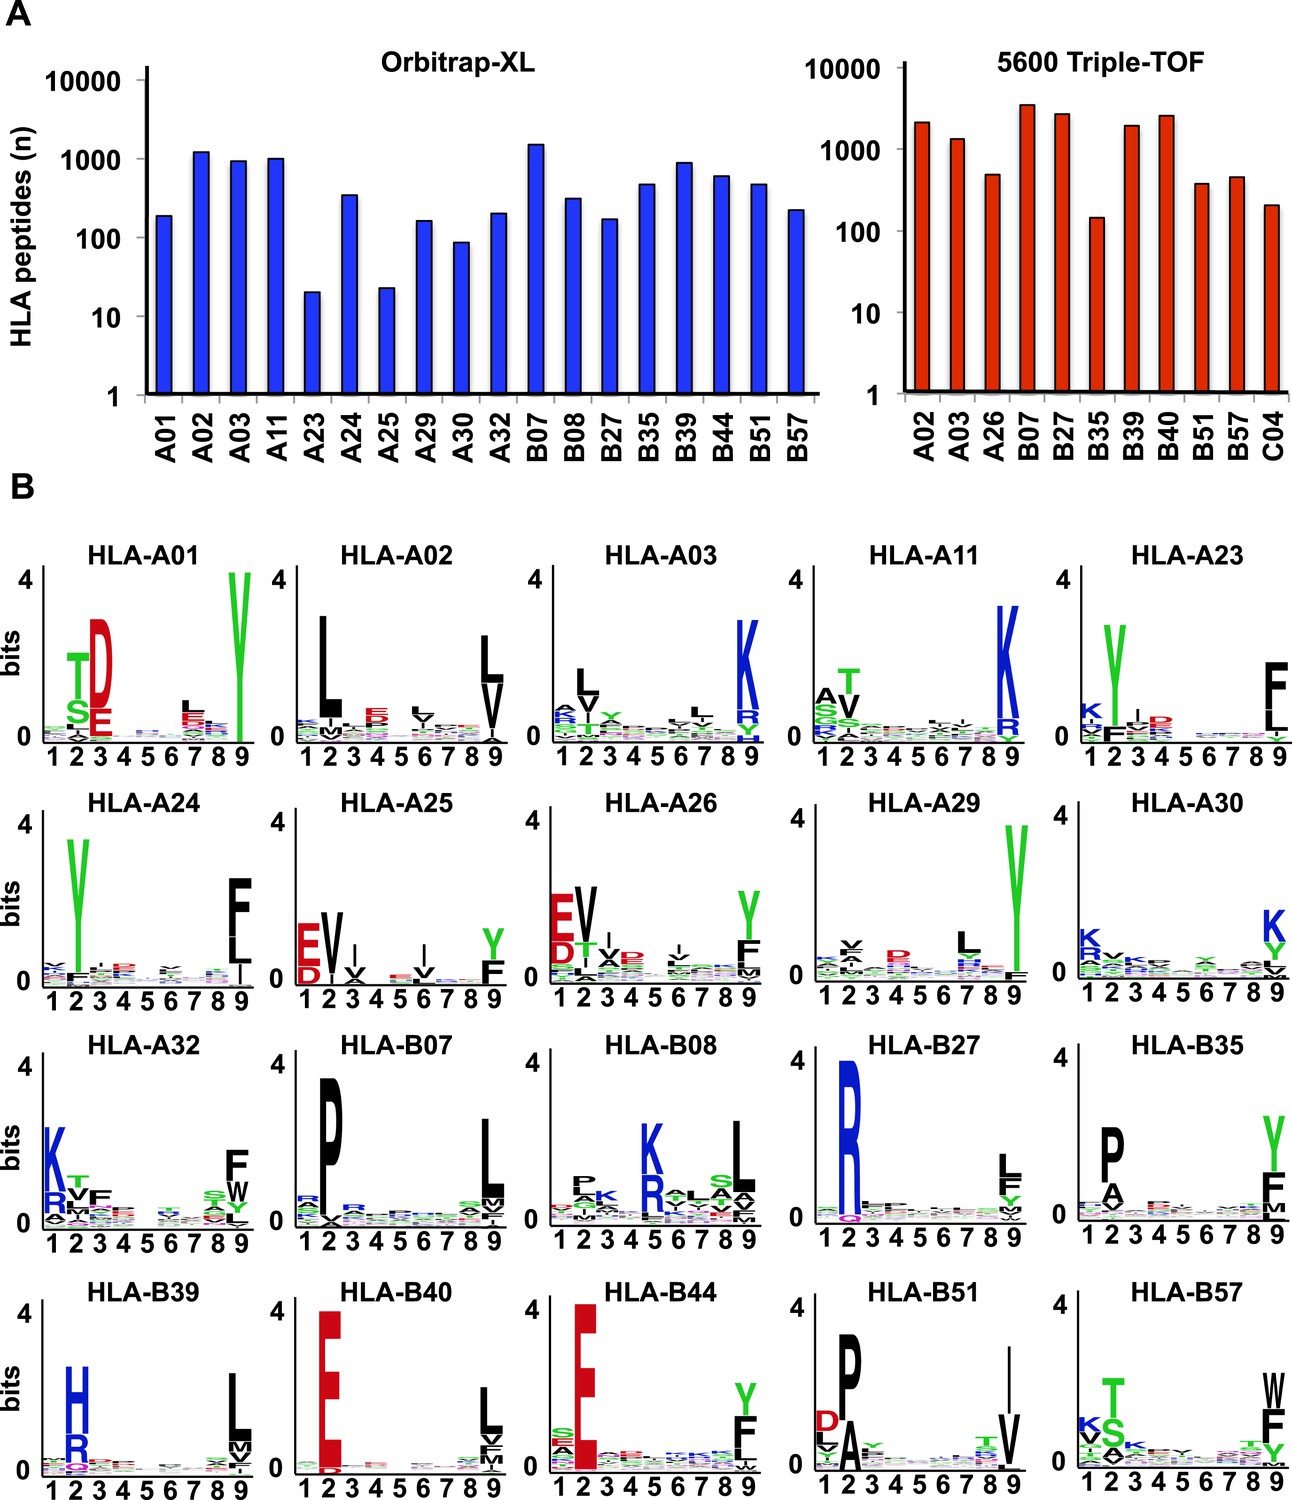
Identification of HLA class I allele-specific peptides by DDA.
(A) Number of distinct HLA class I allele-specific peptides identified using an Orbitrap-XL and a 5600 TripleTOF at peptide-level FDR 5%. (B) Logo showing the profile motif for peptides presented by different HLA-A and -B alleles. Profile motifs were created by using all annotated HLA class I peptides in this study and the sequence logo generator WebLogo.
Figure 2—figure supplement 3
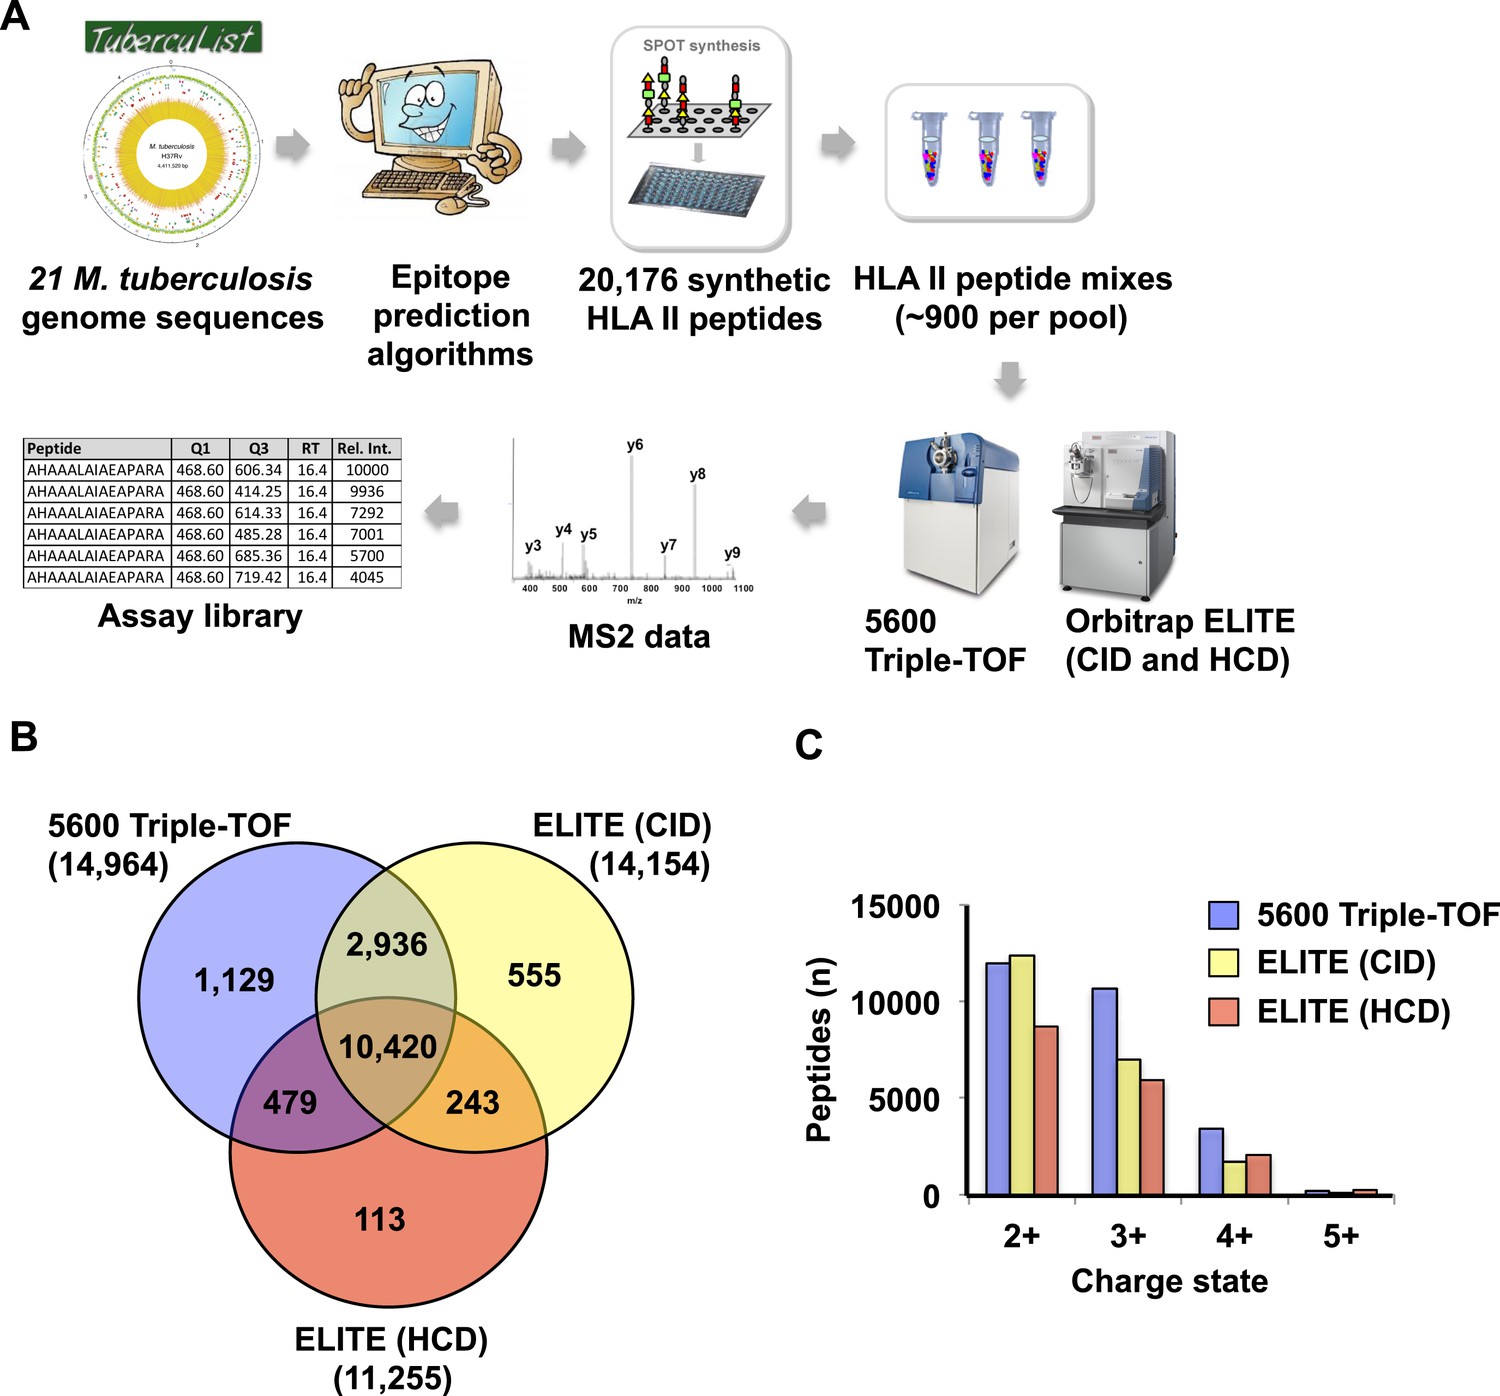
Generation of assay libraries from a large collection of synthetic HLA class II peptides.
(A) Workflow to generate an assay library from synthetic peptides. A total of 20,176 predicted peptides (with a range of 2 to 10 per ORF, and an average of 5), were synthesized and arranged into 23 peptide pools of ~900 peptides (Lindestam Arlehamn et al., PLoS Pathog, 2013). Spiked-in reference iRT peptides were used and the pools of synthetic peptides were analyzed in DDA mode using a 5600 Triple-TOF and an Orbitrap ELITE (CID and HCD fragmentation). The identified peptides were then processed through our computational pipeline to generate the assay library. (B) Venn diagram showing the overlap between peptides identified by the 5600 Triple-TOF and by the ELITE (CID and HCD fragmentation methods). Number of peptides identified is indicated in parenthesis. (C) Histogram showing the distribution of the precursor charge state.
Figure 2—figure supplement 4
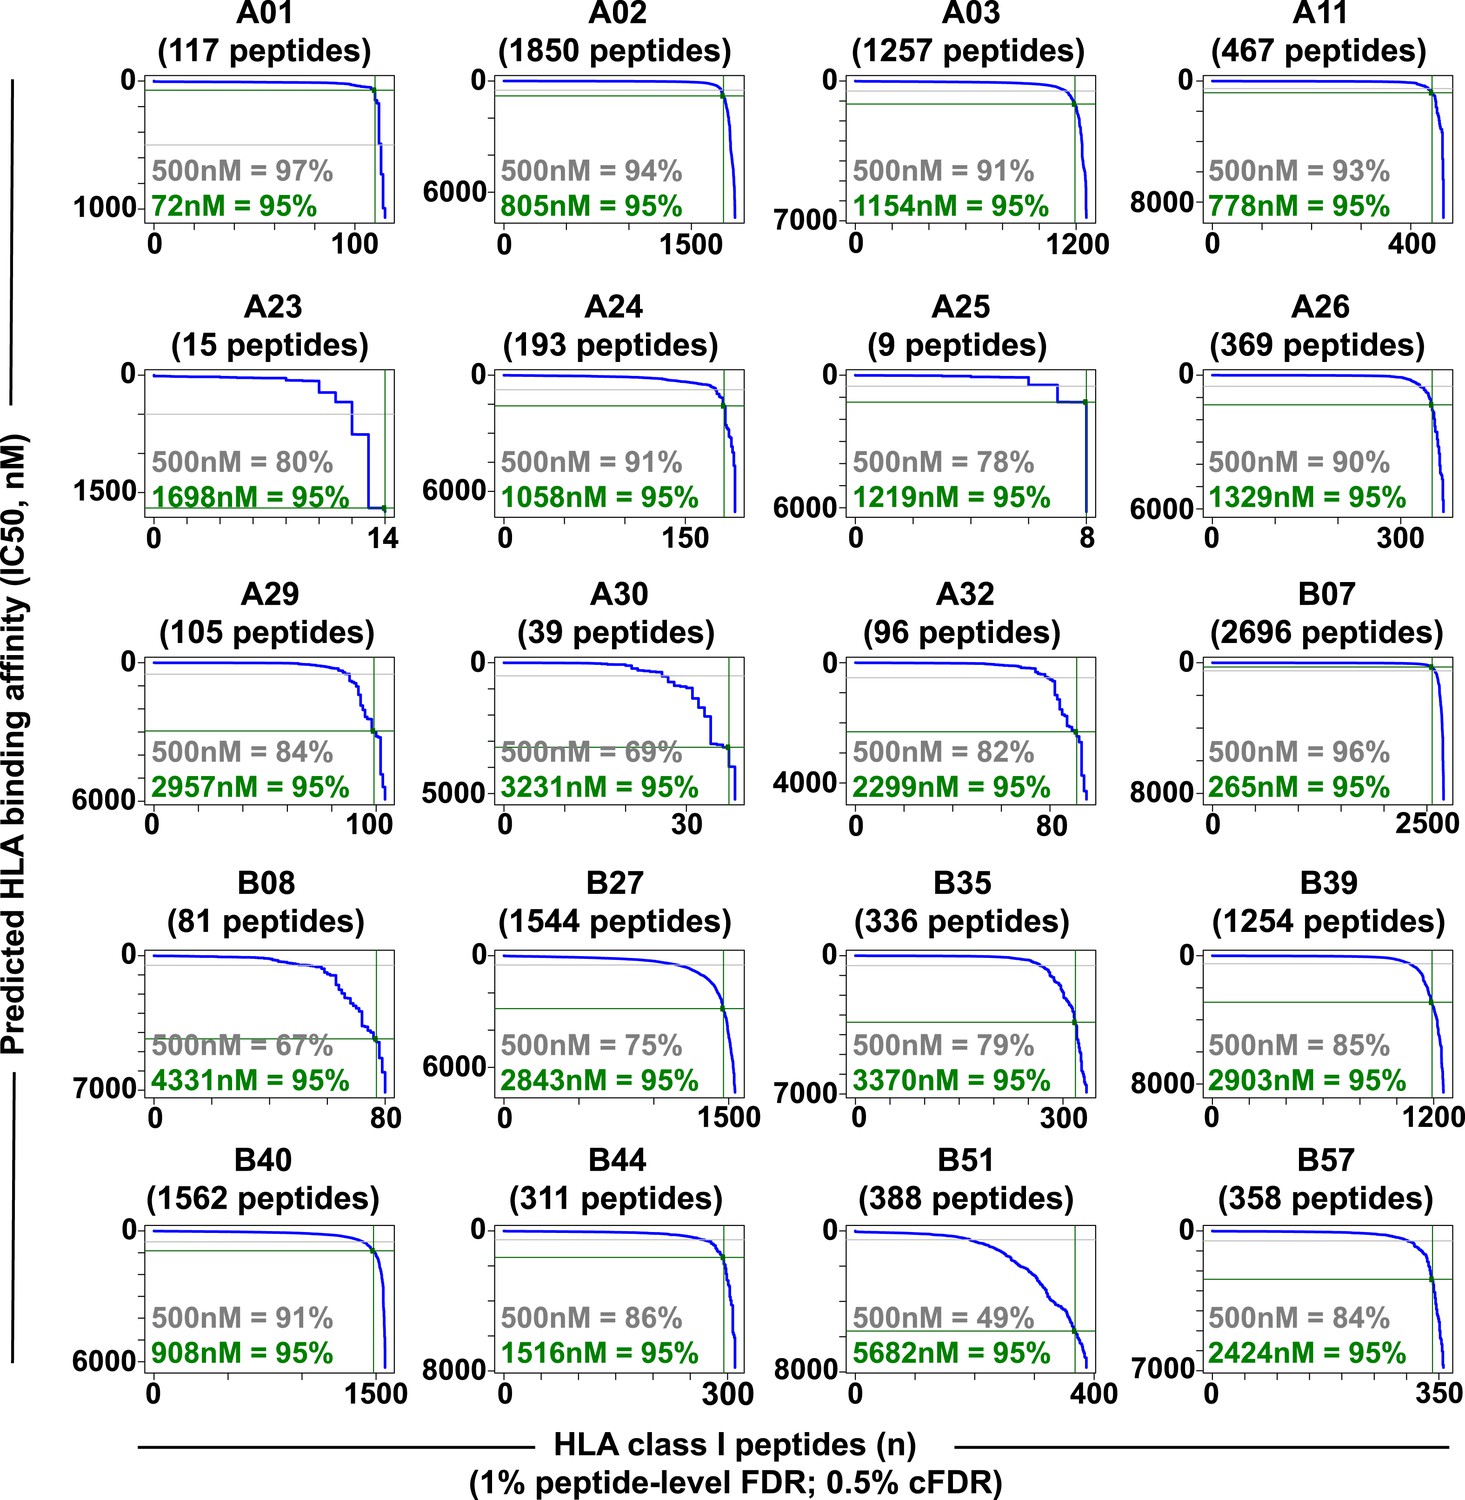
Distribution curves of peptide binding affinities for different HLA-A and -B alleles (1% peptide-level FDR; 0.5% cFDR).
The predicted IC50 values of the annotated peptides in Figure 2—source data 3 were used to generate the distribution curves (blue line). The proportion of peptides with a predicted affinity lower than the established 500nM threshold (grey) is indicated for individual HLA alleles. The plots also indicate that 95% of the annotated peptides (green) are predicted to bind their respective HLA molecules with an IC50 ranging from 72 nM (HLA-A01) to 5682 nM (HLA-B51).
Figure 2—figure supplement 5
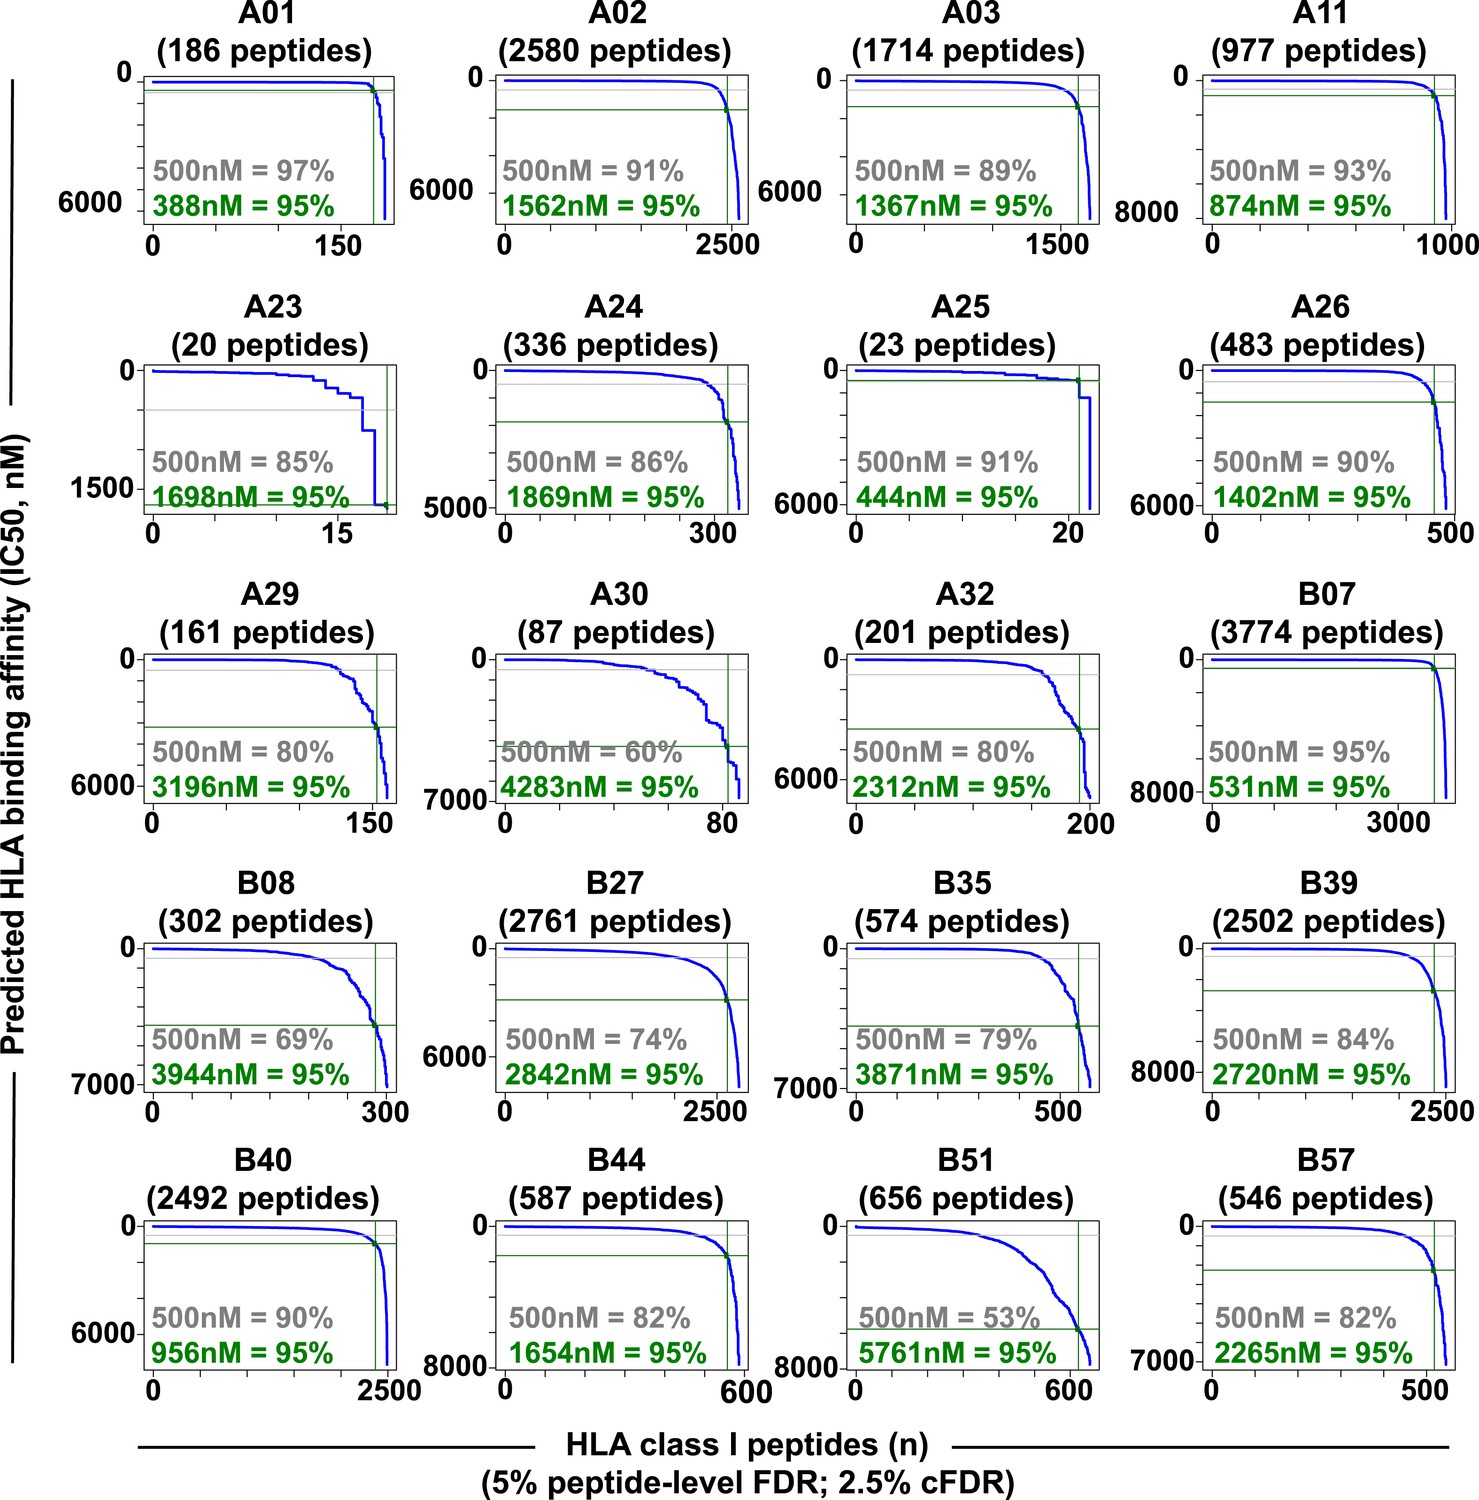
Distribution curves of peptide binding affinities for different HLA-A and -B alleles (5% peptide-level FDR; 2.5% cFDR).
The predicted IC50 values of the annotated peptides in Figure 2—source data 3 were used to generate the distribution curves (blue line). The proportion of peptides with a predicted affinity lower than the established 500nM threshold (grey) is indicated for individual HLA alleles. The plots also indicate that 95% of the annotated peptides (green) are predicted to bind their respective HLA molecules with an IC50 ranging from 388 nM (HLA-A01) to 5761 nM (HLA-B51).
Figure 2—figure supplement 6
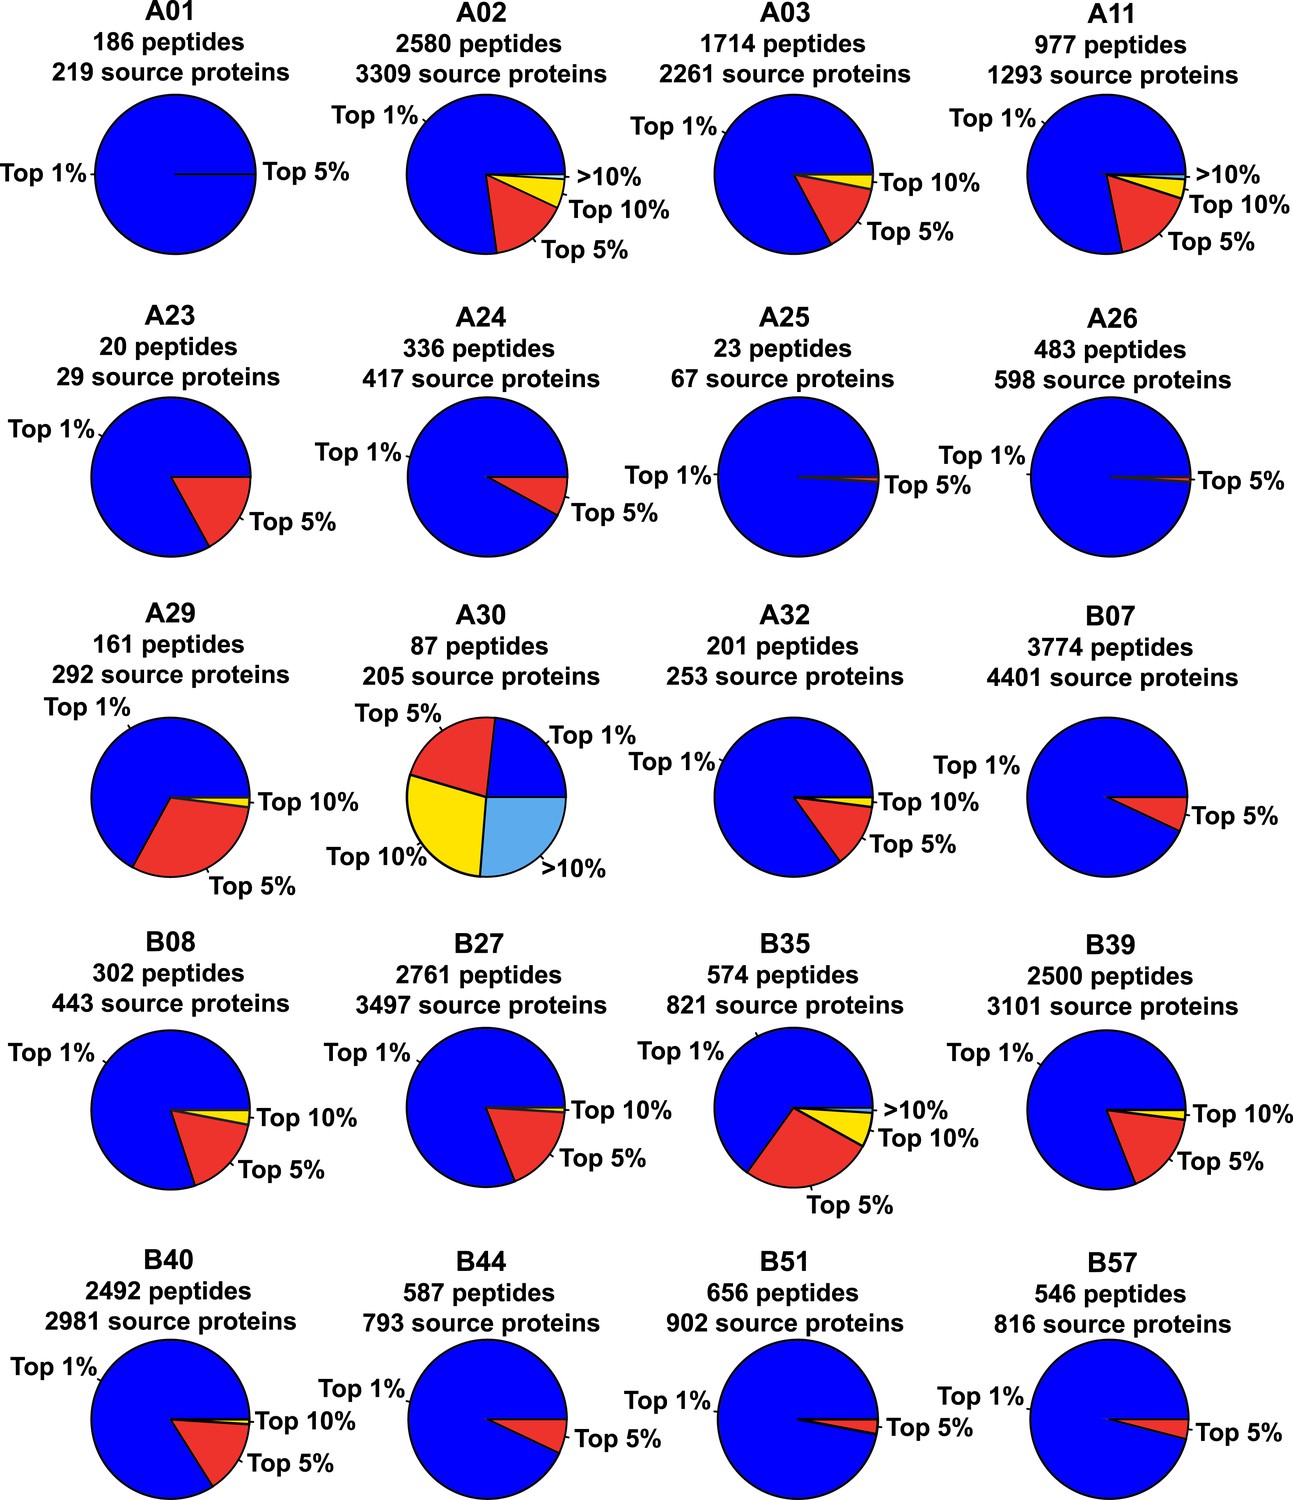
Binding scores of naturally presented HLA-A and -B peptides contained in individual source proteins.
We assessed the predicted HLA binding affinity of all peptides contained in individual source proteins. The pie chart shows the proportion of naturally presented peptides isolated by immunoaffinity chromatography that ranked in the top 1% (blue), top 5% (red), top 10% (yellow), or below the 90th percentile of peptides (pale blue).
Figure 3 with 7 supplements
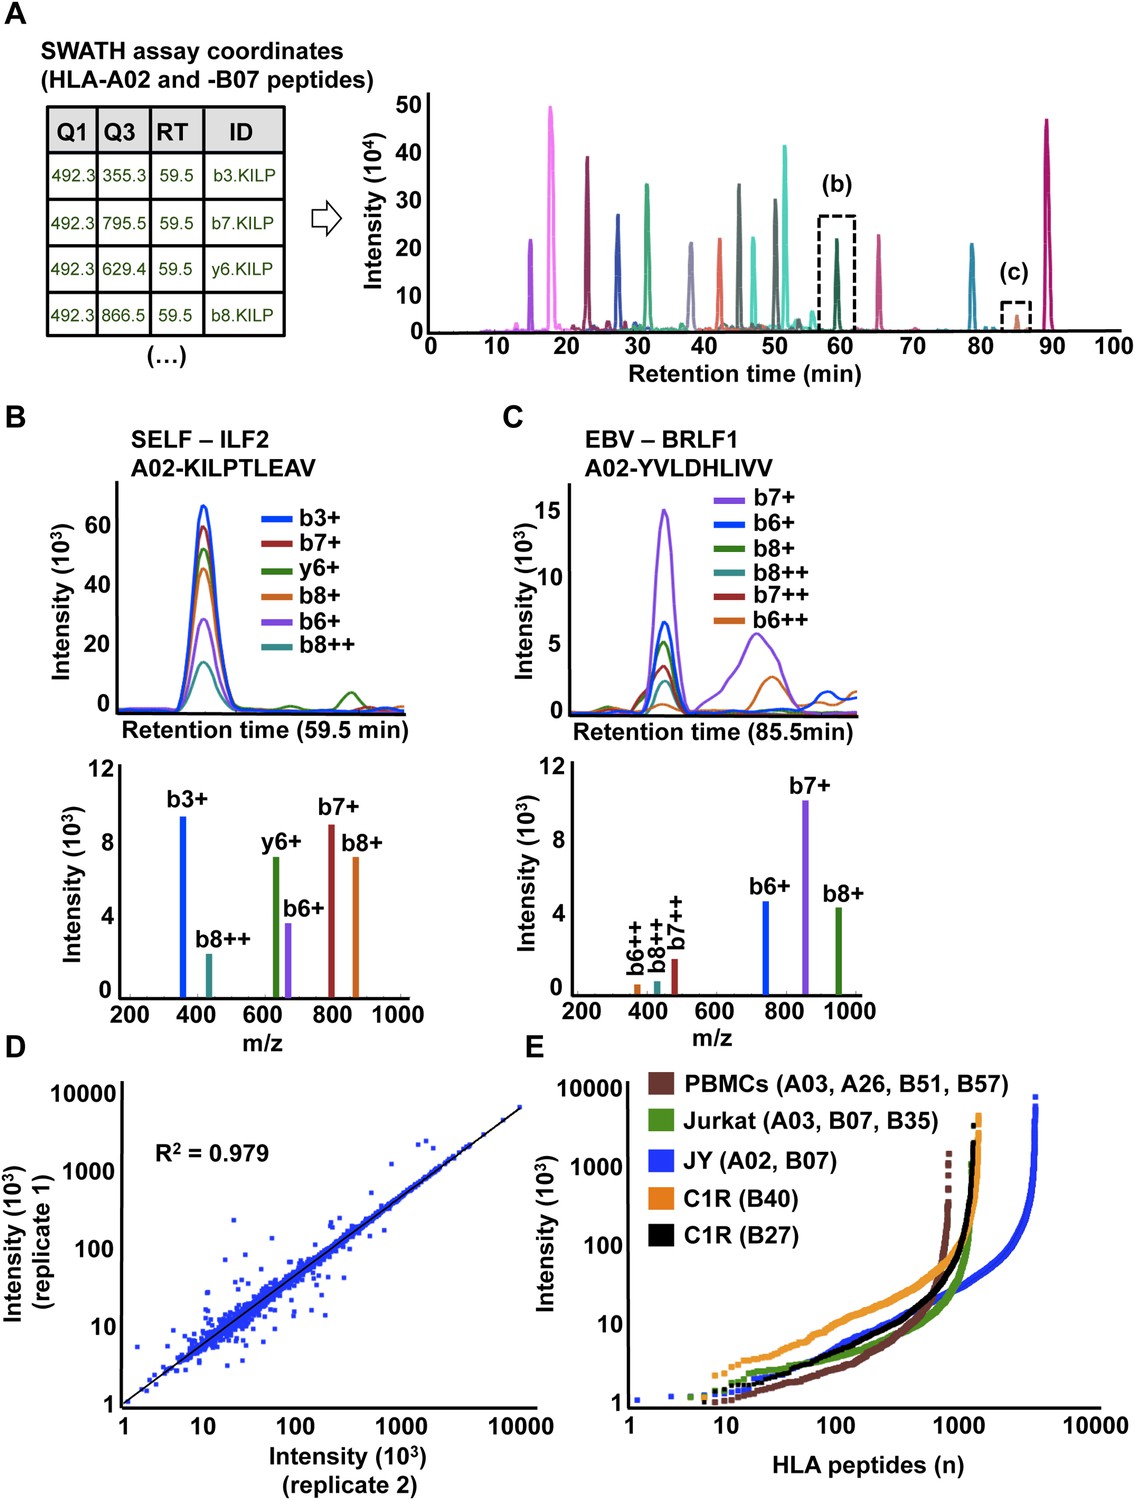
High-throughput targeted analysis of HLA peptidomic data by SWATH-MS.
(A) SWATH-MS coordinates of two HLA class I allele-specific assay libraries (HLA-A02 and -B07) were combined to extract SWATH data generated from the HLA peptidome of JYEBV+ cells. Sixteen summed transition groups are shown here for simplicity. (B, C) Visualization of two extracted SWATH transition groups corresponding to the self-HLA-A02 peptide, KILPTLEAV and the non-self HLA-A02 EBV peptide, YVLDHLIVV. (D) Reproducibility of intensity measurements for technical replicates. (E) Dynamic range of transition group intensities following targeted analysis of SWATH-MS HLA peptidomic data generated from various cell types expressing different combinations of HLA alleles. SWATH/DIA data were acquired in four independent international laboratories.
-
Figure 3—source data 1
OpenSWATH analysis.
- https://doi.org/10.7554/eLife.07661.021
Figure 3—figure supplement 1
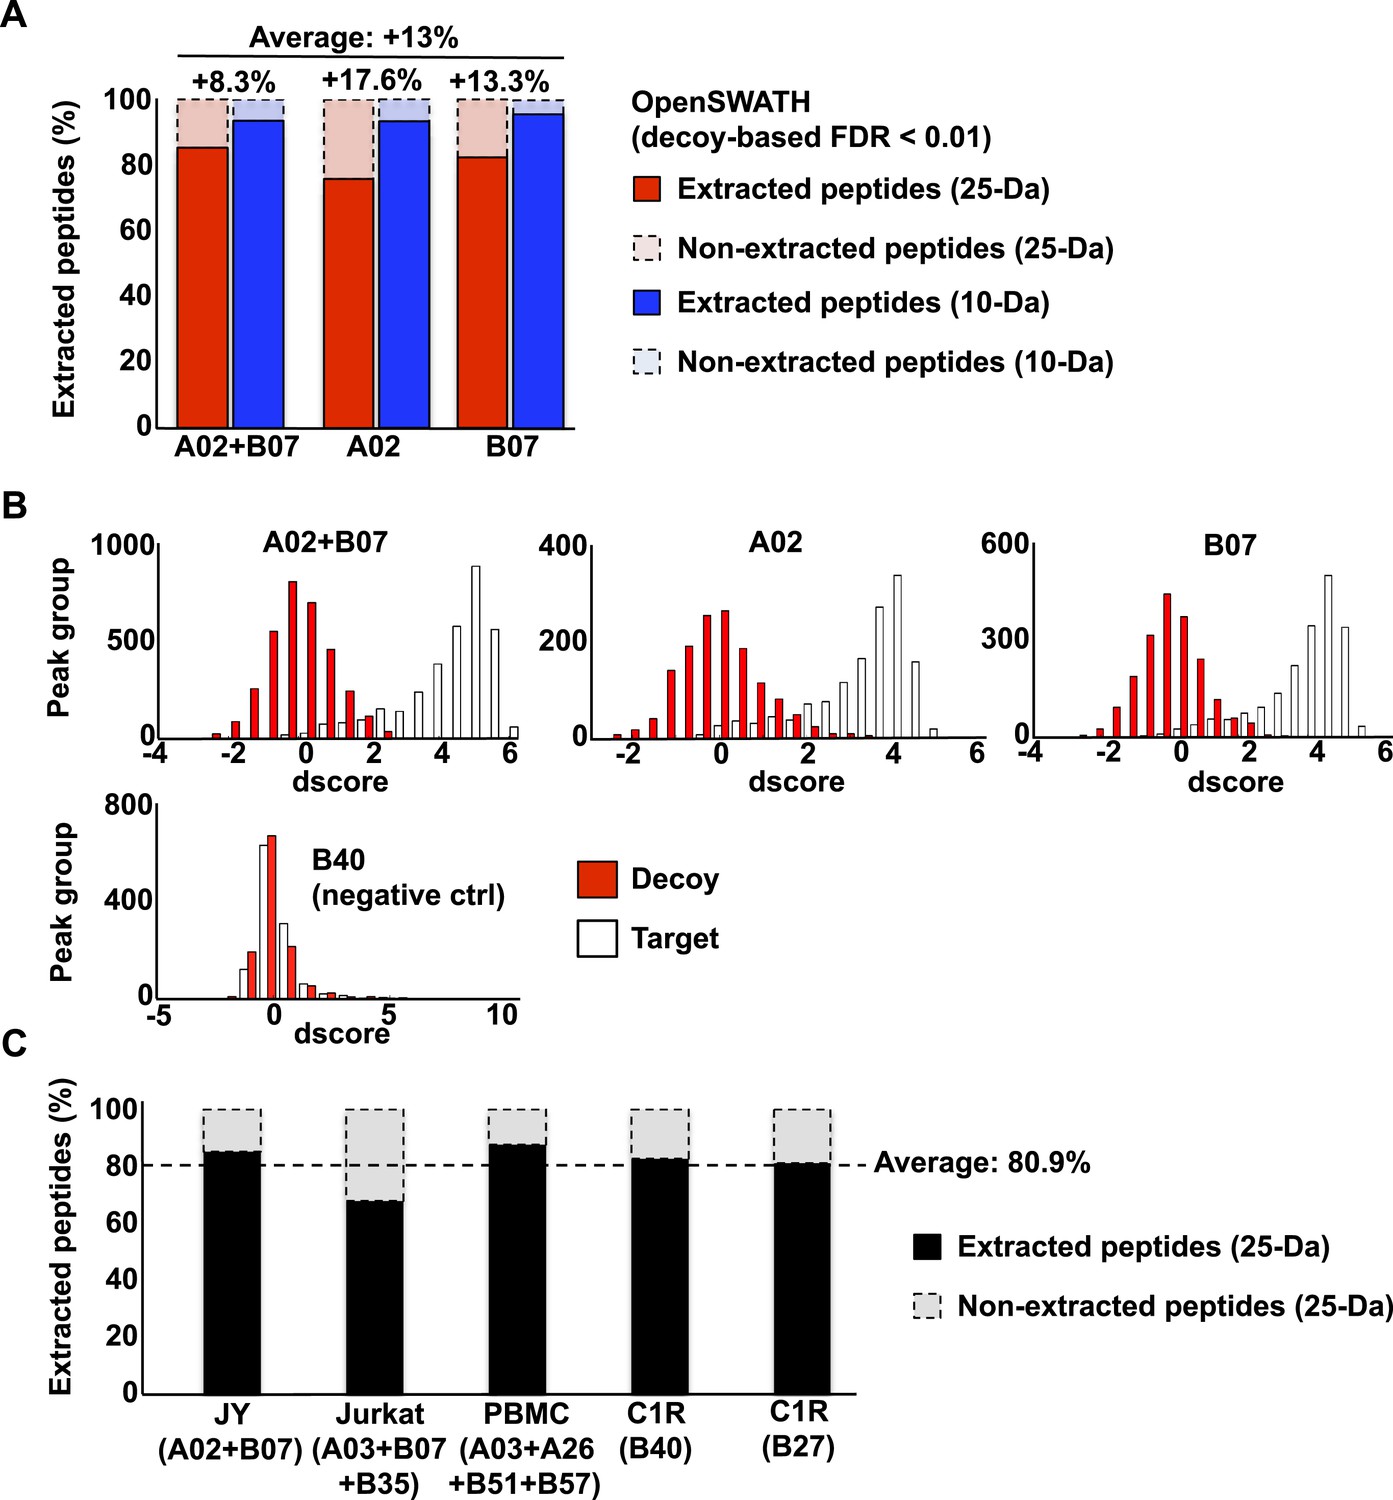
OpenSWATH analysis of HLA peptidomic data.
(A) HLA class I peptides isolated from JY cells were acquired in SWATH/DIA mode using windows of 10 Da (blue) or 25 Da (red) width each. The graph shows the proportion of peptides that were confidently extracted (FDR < 0.01) using OpenSWATH from a merged (A02+B07) or unmerged (A02 or B07) HLA allele-specific assay library. (B) pyProphet statistical analysis from a JY HLA class I peptide extract. The histogram plots show the distribution of decoy and target transition groups according to their discriminant score (dscore) determined by the pyProphet software. (C) HLA class I peptides were isolated form various cell types and analyzed by SWATH-MS using windows of 25 Da width each. The histogram shows the number of HLA peptides that were confidently extracted (FDR < 0.01) using OpenSWATH from different HLA allele-specific assay library.
Figure 3—figure supplement 2

OpenSWATH analysis and PyProphet statistics of HLA peptidomic data acquired at ETH Zurich, Switzerland.
HLA-A02 and HLA-B07 peptides were isolated from JY cells. Graphs showing ROC, d_score performance and d-score distributions were generated automatically using the iPortal workflow.
Figure 3—figure supplement 3
OpenSWATH analysis and PyProphet statistics of HLA peptidomic data acquired at ETH Zurich, Switzerland.
HLA-A03, -A26, -B51 and -B57 peptides were isolated from PBMCs. Graphs showing ROC, d_score performance and d-score distributions were generated automatically using the iPortal workflow.
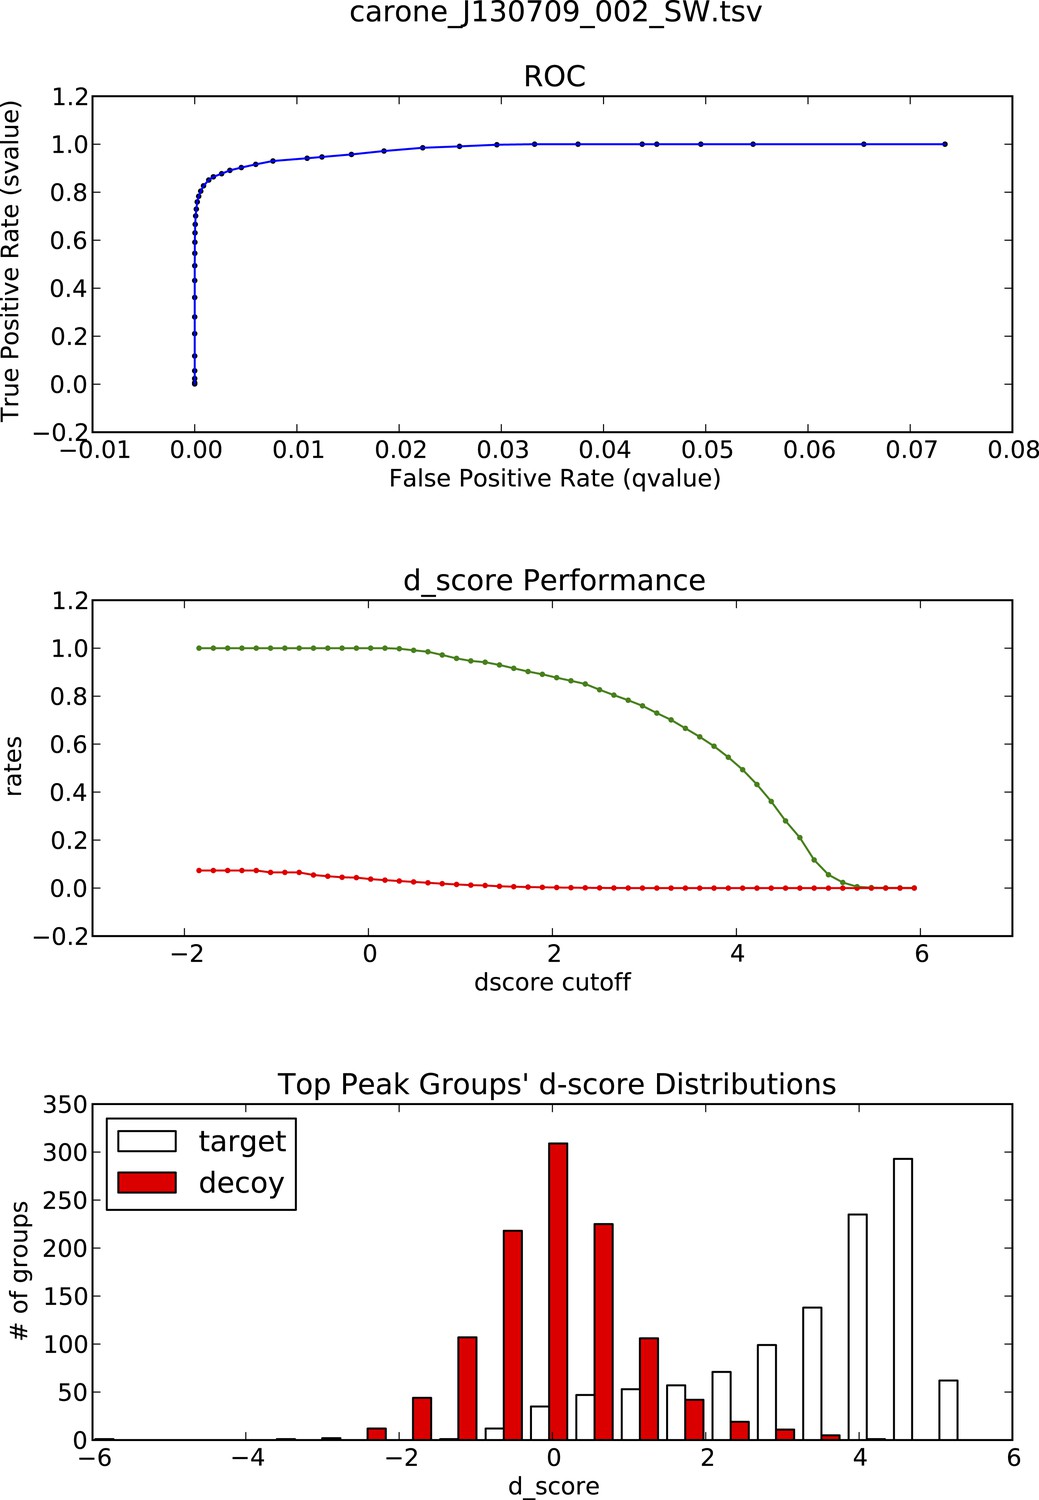
Figure 3—figure supplement 4
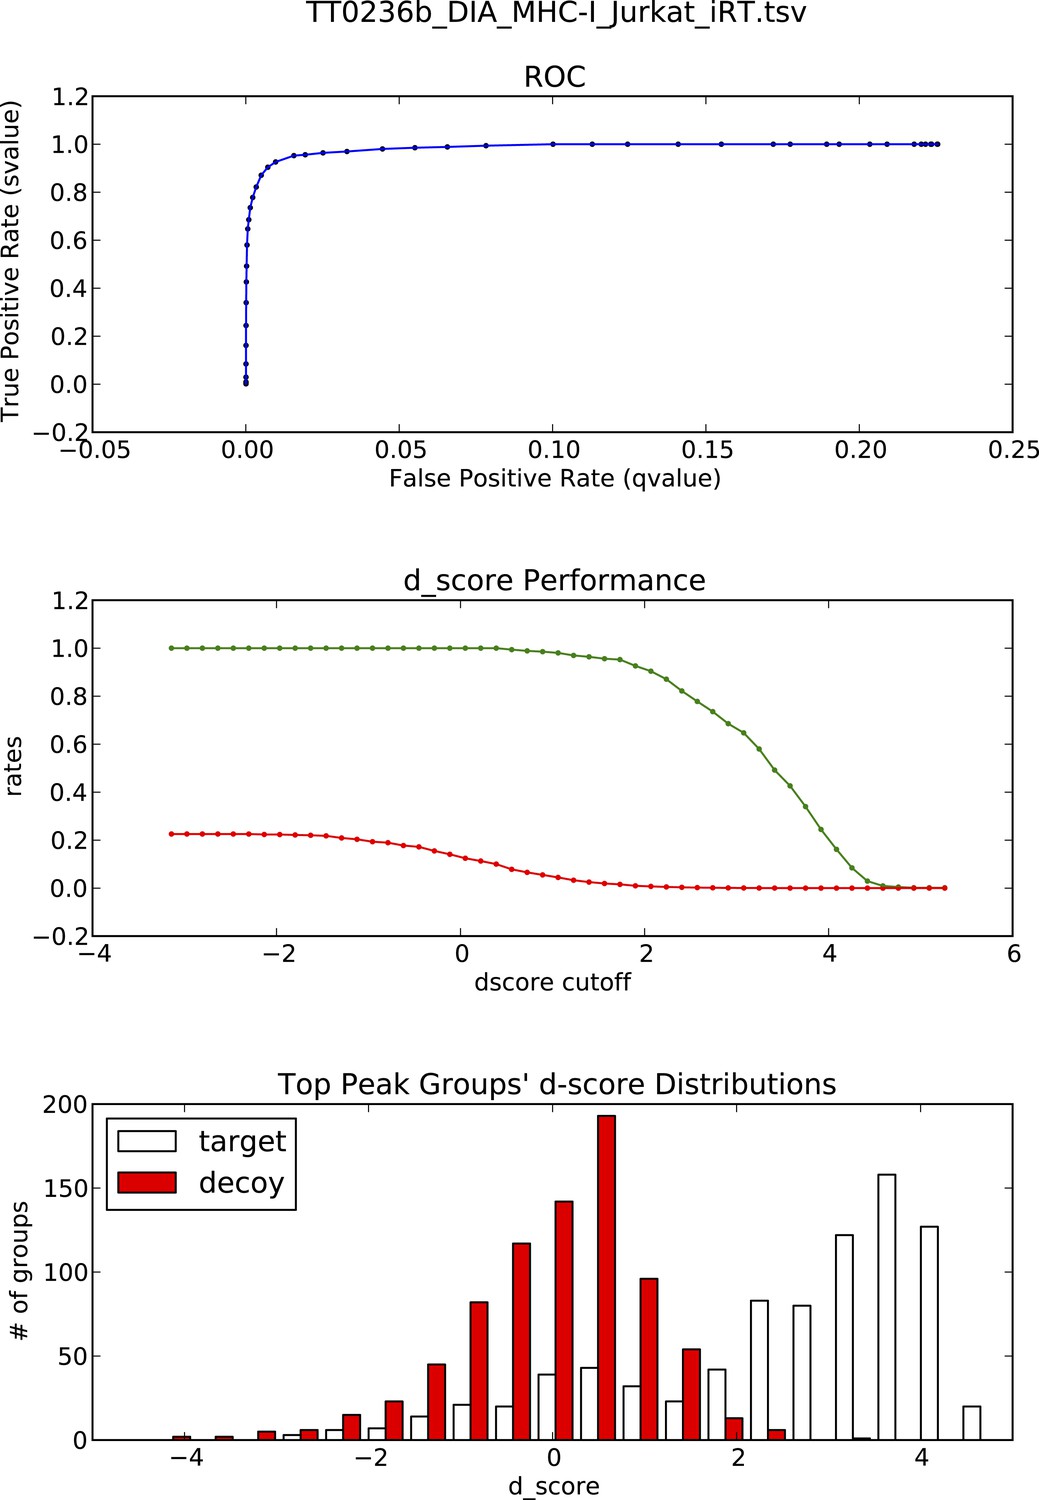
OpenSWATH analysis and PyProphet statistics of HLA peptidomic data acquired at University of Oxford, UK.
HLA-A03, -B07 and -B35 peptides were isolated from Jurkat cells. Graphs showing ROC, d_score performance and d-score distributions were generated automatically using the iPortal workflow.
Figure 3—figure supplement 5
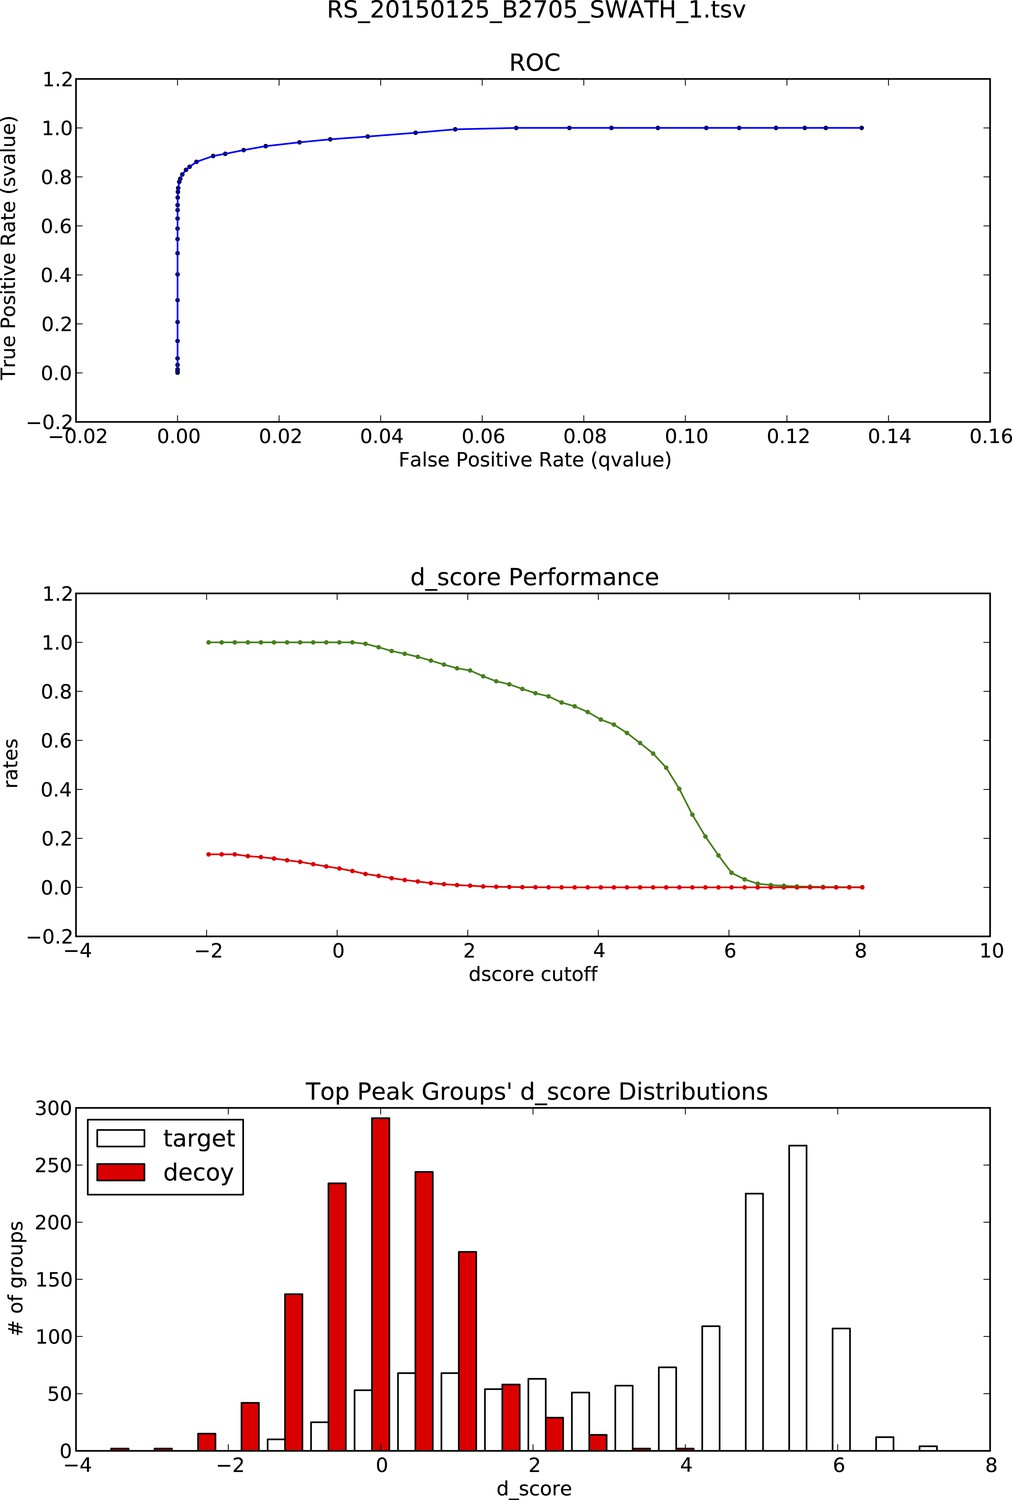
OpenSWATH analysis and PyProphet statistics of HLA peptidomic data acquired at Monash University, Australia.
HLA-B27 peptides were isolated from C1R cells. Graphs showing ROC, d_score performance and d-score distributions were generated automatically using the iPortal workflow.
Figure 3—figure supplement 6
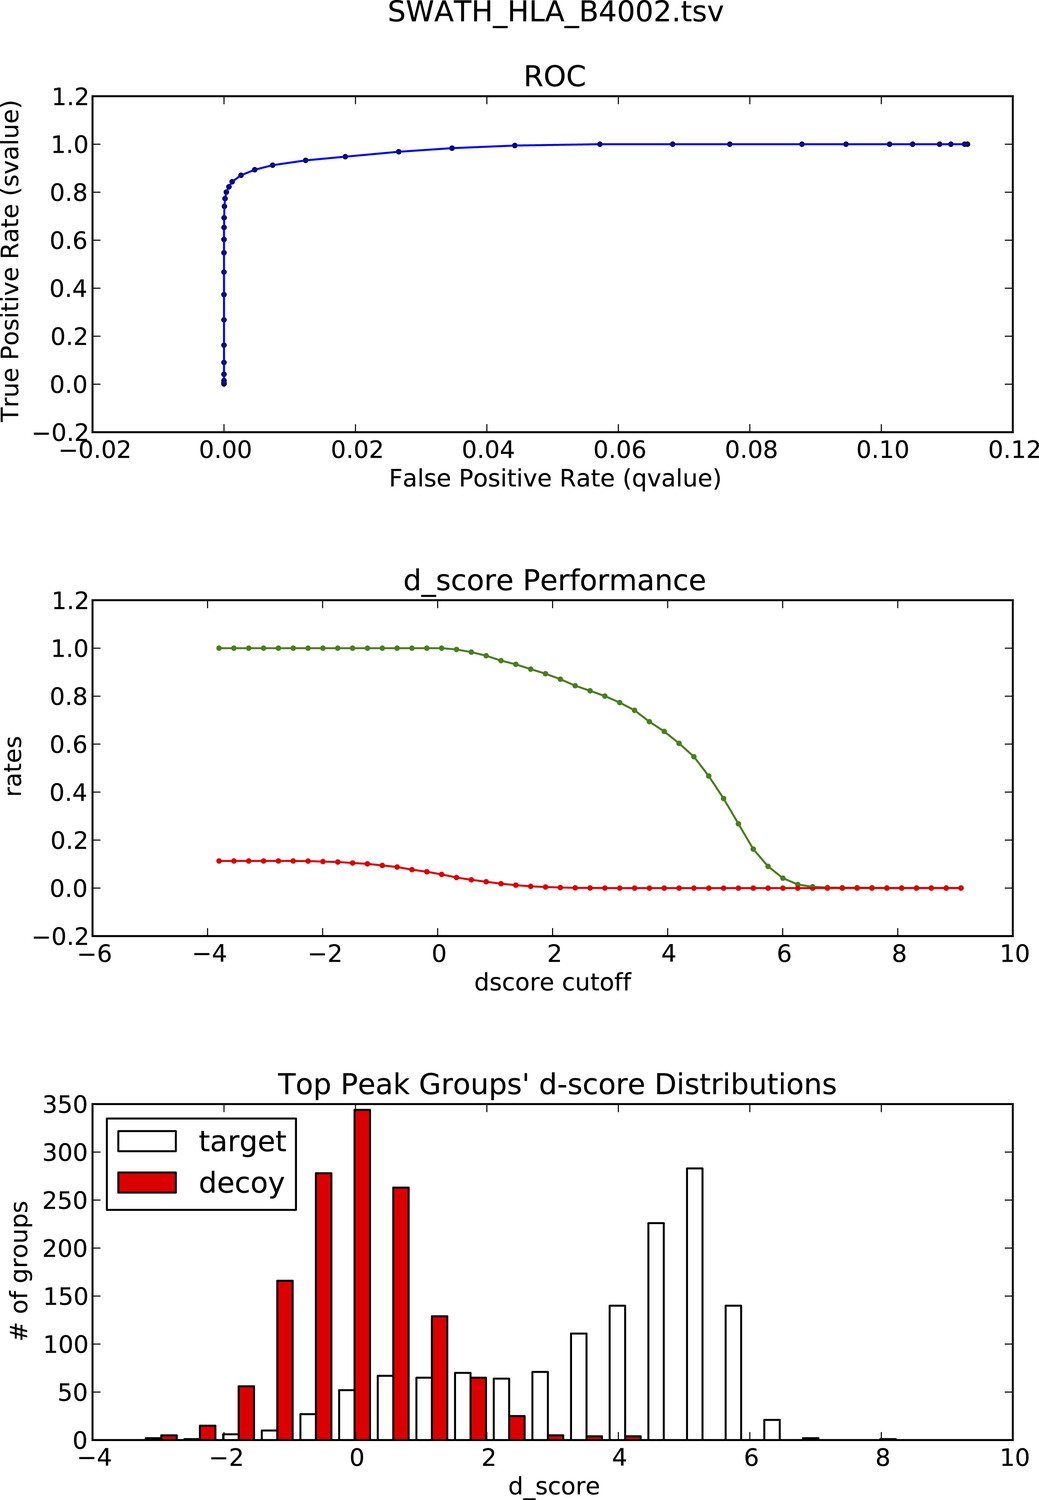
OpenSWATH analysis and PyProphet statistics of HLA peptidomic data acquired at Centro National de Biotechnologia, Madrid, Spain.
HLA-B40 peptides were isolated from C1R cells. Graphs showing ROC, d_score performance and d-score distributions were generated automatically using the iPortal workflow.
Figure 3—figure supplement 7

Visualization and analysis of SWATH-MS HLA peptidomic data in Skyline.
Skyline is a free open-source software for targeted data analysis of various types of peptidomic data. It specifically facilitates manual and automated analysis of SWATH data and other data-independently acquired MS data using assay libraries. The software itself can be downloaded from the website: http://skyline.maccosslab.org. (A) Skyline-daily or Skyline v2.6 was used to import HLA peptide SWATH assay libraries, and to import, extract, and visualize SWATH HLA peptidomic data. (B) The ‘Advanced Peak Picking Models’ was used to work with decoy transition groups and for large-scale, automated SWATH data analysis. For more information, see Schubert et al. (2015b).
Author response image 1
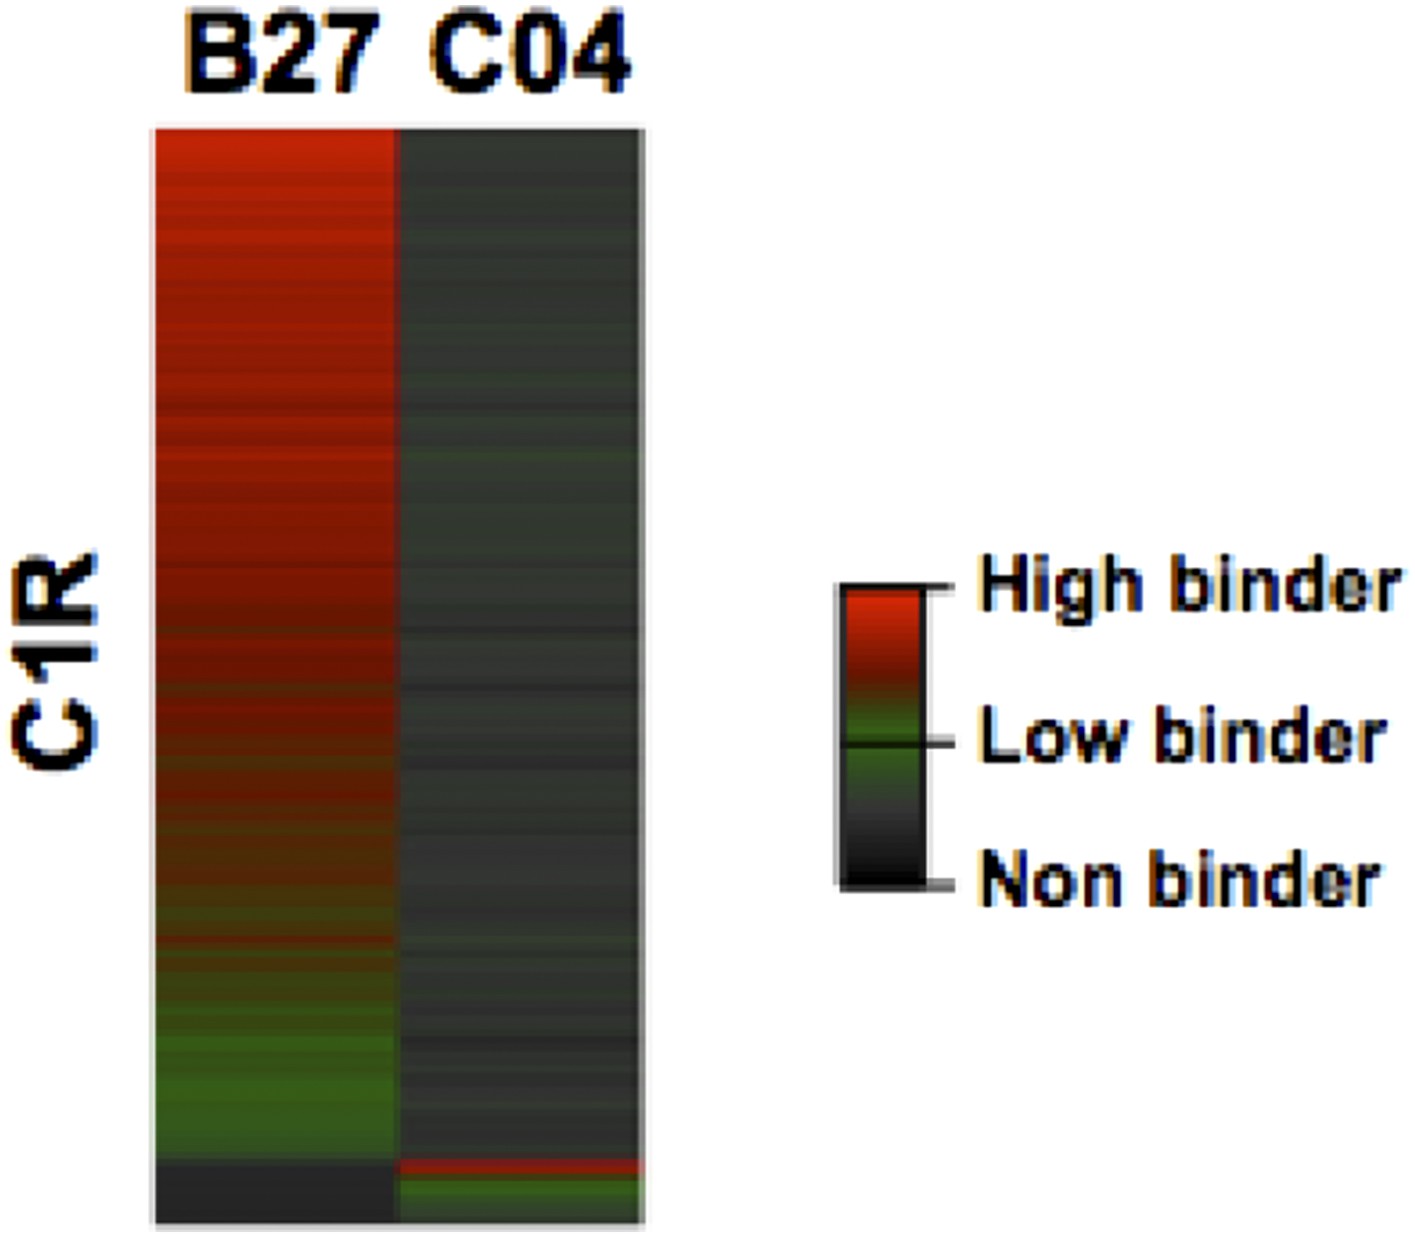
Heat map visualization of HLA-B27 and -C04 peptide ligands isolated from C1R cells.
Author response image 2
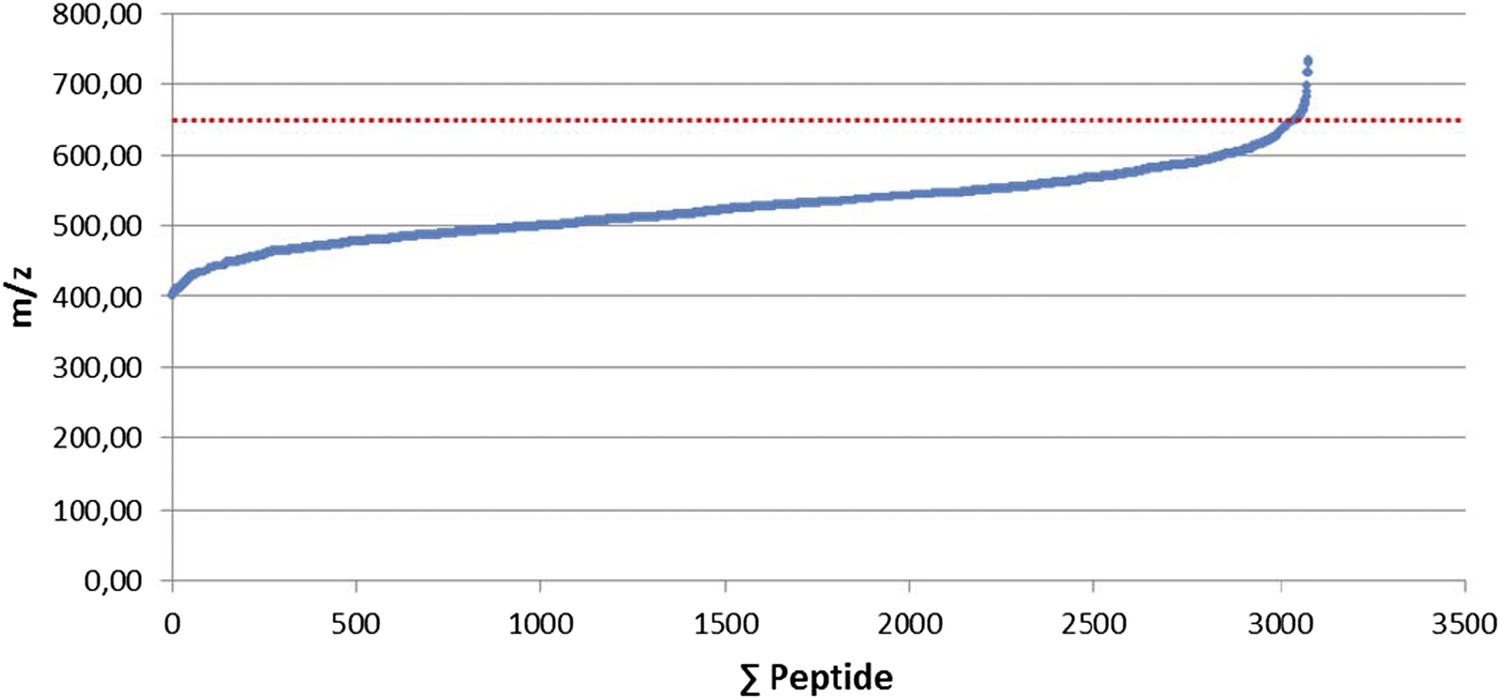
Selection of the 400-650 mass range. 3,079 manually validated HLA class I ligands from 15 renal cell carcinomas (RCCs) were used to define the mass range containing 99% of the ligands.
Additional files
-
Supplementary file 1
Description of the Python and the R scripts for the automated annotation and visualization of HLA peptidomic data.
- https://doi.org/10.7554/eLife.07661.029
-
Source code 1
Python and R scripts.
- https://doi.org/10.7554/eLife.07661.030
Download links
A two-part list of links to download the article, or parts of the article, in various formats.
Downloads (link to download the article as PDF)
Open citations (links to open the citations from this article in various online reference manager services)
Cite this article (links to download the citations from this article in formats compatible with various reference manager tools)
An open-source computational and data resource to analyze digital maps of immunopeptidomes
eLife 4:e07661.
https://doi.org/10.7554/eLife.07661


