Quantitative isoform-profiling of highly diversified recognition molecules
- University of Basel, Switzerland
Figures
Figure 1 with 7 supplements
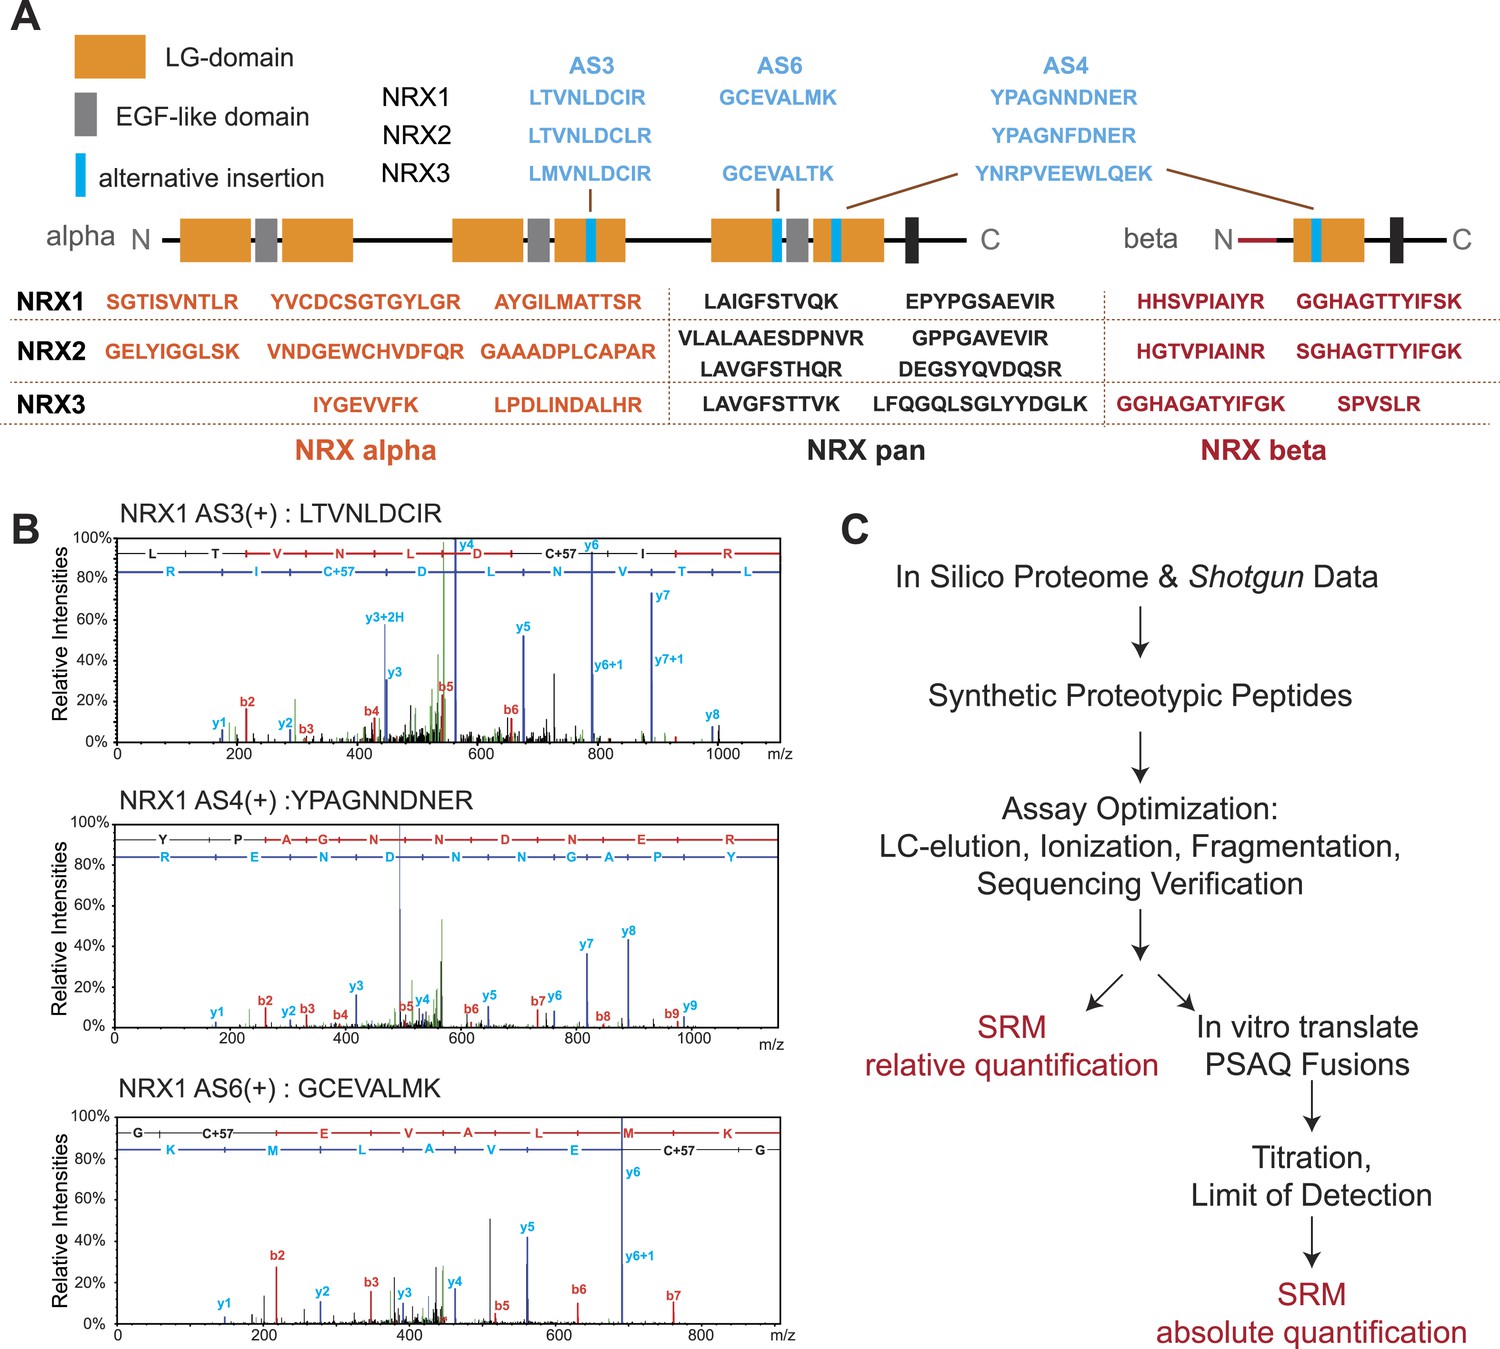
Establishment and validation of SRM-assays.
(A) Proteotypic peptides for relative quantification of neurexin variants. The position of peptides within the overall domain structure of neurexin proteins is indicated (laminin-G and EGF-domains are marked, transmembrane domain (TMD) shown as box, sites modified by alternative splicing in blue). Validated pan-neurexin peptides shared amongst alpha and beta isoforms derived from each Nrxn gene are shown in black, neurexin-alpha specific peptides in orange, neurexin-beta specific peptides in red, and splice isoform-specific peptides in blue. (B) Example MS/MS spectra of three endogenous peptides used for detection and quantification of NRX1 splice variants containing insertions at alternatively spliced segments 3, 4, and 6. Letters above the peaks indicate the amino acid sequence of the corresponding peptides (blue = y-ions; red = b-ions). (C) Workflow for the quantitative SRM-based protein analysis.
Figure 1—figure supplement 1
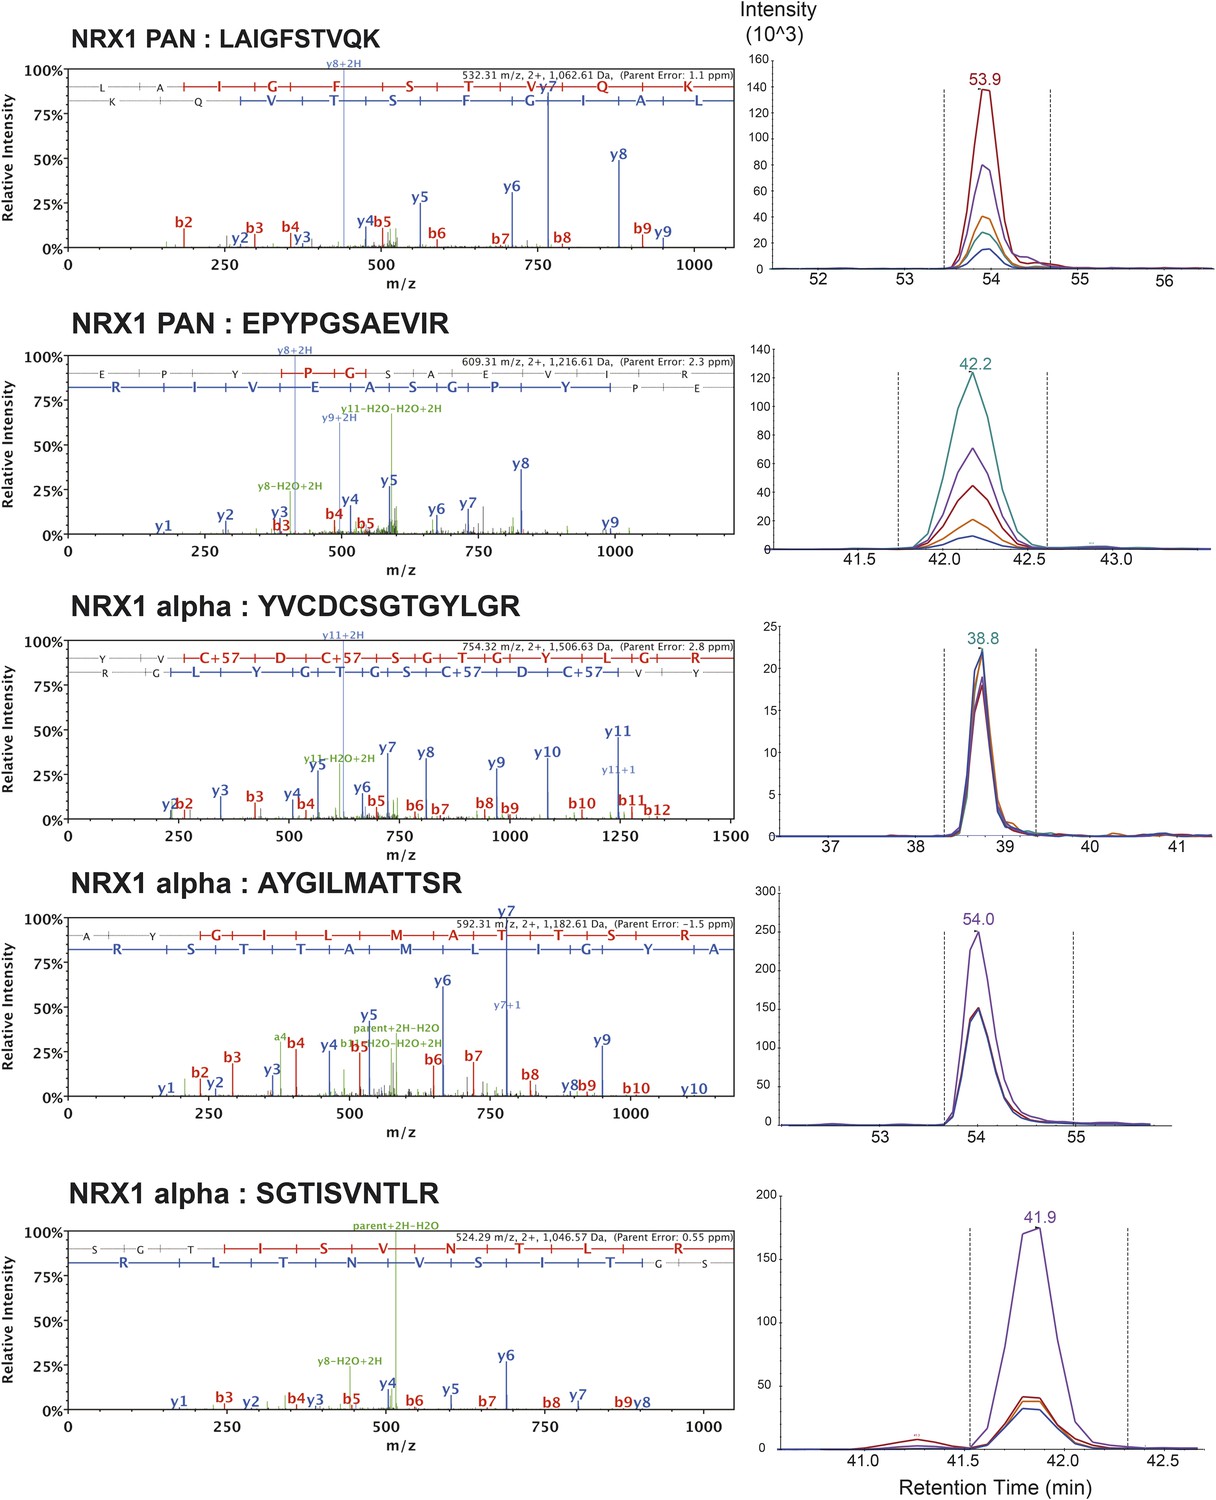
List of MS/MS spectra of proteotypic endogenous NRX1-pan and NRX1-alpha peptides, retention times and transition patterns of corresponding synthetic heavy peptides used for relative quantification in this study.
https://doi.org/10.7554/eLife.07794.004
Figure 1—figure supplement 2
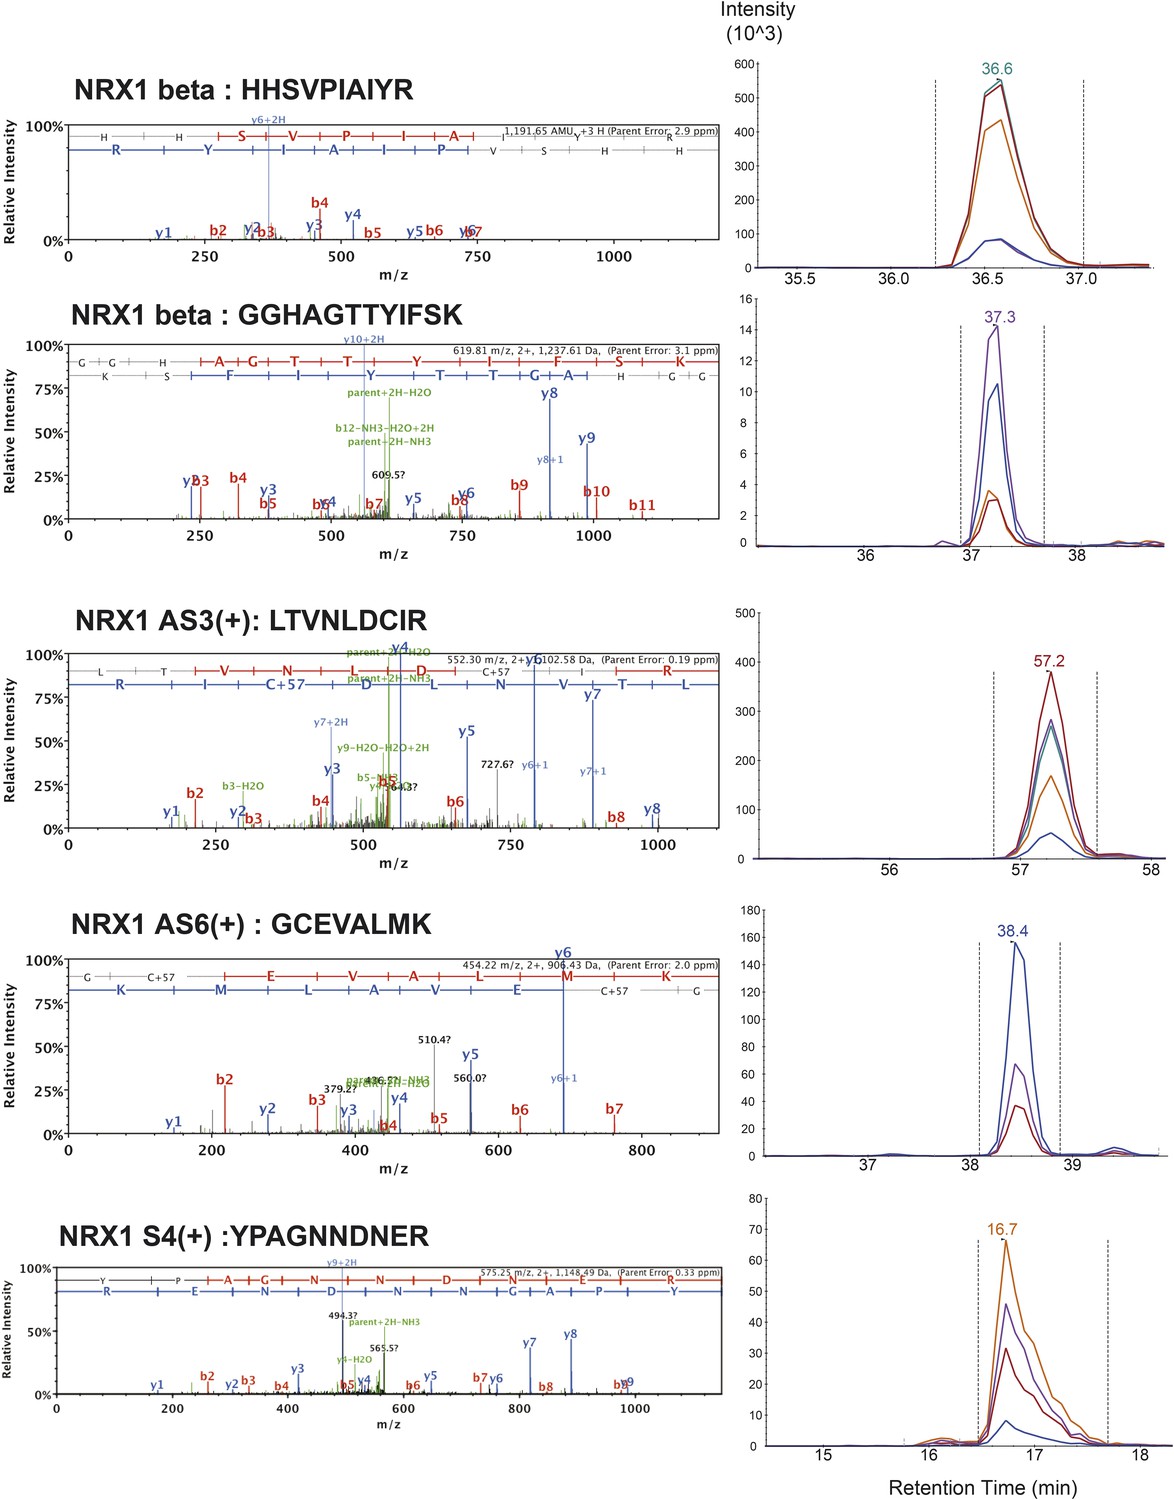
List of MS/MS spectra of proteotypic endogenous NRX1-beta, NRX1-AS3(+), NRX1-AS6(+) and NRX1-AS4(+) peptides, retention times and transition patterns of corresponding synthetic heavy peptides used for relative quantification in this study.
https://doi.org/10.7554/eLife.07794.005
Figure 1—figure supplement 3
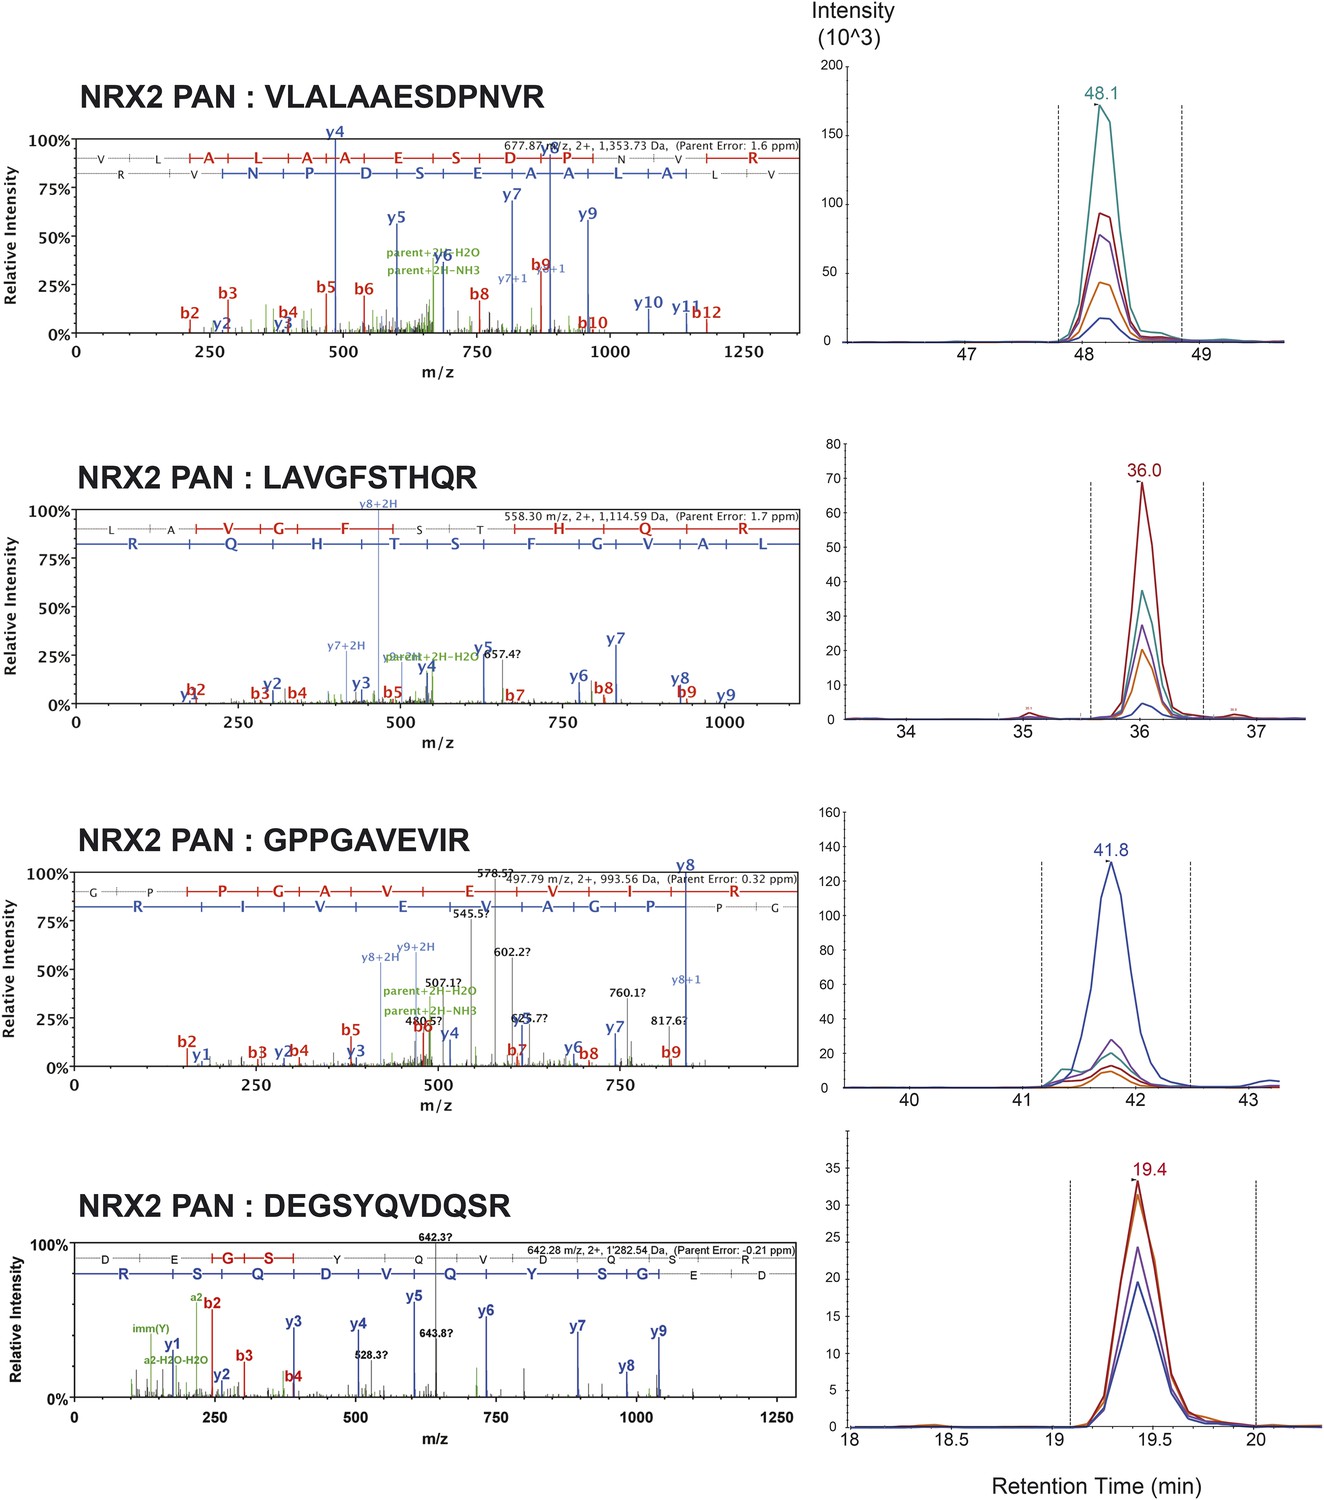
List of MS/MS spectra of proteotypic endogenous NRX2-pan peptides, retention times and transition patterns of corresponding synthetic heavy peptides used for relative quantification in this study.
https://doi.org/10.7554/eLife.07794.006
Figure 1—figure supplement 4
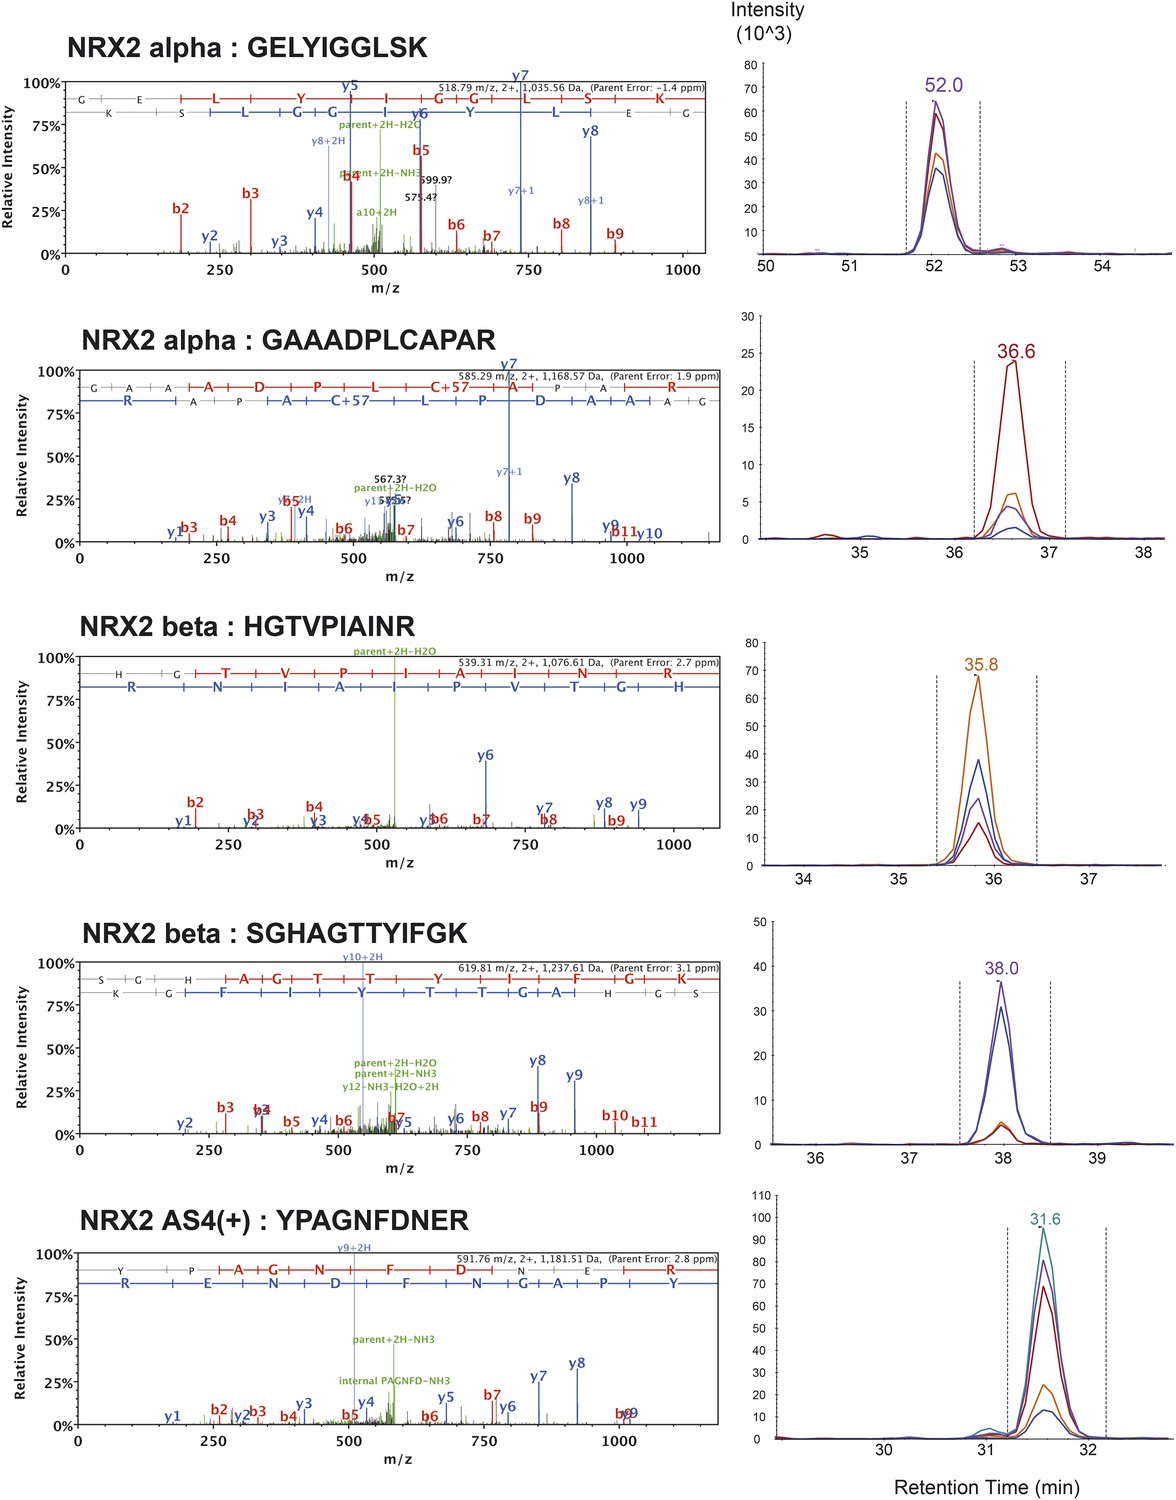
List of MS/MS spectra of proteotypic endogenous NRX2-alpha, NRX2-beta and NRX2-AS4(+) peptides, retention times and transition patterns of corresponding synthetic heavy peptides used for relative quantification in this study.
Note: one NRX2-alpha specific peptide (VNDGEWCHVDFQR) could not be identified by shotgun MS/MS. However, read-outs obtained with this peptide were very close to values obtained with two other NRX2-alpha peptides. Thus, results obtained with all three peptides were used for relative quantification.
Figure 1—figure supplement 5
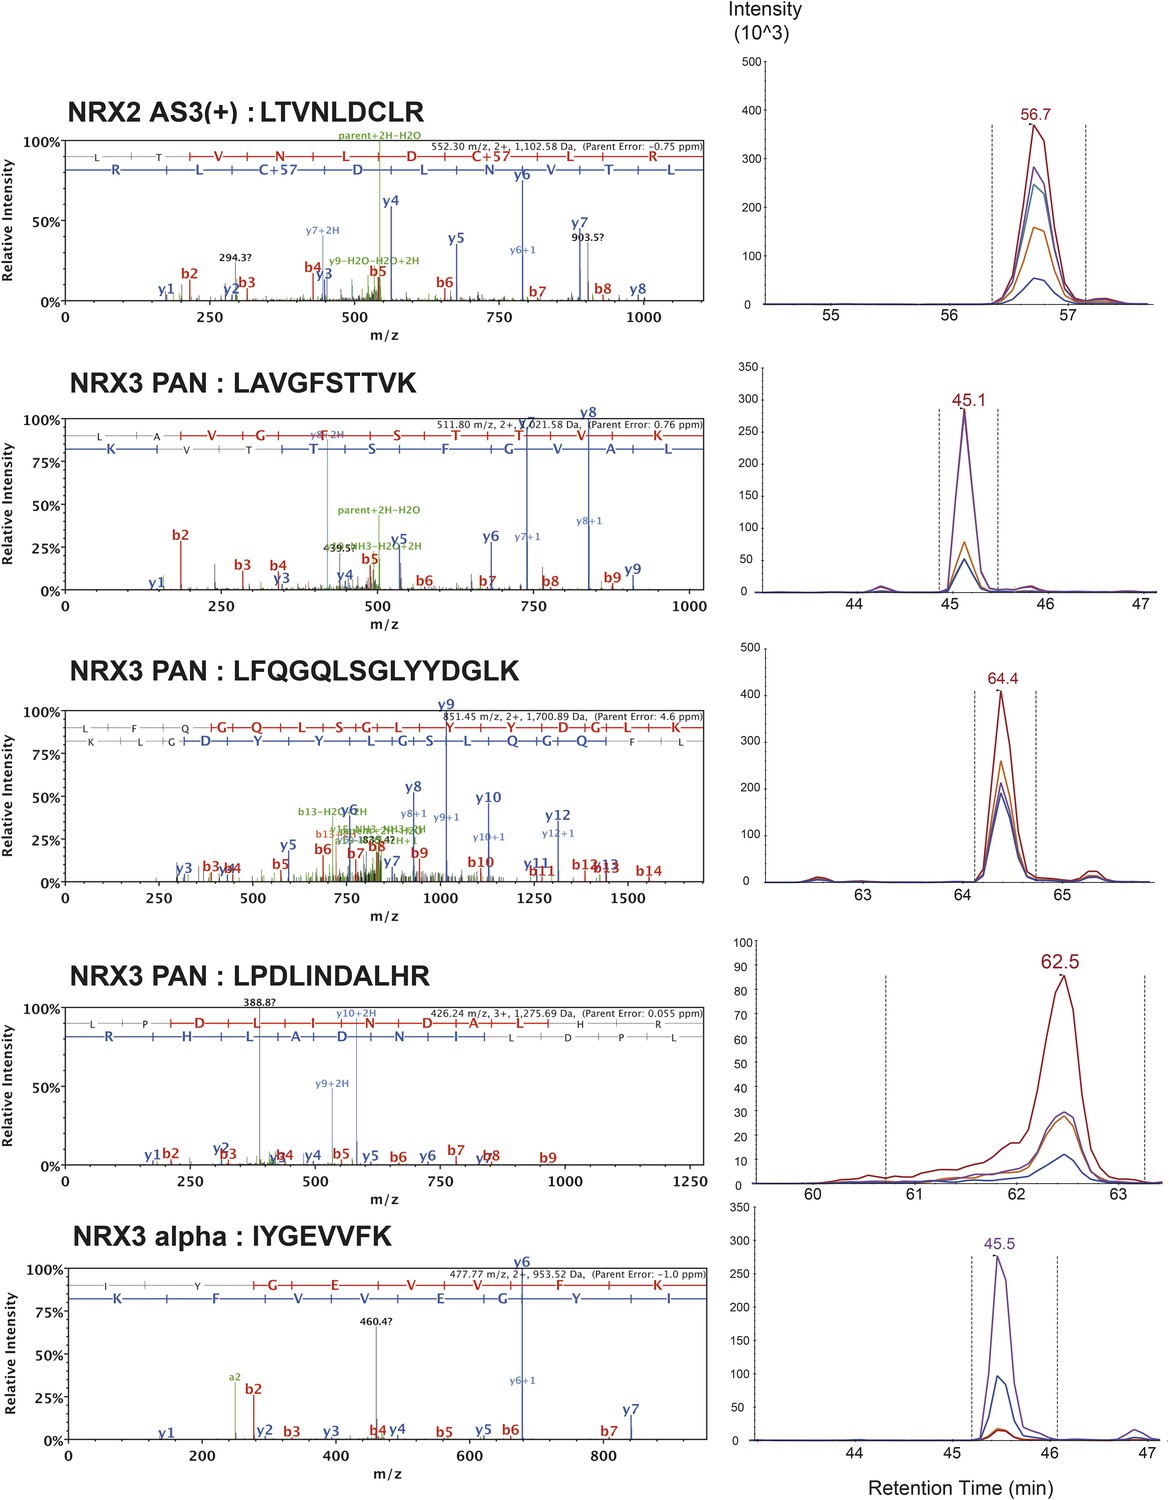
List of MS/MS spectra of proteotypic endogenous NRX2-AS3(+), NRX3-pan and NRX3-alpha peptides, retention times and transition patterns of corresponding synthetic heavy peptides used for relative quantification in this study.
https://doi.org/10.7554/eLife.07794.008
Figure 1—figure supplement 6
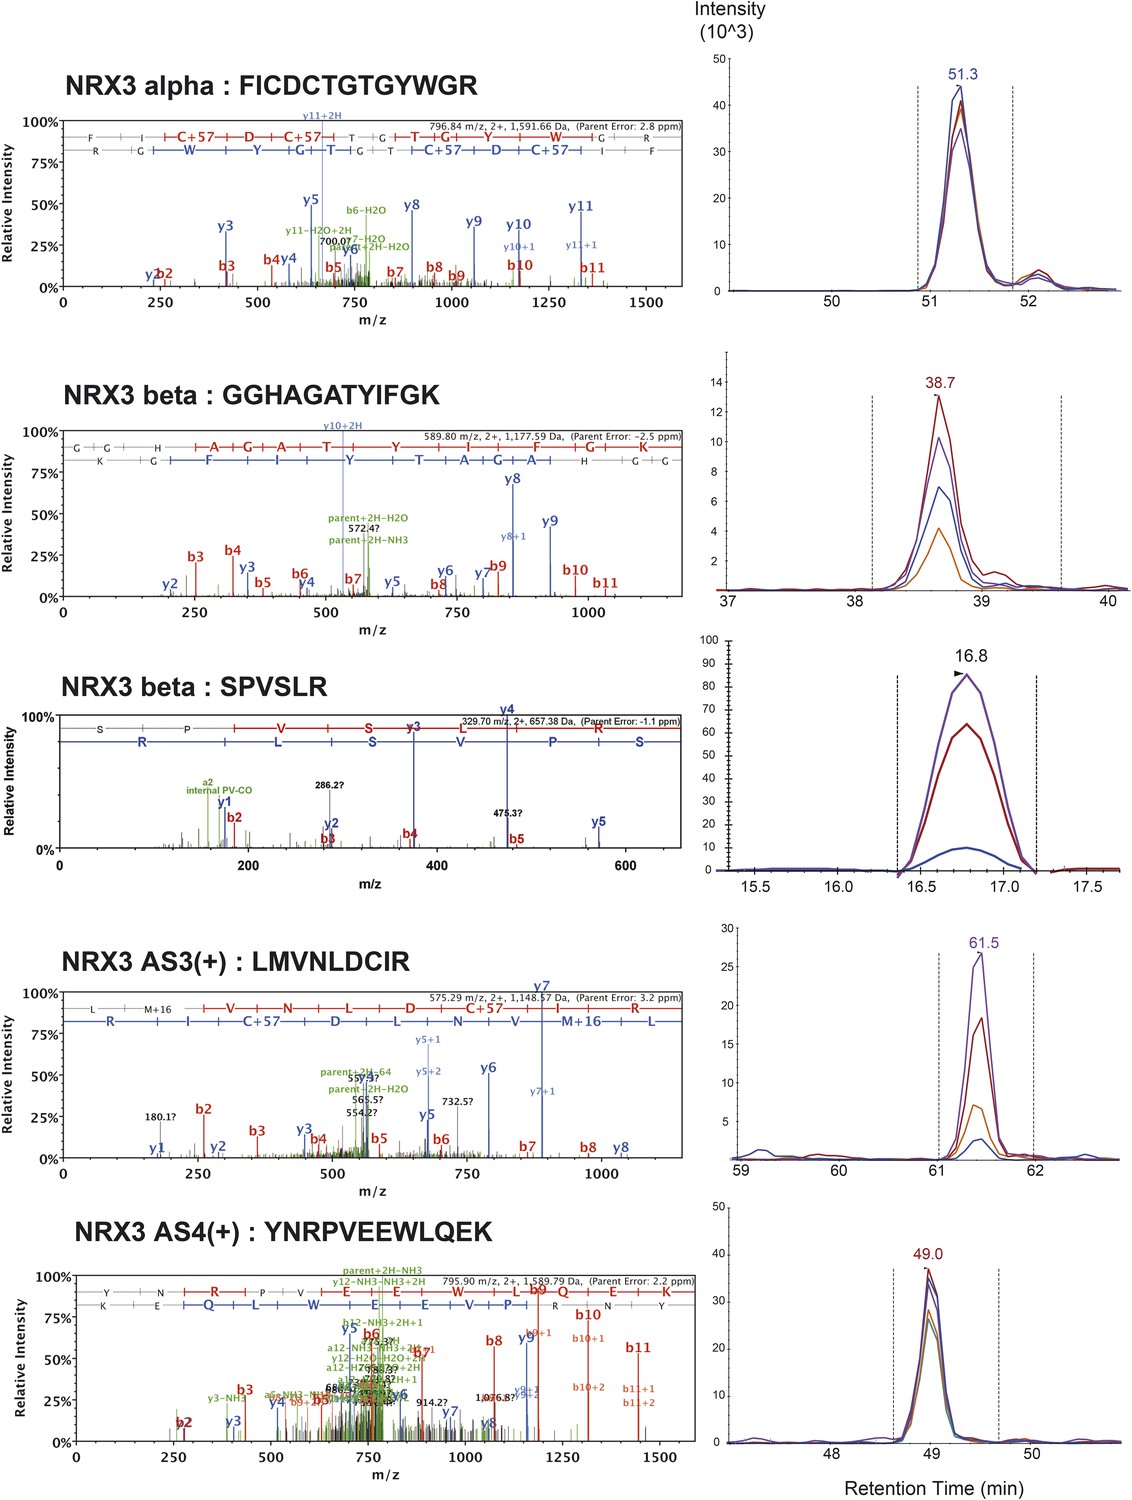
List of MS/MS spectra of proteotypic endogenous NRX3-alpha, NRX3-beta, NRX3-AS3(+) and NRX3-AS4(+) peptides, retention times and transition patterns of corresponding synthetic heavy peptides used for relative quantification in this study.
https://doi.org/10.7554/eLife.07794.009
Figure 1—figure supplement 7
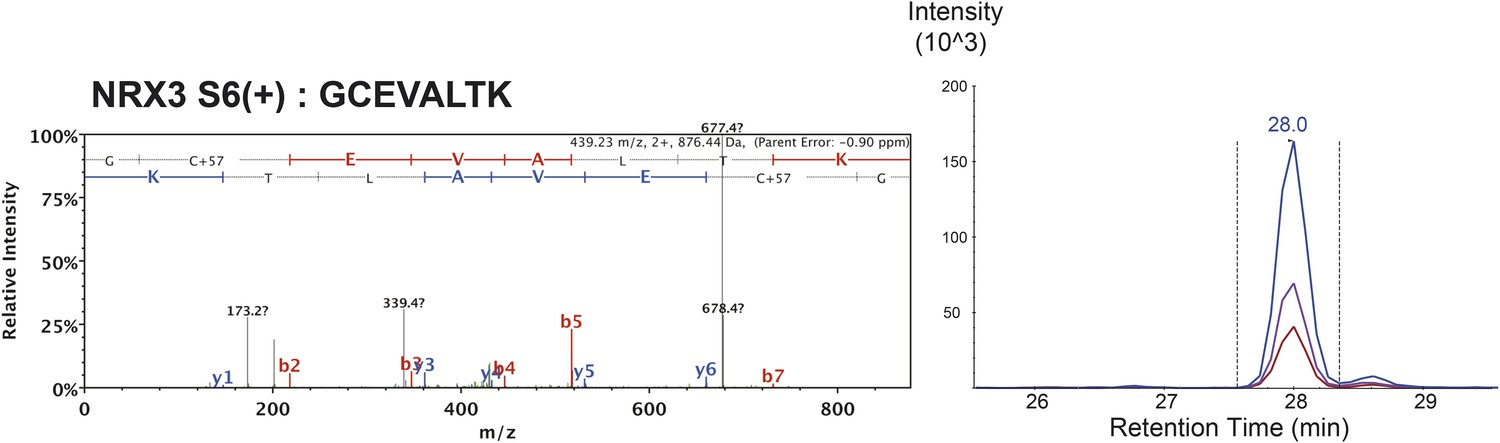
MS/MS spectrum of proteotypic endogenous NRX3-AS6(+) peptide, retention time and transition pattern of corresponding synthetic heavy peptide used for relative quantification in this study.
https://doi.org/10.7554/eLife.07794.010
Figure 2 with 2 supplements
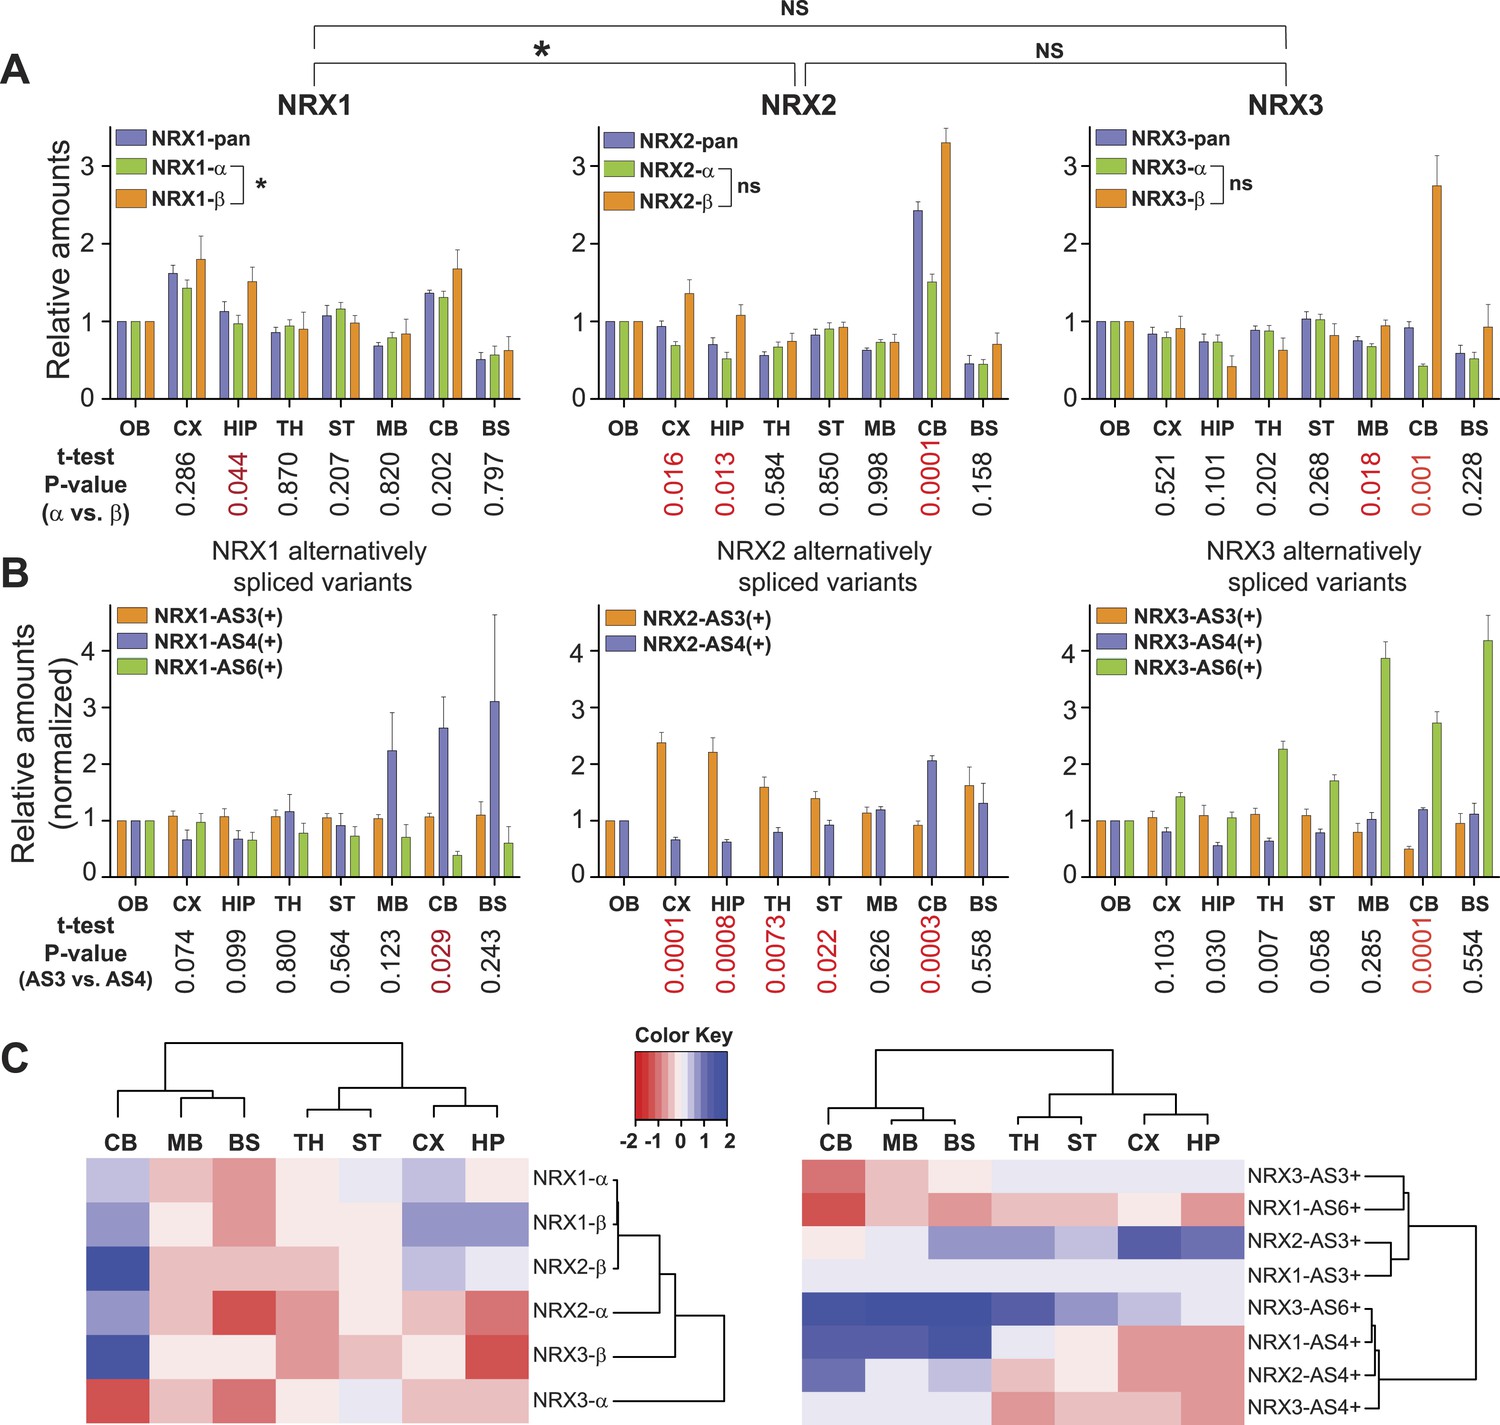
Quantitative comparison of relative neurexin variant levels across brain areas.
(A, B) Relative amounts of total neurexin (NRX-pan), NRX-alpha, beta, and splice insertions across P30 mouse brain (OB = olfactory bulb, CX = cortex, HIP = hippocampus, TH = thalamus, ST = striatum, MB = mid-brain, CB = cerebellum, BS = brain stem). Values were normalized to OB. Correlation analysis between expression profiles of pan-neurexins, alpha and beta isoforms was performed using Spearman-correlation test. No significant correlation between expression profiles of alpha and beta isoforms of NRX2 and 3 (Spearman r = 0.6190, p-value = 0.1150 for NRX2 and Spearman r = −0.4048, p-value = 0.3268 for NRX3, respectively). Significant correlation (p-value = 0.0046 and Spearman r = 0.9048) for expression profiles of NRX1-alpha and beta isoforms. Numbers on the bottom of diagrams represent p-values of the t-test analysis of alpha- and beta-NRX in different brain areas (statistically significant values are marked in red). Relative amounts of neurexin AS3, AS4, AS6 splice variants across brain regions normalized to respective total NRX protein levels. As the AS3 and AS6 insertions are found exclusively in alpha variants, their measurements were normalized to NRX-alpha protein levels. Means ± SD from 4 biological replicates (n = 4, 2 male and 2 female mice, postnatal day 30) measured in 2 technical replicates. (C) Hierarchical clustering analysis of relative expression of NRX isoforms and splice variants across mouse brain. Hierarchical clustering of ‘protein log2 abundance ratios’ was performed using Ward's algorithm and the correlation distance metric. Subsequently, a heat map was created using the gplots R package.
Figure 2—figure supplement 1
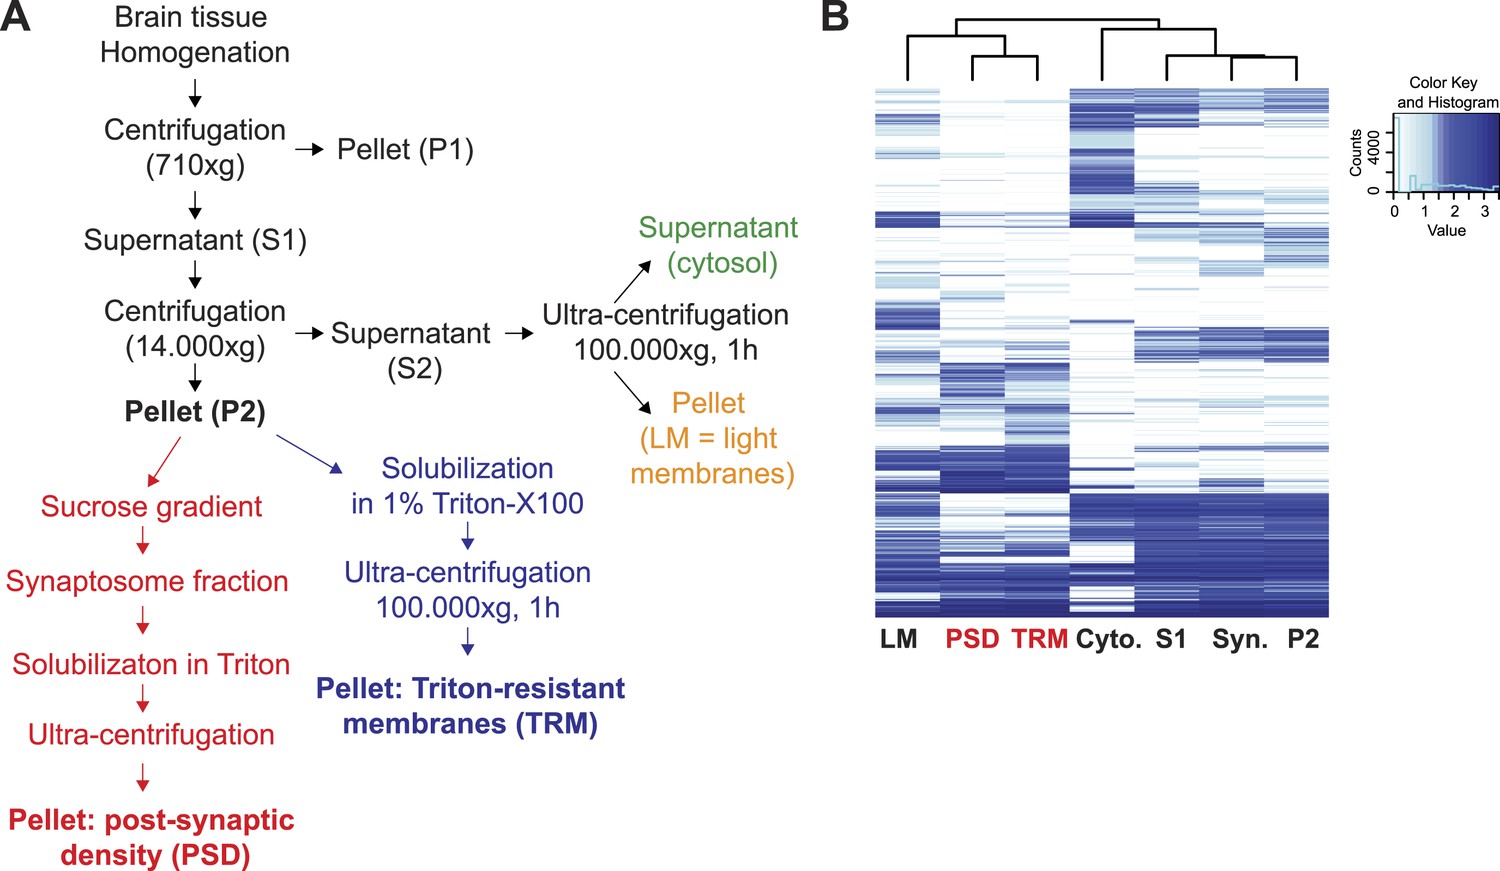
Preparation of synaptic proteins enriched Triton-Resistant-Membranes (TRM) from mouse brain.
(A) Workflow of the preparation of Triton X-100 resistant membranes (TRM) from brain tissues for enrichment of synaptic proteins. (B) Hierarchical clustering of log-transformed protein normalized spectral counts was performed using Ward's algorithm and the Euclidian distance metric. Subsequently, a heat map was created using the gplots R package. To include proteins with zero spectral counts, in one or more conditions, all spectral counts were incremented by one pseudo-count. Heat map diagram and hierarchical clustering of proteins identified in TRM samples and post-synaptic density (PSD) samples prepared using a standard protocol.
Figure 2—figure supplement 2
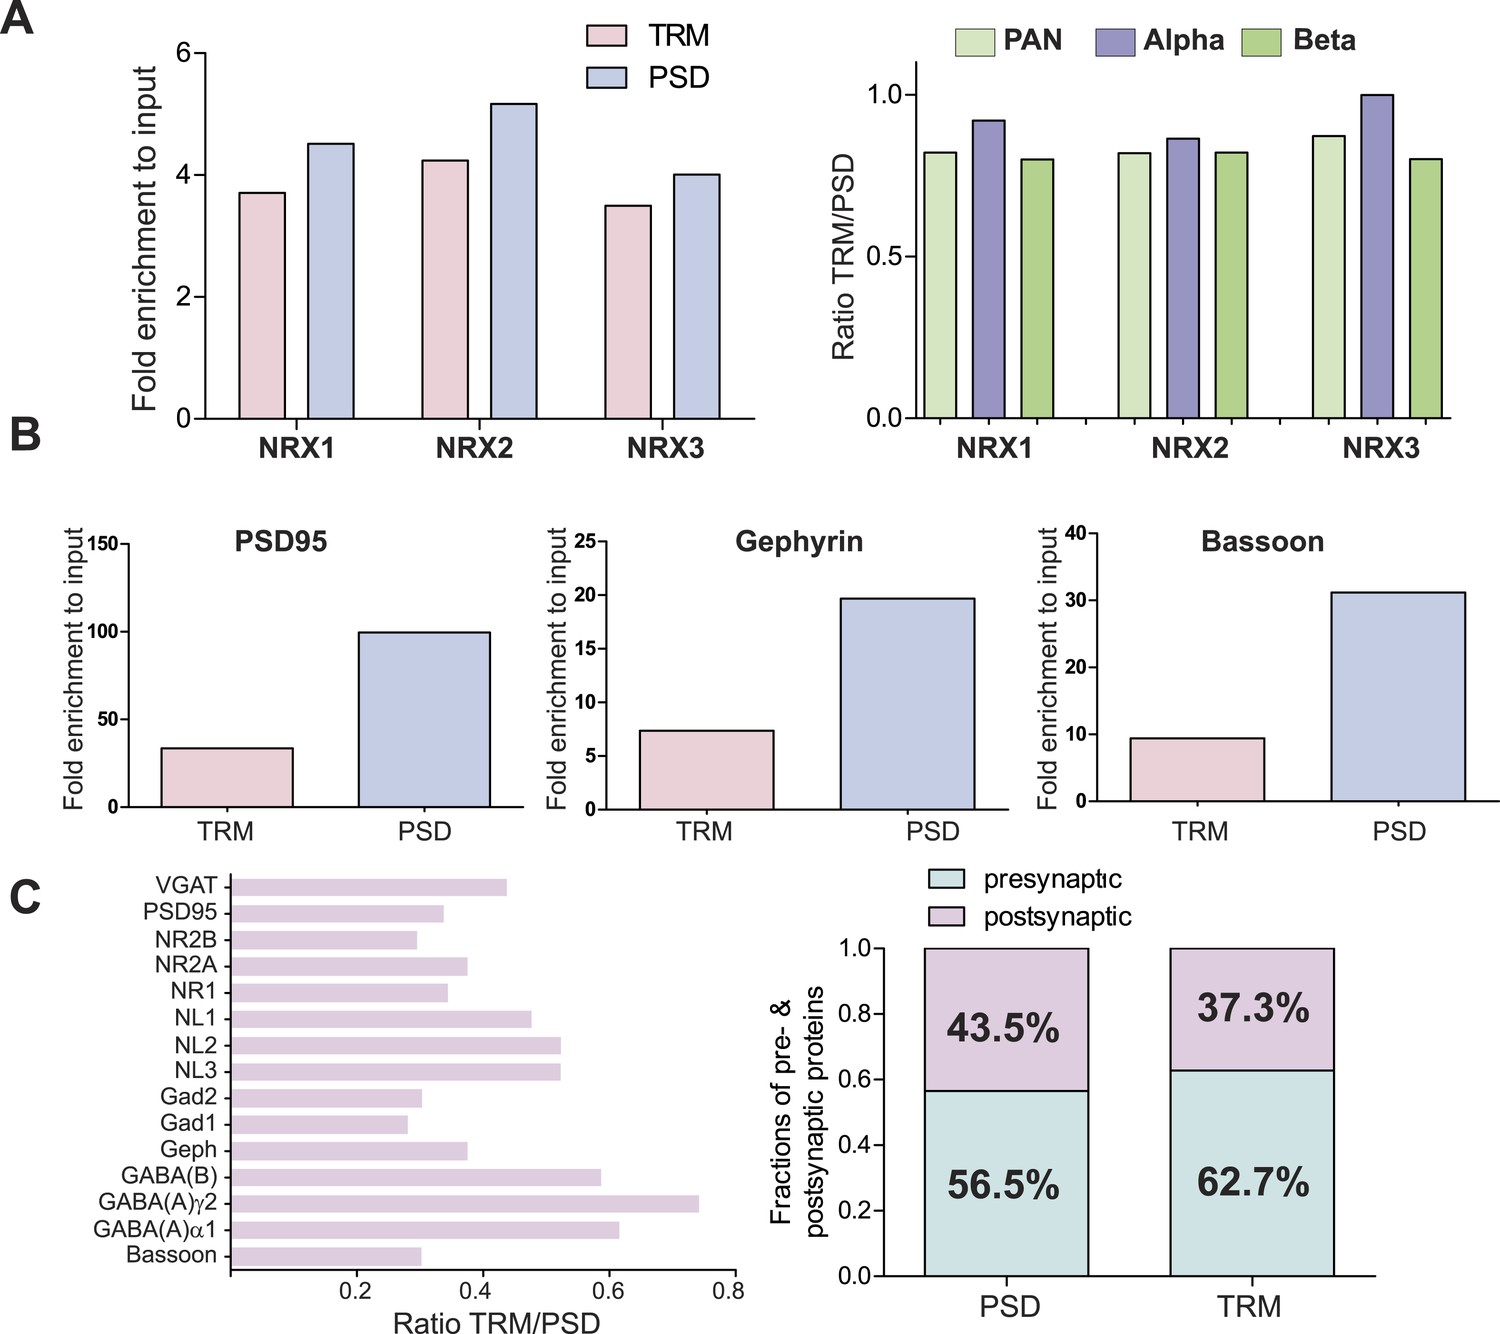
Comparison of enrichments of neurexins and other synaptic proteins in TRM and Postsynaptic-Density (PSD) preparations.
(A) SRM based quantification of the enrichment of neurexin proteins in TRM and PSD samples (left diagram). . In both preparations comparable enrichment (∼4 fold) could be observed. No bias in enrichment of alpha and beta isoforms was observed between two preparations (right diagram). (B) Quantitative comparison of the enrichment of core PSD proteins in TRM and purified post-synaptic density (PSD) fractions. Relative enrichments compared to input for PSD95 (Dlg4), Gephyrin, and Bassoon were determined using SRM assays. Purified PSD fraction showed stronger enrichment of core post-synaptic density proteins. (C) Ratios of synaptic protein enrichment as determined by SRM assays. For all measured synaptic proteins, higher enrichment could be observed in the purified PSD fraction (right diagram). The enrichment shows significant differences between different synaptic.
Figure 3 with 1 supplement
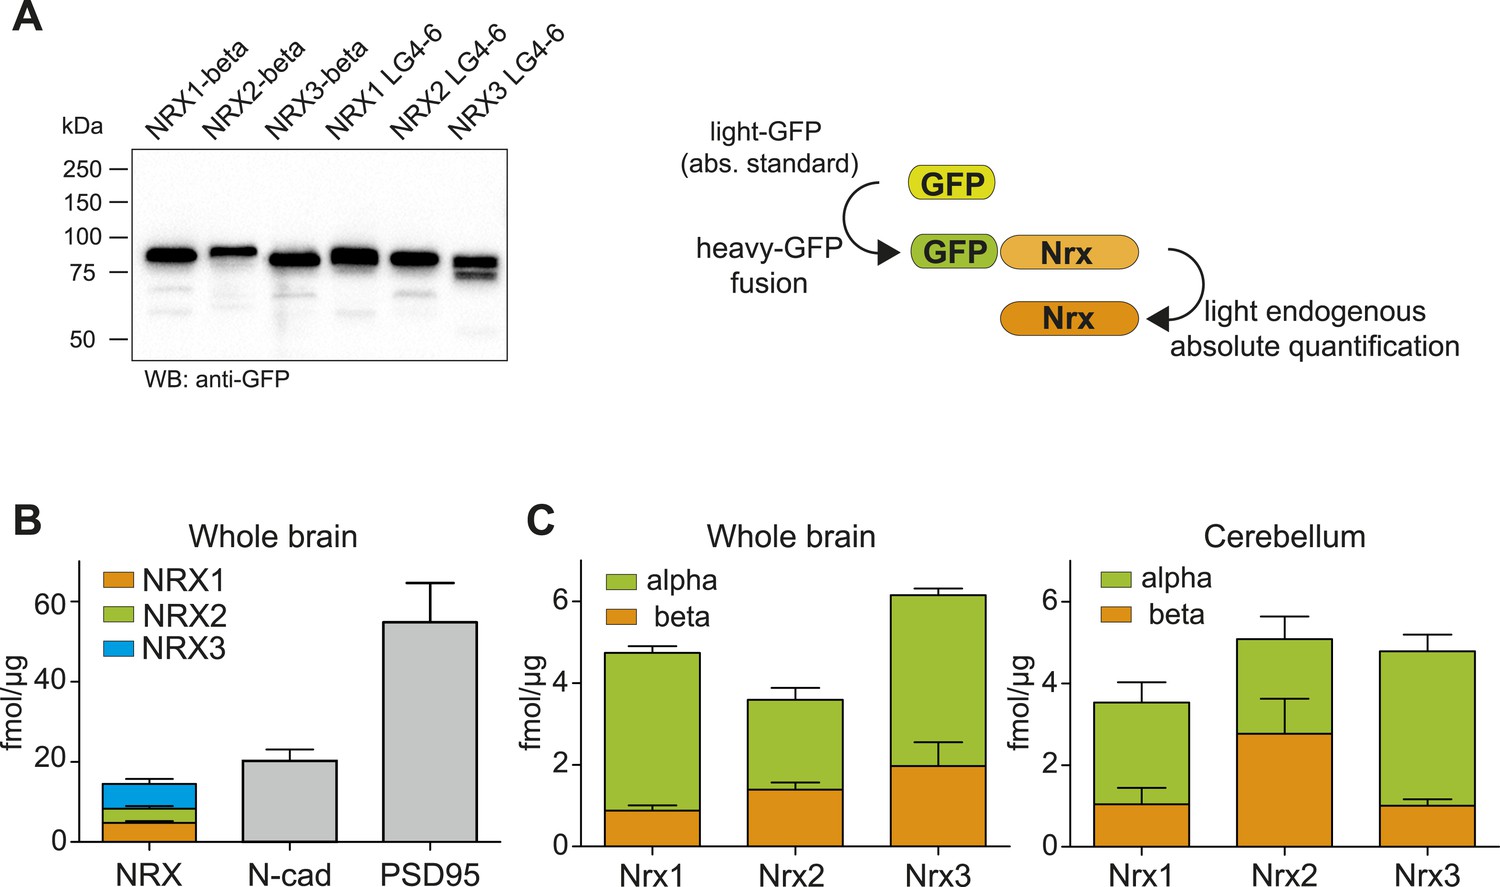
Absolute quantification of endogenous neurexin isoforms.
(A) Western blot for recombinant proteins and SRM-based quantification approach using in vitro translated heavy amino acids labeled standards fused to GFP and as heavy standards in SRM assays. For absolute quantification of NRX-beta isoforms full-length NRX-beta fused to GFP was used as heavy standard. For absolute quantification of NRX-alpha proteins, the neurexin-repeat 3 containing laminin-G-like domains 4 and 6 (LG4-6) fused to GFP was used as heavy standards. (B) Absolute amounts of NRX1,2,3, N-cadherin, and PSD95 in synaptic protein enriched fractions from whole brain of P30 mice. Pan NRX1,2,3 levels were determined using pan NRX peptides derived from in vitro translated NRX-alpha and beta standards. Shown are means ± SD. NRXs were measured with two independent heavy standards (alpha and beta), in two technical replicates, from 2 animals, n = 2. N-cad and PSD95 were measured in two technical replicates, from 2 animals, n = 2. (C) Absolute quantification of NRX-alpha and beta in synaptic protein enriched samples from whole brain and cerebellum of adult (P30) mice (n = 2 mice). Quantification was performed with NRX-alpha and beta heavy standards spiked into the brain samples. The amount of NRX-beta in samples measured with alpha-constructs was calculated by subtraction of measured NRX-alpha amount from measured NRX-pan amount. In addition, the amount of NRX-alpha was calculated in samples measured with beta heavy standards. Means ± SD of these independent determinations are shown.
Figure 3—figure supplement 1
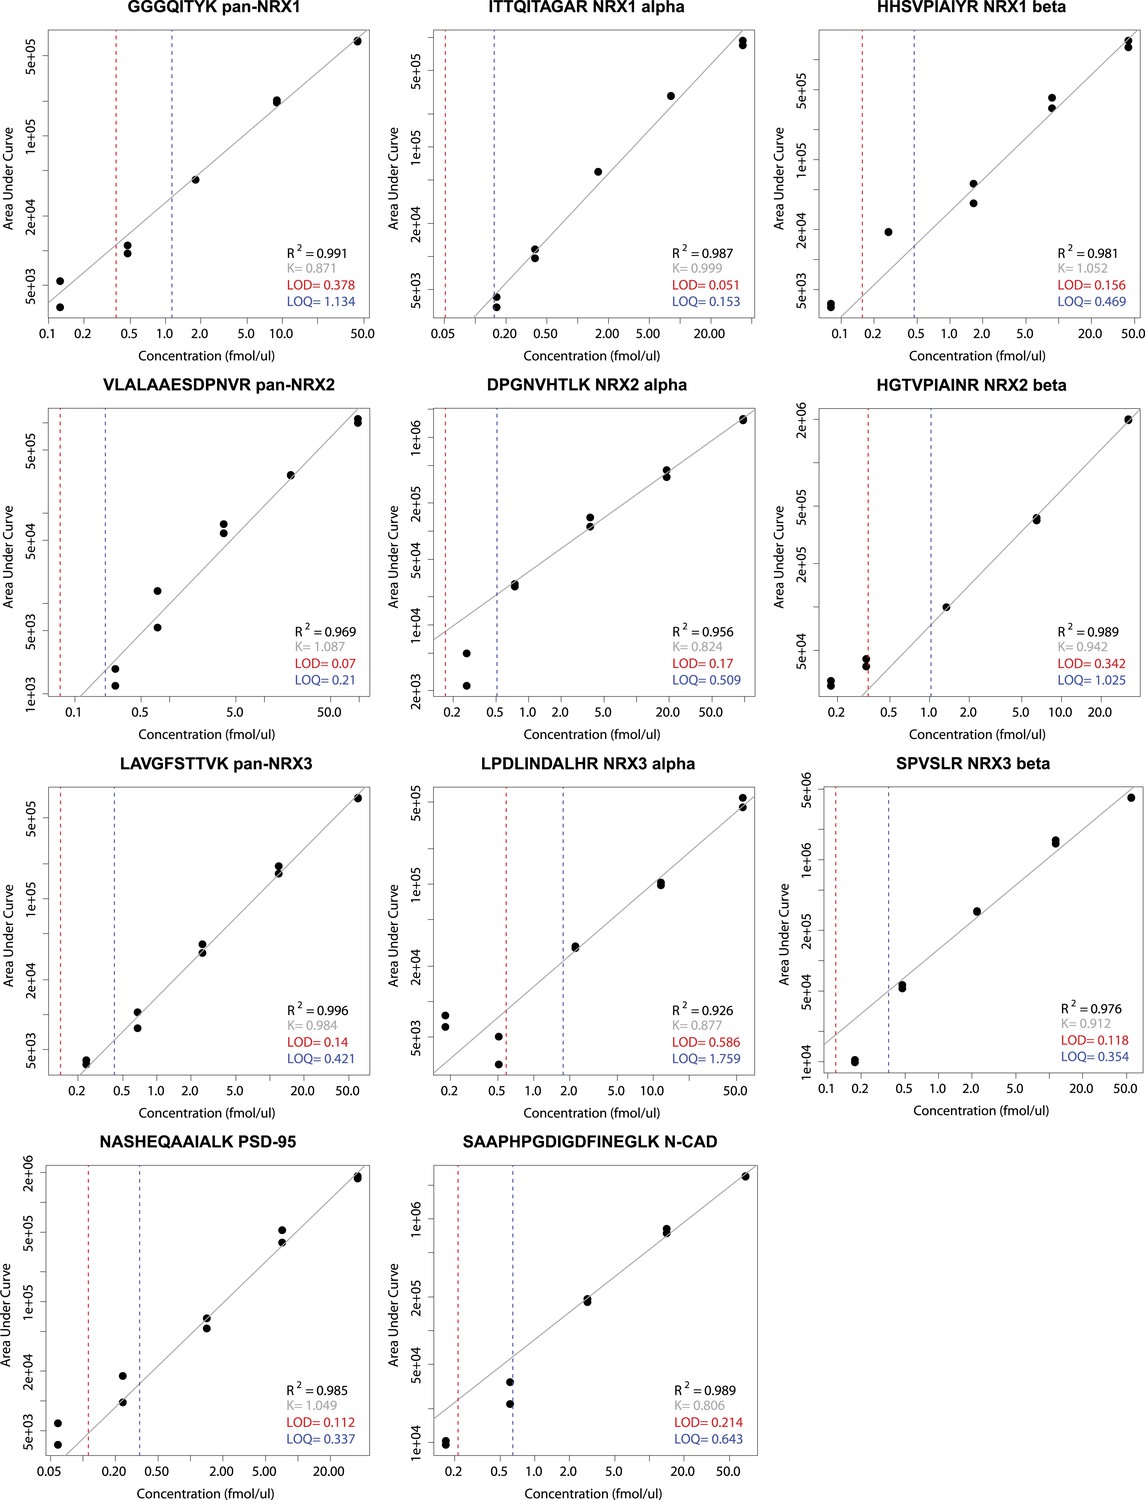
Examples for the determination of lower limits of detection (LOD) and quantification (LOQ) for selected NRX1-3, PSD95 and N-CAD peptides used in this study for absolute quantification.
Peptide-specific standard curves were derived by spiking each digested synaptic protein-construct at a concentration range of five values into a digested mixture of mouse whole brain TRM protein extract complemented with GFP protein standard. The measurements were performed in two biological and two technical replicates, including 3 technical replicates of the whole brain protein extract and GFP protein standard mixture alone, here used to assess the background noise level. Lower limits of quantification and lower limits of detection were then established according to the blank and low concentration sample method.
Figure 4
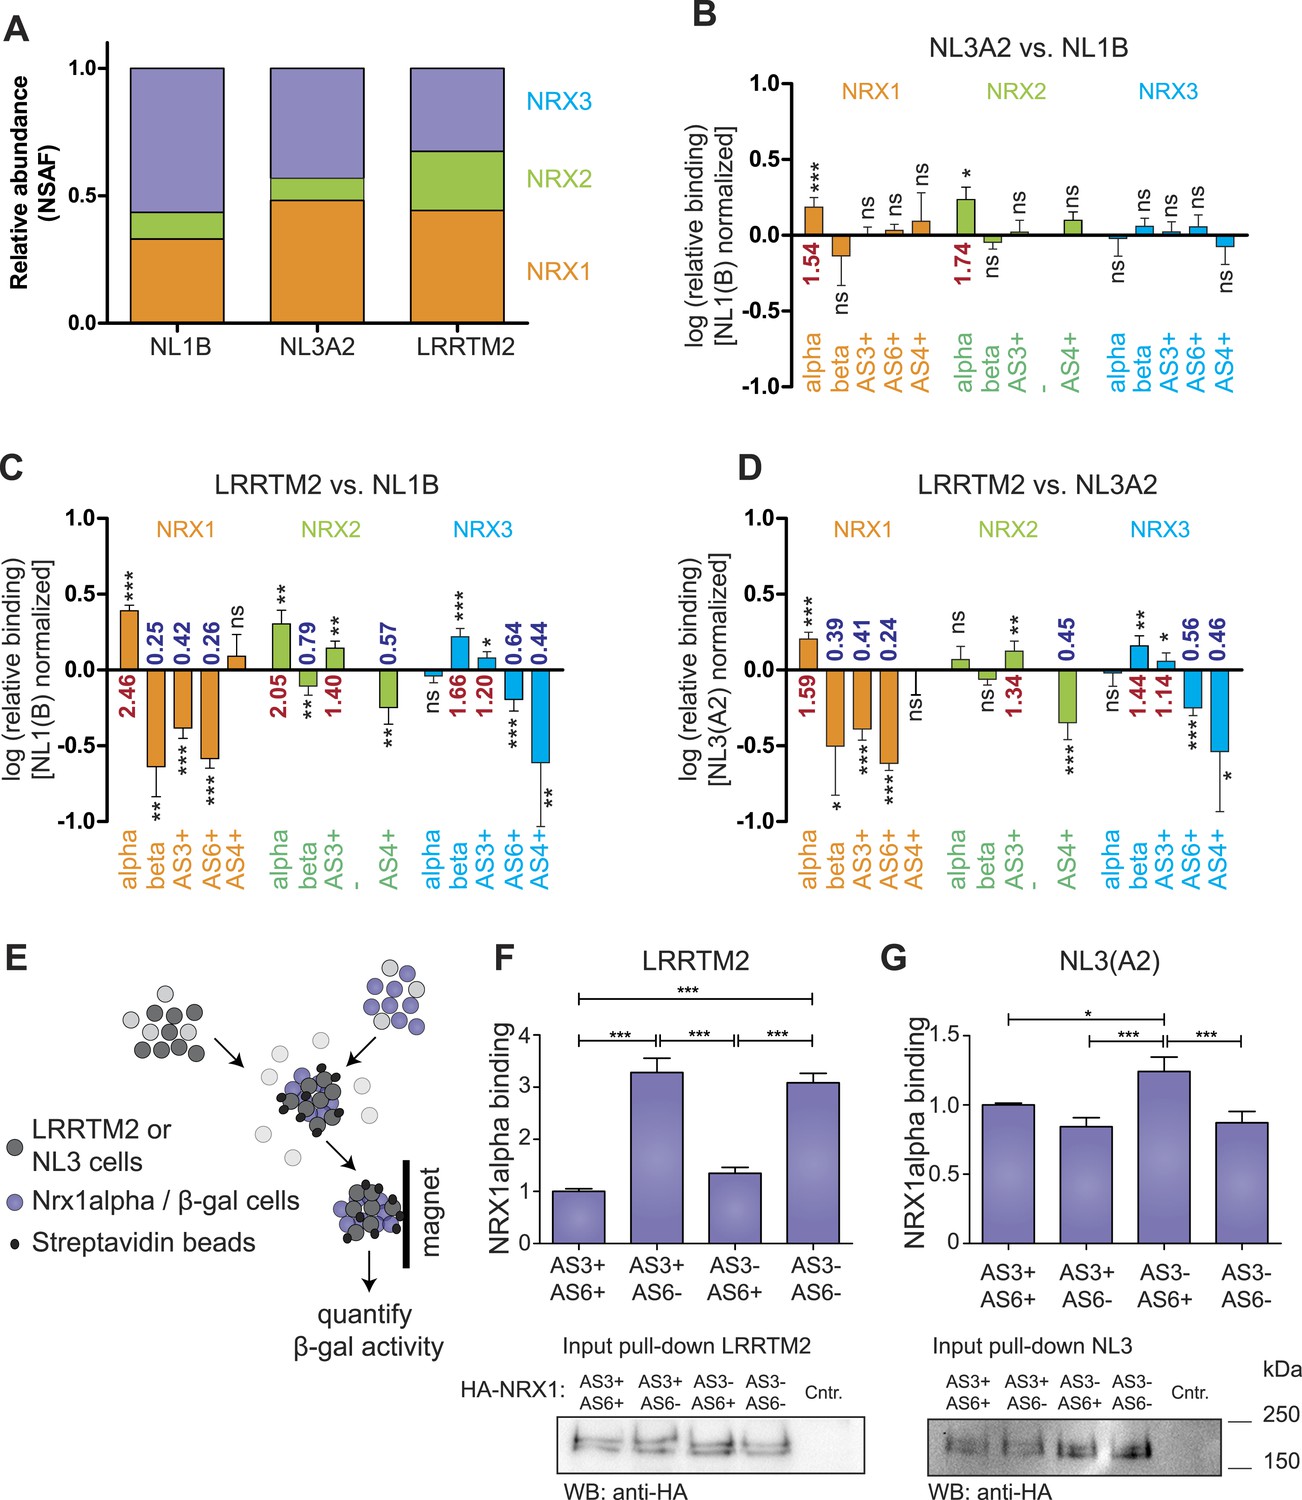
Receptor recognition specificity profiling with splice site-specific SRM assays.
(A) Ratios of normalized spectral abundance factor (NSAF) of NRX1, 2, 3-specific peptides recovered from NL1B, NL3A2, LRRTM2-affinity matrices detected in shotgun experiments. Means of the measurements from three independent experiments are shown. (B–D) Pairwise comparison of neurexin protein variant binding to immobilized ligands determined by SRM. Relative peptide recovery normalized to pan-peptides (for alpha-, beta-, and AS4) or alpha-peptides (for AS3 and AS6) is shown as log10 of the ratio of peptide amounts recovered (NL3A2/NL1B; LRRTM2/NL1B; LRRTM2/NL3A2). n = 6 (measured in duplicates), ±SD. Analysis of significance was performed using nonparametric one-way ANOVA test with Bonferroni's Multiple Comparison Test (*p ≤ 0.05, **p ≤ 0.01, ***p ≤ 0.001). (E–G) Quantitative adhesion assays for NRX1alpha splice variant-expressing cells and LRRTM2 or NL3A2-expressing cells. LRRTM2 and NL3A2 cells co-express a surface biotin tag for isolation using streptavidin-magnetic beads. NRX1-alpha variants co-express beta-Galactosidase for quantification. (n = 4 independent experiments, each with 3 replicates measured in triplicates), ±SD. Pairwise comparison was performed using nonparametric one-way ANOVA test with Bonferroni's Multiple Comparison Test (*p ≤ 0.05, **p ≤ 0.01, ***p ≤ 0.001). The expression level of NRX1-alpha constructs was probed by Western blotting.
Additional files
-
Supplementary file 1
Lists of transitions and limits of detection and quantification for proteotypic peptides used in this study.
(A) Complete list of monitored transitions of peptides for neurexin and other proteins used in this study. (B) Complete list of Limits of detection (LOD) and quantification (LOQ) for peptides derived from in vitro expressed neurexin constructs used for absolute quantification of neurexin isoforms in this study.
- https://doi.org/10.7554/eLife.07794.017
Download links
A two-part list of links to download the article, or parts of the article, in various formats.
Downloads (link to download the article as PDF)
Open citations (links to open the citations from this article in various online reference manager services)
Cite this article (links to download the citations from this article in formats compatible with various reference manager tools)
Quantitative isoform-profiling of highly diversified recognition molecules
eLife 4:e07794.
https://doi.org/10.7554/eLife.07794


