Immune surveillance of the lung by migrating tissue monocytes
- University Pierre et Marie Curie, Sorbonne Universities, France
- Institut national de la santé et de la recherche médicale, U1135, France
- Centre national de la recherche scientifique, ERL 8255, France
- The Roslin Institute, United Kingdom
Figures
Figure 1
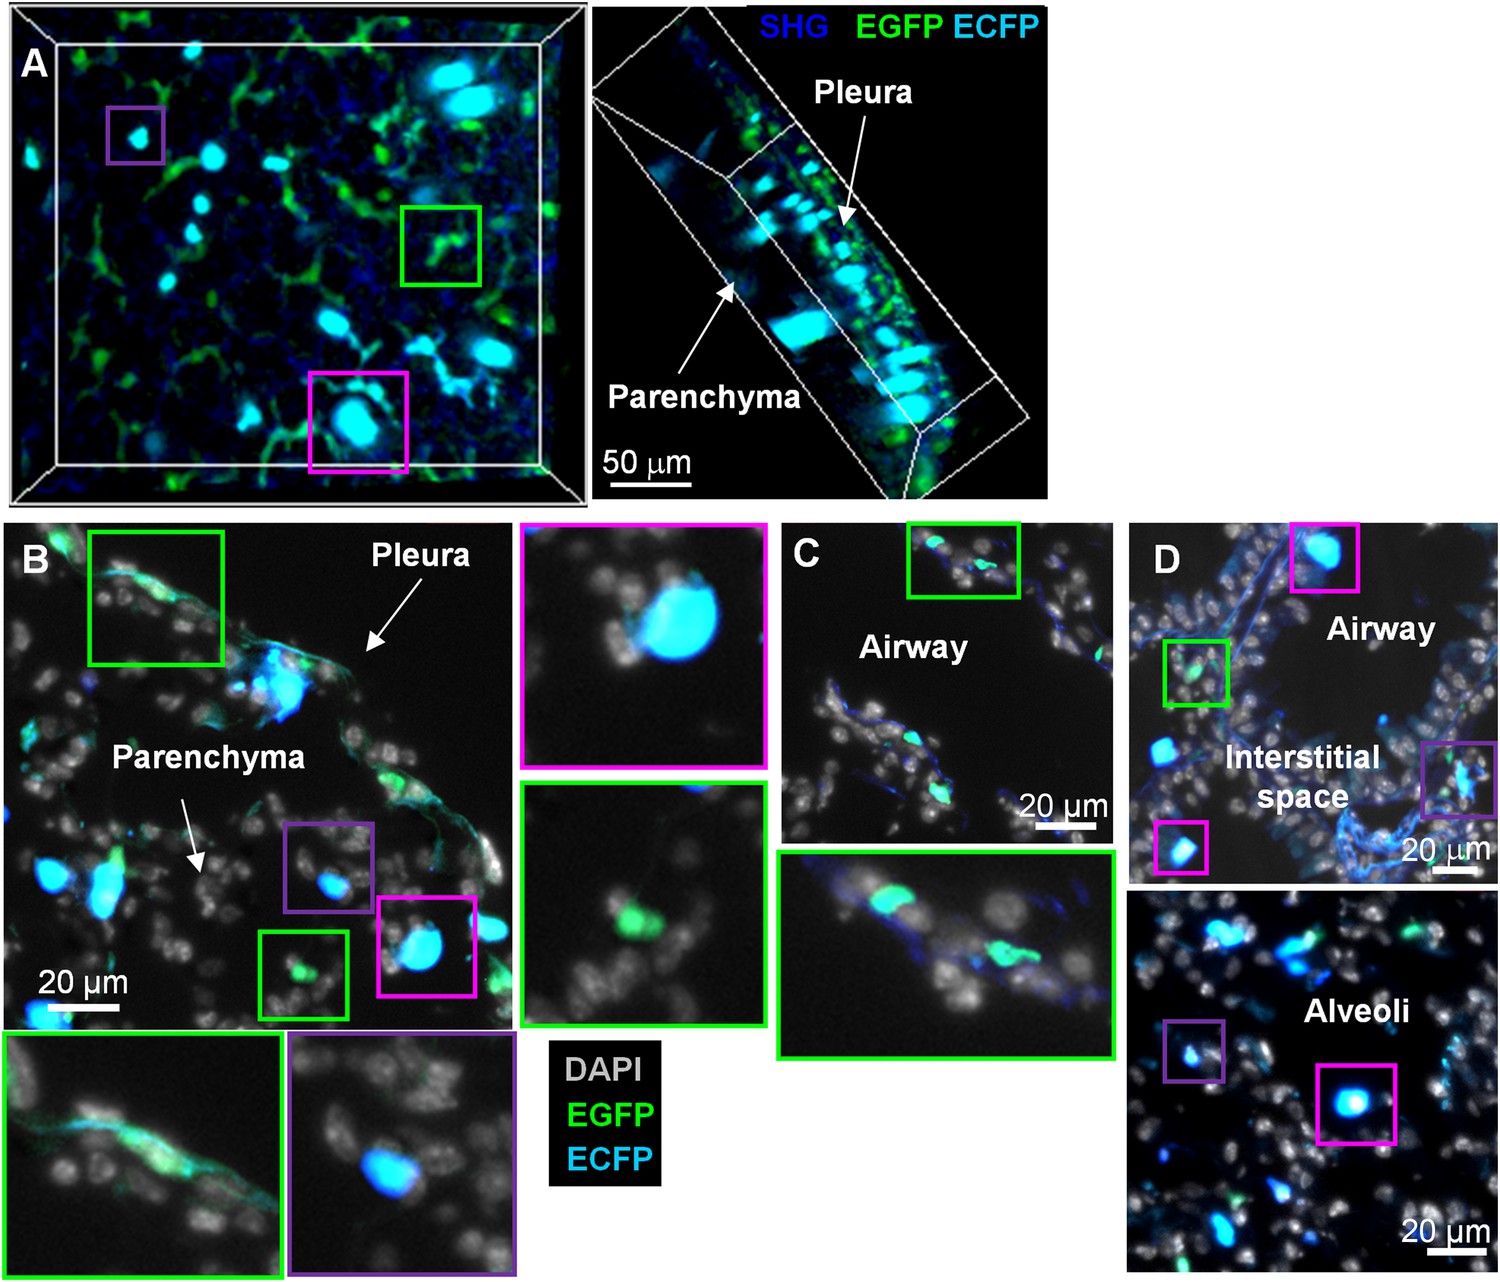
MacBlue×Cx3cr1gfp/+ transgenic mouse discriminates lung mononuclear phagocyte subsets with specific tissue localization.
(A) Front and side views of two-photon laser scanning microscopy (TPLSM) 3D reconstruction from pleura to alveolar space of explanted lung from a MacBlue×Cx3cr1gfp/+ mouse. (B) MacBlue×Cx3cr1gfp/+ mouse lung cryo-section showing lung pleura and parenchyma. (C) MacBlue×Cx3cr1gfp/+ mouse lung cryo-section showing longitudinal view of bronchial airway. (D) MacBlue×Cx3cr1gfp/+ mouse lung cryo-section showing interstitial space near bronchial airways and alveoli. Satellite images represent higher magnification of the corresponding coloured squares for each image. Images are representatives of more than three mice.
Figure 2
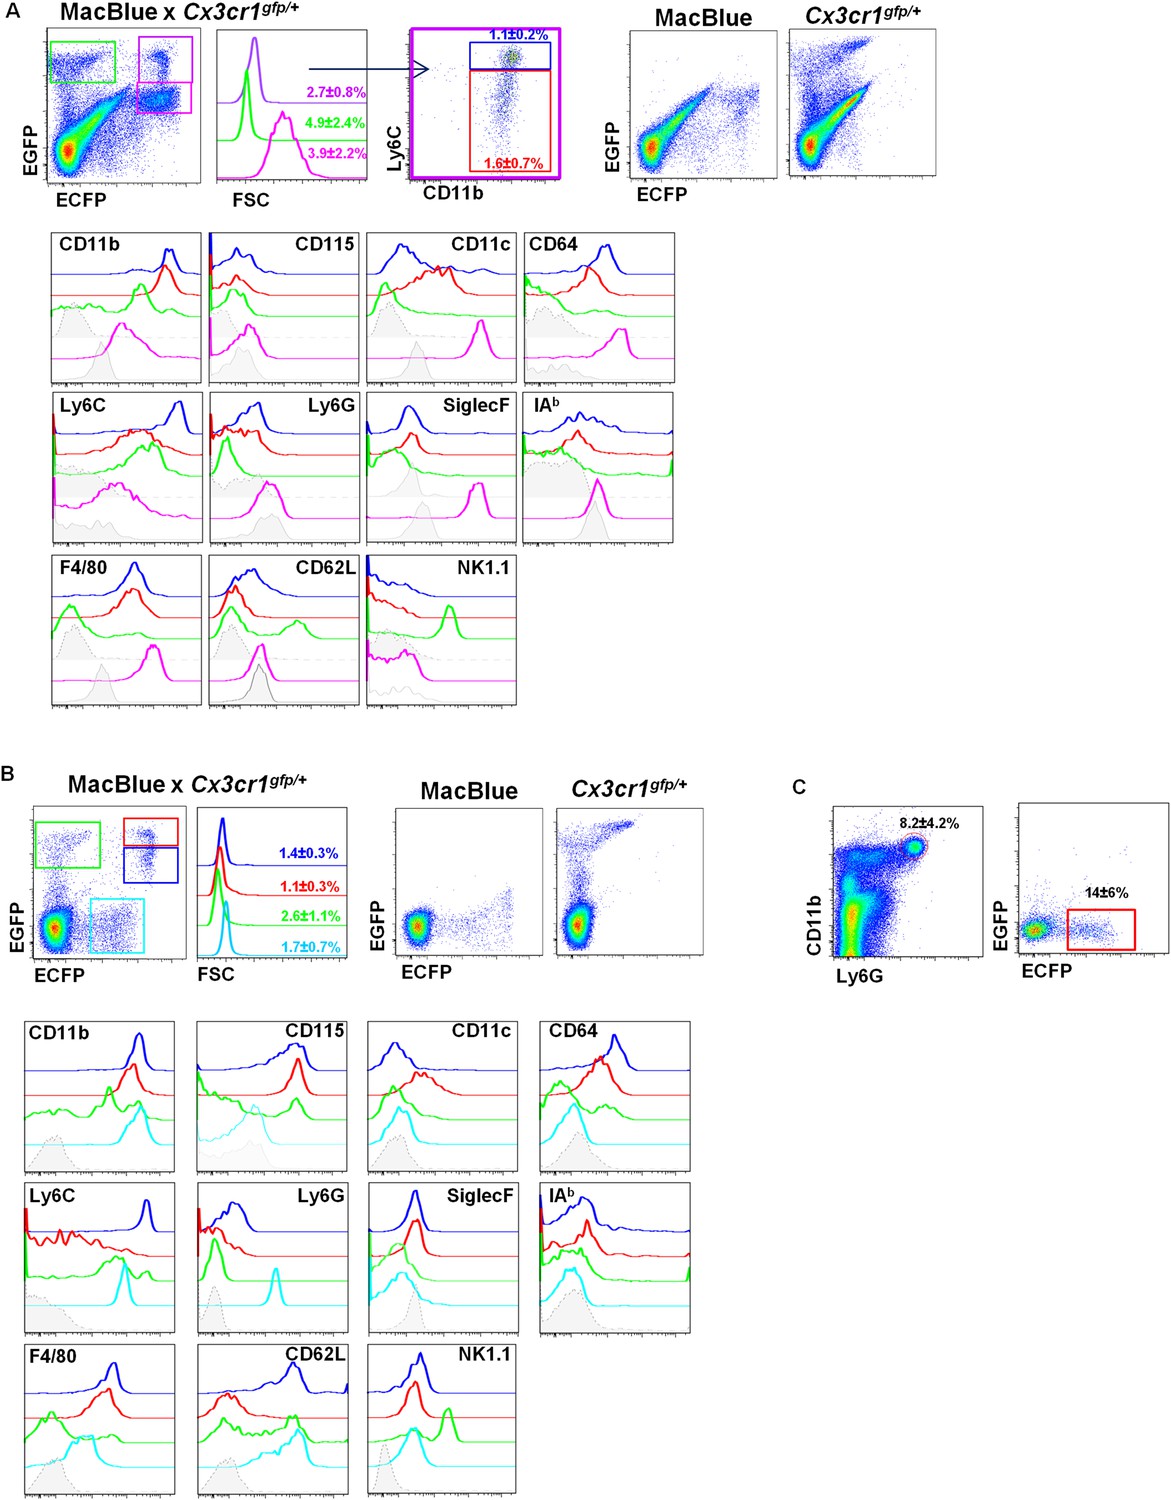
Differential fluorescent reporter expression discriminates mononuclear phagocyte subsets.
ECFP and EGFP expression in (A) the lungs and (B) the blood of MacBlue×Cx3cr1gfp/+ mice. Colour-coded gating identifies the main subsets according to EGFP/ECFP signature. Percentages ± SD of total cells according to colour code are indicated (n = 6 from two independent experiments). Dot plots showing spectral overlap of EGFP and ECFP fluorescence are depicted using separated MacBlue and Cx3cr1gfp/+ transgenic mice. Overlay of histogram plots of indicated markers shows the phenotype of the respective colour-coded gated cell populations. Grey histograms present the FMO (full minus one) signal gated on total monocytes. For lungs, lower grey histograms present the FMO signal gated on alveolar macrophages (AM) (pink gate). For the blood, the cyan subset expressing a low level of ECFP represents blood neutrophils. (C) Dot plots show the intensity and the frequency of ECFP expression on Ly6G+ gated cells in the lungs. Means of percentage ± SD are indicated (n = 6 from two independent experiments).
Figure 3
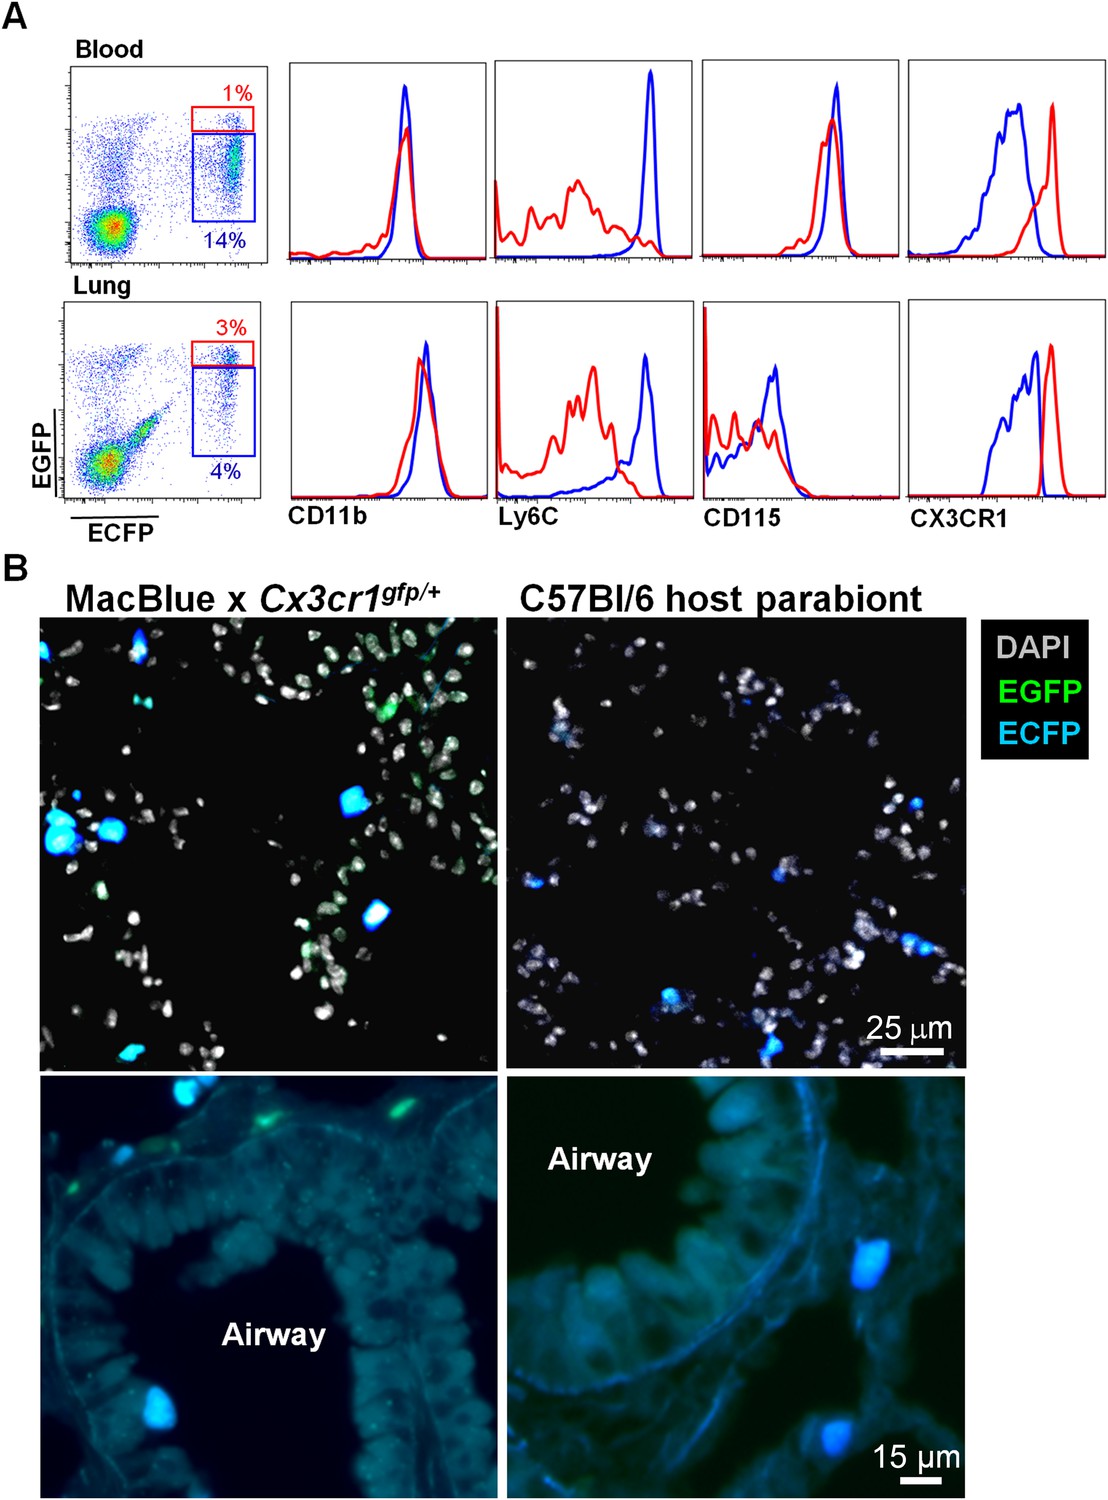
Interstitial ECFP+ cells are monocyte-derived.
(A) Dot plot shows the ECFP/EGFP chimerism in the blood and the lungs of C57Bl6 host parabiont with MacBlue×Cx3cr1gfp/+ mouse. Histograms represent the expression of monocyte markers on the CX3CR1low (blue gate) and CX3CR1high cells (red gate). (B) Pictures compare different magnifications of lung cryo-section from MacBlue×Cx3cr1gfp/+ mouse (left) with C57Bl6 host parabiont with MacBlue×Cx3cr1gfp/+ mouse (right). Up to six parabionts were prepared independently.
Figure 4

CCR2 and CX3CR1 control the accumulation of lung mononuclear phagocytes.
(A) Gating strategy defines (I) Ly6Chigh monocytes, (II) Ly6Clow monocytes, (III) alveolar macrophages (AM), and (IV) CX3CR1+ lung macrophages gated on CD45+CD11b+NK1.1negLy6Gneg cells. Bars represent quantification as a percentage of CD45+ cells of the defined cell subsets from (B) the blood and (C) the lungs in Cx3cr1gfp/+Ccr2rfp/+ (WT), Cx3cr1gfp/gfpCcr2rfp/+ (Cx3cr1−/−), Cx3cr1gfp/+Ccr2rfp/- (Ccr2−/−), and Cx3cr1gfp/gfpCcr2rfp/rfp (dKO) mice. Bars represent means ± SEM (n = 10–13 mice per group from four independent experiments). ANOVA with Bonferroni adjustment was used. Mo, monocytes; MP, mononuclear phagocytes; WT, wild-type.
Figure 5
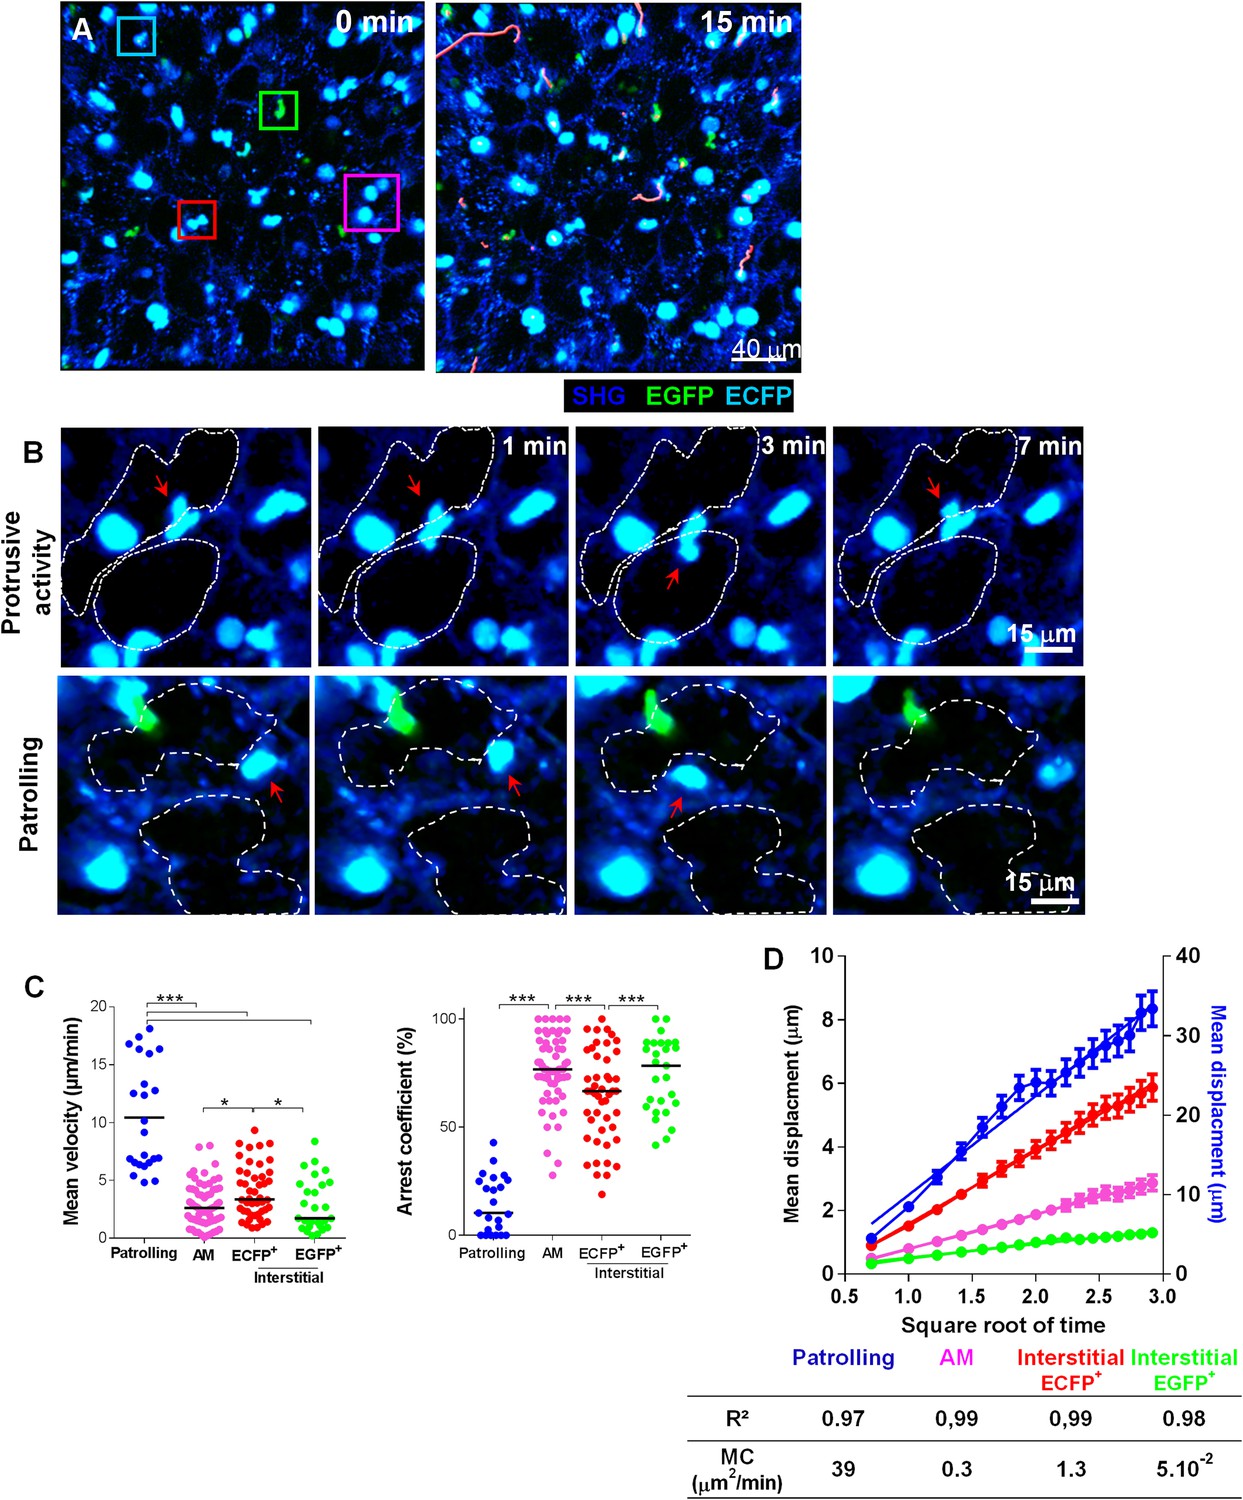
Lung mononuclear phagocytes constitutively survey the entire space of the alveolar areas through distinct migratory patterns.
(A) Time series two-photon laser scanning microscopy (TPLSM) pictures with overlaid tracks of cell motility of the alveolar area from explanted lung. Pink, blue, red, and green squares surround alveolar macrophages, patrolling monocytes, interstitial ECFP+ cells, and interstitial EGFP+ cells, respectively. (B) Time series TPLSM pictures show representative protrusive activity (upper panel) and patrolling (lower panel) behaviour by interstitial ECFP+ cells. (C) Quantification of the mean velocity and arrest coefficient of cell subsets. Bars indicate the medians. Data are pooled from six independent mice. Kruskal–Wallis tests followed by Dunn’s multiple comparison tests were performed. (D) Mean displacement ± SEM as a function of the square root of time for alveolar macrophages (AM) (pink), scanning interstitial ECFP+ cells (red), EGFP+ cells (green) (left scale), and patrolling interstitial ECFP+ cells (blue) (right scale). Coloured lines represent the linear regression of the curves. r2 and motility coefficients (MC = x²/4t) are indicated.
Figure 6
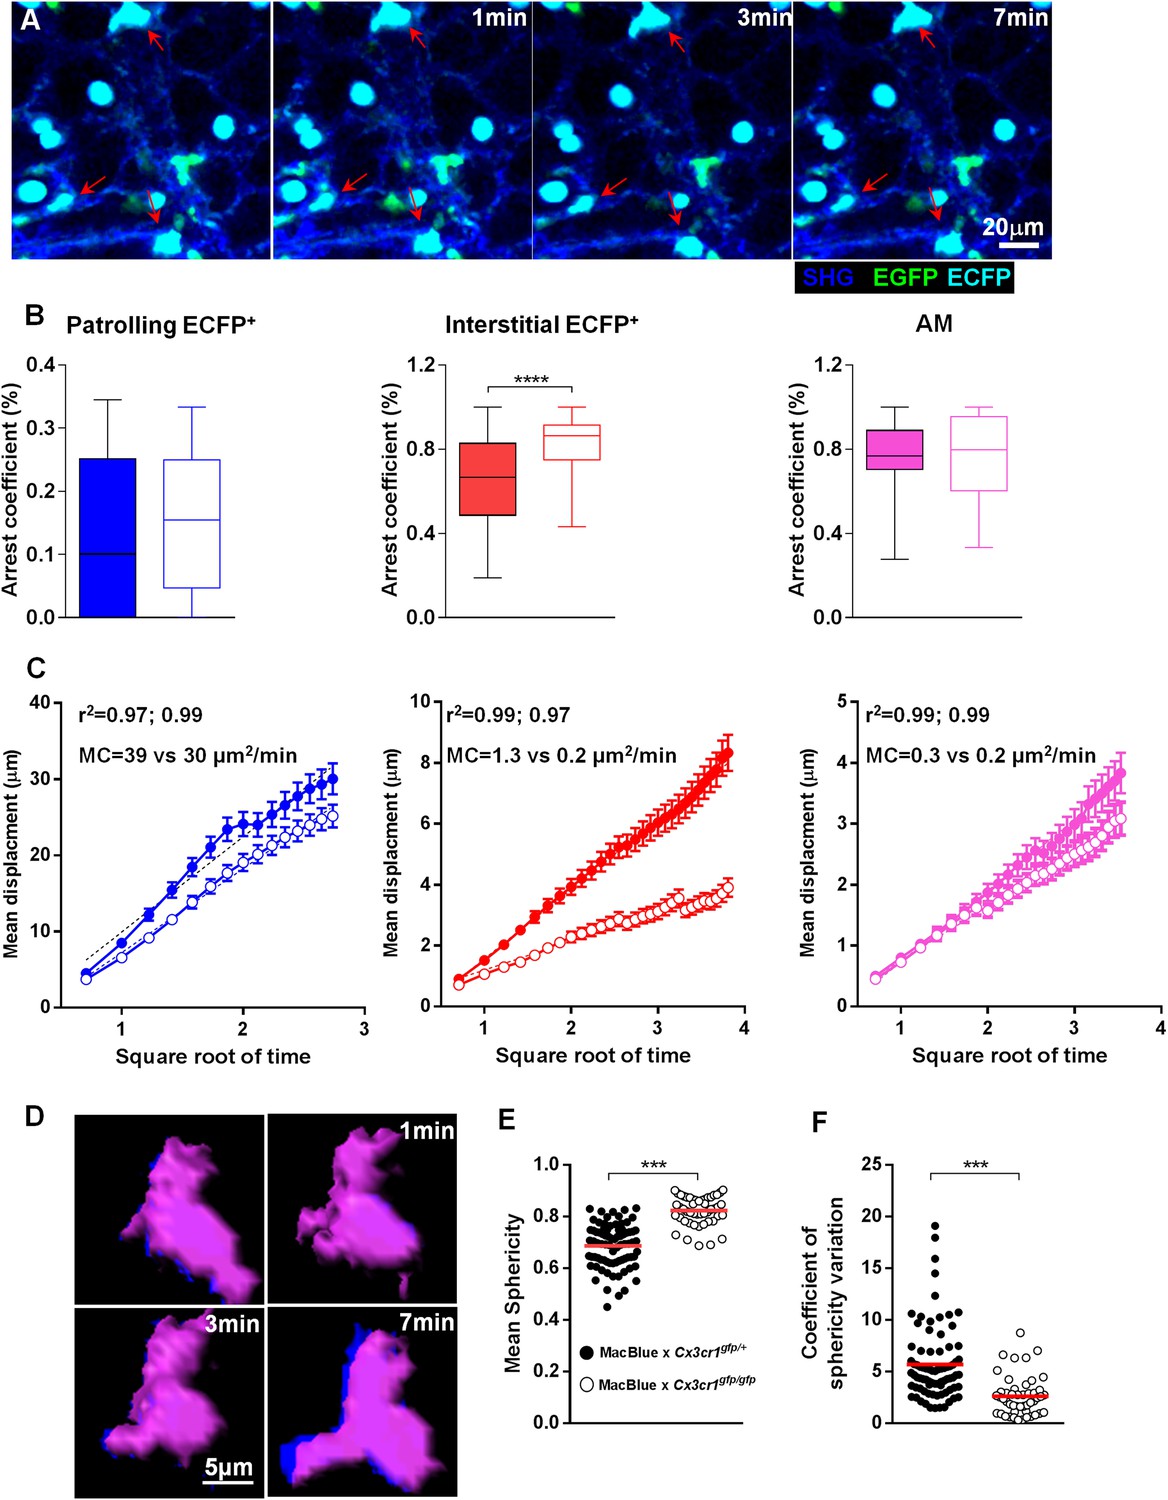
Interalveolar space scanning by monocyte-derived cells is CX3CR1 dependent.
(A) Time series two-photon laser scanning microscopy (TPLSM) pictures show interstitial ECFP+ cell activity in explanted lungs of MacBlue×Cx3cr1gfp/gfp mice. (B) Comparative box and whiskers analysis of the arrest coefficient of indicated cell subsets between MacBlue×Cx3cr1gfp/+ (full boxes) and MacBlue×Cx3cr1gfp/gfp (empty boxes). Mann–Whitney tests were performed. Data are pooled from four to six mice from different experiments. (C) Comparison of the mean displacement ± SEM as a function of the square root of time for patrolling interstitial ECFP+ cells (blue), scanning interstitial ECFP+ cells (red), and alveolar macrophages (AM) (pink) between MacBlue×Cx3cr1gfp/+ (full circles) and MacBlue×Cx3cr1gfp/gfp (empty circles). Coloured dashed lines represent the linear regression of the curves. r2 and motility coefficients (MC = x²/4t) are indicated for the full versus empty circles, respectively. (D) Time series volume rendering image of interstitial ECFP+ cell showing shape modifications. (E) Graph representing the mean sphericity of individual cells determined by measuring sphericity at each time point. Red bars represent the mean. (F) Graph representing the coefficient of sphericity variation for each cell tracked during 10 consecutive planes (5 min). Data are pooled from different movies from at least three different mice in each group from independent days. Student’s t test was used.
Figure 7
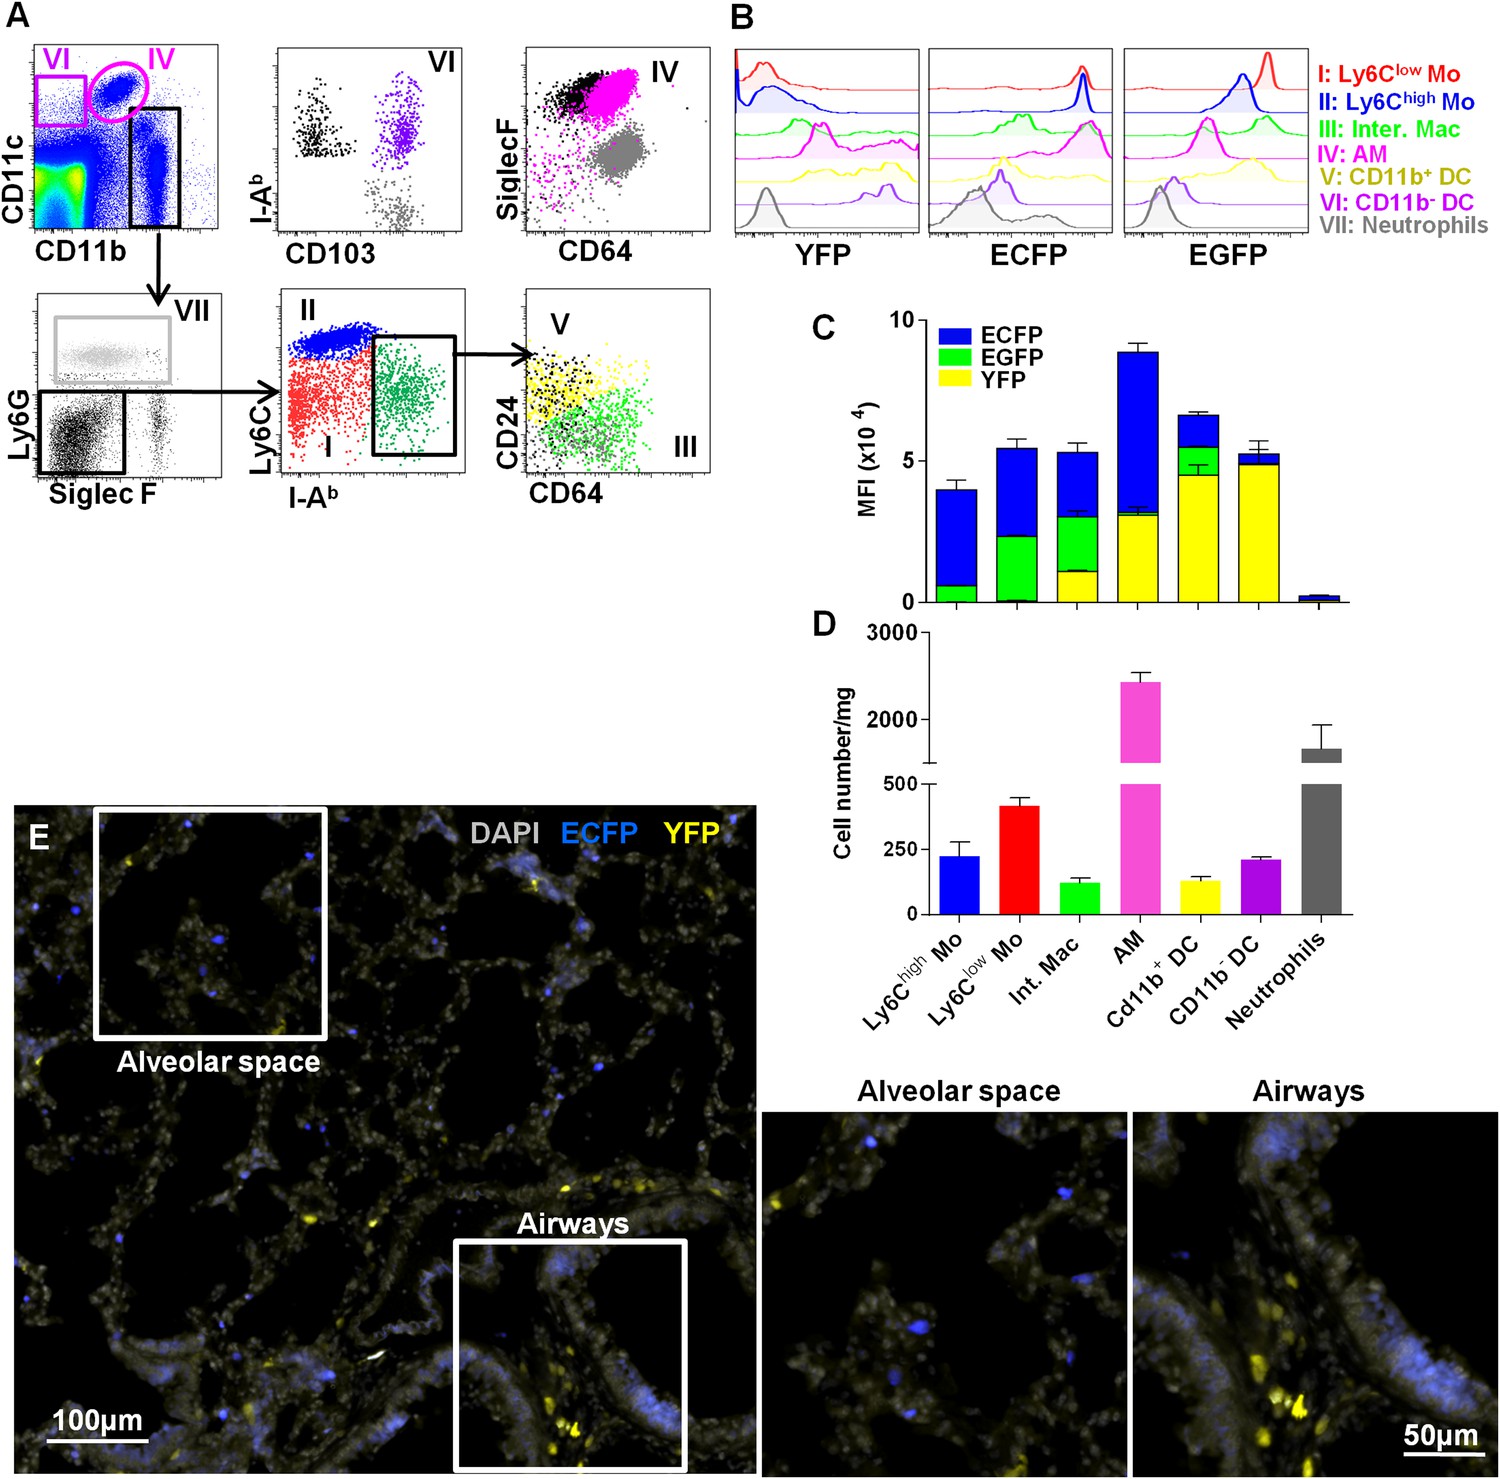
Interstitial monocyte-derived cells localized in the alveolar space whereas lung dendritic cells preferentially localized near large airways.
(A) Dot plots show the gating strategy to define the different lung mononuclear phagocytes and dendritic cells from either MacBlue×Cx3cr1gfp/+ or MacBlue×Itgax-YFP mice. (I) Ly6Clow monocytes (red); (II) Ly6Chigh monocytes (blue); (III) interstitial macrophages (light green); (IV) alveolar macrophages (AM) (pink); (V) CD11b+ DC (yellow); (VI) CD11b− DC (purple); and (VII) neutrophils (grey). For CD11b− DC, AM, CD11b+ DC, and interstitial macrophages (Inter. Mac), FMO (full minus one) signals gated on the specific subset were overlaid in black (for the x-axis) and grey (for the y axis). (B) Histogram plots represent the EGFP, ECFP, and YFP fluorescent reporter expression by each defined subset. YFP and EGFP were measured on individual mice. (C) Mean fluorescent intensity of EGFP (green), ECFP (blue), and YFP (yellow). Bars are mean ± SEM (n = 3 MacBlue×Cx3cr1gfp/+ and MacBlue×Itgax-YFP mice). The experiment has been repeated at least three times. (D) Absolute number of indicated subset per mg of lung (pooled data of n = 11 mice from at least three independent preparations). (E) Wide field image of MacBlue×Itgax-YFP mouse lung cryo-section showing ECFP+ and YFP+ cell distributions in alveolar space and near bronchial airways. Satellite images represent higher magnification of the corresponding white squares. Images are representative of three different mice. Mo, monocytes.
Figure 8
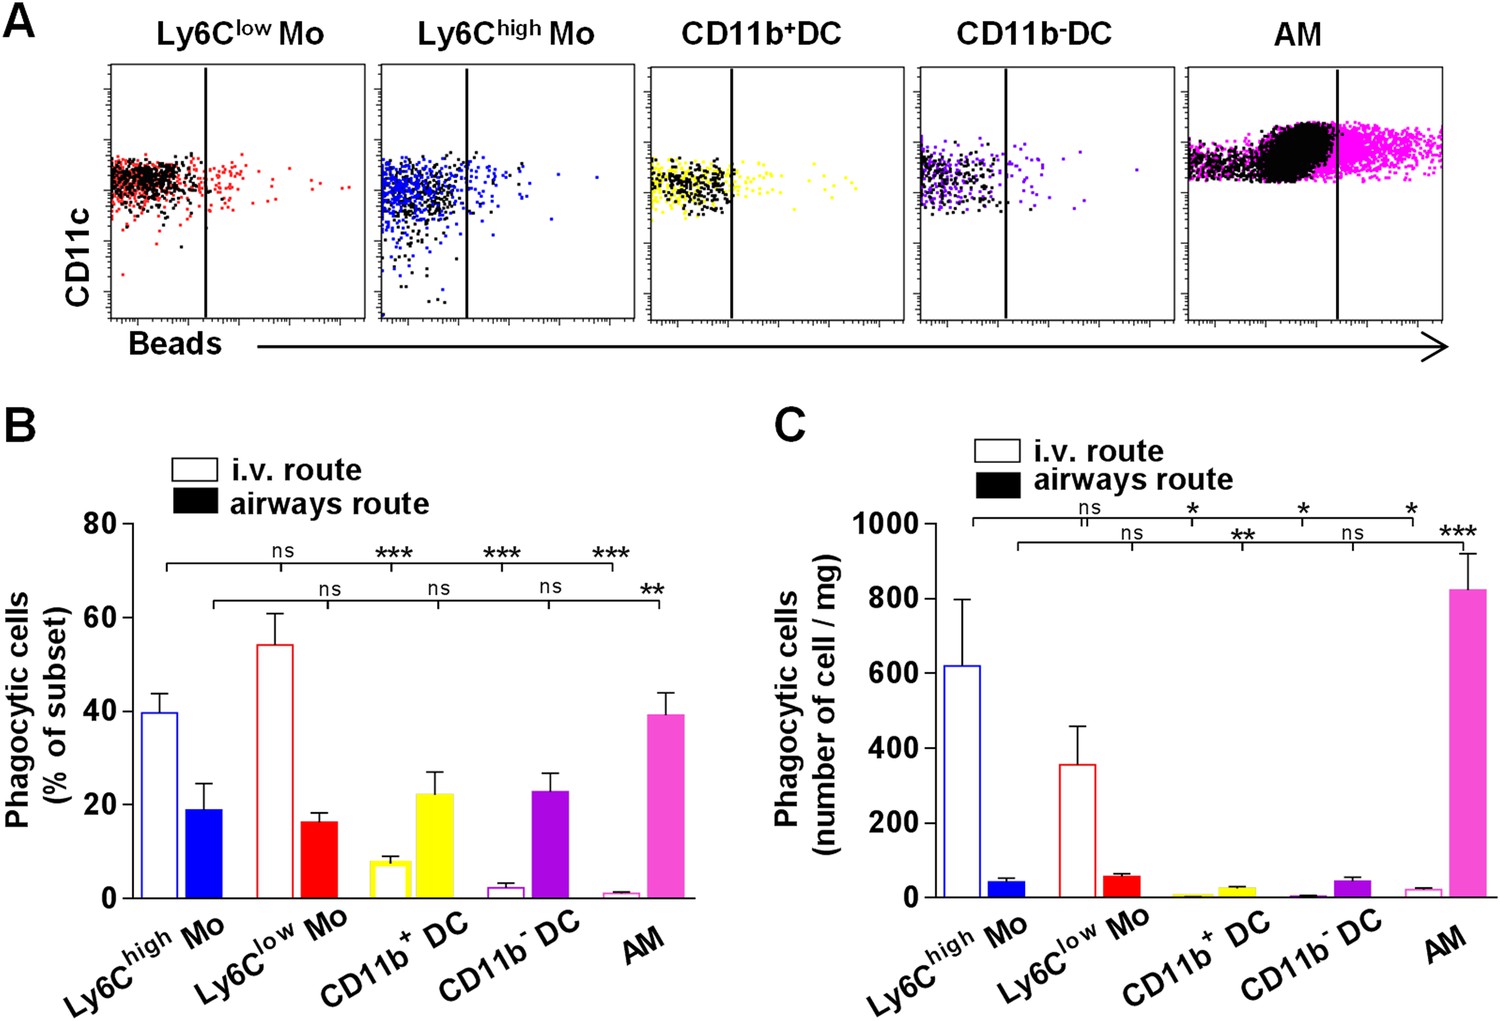
Lung monocyte-derived cells survey both airways and vascular routes whereas dendritic cells (DC) survey only airways.
(A) Representative dot plots showing fluorescent bead uptake by lung mononuclear phagocytes and dendritic cells 4 hr after airway inoculation. Respective control subsets without beads are overlaid in black. (B) Graph represents the frequency of phagocytic cells as a percentage of the respective subset after intravenous injection (empty bars) or airway inhalation (full bars). (C) Graph represents the number of phagocytic cell subset per mg of collected tissue. Bars are mean ± SEM (n = 6–7 mice in each group from two to three different experiments). Student’s t tests were performed to compare the phagocytic activity of all subsets to the referent population of Ly6Clow monocytes. Mo, monocytes.
Figure 9
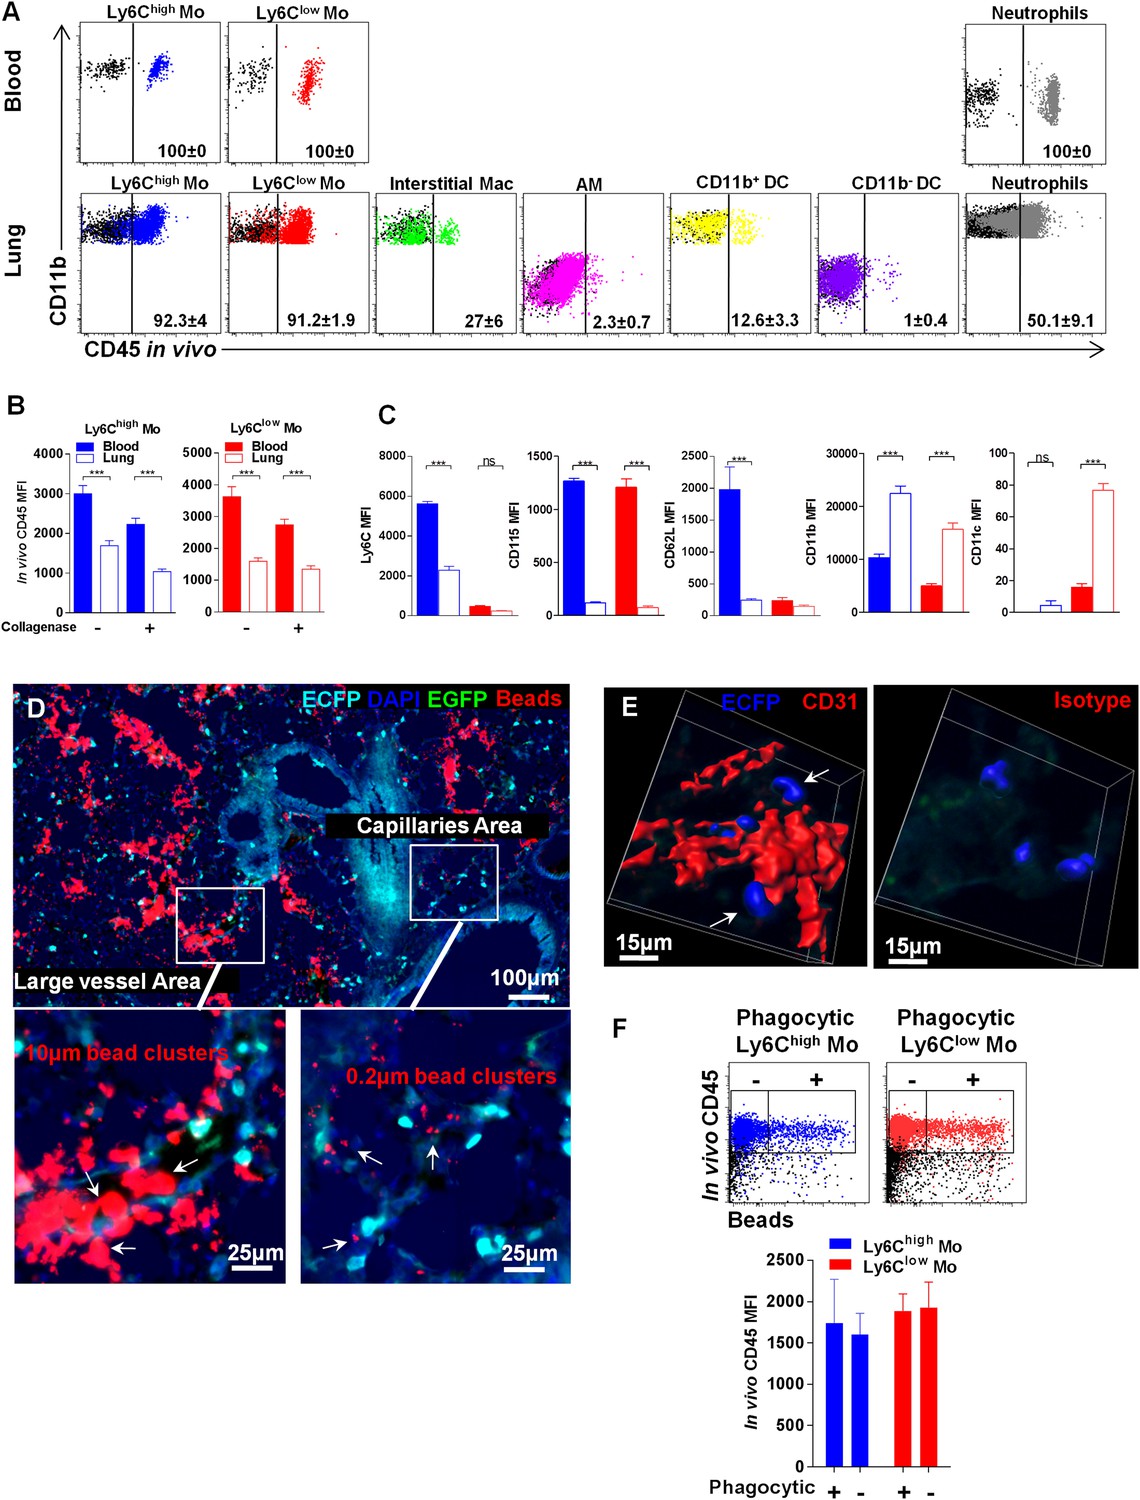
Lung monocyte-derived cells are located at the interface between blood and airways.
(A) Representative overlayed dot plots of in vivo CD45 staining gated on blood and lung mononuclear phagocytes and neutrophils (coloured). CD45 staining control from mice not injected with anti-CD45 are shown (black). Percentage of CD45+ labelled cells according to control are indicated. Mac, macrophages. (B) Bars represent CD45 mean fluorescence intensity (MFI) after in vivo staining in Ly6Chigh (blue) and Ly6Clow (red) monocytes from the blood (full bars) and the lungs (empty bars) with or without enzymatic digestion. (C) Bars represent MFI of the indicated markers gated on Ly6Chigh (blue) and Ly6Clow (red) monocytes from the blood (full bars) and the lungs (empty bars). Bars represent mean ± SEM (n = 10 mice from two different experiments). ANOVA with Bonferroni adjustment was used. (D) MacBlue×Cx3cr1gfp/+ mouse lung cryo-section showing ECFP+ cell localisation in distinct vascular areas, according to bead distribution after intravenous injection of a mixture of 10 µm and 0.2 µm red fluorescent beads. Satellite images represent higher magnification of large vessels containing 10 µm and 0.2 µm beads, indicated by white arrows (left), and capillaries containing only 0.2 µm beads, indicated by white arrows (right). (E) Confocal volume rendering reconstitution image of CD31 (red) (left) or isotype staining (right) showing ECFP+ monocytes (blue) in the vicinity of lung capillaries. Volume rendering reconstruction has been determined according to the isotype staining. (F) Dot plots represent in vivo CD45 staining of Ly6Chigh (blue) and Ly6Clow (red) monocytes 4 hr after intranasal inoculation of fluorescent beads. CD45 staining control from mice not injected with anti-CD45 is shown (black). Bars represent the CD45 MFI gated on phagocytic (beads+) and non-phagocytic (beads−) monocytes. Bars represent mean ± SEM (n = 4 mice from two different experiments).
Author response image 1
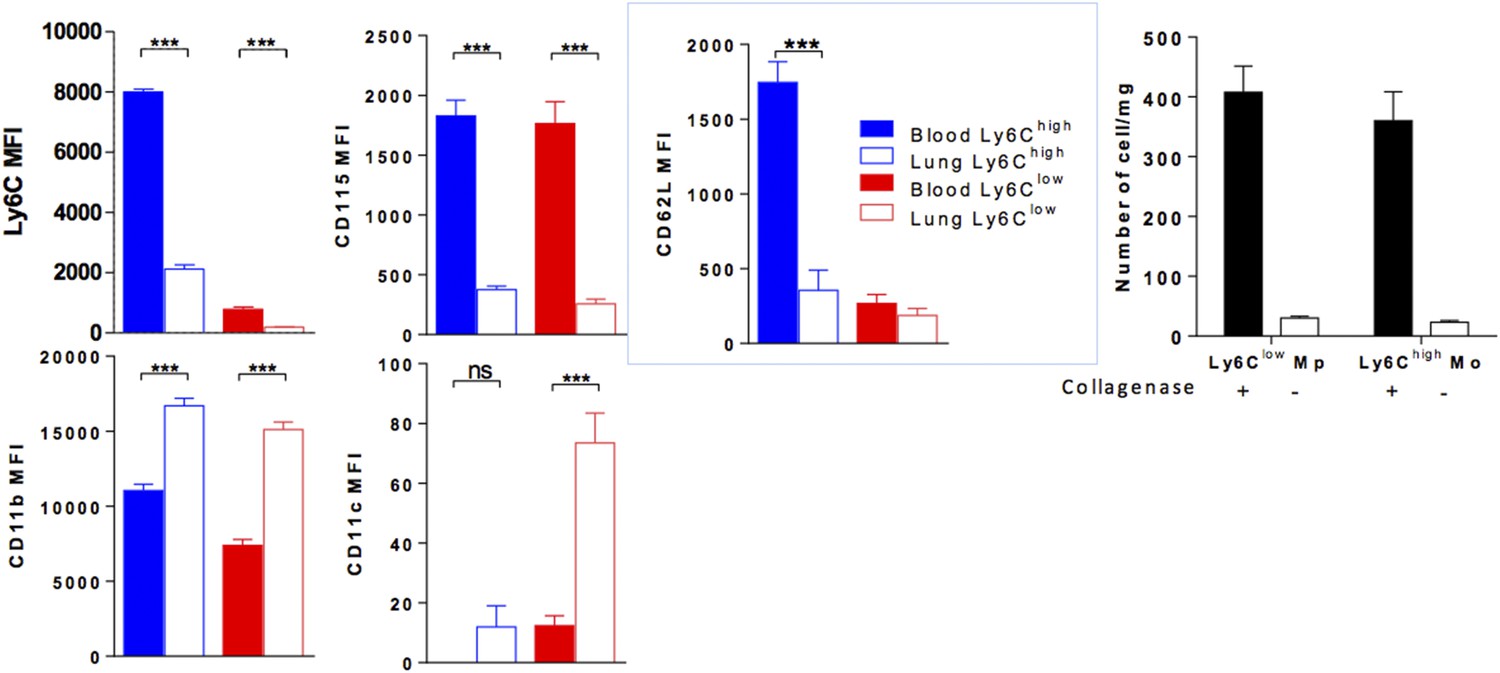
(Left colored panels) MFI of indicated markers expressed by Ly6Chigh Mo (blue) and Ly6Clow MP (red) of the blood (full bar) and the lung (empty bars). Cell preparations were performed in the absence of enzymatic digestion for both blood and lungs. (Right black and white) Bar indicated the number of lung monocytes collected with or without collagenase digestion. (n = 8–10 mice from 2 independent experiments, ANOVA test with Bonferoni adjustment was performed ***, p < 0.001).
Author response image 2
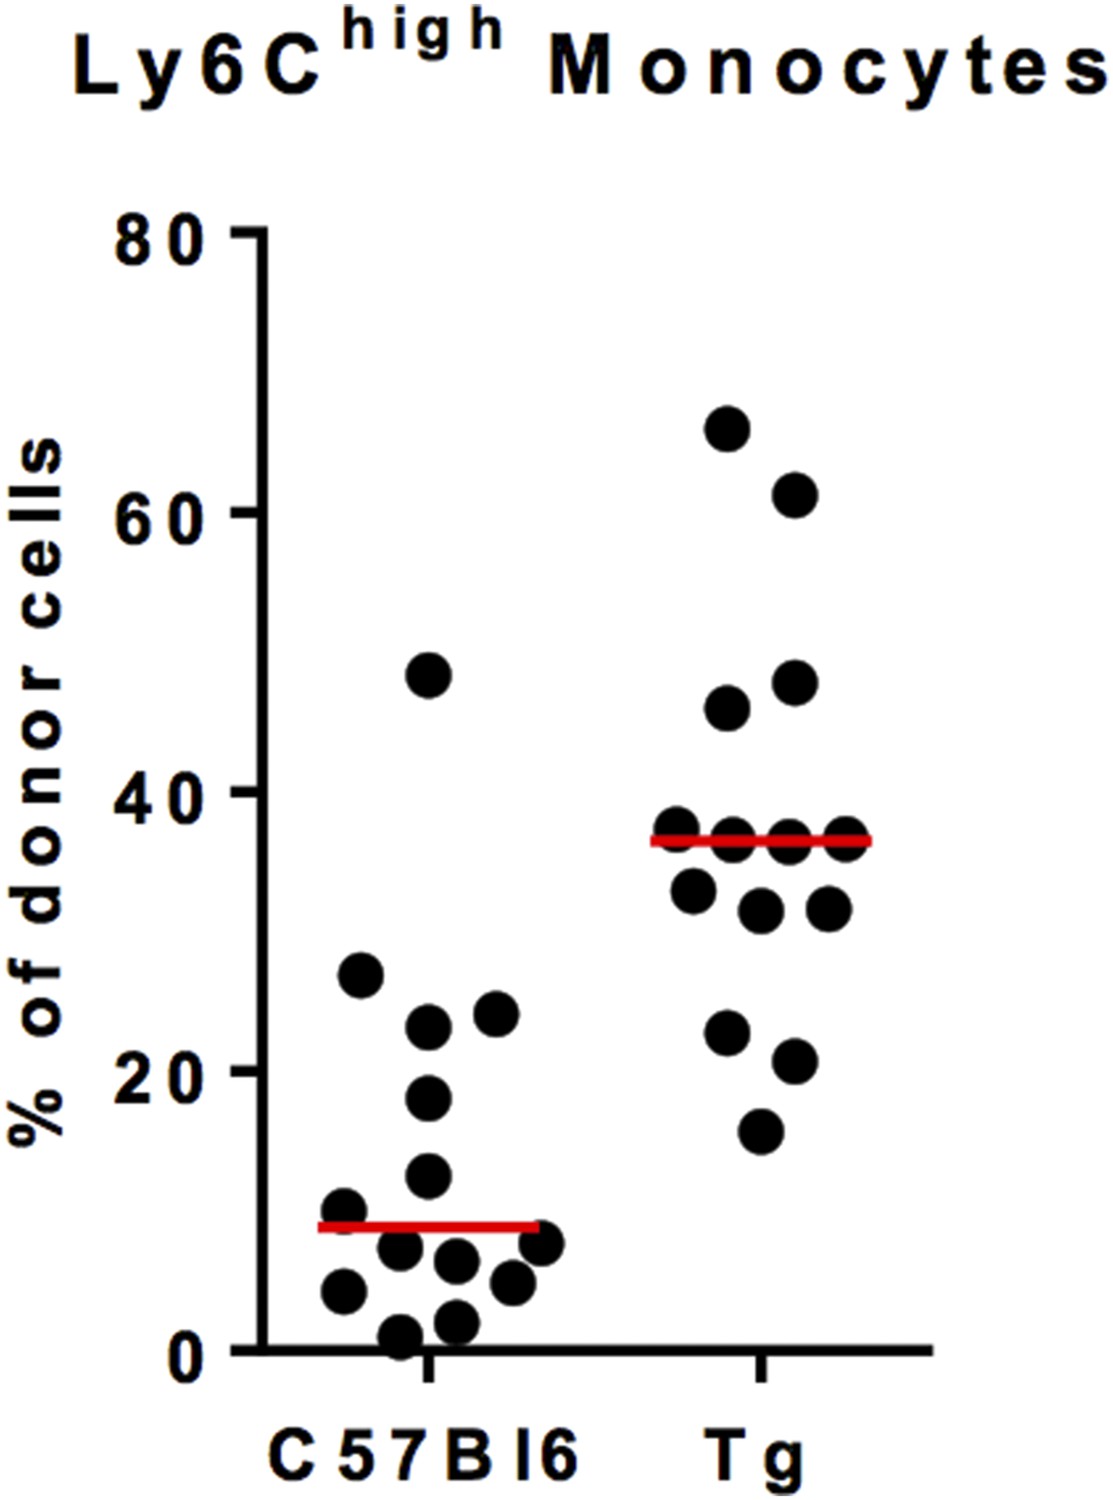
Ly6Chigh monocyte chimerism in the blood of C57Bl6 and MacBluexCx3cr1gfp/+ (Tg) mice at 1 month after parabiosis. Results are expressed in % of Ly6Chigh monocytes from the donor. Each dot represents one host mouse.
Videos
Video 1
Mononuclear phagocyte immune surveillance of alveolar space.
Live 3D imaging of mononuclear phagocyte behaviour in the alveolar space of the lung of a MacBlue×Cx3cr1gfp/+ mouse. The ECFP signal is in cyan, the EGFP signal in green, and the SHG signal (blue) indicates interstitial tissue and defines alveoli. Representative behaviour of alveolar macrophages (AM) (pink squares), patrolling ECFP+ cells (blue squares), interstitial ECFP+ cells (red squares), and interstitial EGFP+ cells (green square) are indicated.
Video 2
Migratory behaviour of lung interstitial ECFP+ cells.
Live 3D imaging shows interstitial monocyte-derived cells scanning with protrusive activity or patrolling in the steady-state alveolar space of the lung of a MacBlue×Cx3cr1gfp/+ mouse. The ECFP signal is in cyan, the EGFP signal in green, and the SHG signal (blue) indicates interstitial tissue, while white line drawings define the limits of alveoli.
Video 3
Migratory behaviour of ECFP+ cells in lung vasculature.
Live 3D imaging shows ECFP+ cells patrolling in the lumen of lung vessels (blue arrow) and interstitial ECFP+ cells in the vicinity of the vasculature. MacBlue×Cx3cr1gfp/+ mice were injected with 2 MkDa rhodamine dextran 1 min before sacrifice. Lungs were imaged rapidly before leakage of the dye into the alveoli. The ECFP signal is in cyan, the EGFP signal in green, lung capillaries and vessels are in red, and the SHG signal is in blue.
Video 4
Alveolar macrophage surveillance of the alveolar lumen.
Live high-resolution 3D imaging of alveolar macrophages (indicated by pink arrows) in the alveoli of a MacBlue×Cx3cr1gfp/+ mouse. The ECFP signal is in cyan, the EGFP signal in green, and the SHG signal in blue.
Video 5
Monocyte patrolling behaviour in host parabiont.
Live 3D imaging shows interstitial monocyte patrolling behaviour (blue square) in the steady-state alveolar space of the lung of a C57Bl6 host parabiont with MacBlue×Cx3cr1gfp/+ mouse 1 month after parabiosis.
Video 6
Monocyte cell scanning behaviour in host parabiont.
Live 3D imaging shows interstitial monocyte protrusive activity (red squares) in the steady-state alveolar space of the lung of a C57Bl6 host parabiont with MacBlue×Cx3cr1gfp/+ mouse 1 month after parabiosis.
Video 7
Migratory behaviour of lung interstitial monocyte-derived cells in a MacBlue×Cx3cr1gfp/gfp mouse.
Live 3D imaging shows reduced interstitial monocyte-derived cell protrusive activity (red square) in the steady-state alveolar space of the lung of a MacBlue×Cx3cr1gfp/gfp mouse. The ECFP signal is in cyan, the EGFP signal is in green, and the SHG signal (blue) indicates interstitial tissue and defines alveoli.
Video 8
Confocal 3D reconstruction of lung ECFP+ cells in the lung vasculature.
High resolution 3D reconstruction shows lung ECFP+ cell localisation at the interface between lung capillaries and airways. Lung vasculature has been stained with anti-CD31 (right) or isotype control (left) in a lung cryo-section of a MacBlue×Cx3cr1gfp/+ mouse. Acquisition parameters were identical for both stainings. Volume rendering parameters were determined based on CD31 isotype staining. Capillaries are in red and ECFP+ cells are in blue.
Tables
Table 1
Comparative phenotype of mononuclear phagocyte (MP) subsets in the blood and the lung
| Tissue | Lung | Blood | Lung | Blood | Lung | Blood | Lung |
|---|---|---|---|---|---|---|---|
| CD11b | ++ | ++ | ++ | ++ | ++/+ | ++/+ | + |
| CD115 | − | ++ | − | ++ | −/− | +/− | − |
| Ly6C | ++ | ++ | +/− | +/− | +/+ | +/+ | − |
| Ly6G | − | − | − | − | − | − | − |
| F4/80 | + | + | + | + | ++/− | +/− | ++ |
| CD64 | + | + | + | + | ++/− | +/− | ++ |
| CD11c | − | − | + | + | +/− | +/− | ++ |
| IAb | +/− | +/− | +/− | +/− | +/− | −/− | − |
| CD62L | + | ++ | − | − | −/+ | +/+ | − |
| NK1.1 | − | − | − | − | −/++ | −/++ | − |
| SiglecF | − | − | − | − | −/− | −/− | ++ |
| Conclusion | Ly6Chigh Mo | Ly6Clow Mo | Cx3cr1+ MP/NK | AM | |||
-
The relative expression of the markers for each subset in the blood and the lungs are compared and specific subsets defined according to the phenotype. ++ : high expression; + : positive expression; − : below FMO (full minus one) signal. AM, alveolar macrophages; NK, natural killer.
Download links
A two-part list of links to download the article, or parts of the article, in various formats.
Downloads (link to download the article as PDF)
Open citations (links to open the citations from this article in various online reference manager services)
Cite this article (links to download the citations from this article in formats compatible with various reference manager tools)
Immune surveillance of the lung by migrating tissue monocytes
eLife 4:e07847.
https://doi.org/10.7554/eLife.07847


