Functional effects of distinct innervation styles of pyramidal cells by fast spiking cortical interneurons
- National Institute for Physiological Sciences, Japan
- The Graduate University for Advanced Studies, Japan
- Japan Science and Technology Agency, Japan
- Kyushu University, Japan
- Kyoto University, Japan
- South Valley University, Egypt
- Doshisha University, Japan
- Research Centre Jülich, Germany
- RWTH/University Hospital Aachen, Germany
- JARA Translational Brain Medicine, Germany
Figures
Figure 1 with 2 supplements

Paired recording between FS basket cells and CCS pyramidal cells in L5.
(A–E) Structural and functional characteristics of pair CS28. (A) The presynaptic FS basket cell shows a fast-spiking (upper left) and the postsynaptic pyramidal cell displayed a regular spiking behavior (bottom left). Average IPSC response in the pyramidal cell (bottom right) to a single action potential (AP) elicited in the FS basket cell (upper right). (B) Reconstruction of the neuron pair. The somatodendritic domain of the presynaptic FS basket cell is shown in blue, the axonal arborization in sky blue, and the somatodendritic domain of the postsynaptic pyramidal cell in gray. (C) Illustration showing the number and distribution of putative synaptic contacts (red dots) established by the FS basket cell axonal collaterals on the soma and proximal dendritic segments of the postsynaptic pyramidal cell. (D) LMg of the pyramidal cell soma with its inhibitory synaptic contacts (arrows) illustrated in (C). (E) Dendrogram of the pyramidal cell basal dendrites with putative contact sites (red bars). (F–I) Structural and functional characteristics of pair CS45. (F) Averaged IPSC in the pyramidal cell in response to a single AP in the presynaptic FS basket cell. (G) Reconstruction of the cell pair. Same color code as in (B) with putative synaptic contacts (red). Note that synaptic contacts were exclusively found on dendrites. (H) Low power LMg of the cell pair showing a putative contact site on the basal dendrite of the pyramidal cell (red arrow) by the FS basket cell axon at low (left panel) and high (right panel) magnification. (I) Dendrogram of the basal dendrites of the pyramidal cell with ten LM-identified contact sites (red bars). (J) Summary diagram showing the number and distribution of putative contacts established on postsynaptic pyramidal cell somata and dendrites for all investigated pairs. The corresponding averaged IPSC peak amplitude is shown on the right. For the last two pairs, no IPSCs were detectable despite the presence of LM-identified contact sites.
Figure 1—figure supplement 1
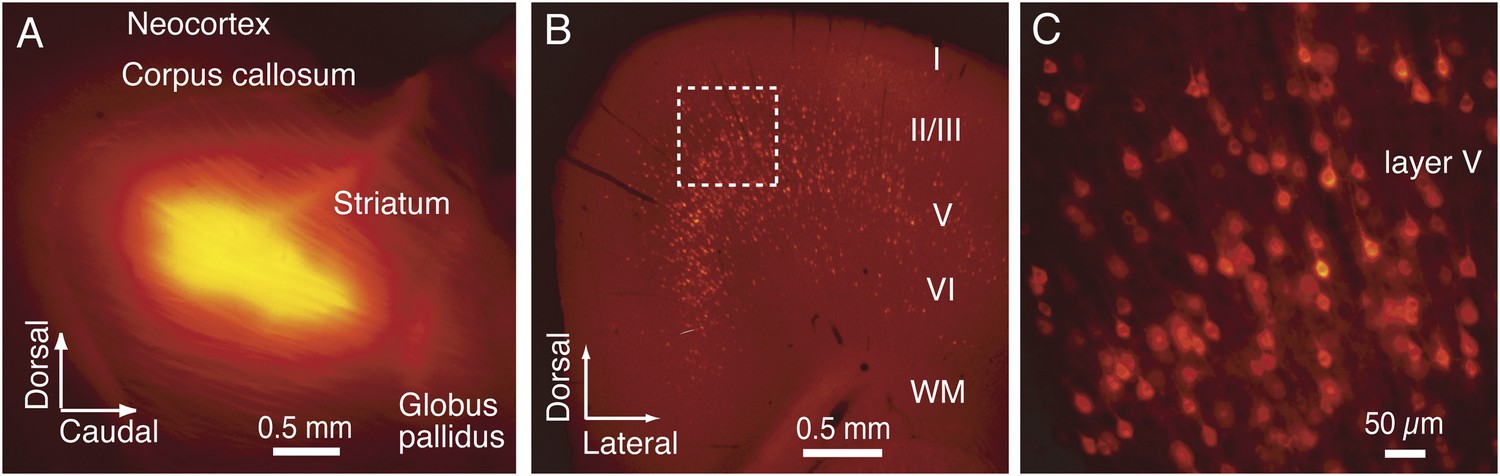
The CCS pyramidal cell in layer V identified by retrograde fluorescent tracer.
(A) Cholera toxin subunit B (CTB) conjugated with Alexa-555 fluorescent tracer was injected into contra-lateral striatum. (B) Subpopulation of layer V pyramidal cells were labeled with the fluorescent tracer in ipsilateral cortex. (C) Enlarged image of dotted square in (B). Many labeled layer V CCS pyramidal cells are seen.
Figure 1—figure supplement 2
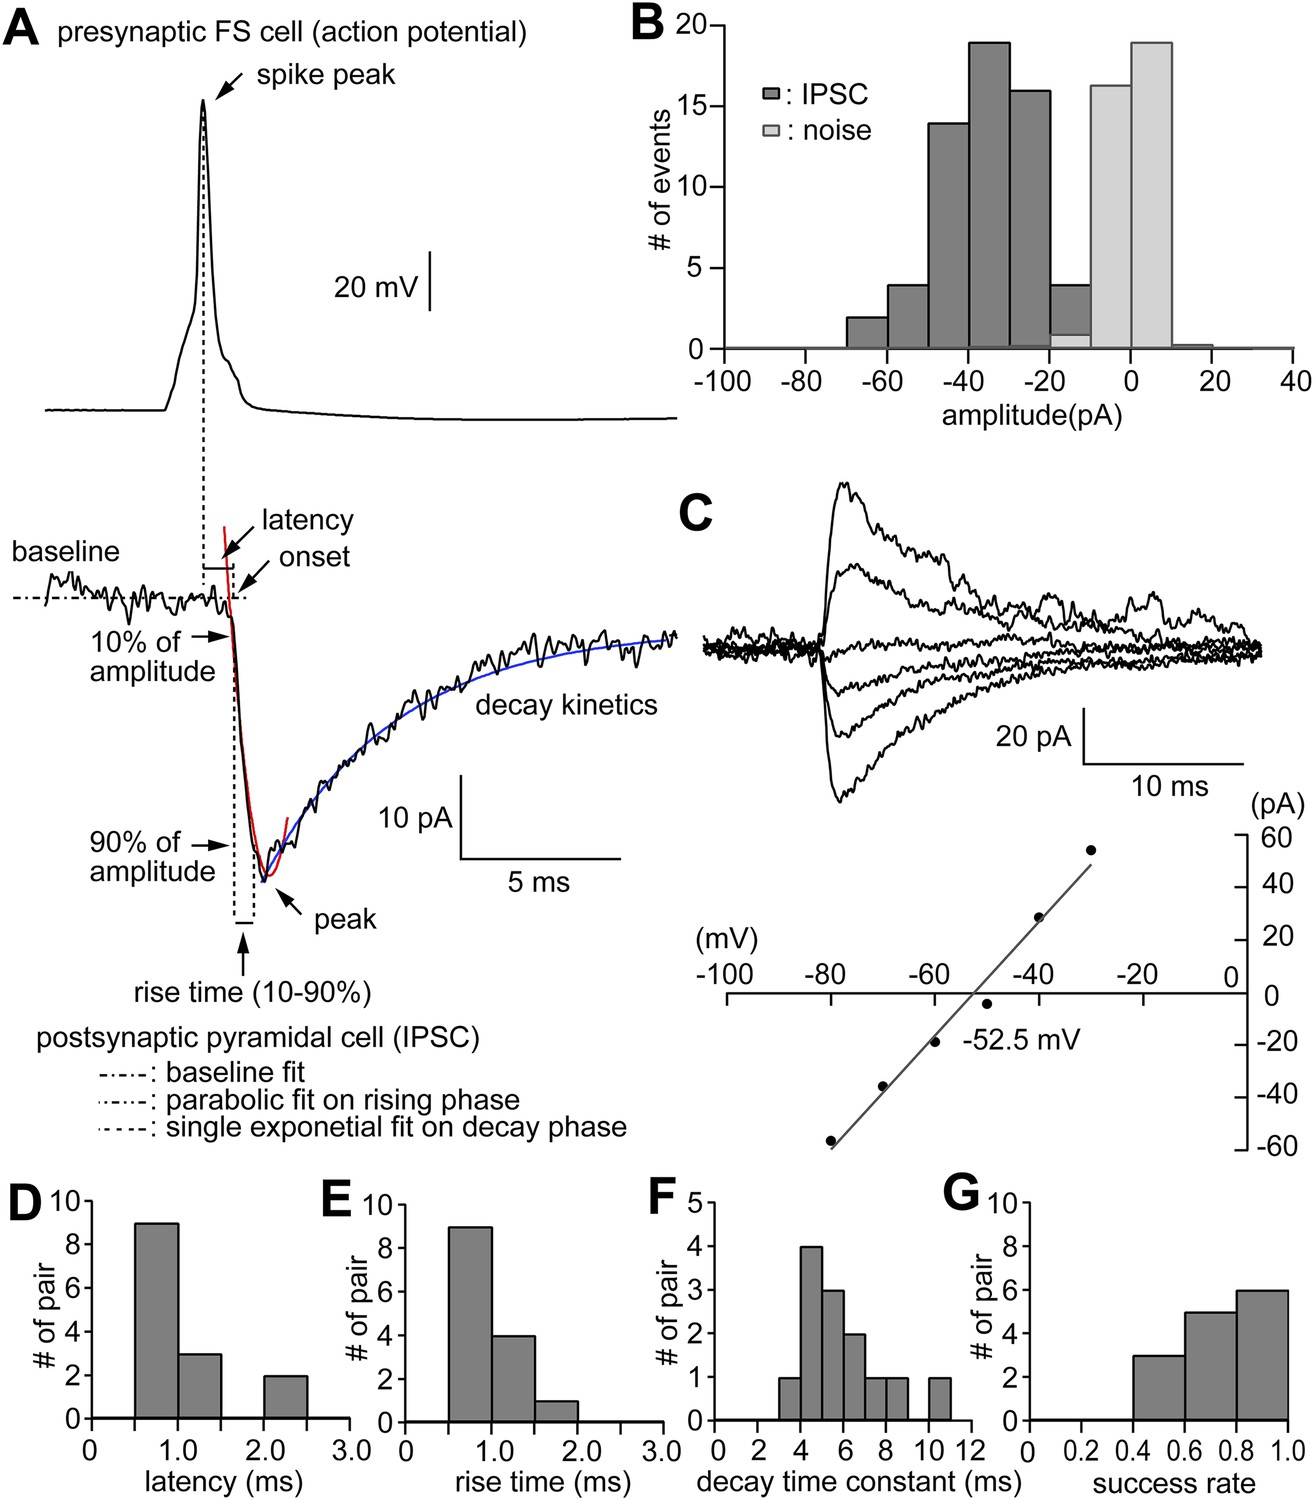
Physiological properties of IPSCs evoked in CCS pyramidal cells in L5.
(A) Presynaptic FS basket cell AP (upper trace) and the evoked IPSC in the postsynaptic pyramidal cell (bottom trace). Fitting lines are shown for rise (red) and decay phase (blue) of the IPSC. (B) Bar histogram of the distribution of IPSC amplitudes and noise. (C) IPSC traces at several somatic holding membrane potential (upper traces) and corresponding diagram showing the relationship of the IPSC amplitude to membrane potential (bottom). The reversal potential is −52.5 mV determined by a linear fit of the plot. (D) Bar histograms of the latency, (E) rise time, (F) decay time constant, and (G) success rates of IPSCs in the postsynaptic pyramidal cell.
Figure 2 with 2 supplements
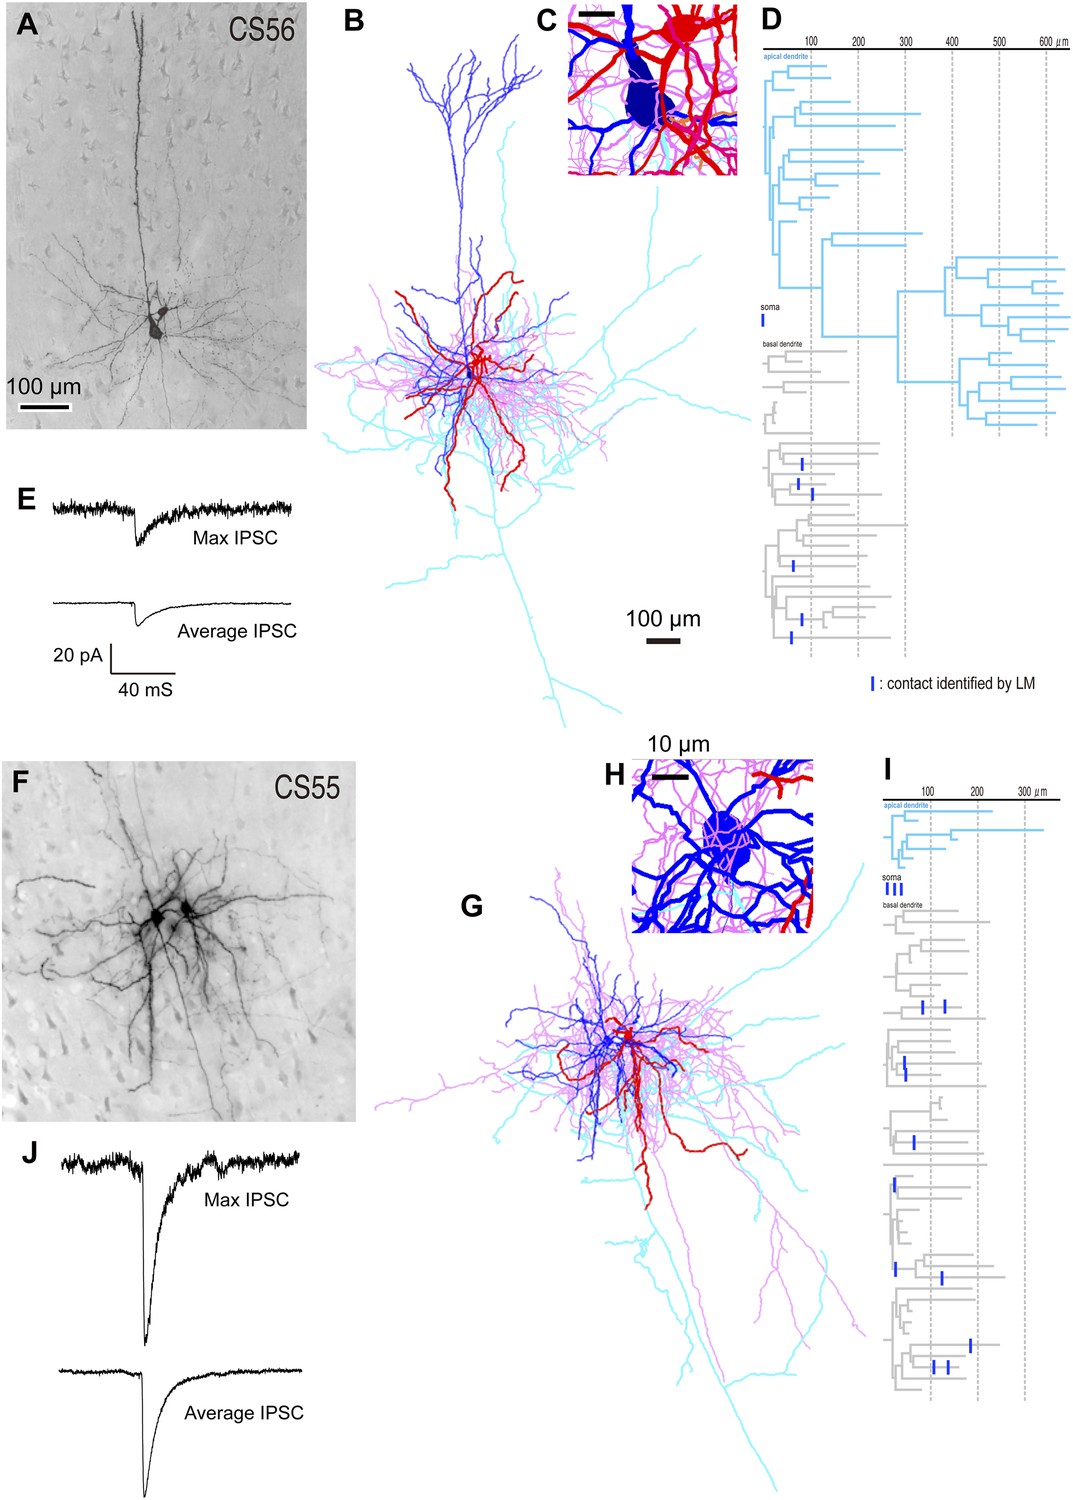
Different unitary IPSCs induced by single FS basket cells in L5 CCS pyramidal cells.
(A) Pre-synaptic basket cell and post-synaptic pyramidal cell. Light micrograph (LMg) of the CS56 pair. (B) Reconstruction of pyramidal cell soma-dendrites (blue) and axon (sky blue), basket cell soma-dendrites (red) and axon (pink). (C) Close-up of the pyramidal cell soma. Scale, 10 µm. (D) Putative synaptic contacts (blue bars) shown on dendrogram including basal (gray) and apical (sky blue) dendrites. (E) Maximum (upper) and averaged (lower) IPSCs evoked by single FS basket cell spikes. (F) Pre-synaptic basket cell and post-synaptic pyramidal cell. LMg of CS55 pair. Scale is as in A. (G) Reconstruction. Scale is as in B. (H) Close-up of the pyramidal cell soma. (I) Dendrogram with putative synaptic contact sites (blue bar). (J) Maximum (upper) and average (lower) IPSCs evoked by single FS basket cell APs. Scale is as in E.
Figure 2—figure supplement 1
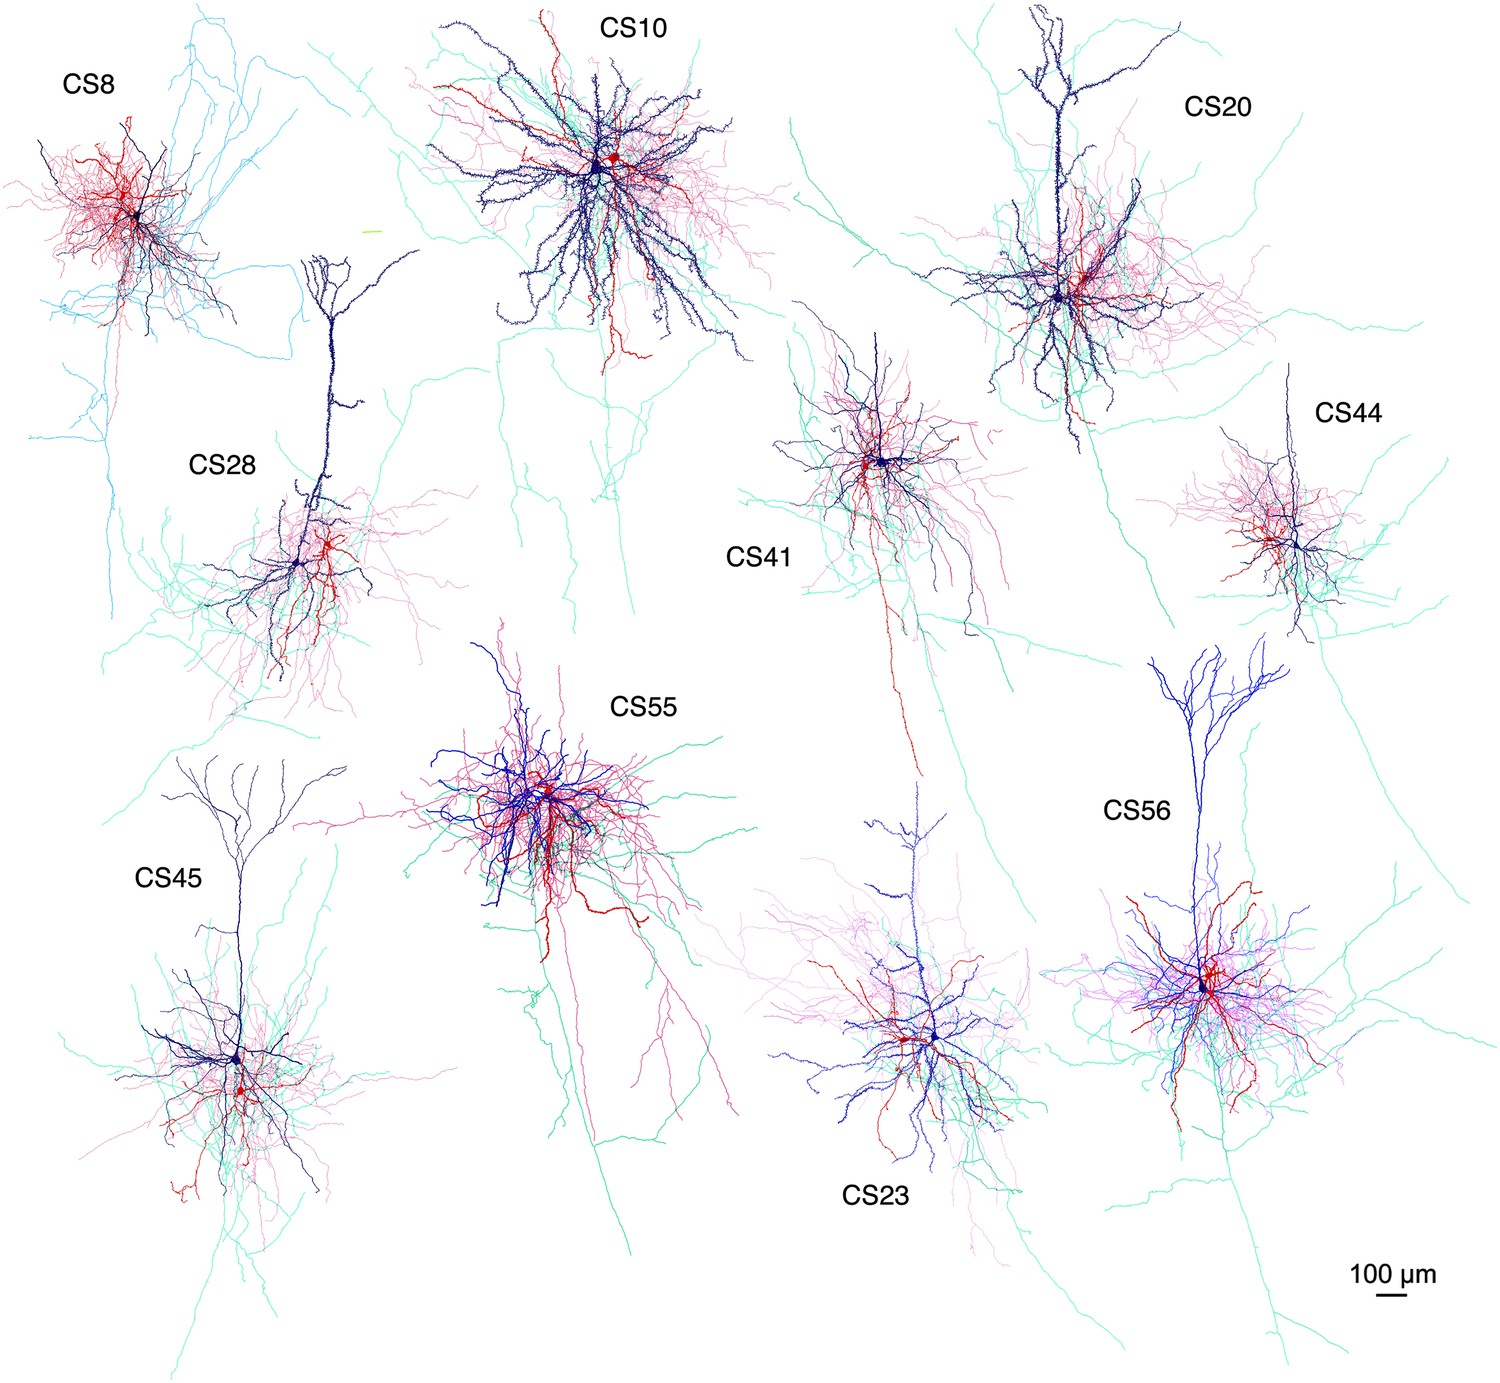
Drawings of the paired recording between FS basket cells and CCS pyramidal cells in L5.
Postsynaptic pyramidal cell soma-dendrites (blue) and axon (sky blue), presynaptic FS basket cell soma-dendrites (red) and axon (pink) are shown.
Figure 2—figure supplement 2
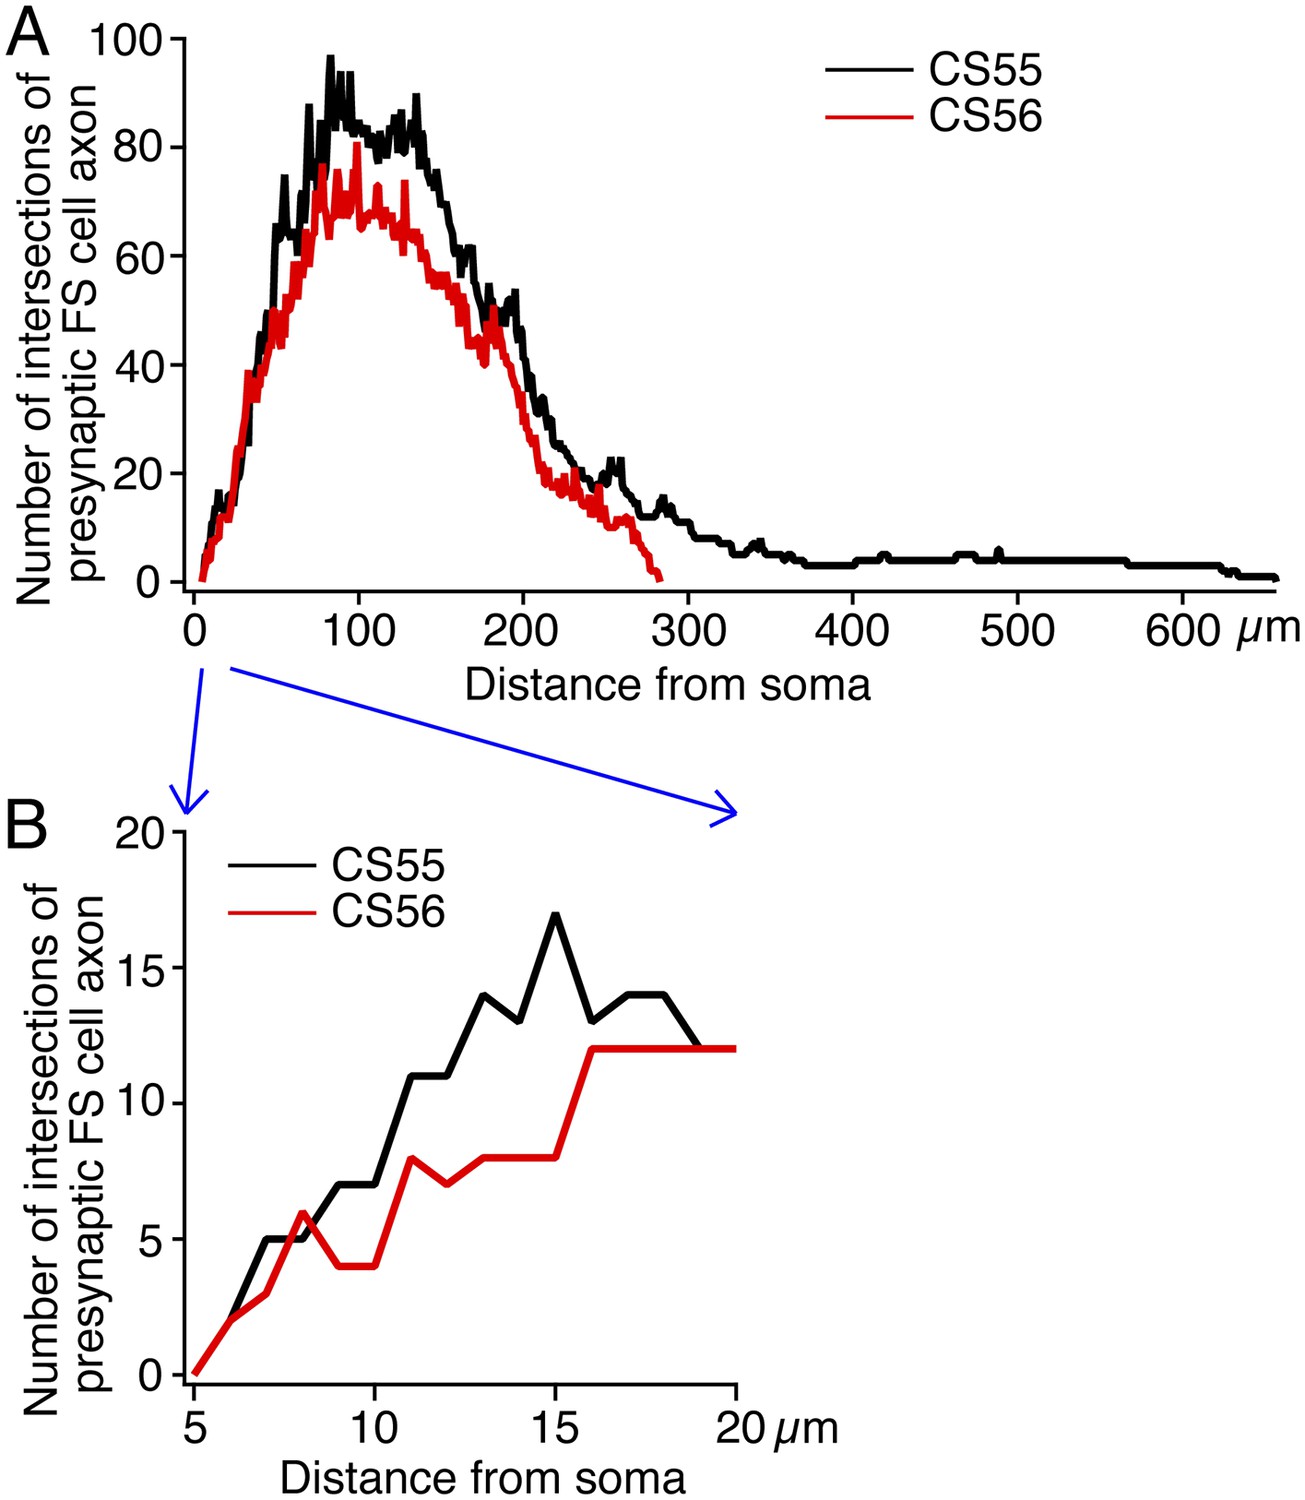
Sholl analysis of presynaptic FS basket cell axon to postsynaptic CCS pyramidal cell soma center.
(A) Sholl analysis showing entire FS basket cell axon fiber arborization. (B) The initial part up to 20 µm from soma is enlarged to see the difference in terms of the intersections between the cell pairs.
Figure 3 with 1 supplement
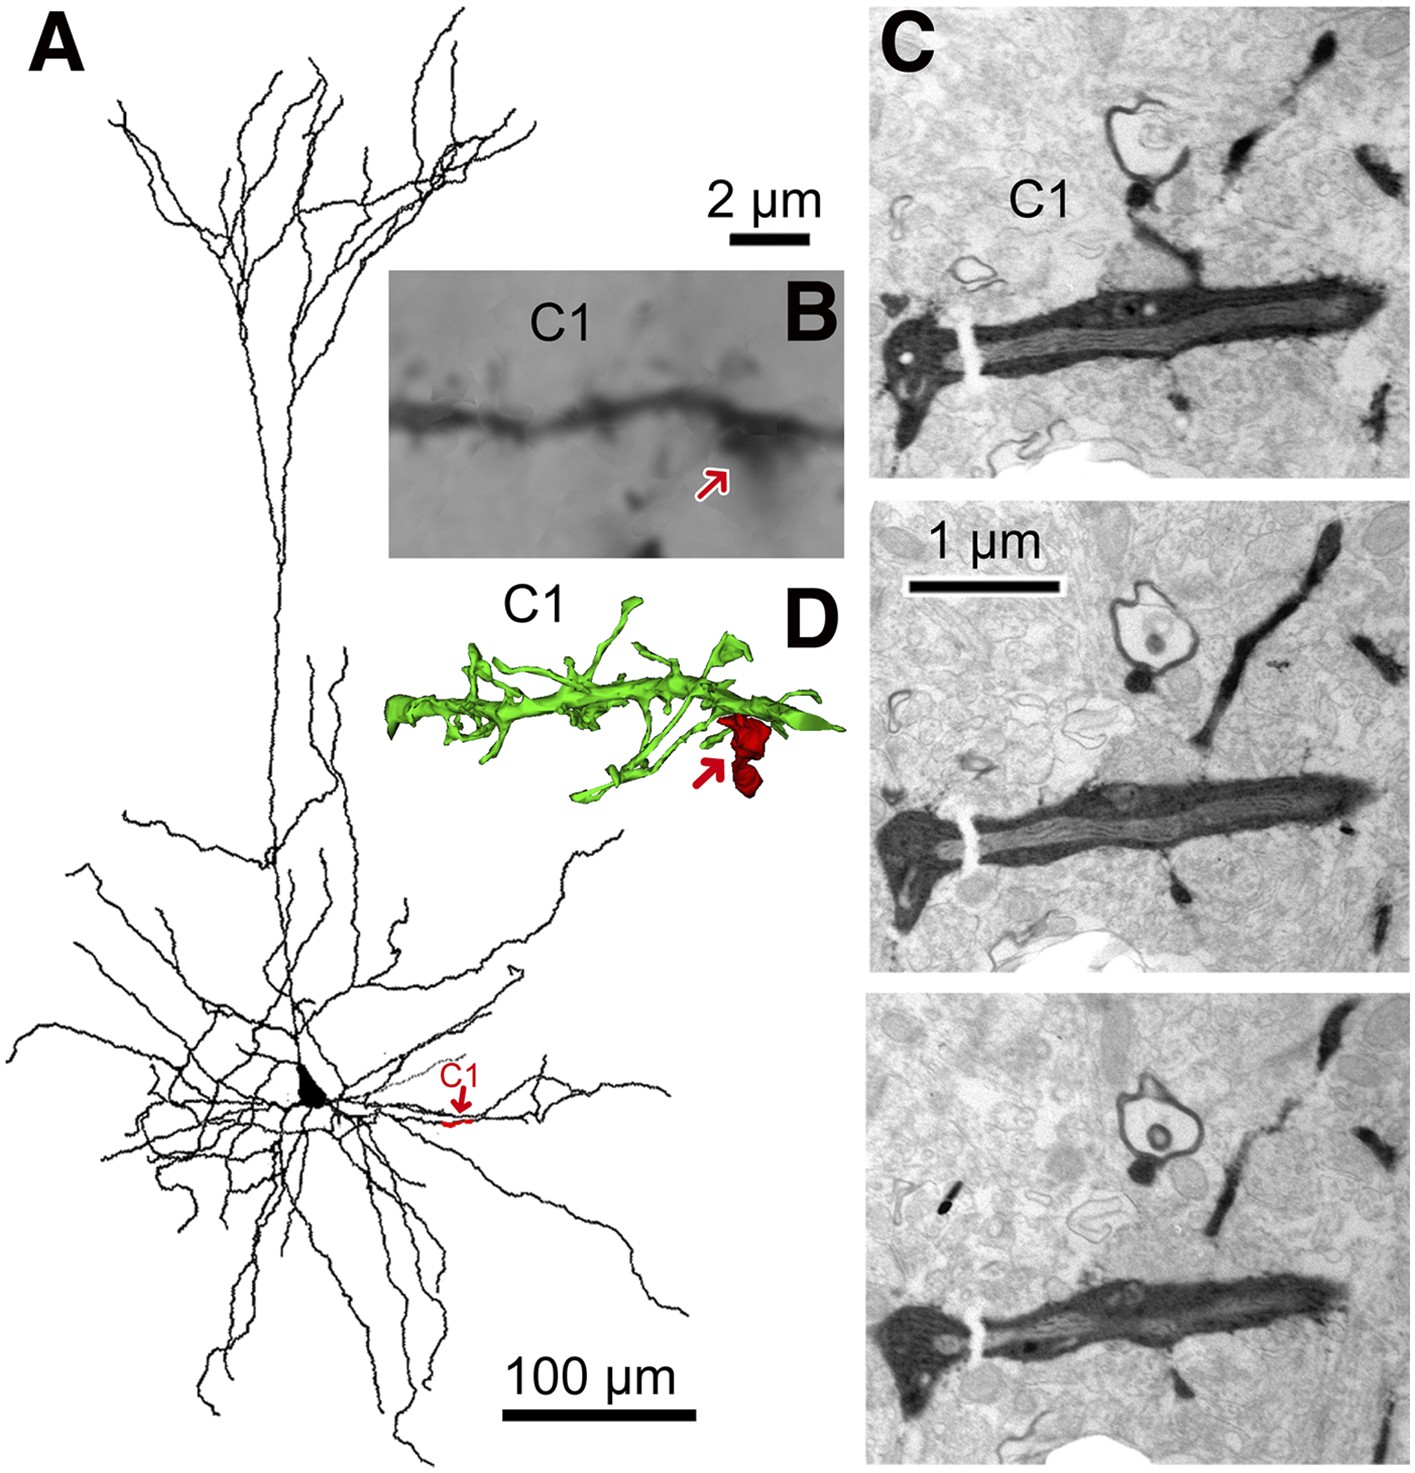
3D reconstruction from serial EMgs.
(A) Neurolucida reconstruction of the postsynaptic pyramidal cell of the CS56 pair. A dendritic segment (C1) is given in red and marked by red arrow. (B) Corresponding LMg of the dendritic segment C1 (focus stack image). The FS basket cell axon terminal is indicated by arrow. (C) EMgs from three adjacent ultrathin sections of segment C1. (D) 3D reconstruction of the dendritic segment C1. The FS basket cell axon (red) did not establish a synaptic contact with the dendritic segment C1 (red arrow). Scale bar in (B) is the same for (D).
Figure 3—figure supplement 1
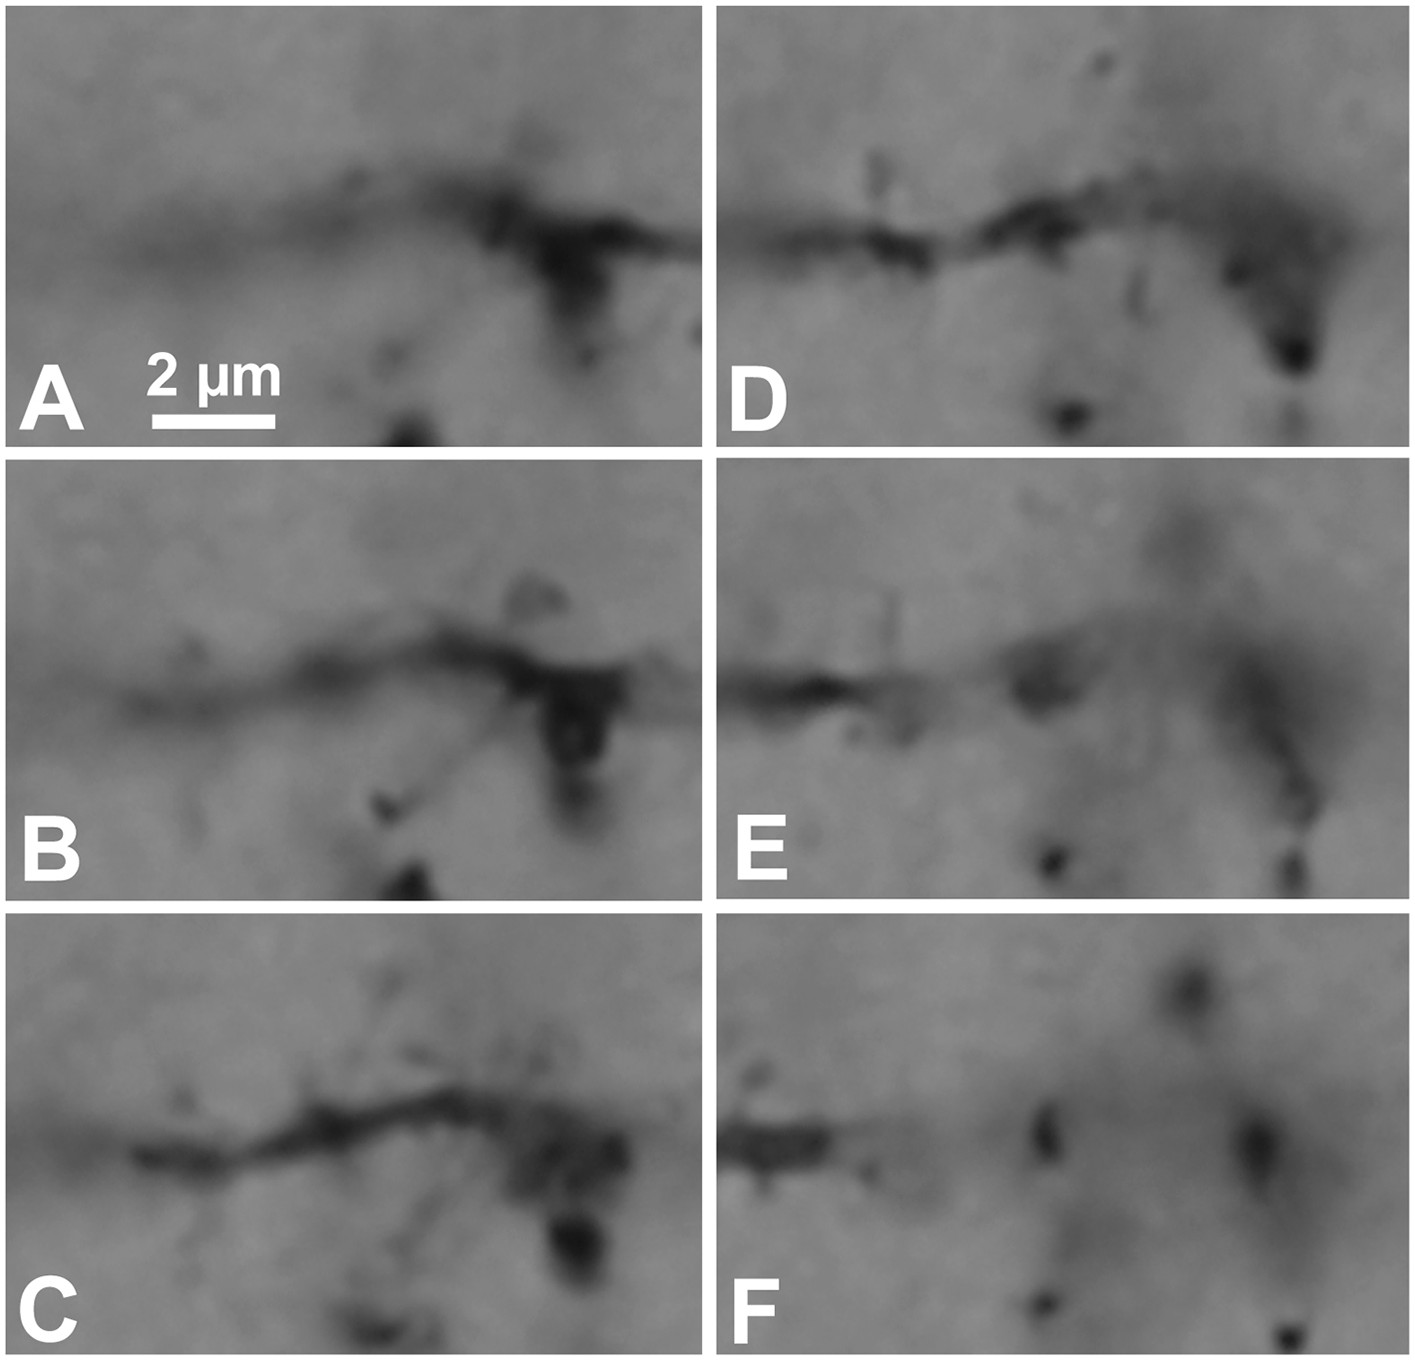
Focus step images for C1 dendritic segment with FS cell axonal fiber contact site shown in Figure 2B.
(A–F) The dendritic segment images of every 0.5 µm focus step were captured. The focus stacking LMg of Figure 2B was composed of focused area of these images.
Figure 4
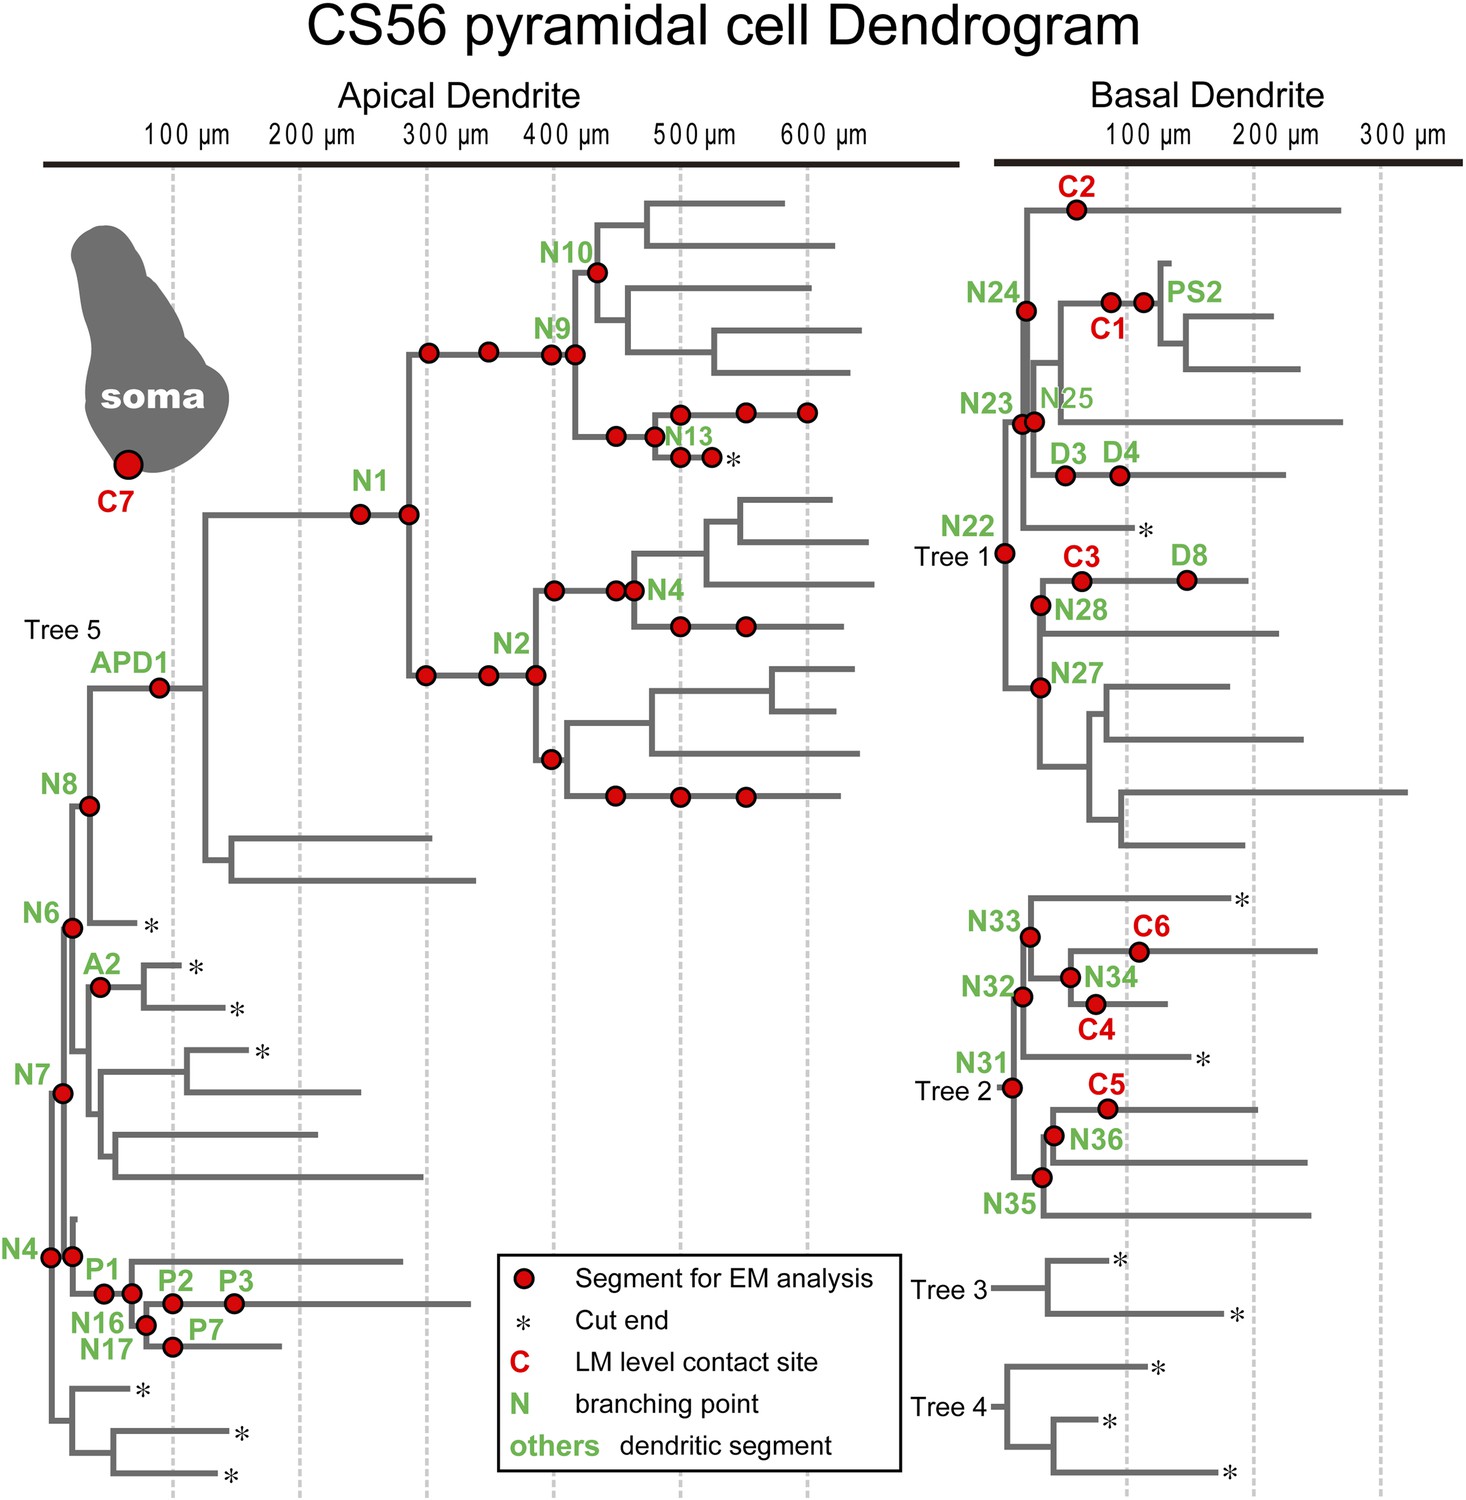
Dendritic segments and the somatic region selected for further quantitative EM analysis.
Dendrogram of the apical (left) and basal (right) dendrites of the postsynaptic pyramidal cell of pair CS56. Dendritic segments indicated by red circles and numbers and the somatic region (inset grey drawing) were selected and analyzed in serial ultrathin sections at the EM level. In this pair seven synaptic contact sites were identified at the light microscopic level (C1–C7).
Figure 5 with 3 supplements
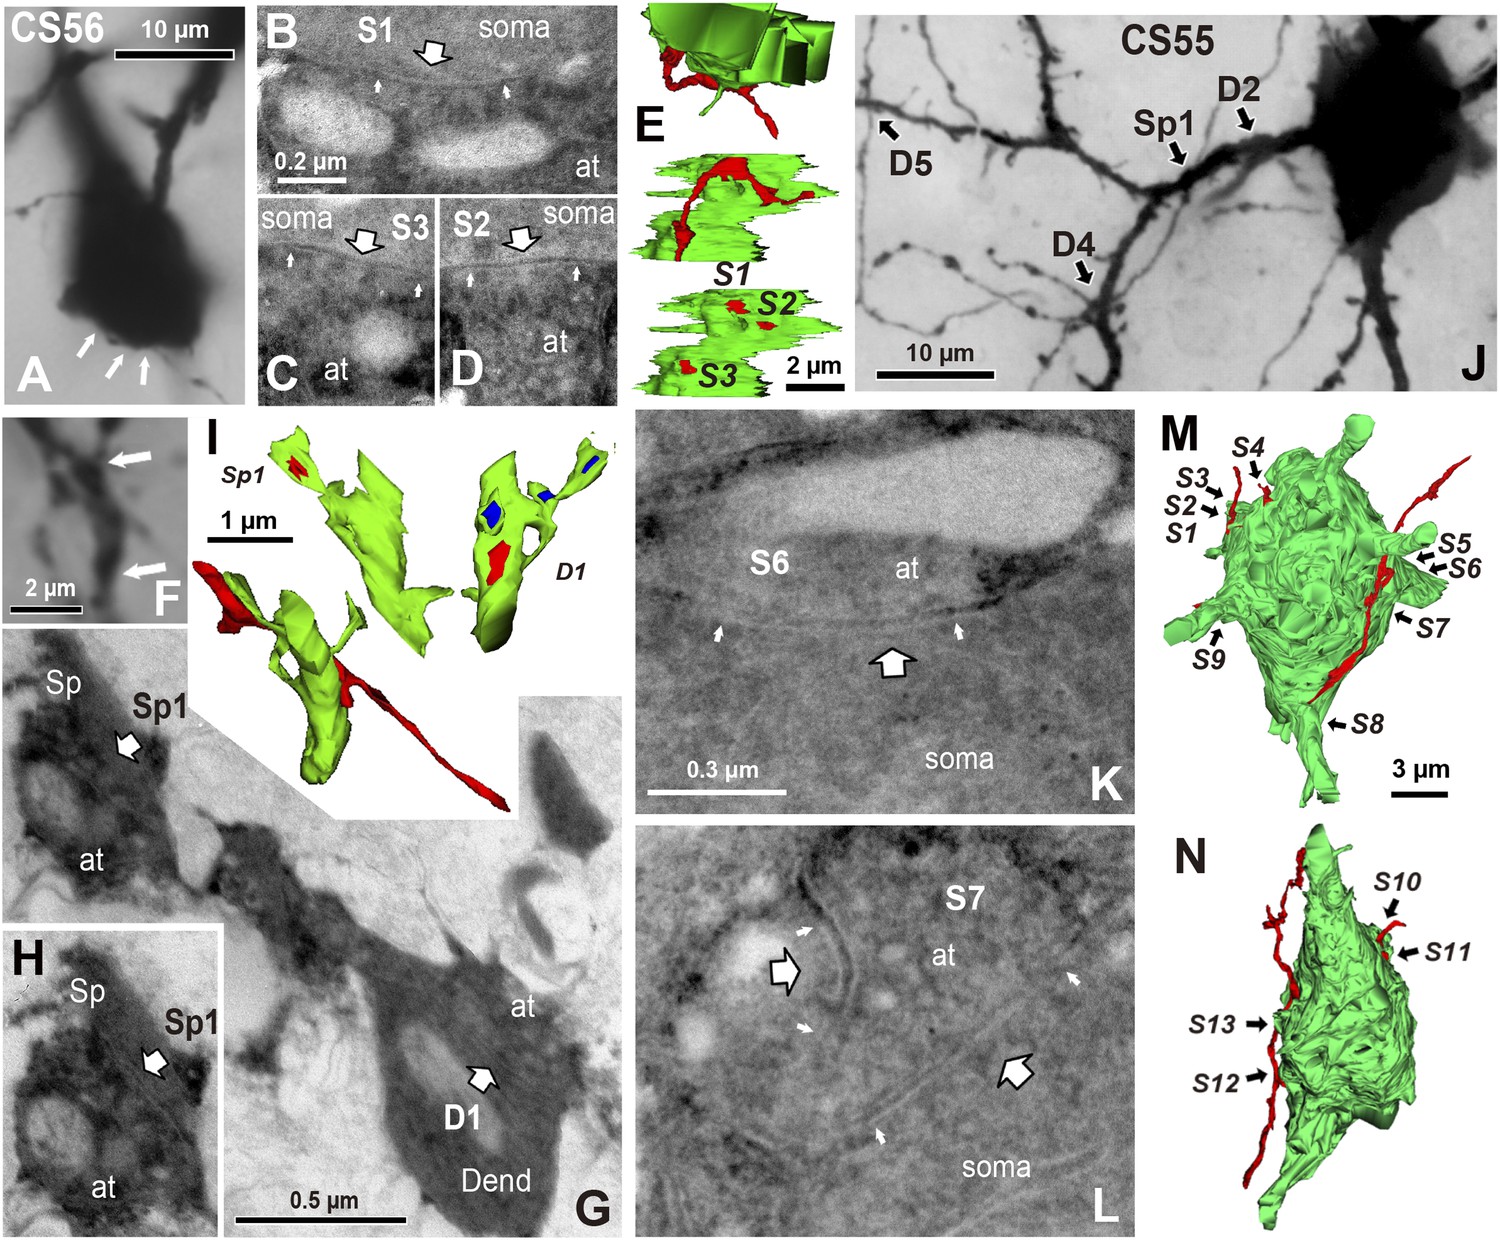
EM identification of synaptic contacts.
(A) LMg of putative synaptic contacts (white arrows) established by a basket cell axon on the soma of a pyramidal cell of CS56. (B–D) EMgs of three somatic synaptic contacts (S1–S3). Thick arrows indicate synaptic junctions, small arrows the extremities of the synaptic cleft. (E) The upper view is a 3D reconstruction of somatic synapses (red) on the soma (green) in the same plane as in (A), the middle image, rotated by 90°, shows three boutons apposed to the pyramidal cell soma and the lower view shows their synaptic junctions. (F) LMg of putative synaptic contacts on a pyramidal cell dendrite. (G) EMg of synapses with a dendritic spine (Sp1, upper left arrow) and dendritic shaft (D1, bottom right arrow) 40° tilting angle. (H) EMg of the spine synapse in G (arrow). (I) 3D reconstructions of the synapses in (G). Lower left image shows the dendritic segment indicated by arrows in (F). Middle view, rotated by ∼60°, shows the junction made with the spine (red). Right image is rotated by ∼ −90° to visualize the junction on the dendrite. (J) Focus stack image of LMg of putative contacts (arrows) made by basket cell axonal terminals on a pyramidal cell soma and dendrites of CS55. (K, L) EMgs of the S6 (K) and S7 (L) somatic junctions. (M, N) Two views of a 3D reconstruction of a FS cell axon (red) and pyramidal cell soma (green) showing all contacts. (at, axon terminal; sp, spine; dend, dendrite).
Figure 5—figure supplement 1
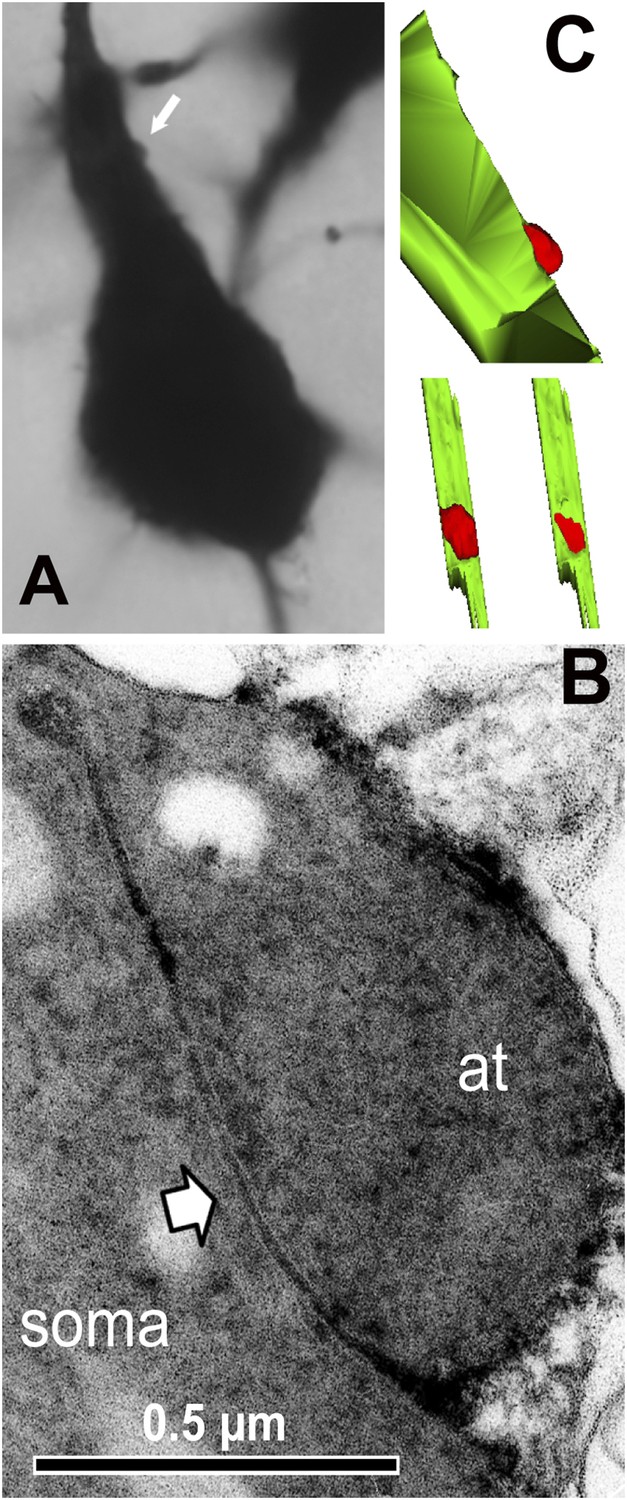
Somatic synapse contact sites identified using electron microscopic observation.
(A) Light micrograph showing FS cell axon terminal contacting to the postsynaptic pyramidal cell soma (arrow). The axon terminal looks just a hump of the somatic surface under the light microscope. (B) Electron micrograph showing the somatic synapse of the FS cell axon terminal contacting to the pyramidal cell soma (arrow). At: axon terminal. (C) 3D reconstruction images of the somatic synapse. Upper image is in the same angle as the light micrograph in (A). Bottom left image is 90° rotated image showing soma surface (green). Bottom right image shows synaptic junction.
Figure 5—figure supplement 2
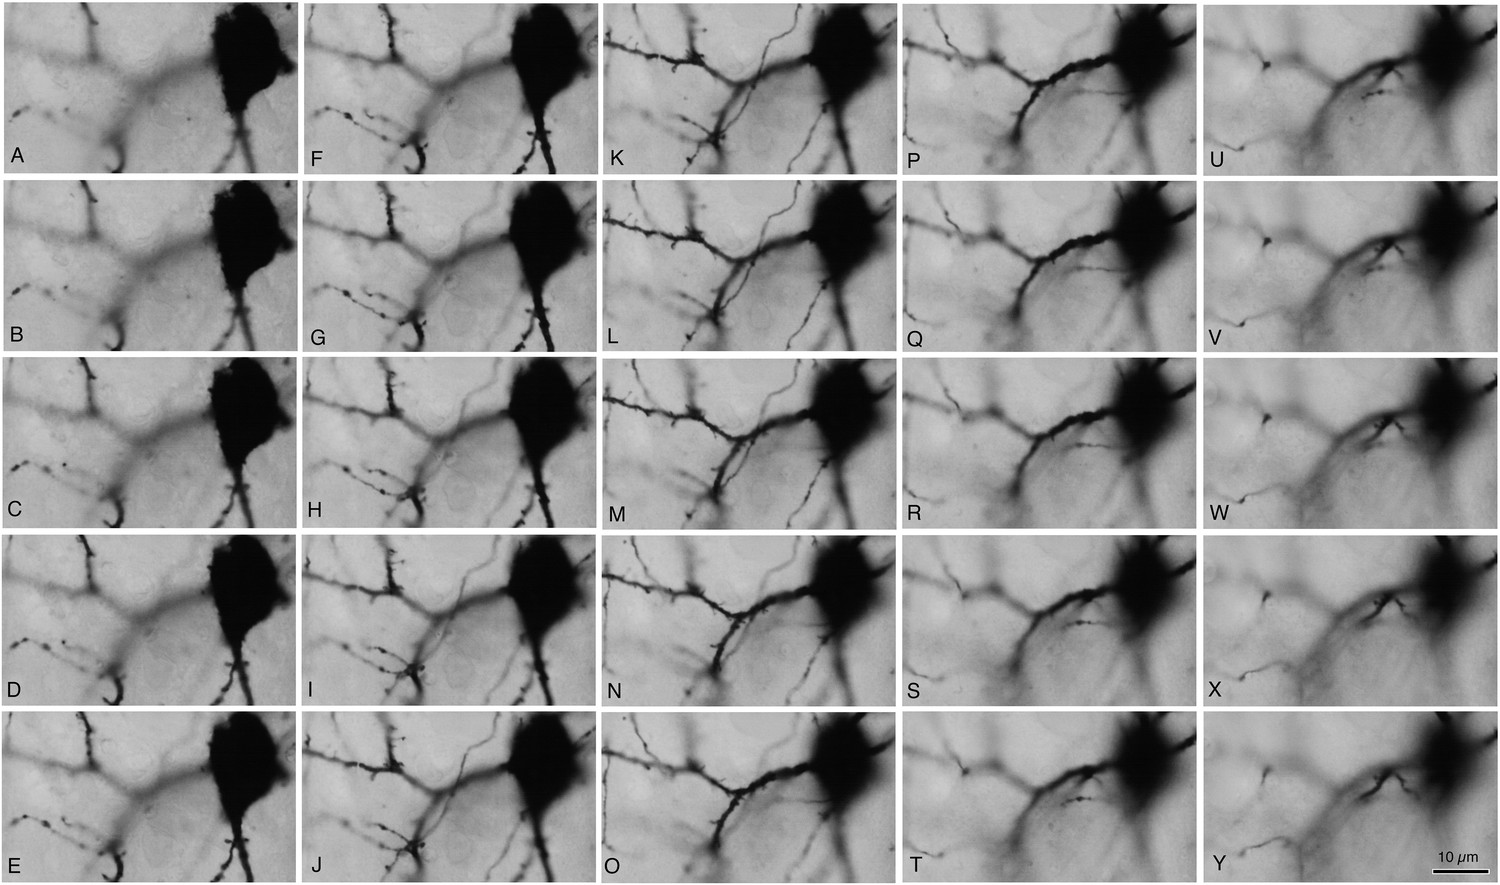
Focus step images for CS55 pair neurons shown in Figure 3J.
(A–Y) The somatic, dendritic segment and axonal fiber images of every 0.5 µm focus step were captured. The focus stacking LMg of Figure 3J was composed of focused area in these images.
Figure 5—figure supplement 3
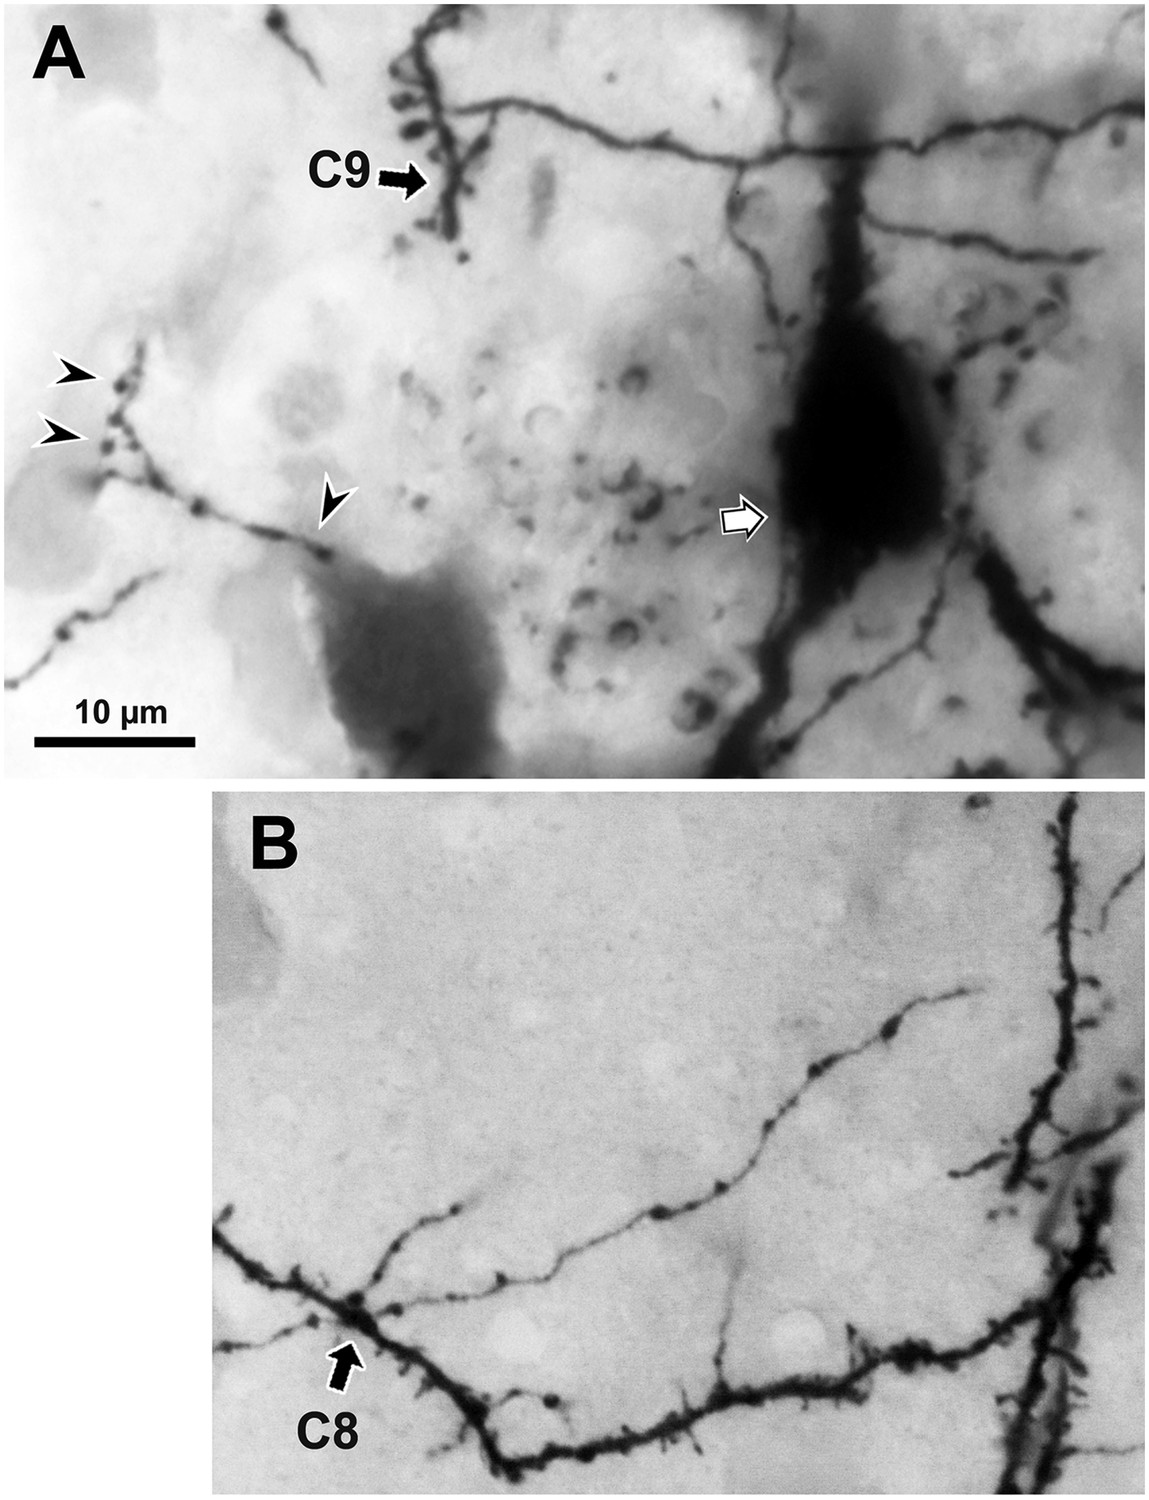
The presynaptic FS basket cell axon terminal crosses the postsynaptic pyramidal cell CS55 dendrite.
(A) Focus stack image of LMg of putative contacts made by the FS basket cell axonal terminal on the pyramidal cell dendrite (C9, arrow). This contact was not verified with EM. The other presynaptic fiber is accessing to the pyramidal cell soma (white arrow). The presynaptic axon terminals contact on the other cell soma (arrow heads). (B) Focus stack image of LMg of putative contacts made by the FS basket cell axonal terminal on a pyramidal cell dendrite (C8, arrow). This contact was not verified as synaptic contact with EM.
Figure 6 with 1 supplement
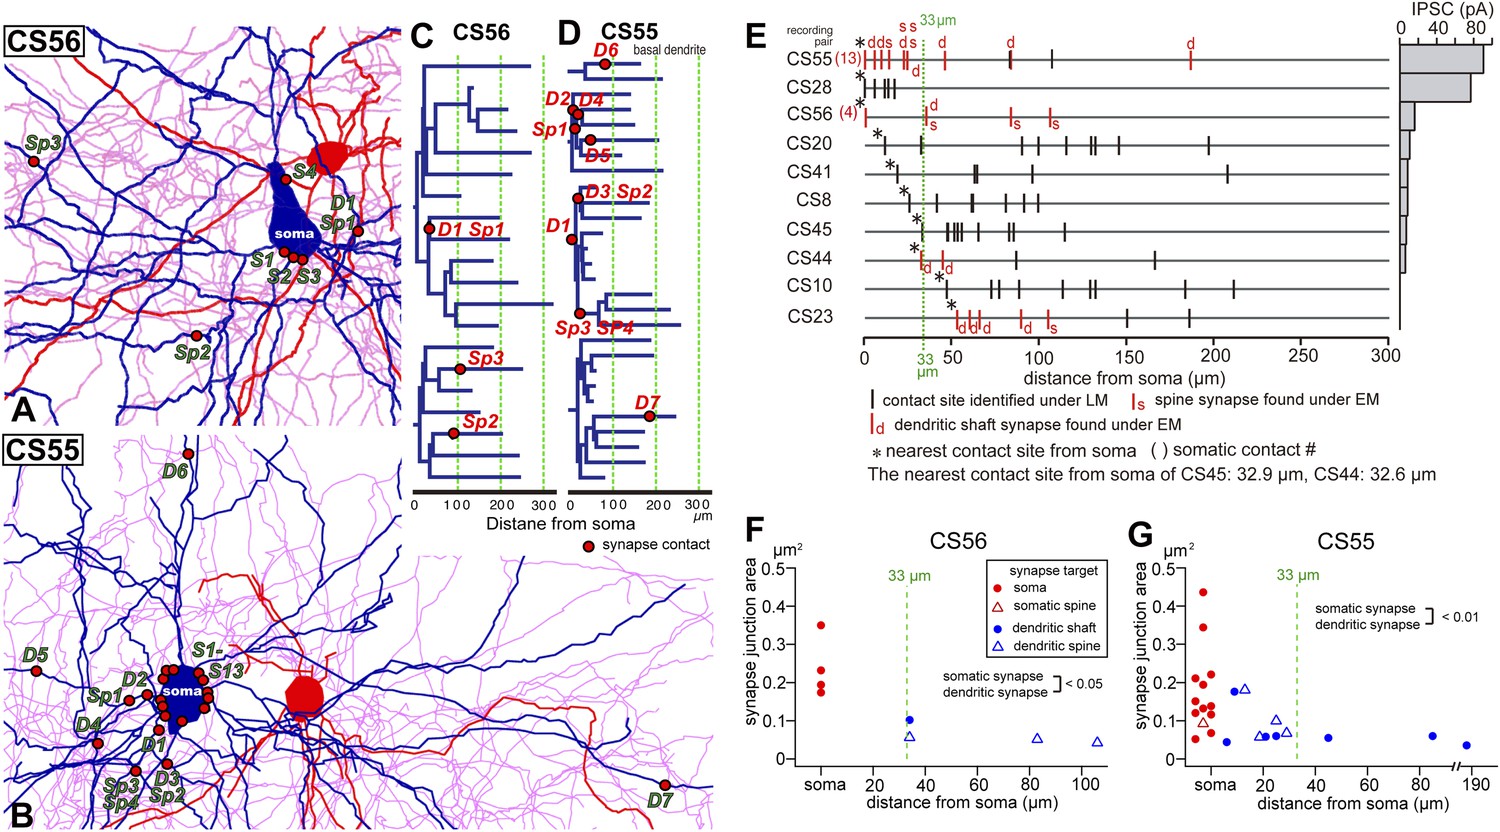
Synapse contact sites identified by EM observation of pairs CS56 and CS55.
(A, B) Synaptic contact sites are shown in drawings of CS56 pair neurons (A) and CS55 pair neurons (B). Postsynaptic pyramidal cell soma and dendrites are in blue, presynaptic FS basket cell soma and dendrites are in red, and axon in pink. (C, D) The synapse contact sites are shown in dendrograms of the basal dendrites of postsynaptic pyramidal cell of CS56 pair (C) and CS55 pair (D). (E) Distribution of putative synaptic contacts (black bars) made by single basket cells on somato-dendritic membrane of 10 pyramidal cells. Contacts confirmed by EM are shown in red. (F, G) Area of somatic synaptic junctions is significantly larger than those on dendritic shafts and spines of CS56 pair neurons (F) and CS55 pair neurons (G).
Figure 6—figure supplement 1
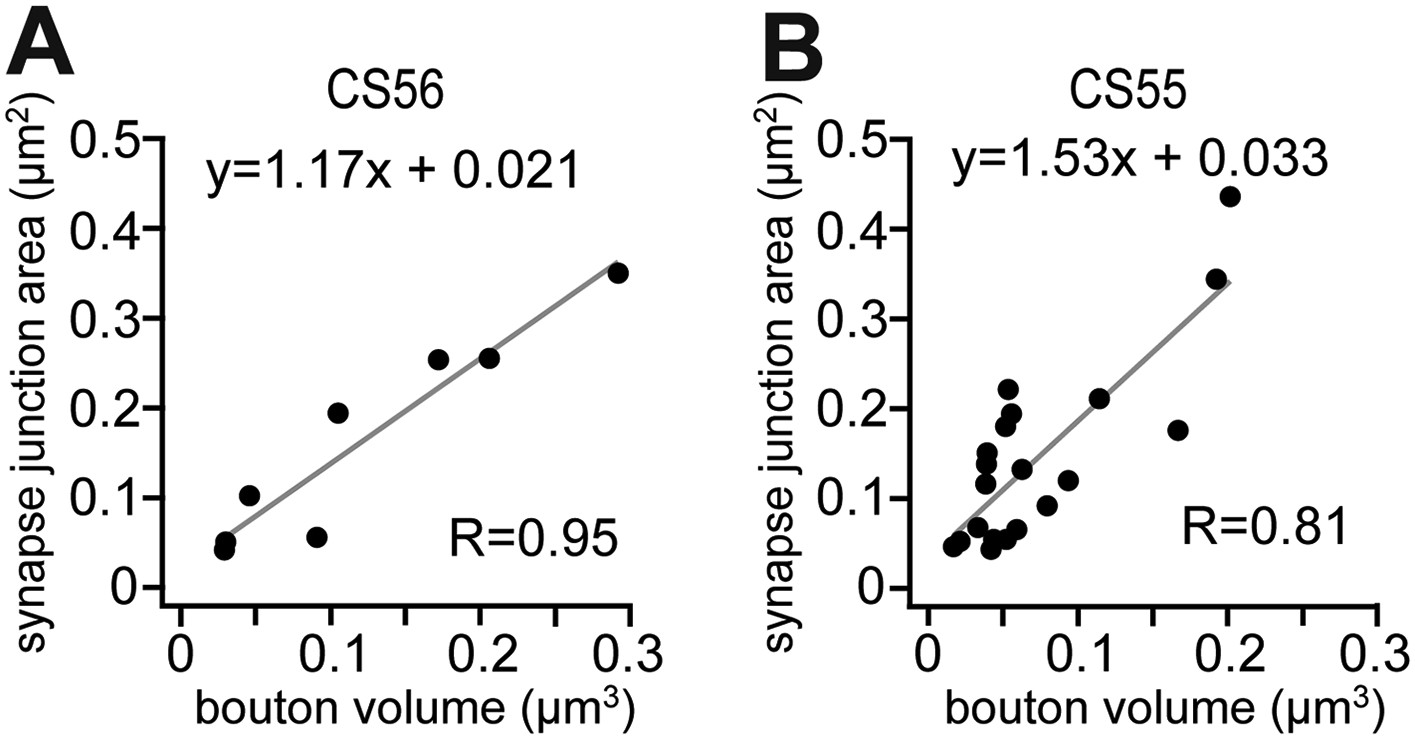
Linear correlation of synapse junction area and bouton volume.
(A, B) Diagram showing the positive linear correlation of synapse junction area and bouton volume of CS56 (A) and CS55 (B).
Figure 7
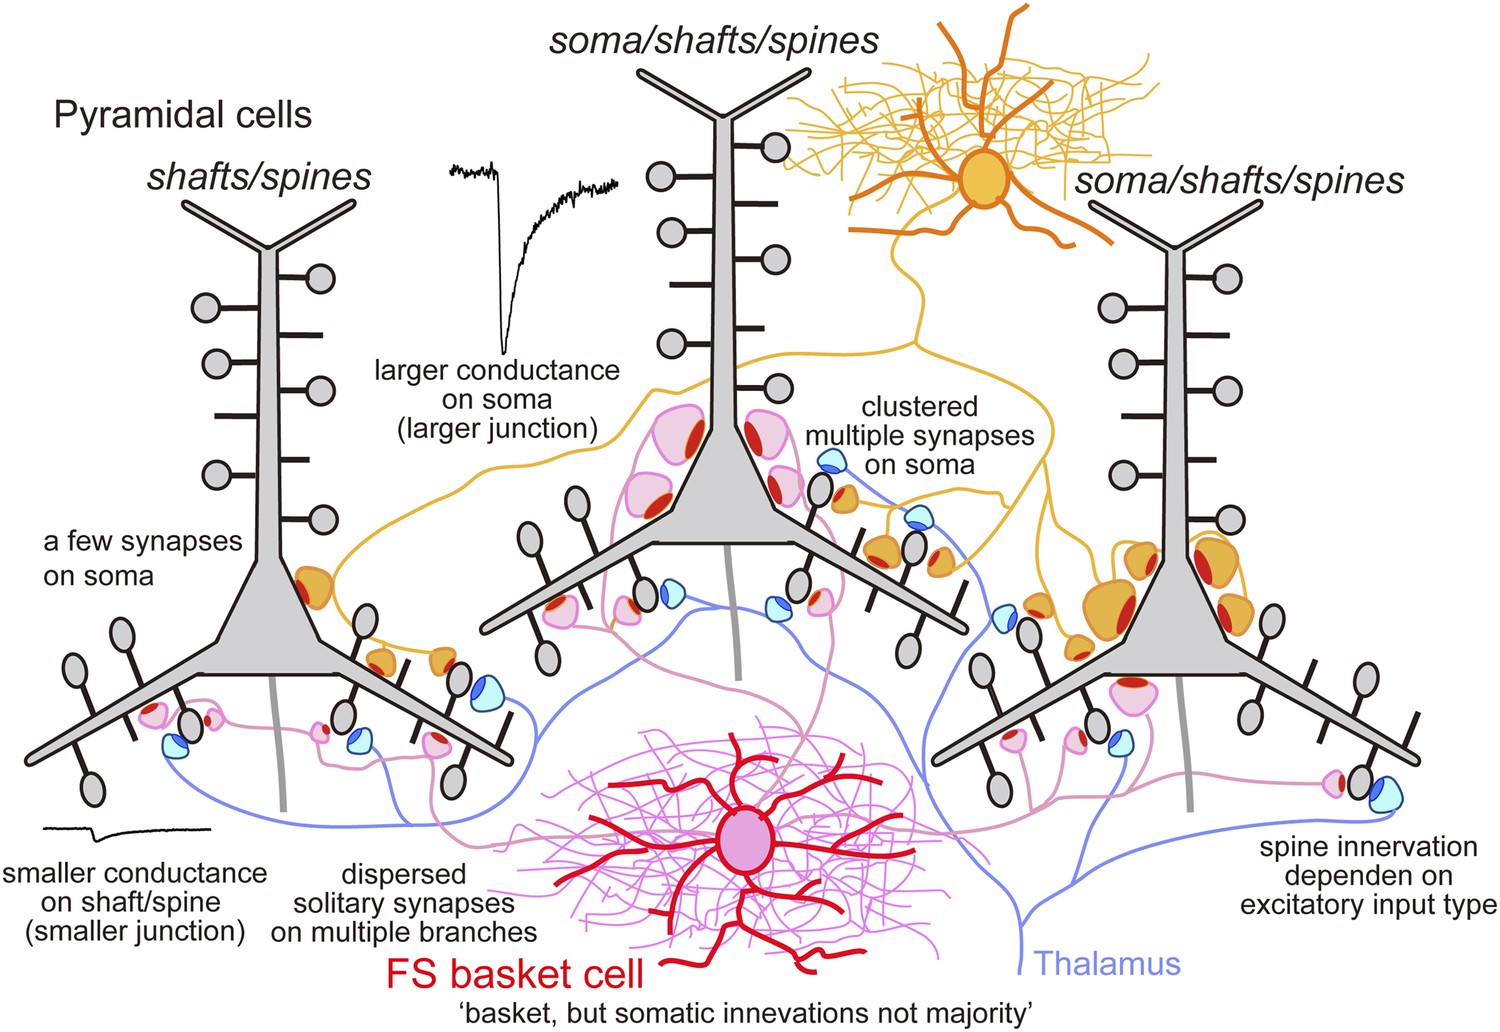
Schematic summary.
Schematic drawing to summarize our main findings.
Figure 8 with 1 supplement

Simulated conduction for dendritic spine, shaft and somatic IPSCs.
(A–C) Dendro-somatic conduction of a spine synapse IPSC. (A) Peak membrane potential changes (color-coded as in (M)) over somato-dendritic membrane induced by an IPSC of 0.11 nS injected at Sp1 of the model pyramidal cell (red arrow). Peak inhibitory potential of the spine in red. (B) IPSC waveform injected at Sp1 spine head is reduced to 64% at the soma. (C) Simulated IPSPs. Current flow indicated by arrows. IPSP attenuation was 15% at the basal dendrite and 9% at the soma. (D–F) Conduction of a dendritic shaft IPSC, D1. (D) Peak somato-dendritic potential changes induced by an IPSC of amplitude 0.21 nS injected at a dendritic shaft (red arrow). (E) IPSC waveform injected at D1 (upper) and simulated somatic IPSC (lower trace) with an attenuation of 63%. (F) IPSP wave form. Current flow indicated by arrows. IPSP attenuation at the soma is 57%, but no attenuation at the spine. (G, H) Conduction of a somatic IPSC, S1. (G) Peak somato-dendritic potential changes induced by an IPSC of amplitude 0.7 nS injected at the S1 somatic site (red arrow). (H) IPSC waveform injected at S1 (upper) resulting in a somatic IPSP (lower). (I) Somato-dendritic conduction of the IPSC resulting from activating (red arrow) four somatic synapses S1, S2, S3 and S4. (J) Summed IPSC waveform (upper trace, S1–S4) and somatic IPSP (lower). (K) Peak somatic IPSPs for eight different injected IPSCs. (L) Reduction (green) of the EPSP resulting from the injection of an EPSC waveform of 0.2 nS (red) at the spine head, Sp1, by an IPSC (blue) injected at the same site and time. (M) Color-coded dendrogram and corresponding somatic synaptic contacts on the model cell. (N) Bar histogram showing the distribution of IPSC electric charge of the pair CS56. (O) IPSC variance of the pair CS56. (P) Bar histogram of the distribution of IPSC electric charge when simulated. Here, the IPSC electric charge also substantially varied from trial to trial and is not significantly different as in the paired recording (Kolmogorov–Smirnov test, p = 0.41).
Figure 8—figure supplement 1
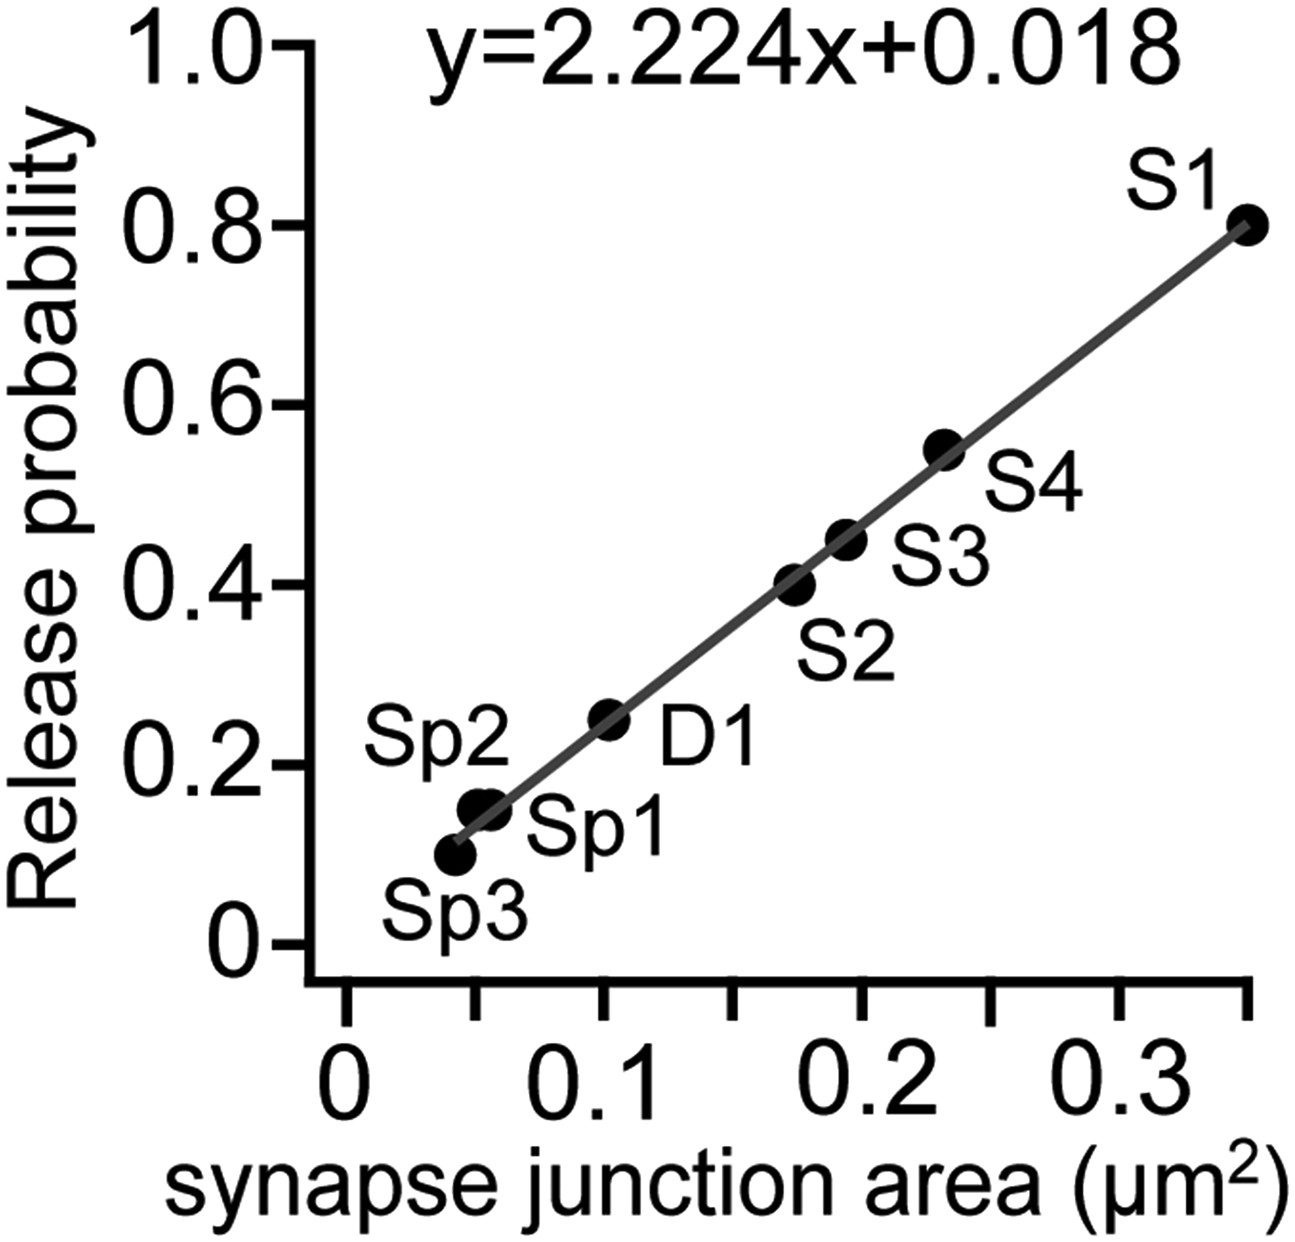
Relationship showing synapse conductance and release probability used for simulation analysis in Figure 6P.
https://doi.org/10.7554/eLife.07919.026
Figure 9
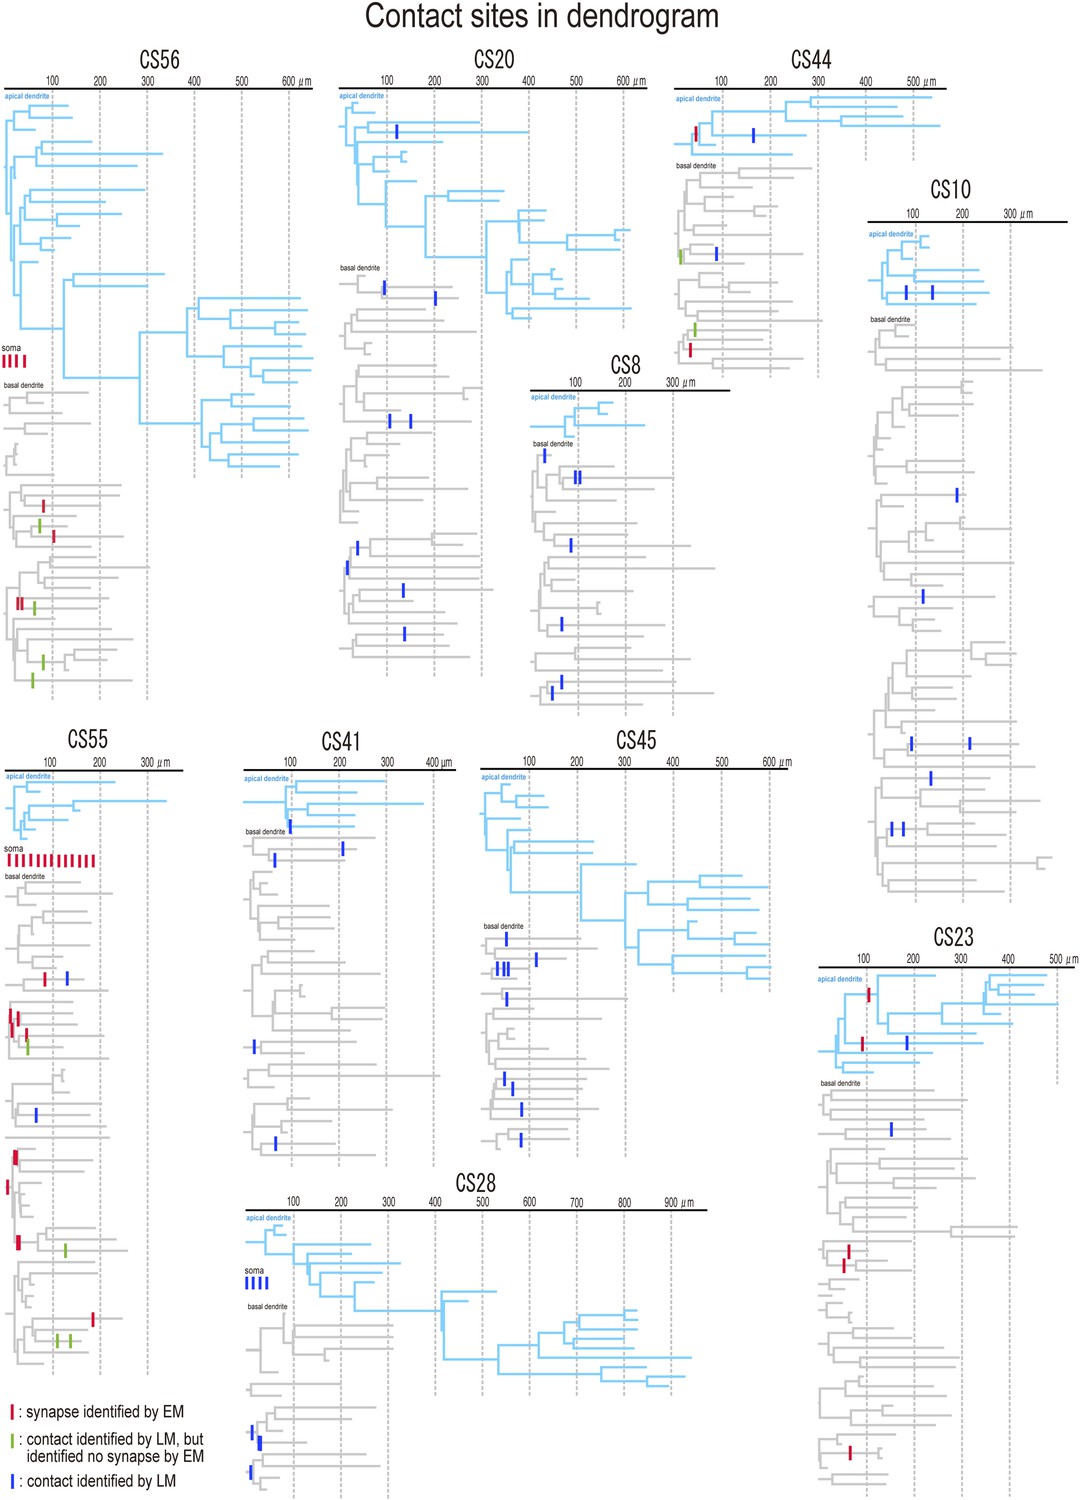
Dendrograms with contact sites of the post synaptic pyramidal cells.
Individual dendrograms of all investigated postsynaptic pyramidal cells (n = 10). Apical dendrograms are shown in blue and basal dendrograms are in gray.
Figure 10
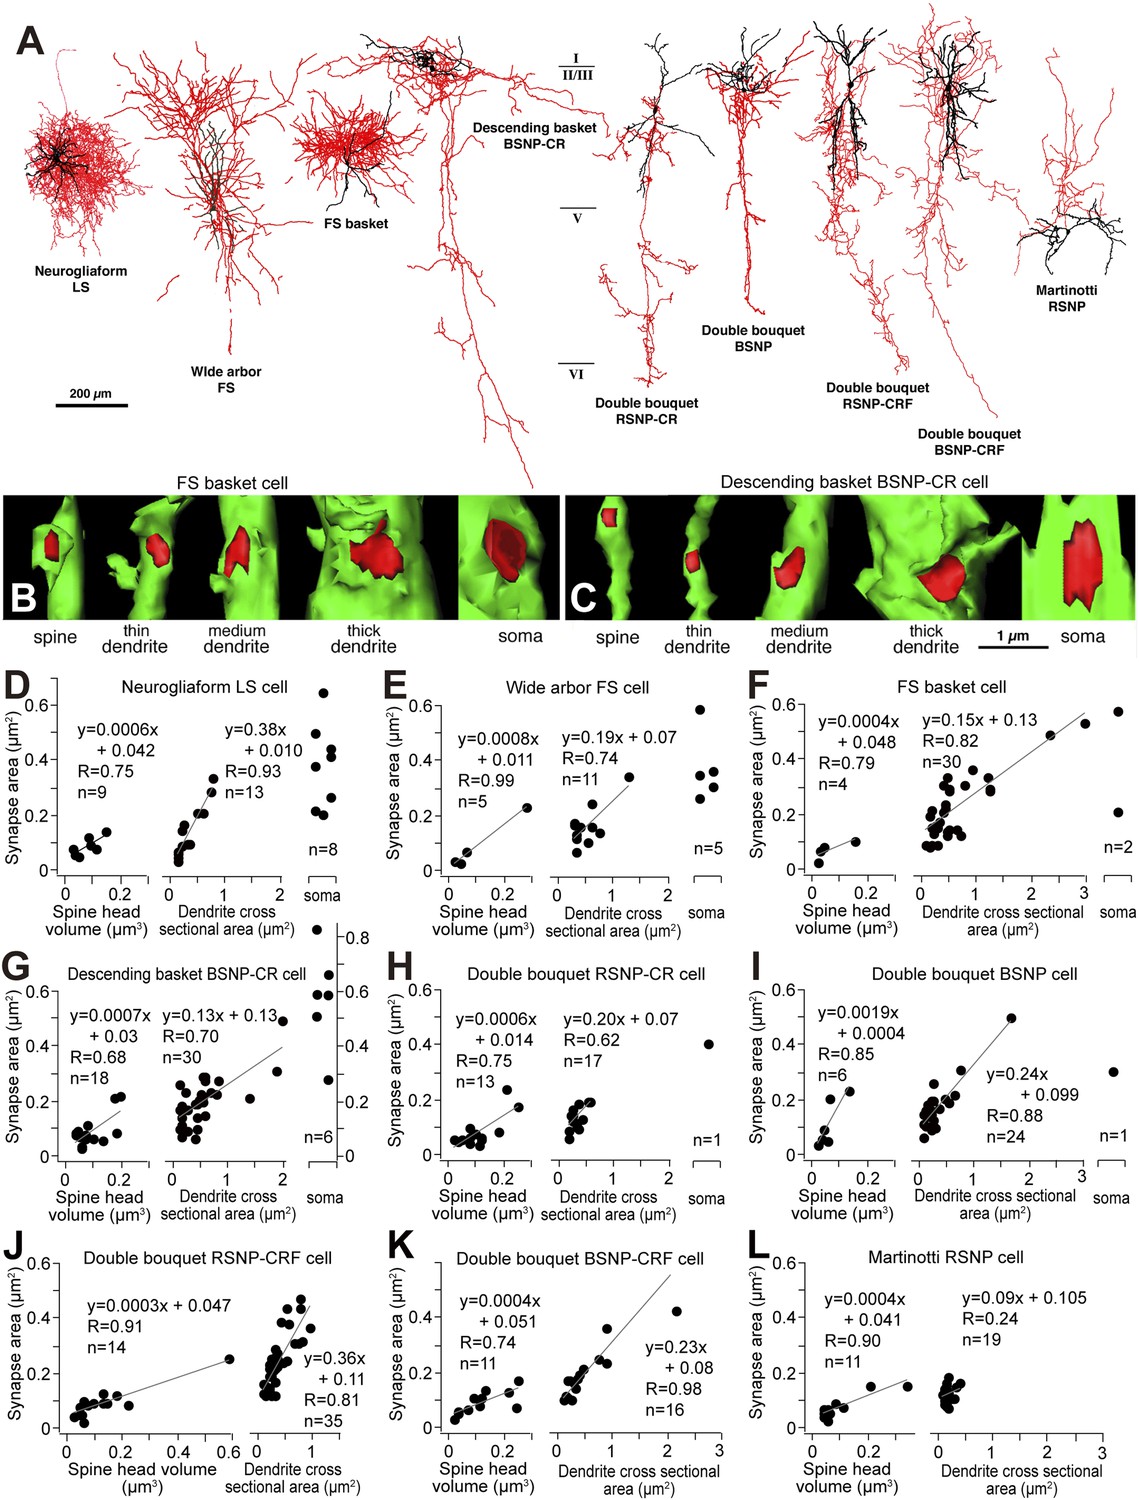
Linear correlation between synapse junction area and postsynaptic target size of non-pyramidal cells.
(A) Different types of cortical GABAergic non-pyramidal cells. The somatodendritic domain of the neurons is given in black and their axons in red. Abbreviations: LS, late spiking cell; FS, fast spiking cell; BSNP, burst spiking non-pyramidal cell; RSNP, regular spiking non-pyramidal cell; CR, calretinin; CRF, corticotropin releasing factor. (B, C) 3D reconstructions of synaptic junctions (red) on target structures (green) of inhibitory axon terminals by cortical FS basket cell (B) and descending basket BSNP-CR cell (C) using 3D serial EMgs. The thickness of the target structure (from left to right) is positively correlated with the size of the junction area. (D–L) Line diagrams correlating synaptic junction area of the non-pyramidal neurons with spine head volume (left panel), dendrite cross sectional area (middle panel) and plots with soma (right panel). The synapse junction area on spines and dendrites is linearly correlated with the target size. The somatic synapse is larger when compared with dendritic and spine synapse.
Tables
Table 1
Synapse properties of pair recordings
| Amplitude (pA) | Success rate | Neurolucida analysis | Distance from soma (µm) | |||
|---|---|---|---|---|---|---|
| mean | sd | max | ||||
| IPSC | ||||||
| CS4 | −5.7 | 5.1 | −19.5 | 0.6 | ||
| CS8 | −8.6 | 4.0 | −17.6 | 0.5 | yes | 48.8 |
| CS20 | −10.9 | 5.3 | −27.4 | 0.9 | yes | 51.8 |
| CS21* | −7.6 | 3.2 | −17.8 | 0.6 | ||
| CS22* | −8.0 | 3.4 | −14.5 | 0.6 | ||
| CS28 | −76.9 | 20.9 | −107.3 | 1.0 | yes | 48.8 |
| CS36* | −6.5 | 2.6 | −12.5 | 0.4 | ||
| CS41 | −8.6 | 4.3 | −20.8 | 0.7 | yes | 41.3 |
| CS44 | −6.2 | 2.1 | −12.6 | 0.5 | yes | 66.6 |
| CS45* | −7.1 | 4.1 | −21.2 | 0.7 | yes | 53.2 |
| CS55 | −91.3 | 11.2 | −111.0 | 1.0 | yes | 35.8 |
| CS56 | −17.3 | 3.0 | −24.9 | 1.0 | yes | 20.6 |
| CS61 | −9.6 | 4.6 | −22.2 | 0.8 | ||
| CS62 | −36.4 | 14.0 | −69.5 | 1.0 | ||
| EPSC | ||||||
| CS10 | 67.5 | 22.2 | 109.3 | 1.0 | yes | 26.5 |
| CS21* | 18.6 | 8.7 | 44.5 | 0.9 | ||
| CS22* | 70.9 | 38.3 | 201.6 | 1.0 | ||
| CS23 | 45.3 | 14.2 | 83.4 | 1.0 | yes | 51.2 |
| CS36* | 4.4 | 1.0 | 6.5 | 0.5 | ||
| CS45* | 43.1 | 19.0 | 86.1 | 1.0 | yes | 53.2 |
-
*
Reciprocal connection between FS and pyramidal cell was observed.
Table 2
Synapse properties of pair CS56
| Synapse | Target | junction area (µm2) | Electric charge (fC)* | Conductance (nS)† | Distance from soma (µm) |
|---|---|---|---|---|---|
| S1 | Soma | 0.350 | 120.1 | 0.71 | 0 |
| S2 | Soma | 0.174 | 59.7 | 0.35 | 0 |
| S3 | Soma | 0.194 | 66.6 | 0.39 | 0 |
| S4 | Soma | 0.232 | 79.6 | 0.47 | 0 |
| Sub total | 0.950 | ||||
| D1 | Dendrite | 0.102 | 35.2 | 0.21 | 34 |
| Sp1 | Spine | 0.056 | 19.2 | 0.11 | 34 |
| Sp2 | Spine | 0.051 | 17.6 | 0.10 | 83 |
| Sp3 | Spine | 0.042 | 14.4 | 0.08 | 106 |
-
*
Estimated from junctional area.
-
†
Estimated from electric charge.
Table 3
Synapse properties of pair CS55
| Synapse | Target | Junction area (µm2) | Electric charge (fC)* | Distance from soma (µm) |
|---|---|---|---|---|
| S1 | Soma | 0.116 | 40.9 | 0 |
| S2 | Soma | 0.221 | 77.6 | 0 |
| S3 | Soma | 0.052 | 18.4 | 0 |
| S4 | Soma | 0.120 | 42.3 | 0 |
| S5 | Soma | 0.436 | 153.0 | 0 |
| S6 | Soma | 0.194 | 68.2 | 0 |
| S7 | Soma | 0.344 | 121.0 | 0 |
| S8 | Soma | 0.151 | 52.9 | 0 |
| S9 | Soma | 0.068 | 23.8 | 0 |
| S10 | Soma | 0.138 | 48.3 | 0 |
| S11 | Soma | 0.132 | 46.2 | 0 |
| S12 | Soma | 0.211 | 74.1 | 0 |
| S13 | Somatic spine | 0.092 | 32.3 | 0 |
| Sub total | 2.274 | |||
| D1 | Dendrite | 0.044 | 15.3 | 6 |
| D2 | Dendrite | 0.176 | 61.8 | 8.6 |
| Sp1 | Spine | 0.180 | 63.2 | 12.6 |
| D3 | Dendrite | 0.058 | 20.3 | 22.6 |
| Sp2 | Spine | 0.054 | 19.1 | 22.6 |
| D4 | Dendrite | 0.060 | 21.1 | 24.7 |
| Sp3 | Spine | 0.099 | 34.6 | 24.9 |
| Sp4 | Spine | 0.067 | 23.4 | 24.9 |
| Sub total | 3.011 | |||
| D5 | Dendrite | 0.055 | 19.3 | 44.8 |
| D6 | Dendrite | 0.060 | 21.1 | 84.5 |
| D7 | Dendrite | 0.046 | 16.2 | 188.5 |
-
*
Estimated from junctional area.
Table 4
Proportion of basket terminal
| Pair | Basket terminal | Total bouton | Basket terminal (%) |
|---|---|---|---|
| CS55 | 106 | 285 | 37.2 |
| CS28 | – | – | – |
| CS56 | 91 | 211 | 43.1 |
| CS20 | 52 | 217 | 24.0 |
| CS41 | 73 | 248 | 29.4 |
| CS8 | 59 | 201 | 29.4 |
| CS45 | 26 | 151 | 17.2 |
| CS44 | 67 | 233 | 28.8 |
| CS10 | 59 | 226 | 26.1 |
| CS23 | 63 | 315 | 20.0 |
| Total/average | 596 | 2087 | 28.4 ± 7.6 |
Table 5
IPSC properties of pair CS56 and CS55
| CS56 | CS55 | |||
|---|---|---|---|---|
| Electric | peak | Electric | peak | |
| Charge (fC) | (pA) | Charge (fC) | (pA) | |
| Average | 193.1 | −17.3 | 895.2 | −91.3 |
| SD | 56.2 | 3.0 | 96.2 | 11.2 |
| Max | 326.1 | −24.9 | 1057.8 | −111.0 |
| Min | 89.9 | −11.8 | 766.0 | −74.0 |
| n | 60 | 60 | 10 | 10 |
| Average Trace | 217.5 | −14.2 | 994.6 | −89.4 |
Table 6
Unit IPSC
| Pair | Electric charge (fC) | Junction area (µm2) | Unit IPSC (fC/µm2) |
|---|---|---|---|
| CS56 | 326.1 | 0.950 | 343.3 |
| CS55 | 1057.8 | 3.011 | 351.3 |
Download links
A two-part list of links to download the article, or parts of the article, in various formats.
Downloads (link to download the article as PDF)
Open citations (links to open the citations from this article in various online reference manager services)
Cite this article (links to download the citations from this article in formats compatible with various reference manager tools)
Functional effects of distinct innervation styles of pyramidal cells by fast spiking cortical interneurons
eLife 4:e07919.
https://doi.org/10.7554/eLife.07919


