Abundant toxin-related genes in the genomes of beneficial symbionts from deep-sea hydrothermal vent mussels
- Max Planck Institute for Marine Microbiology, Germany
- Ernst-Moritz-Arndt-University, Germany
- Commissariat à l'énergie atomique et aux énergies alternatives, France
- University of Évry-Val d'Essonne, France
- Okinawa Institute of Science and Technology, Japan
- GEOMAR Helmholtz Centre for Ocean Research Kiel, Germany
- Institute of Clinical Molecular Biology, Germany
- Institute of Marine Biotechnology, Germany
- University of Bremen, Germany
Figures
Figure 1
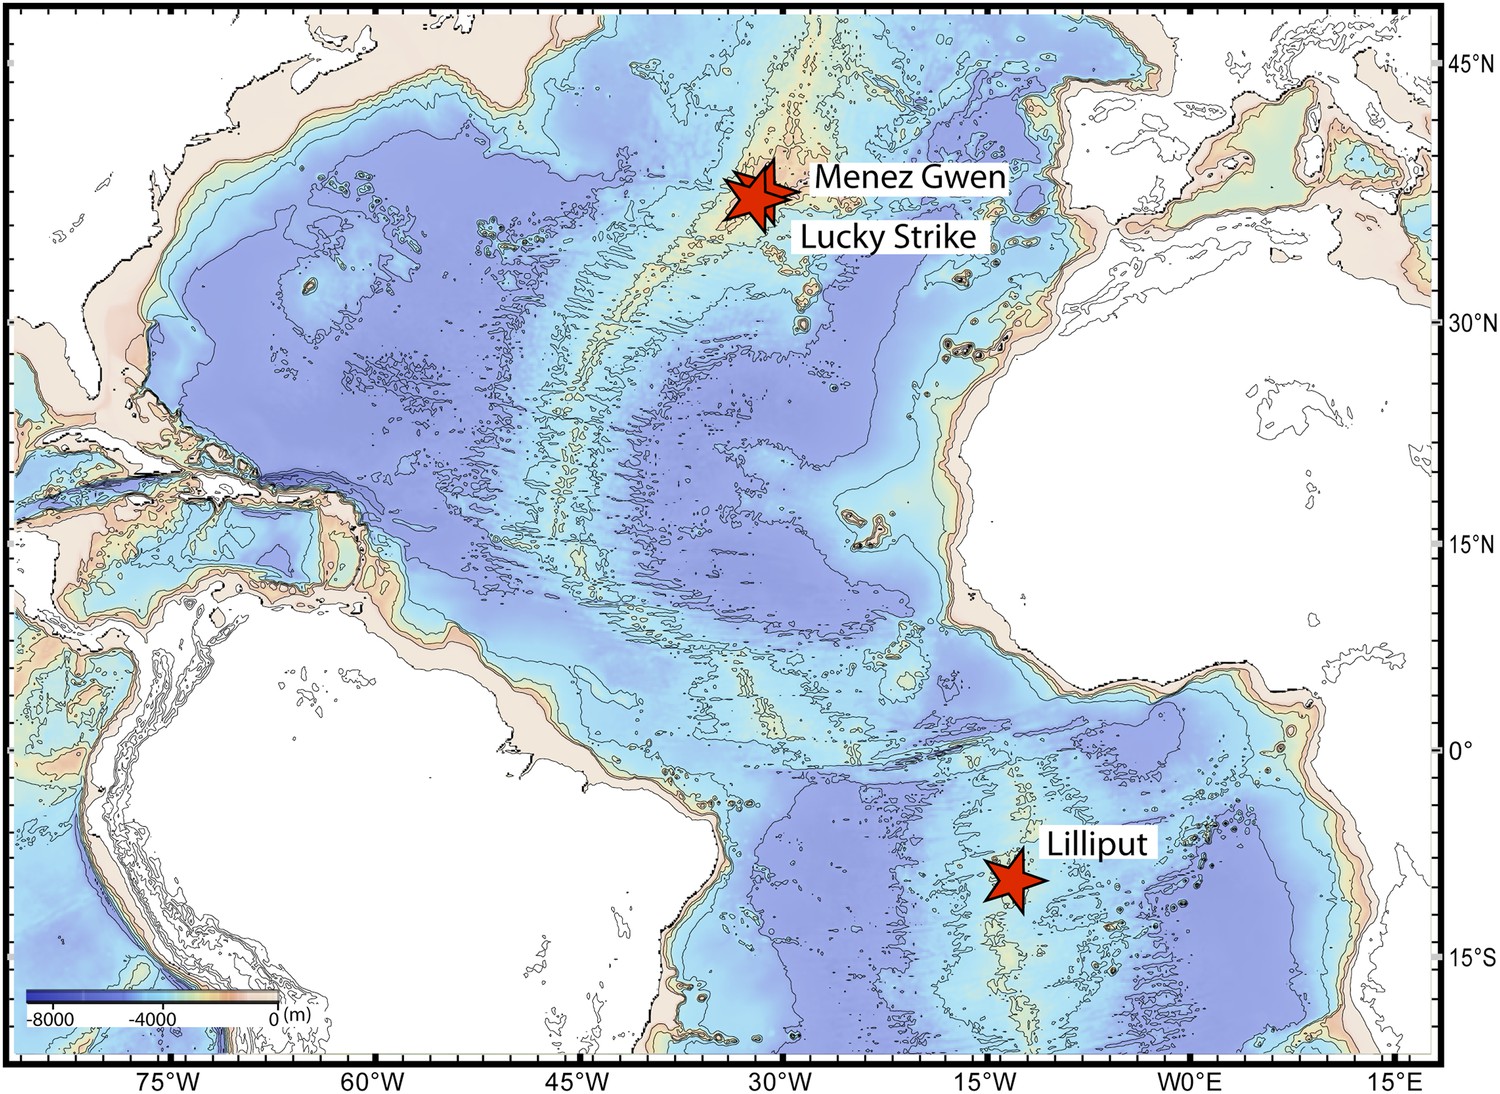
Sampling sites.
Map showing the sampling sites of Bathymodiolus mussels at hydrothermal vents along the Mid-Atlantic Ridge (red stars). B. sp. is found at Lilliput (BspSym), Bathymodiolus azoricus at Menez Gwen (BazSymA and BazSymB) and Lucky Strike. The details of the sampling sites are described in Supplementary file 1E. The map was produced with GeoMapApp 3.3.
Figure 2 with 3 supplements
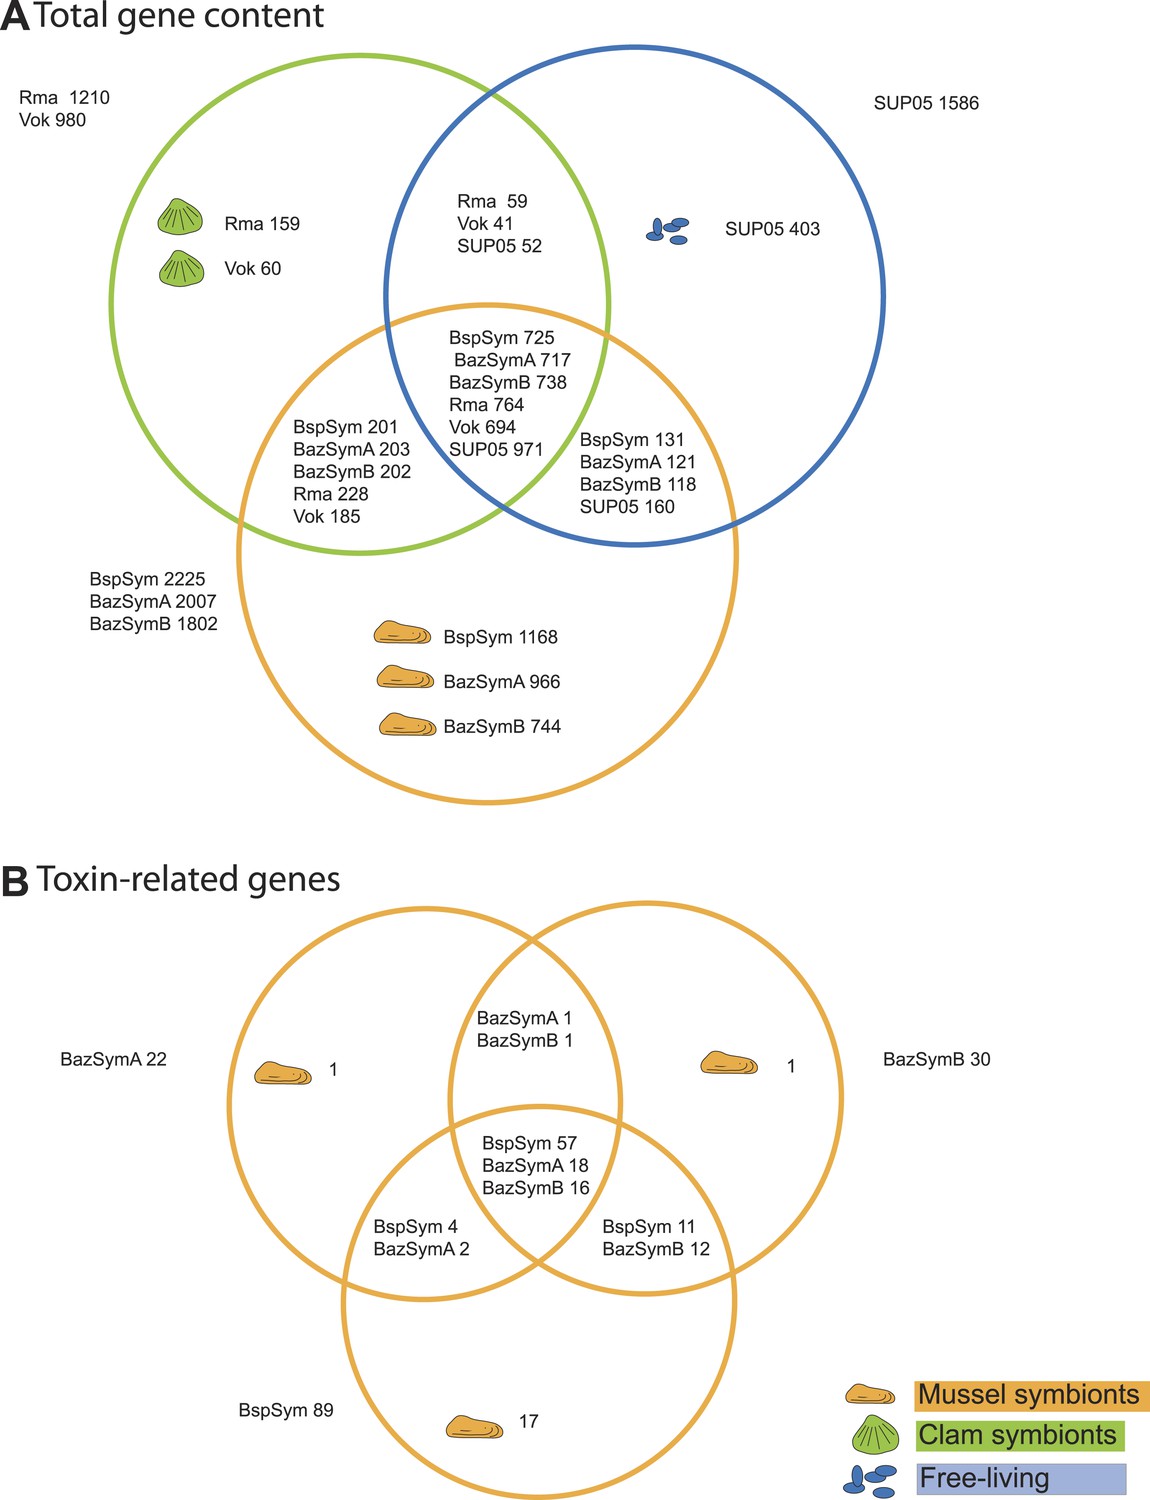
Genes shared between the Bathymodiolus and vesicomyid SOX symbionts and free-living SUP05.
Protein-coding sequences from the Bathymodiolus sulfur-oxidizing (SOX) symbiont were compared to the clam symbiont genomes and to the SUP05 metagenome from Walsh et al. (2009) with BLAST score ratios (BSR). (A) Venn diagram of the shared and unique gene content in the clam symbionts, mussel symbionts, and SUP05 bacteria. Predicted protein sequences of each mussel symbiont were compared to a combined data set of the clam symbionts (Rma and Vok) and SUP05. Similarly, protein sequences of each clam symbiont were compared to a combined data set of mussel symbionts (BspSym, BazSymB, and BazSymA). Depending on the reference genome, the number of shared genes varies slightly and possibly reflects the presence of paralogous genes and redundant sequence information in these draft genomes. Abbreviations are explained in detail in Table 1. The BLAST score ratio (BSR) threshold was 0.4. (B) Venn diagram of mussel symbiont toxin-related genes (TRGs), calculated with a BSR threshold of 0.2.
Figure 2—figure supplement 1
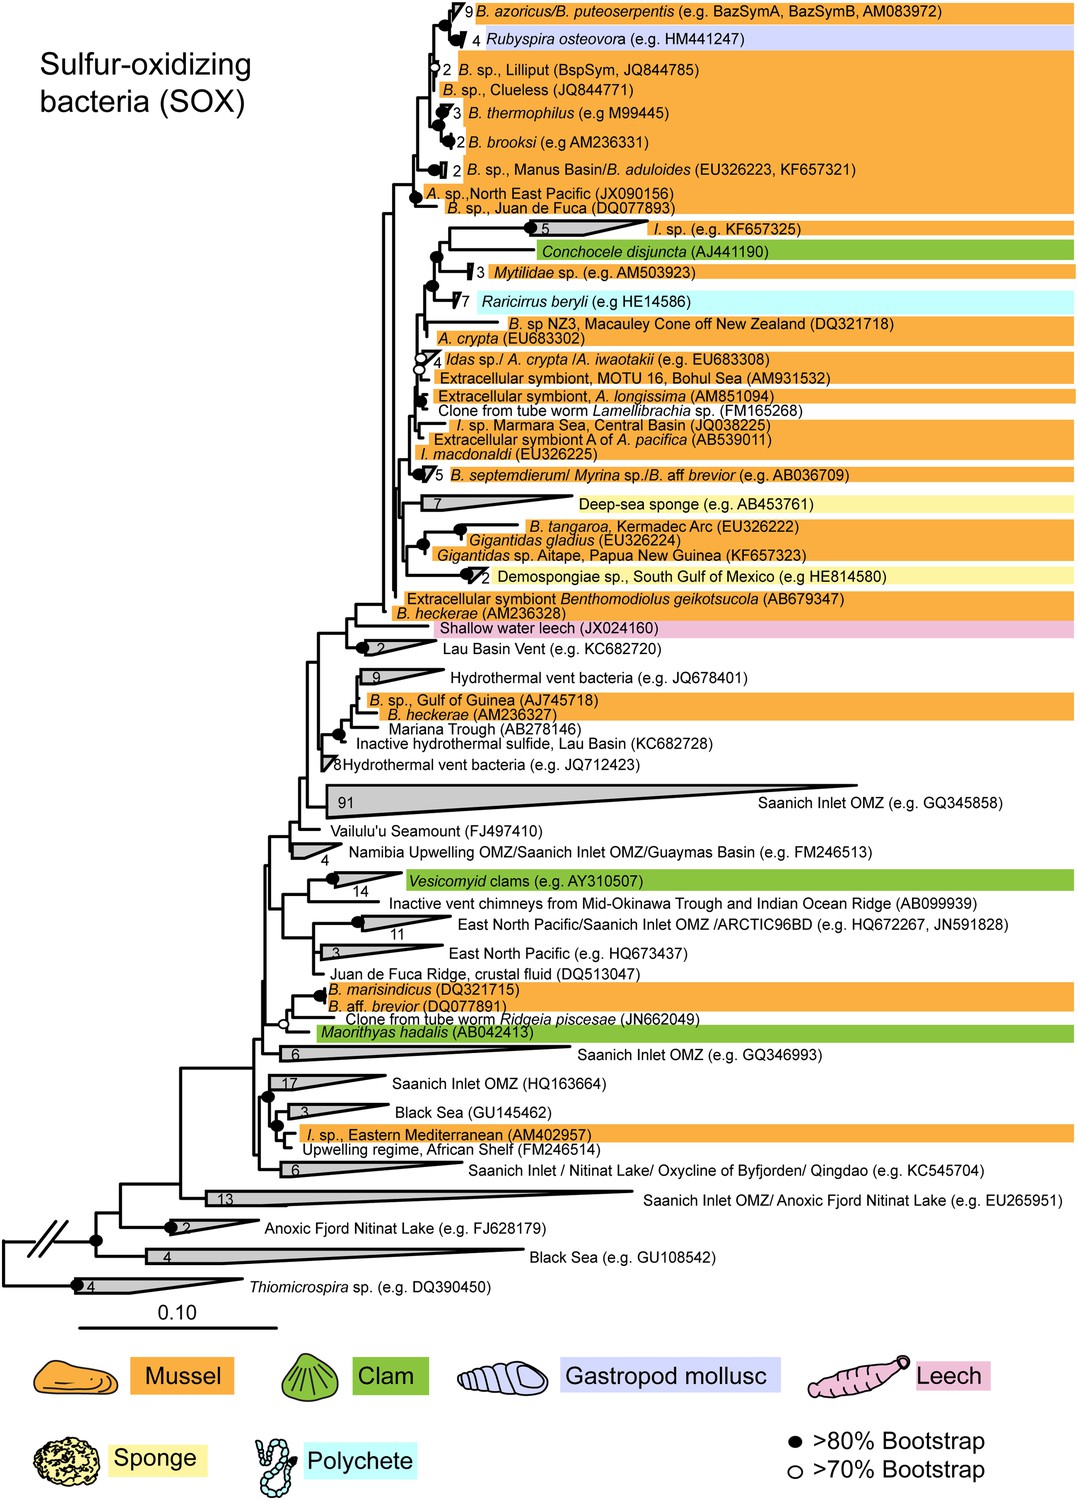
Maximum likelihood 16S rRNA phylogeny of the close relatives of the Bathymodiolus SOX symbionts.
The tree was estimated from an alignment of 1653 nucleotide positions and was rooted with four sequences from Thiomicrospira species. The number of sequences per collapsed group is shown next to the gray blocks. Diagonal lines in the out-group branch indicate that the branch is not to scale. B. = Bathymodiolus; A. = Adipicola; I. = Idas.
Figure 2—figure supplement 2
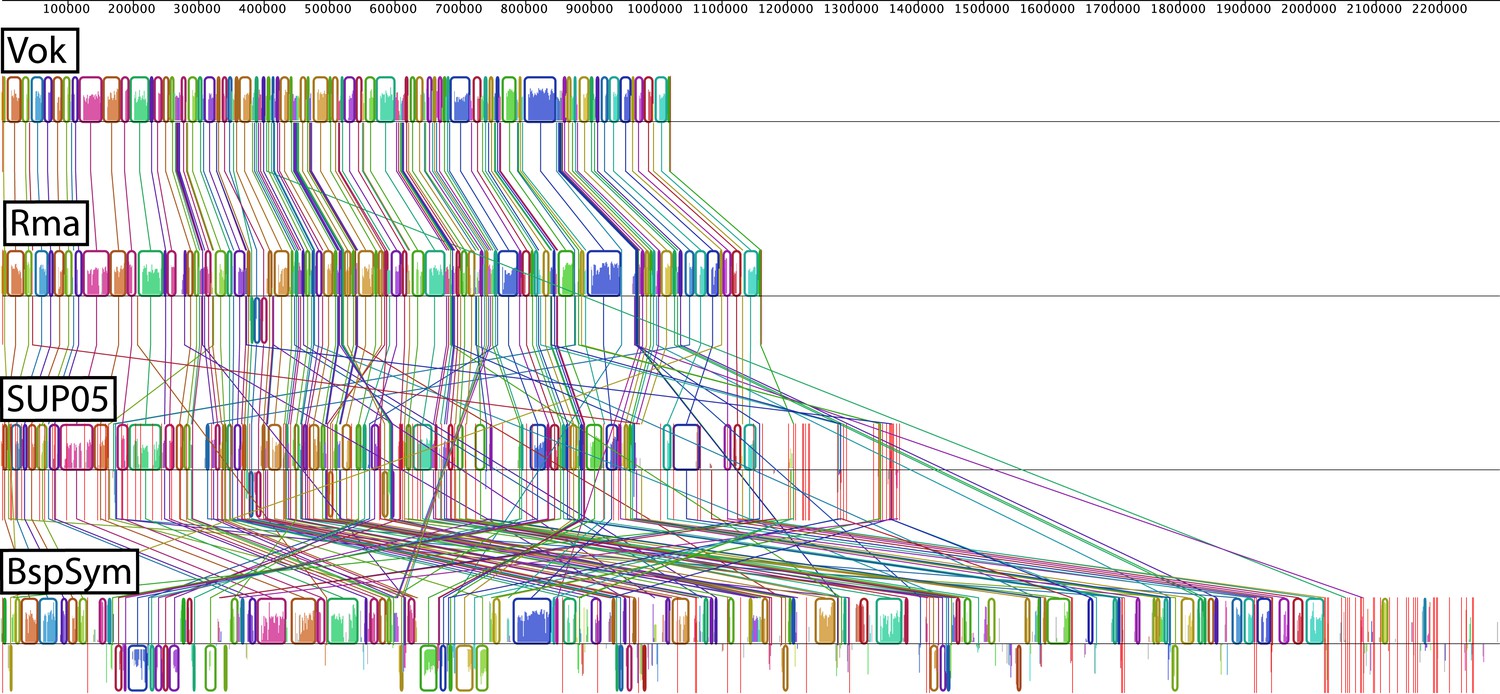
Whole genome alignment.
Each colored block is a region of the genome that aligned to part of another genome because it is homologous and the genes are arranged in the same order. Lines crossing represent conflicting information when compared to other genomes. These are the sites where lack of synteny was observed. Red vertical lines represent contig boundaries. BspSym = SOX symbiont of Bathymodiolus sp., Vok = SOX symbiont Candidatus Vesicomyosocious okutanii, Rma = SOX symbiont of Calyptogena magnifica (Ca. Ruthia magnifica), SUP05 = free-living marine sulfur oxidizers.
Figure 2—figure supplement 3

Metabolic reconstruction of the Bathymodiolus symbiont.
Key metabolic pathways were inferred from genomic information using Pathway Tools (Caspi et al., 2014). Red stars indicate that the gene was not found in the B. sp. symbiont genome, and blue stars indicate that the gene was not found in BazSymB, but was found in BazSymA, both symbionts of B. azoricus. Red arrow indicates a missing enzyme that could be replaced with an alternative reaction. Green arrow indicates an inorganic pyrophosphate-dependent step in the modified version of the Calvin cycle. Nar = nitrate reductase; Nir = nitrite reductase; Nor = nitric oxide reductase; Hup = membrane-bound hydrogenase; SOX = sulfur oxidation; rDSR = reverse dissimilatory sulfite reductase; Sqr = sulfide-quinone reductase; Apr = adenylsulfate reductase; SAT = sulfate adenyltransferase; P = phosphate; BP = biphosphate; COX = cytochrome c oxidase; Gln = glutamine; Arg = arginine; Pro = proline; Met = methionine; Lys = lysine; Thr = threonine; Ile = isoleucine; PPi = inorganic pyrophosphate; PPase = soluble pyrophosphatase; SS = secretion system.
Figure 3 with 1 supplement
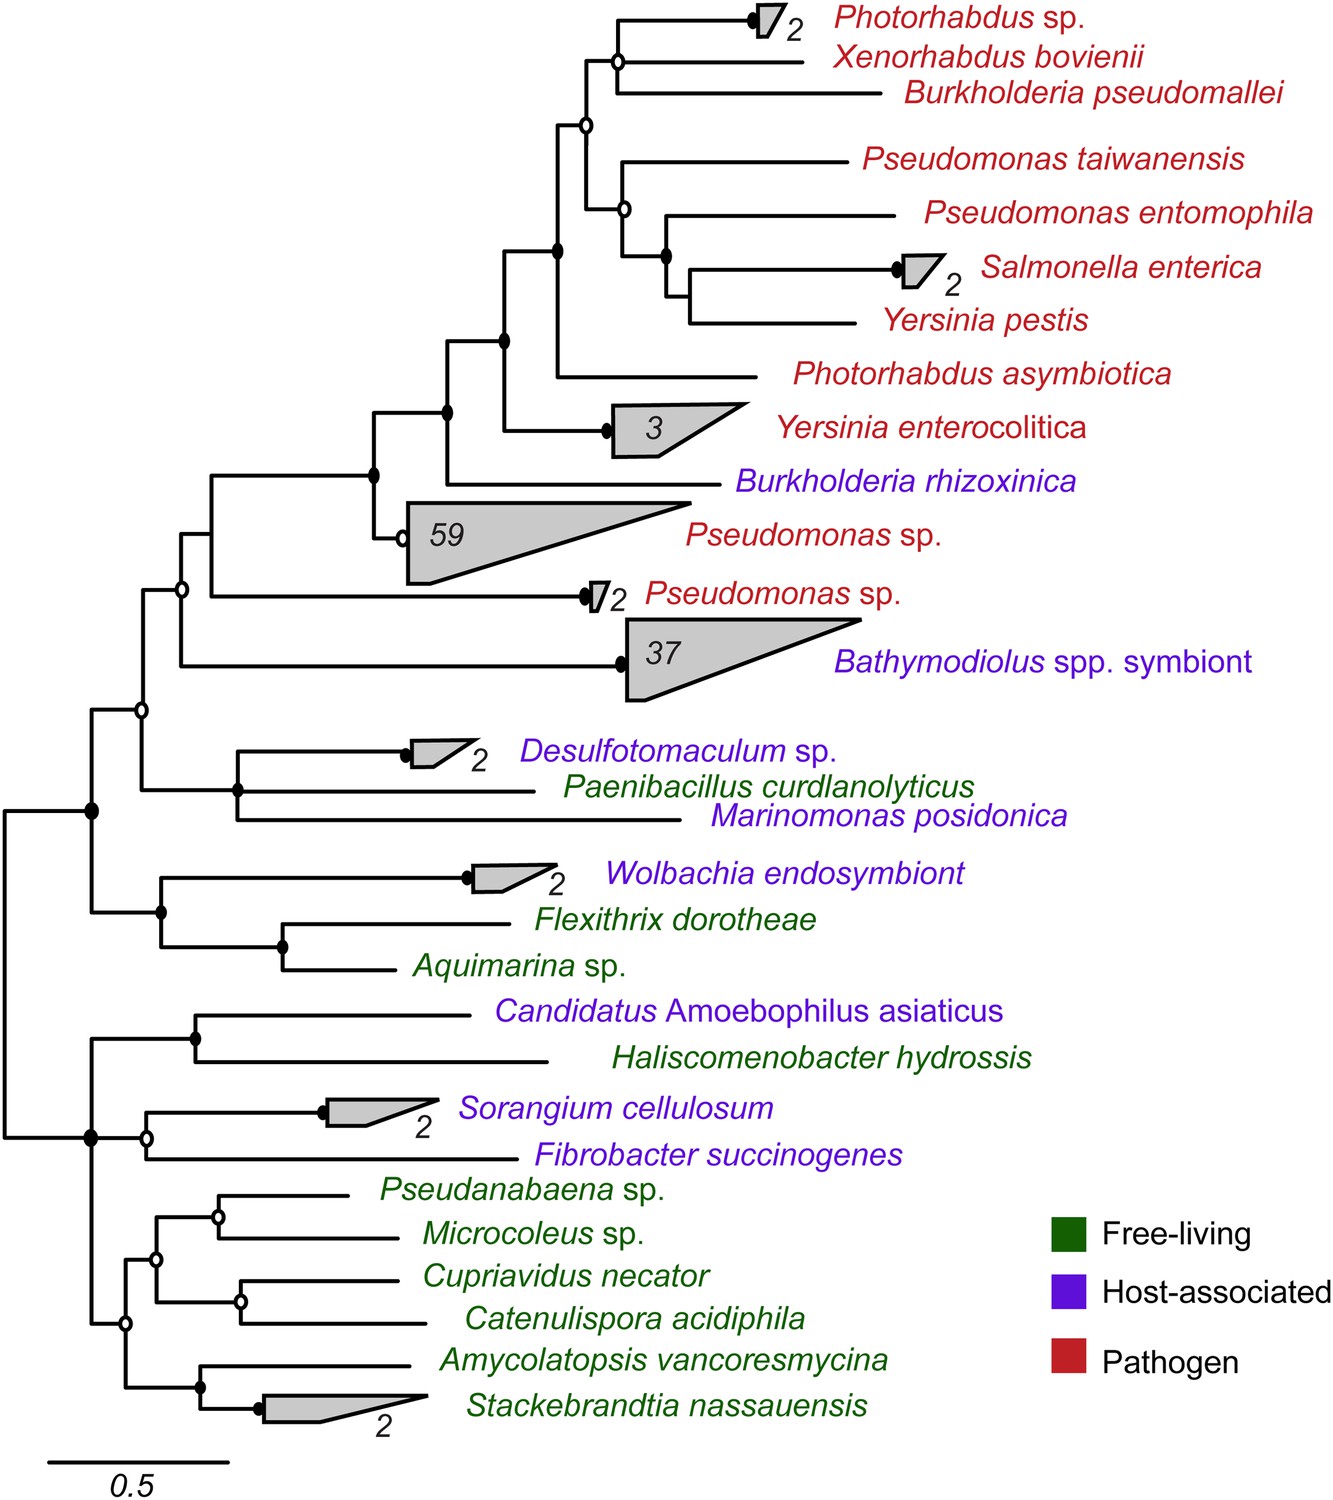
Phylogeny of YD repeat-containing proteins.
The tree is a consensus of bayesian and maximum likelihood analyses, result of an alignment of 536 amino acids. Black circles represent branches with posterior probability >0.8 and bootstrap value >80. White circles represent branches with either posterior probability >0.8 or bootstrap value >80. The number of sequences per collapsed group is shown next to the gray bloks. Purple: organism found in intestinal microflora or in close association with another organism; green: free-living; red: pathogen.
Figure 3—figure supplement 1
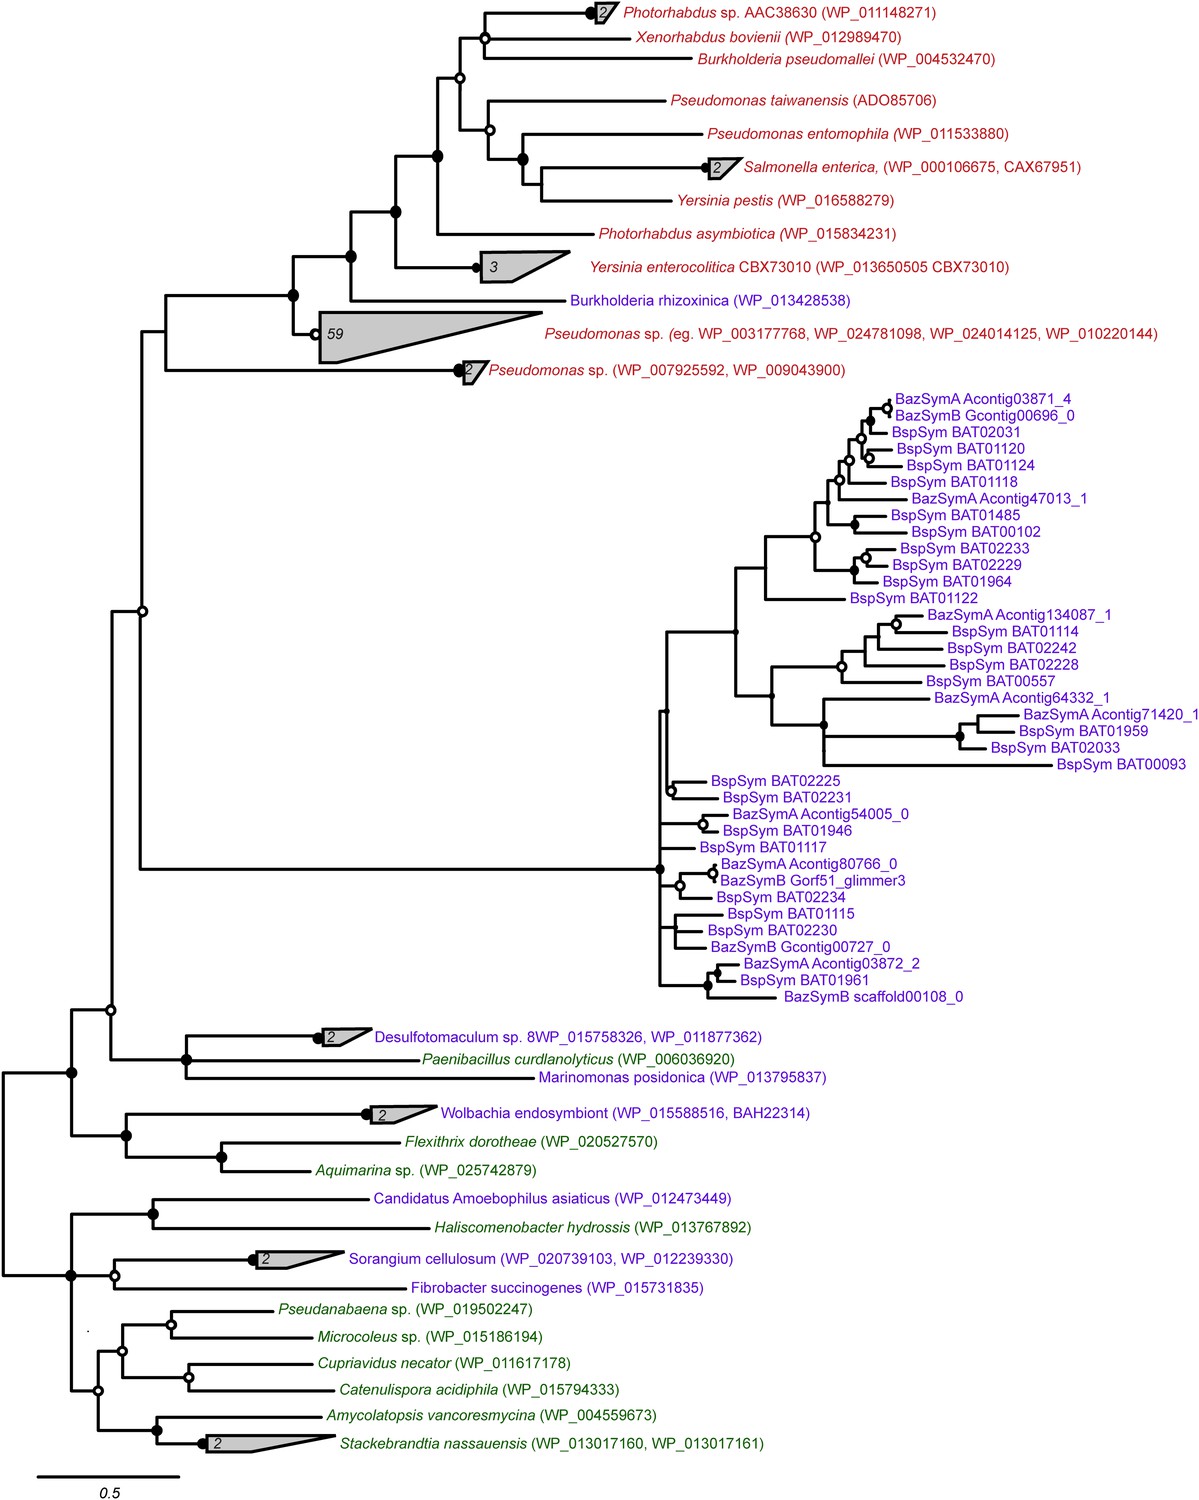
Consensus of bayesian and maximum likelihood phylogeny of YD proteins with identifiers.
Trees were estimated from an alignment of 536 amino acids. Circles represent branches with posterior probability higher than 0.8 and bootstrap values higher than 80/100. If both reconstruction methods are significant, the circle is black, otherwise it is white. Purple: found in intestinal microflora or in close association with other organisms; green: free-living; red: pathogen.
Figure 4 with 2 supplements
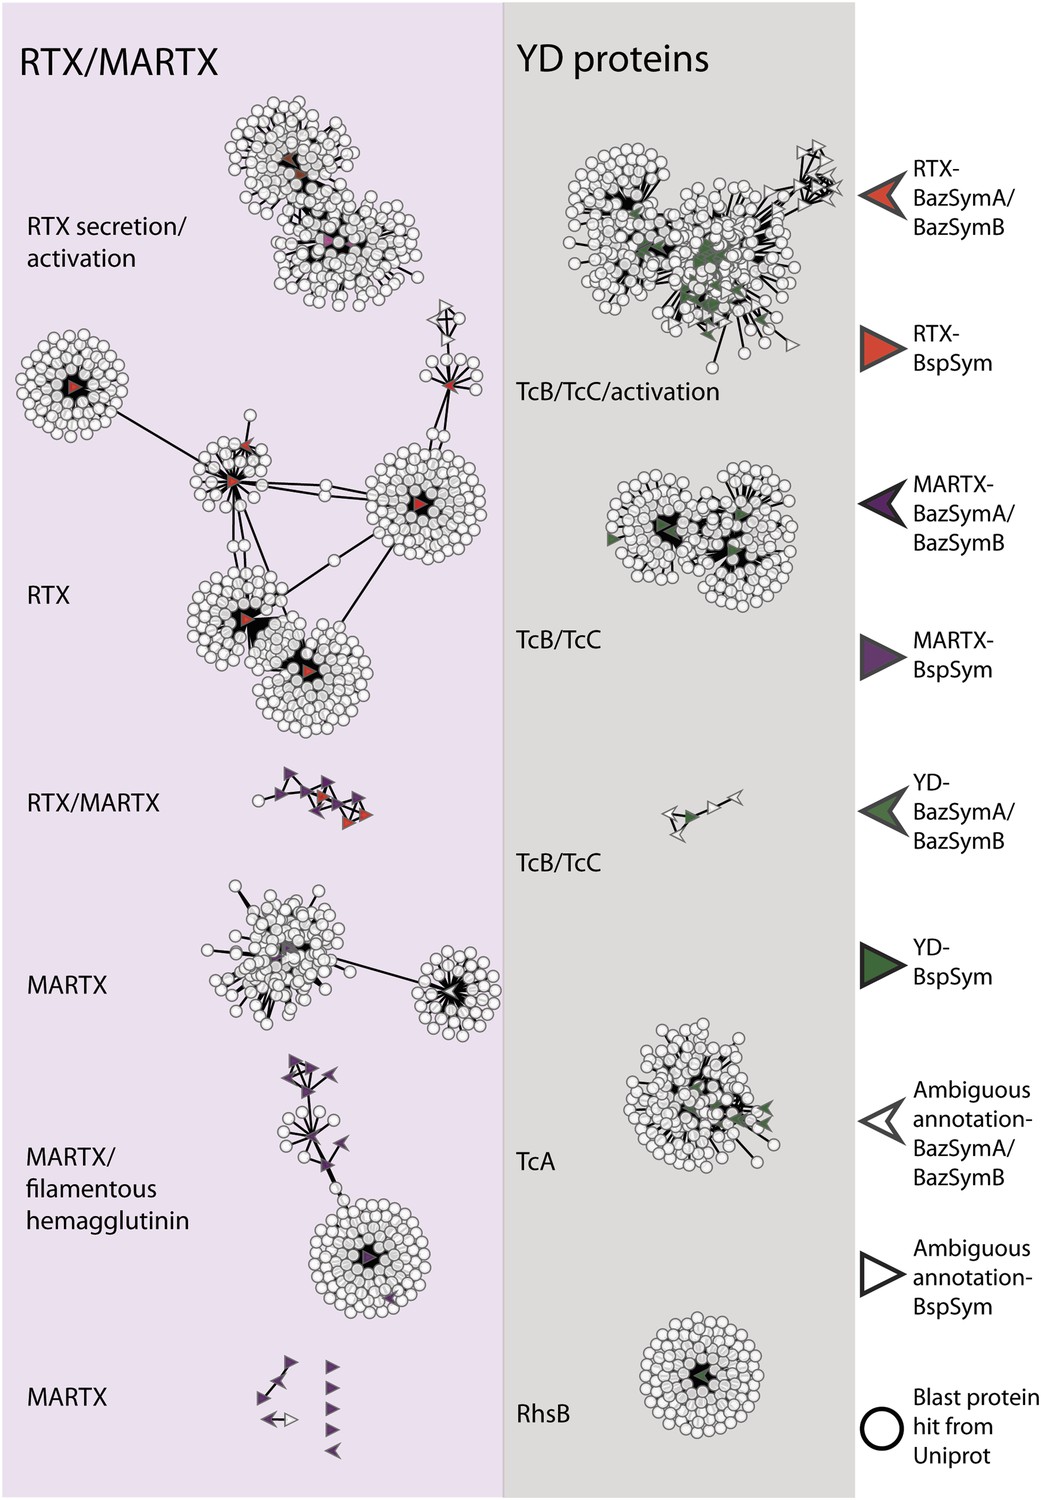
Protein similarity network of toxin-related proteins in the Bathymodiolus symbionts.
Each node corresponds to a protein sequence and the links between nodes represent BLAST hits. The length of the edges is inversely proportional to the sequence similarity. Protein clusters containing RTX or multifunctional autoprocessing RTX (MARTX) proteins are shown in the red panel on the left, and sequence clusters containing YD repeats are shown in the gray panel on the right. Arrowheads are proteins from B. azoricus symbionts, and triangles are proteins from B. sp. symbionts. The symbols are colored in green if they were identified in the Bathymodiolus symbionts as YD repeat-containing genes, red if they were identified as RTX genes, and purple for MARTX genes. Some protein sequences were similar to the TRGs but not annotated as such as these are partial genes that did not have any conserved domain. If the clusters contained mostly genes with a particular annotation, we named the clusters after these annotations, for example, cluster ‘TcB/TcC’ contained proteins annotated as TcB or TcC.
Figure 4—figure supplement 1
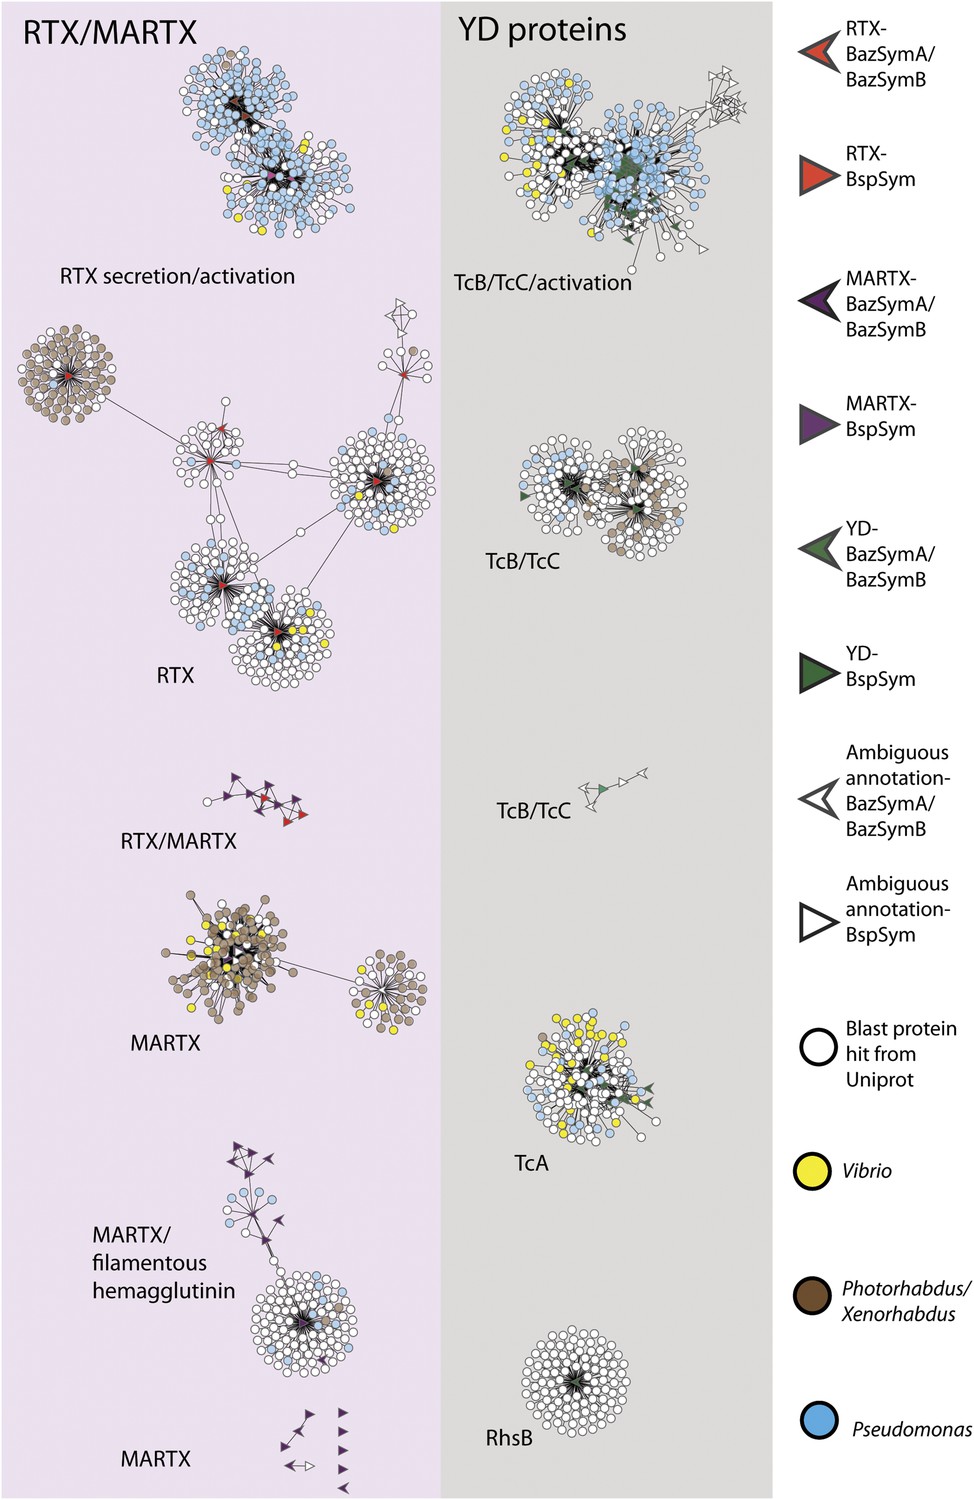
Network of toxin-related proteins in the Bathymodiolus symbionts with BLAST hits from Vibrio, Photorhabdus, Xenorhabdus, and Pseudomonas highlighted.
Each node corresponds to a protein sequence and the links between nodes represent BLAST hits. The length of the link is proportional to the sequence similarity. Protein clusters containing RTX or MARTX are shown in the red panel on the left. Sequence clusters containing YD repeats are shown in the gray panel on the right. Arrowheads are proteins from B. azoricus symbionts, and triangles are proteins from B. sp. symbionts. The symbols are colored in green if they could be identified in the Bathymodiolus symbionts as YD repeat-containing proteins, red if they could be identified as RTX proteins, and purple for MARTX. If the clusters contained mostly proteins with a particular annotation, we named the clusters after these annotations, for example, cluster ‘TcB/TcC’ contained proteins annotated as TcB or TcC.
Figure 4—figure supplement 2
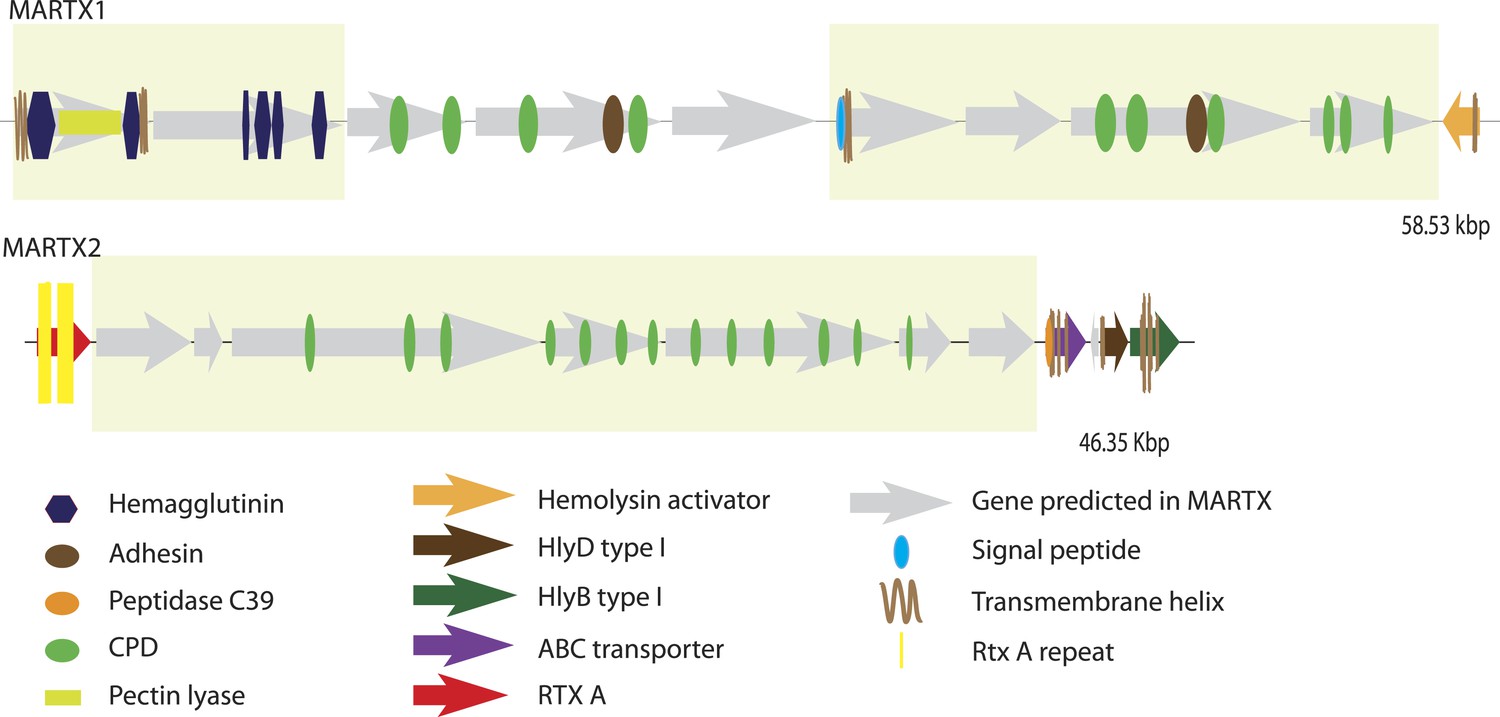
Genomic architecture of MARTX regions.
The two MARTX regions in BspSym are shown. Operons identified by assembling transcriptome data are indicated in yellow boxes.
Figure 5 with 3 supplements
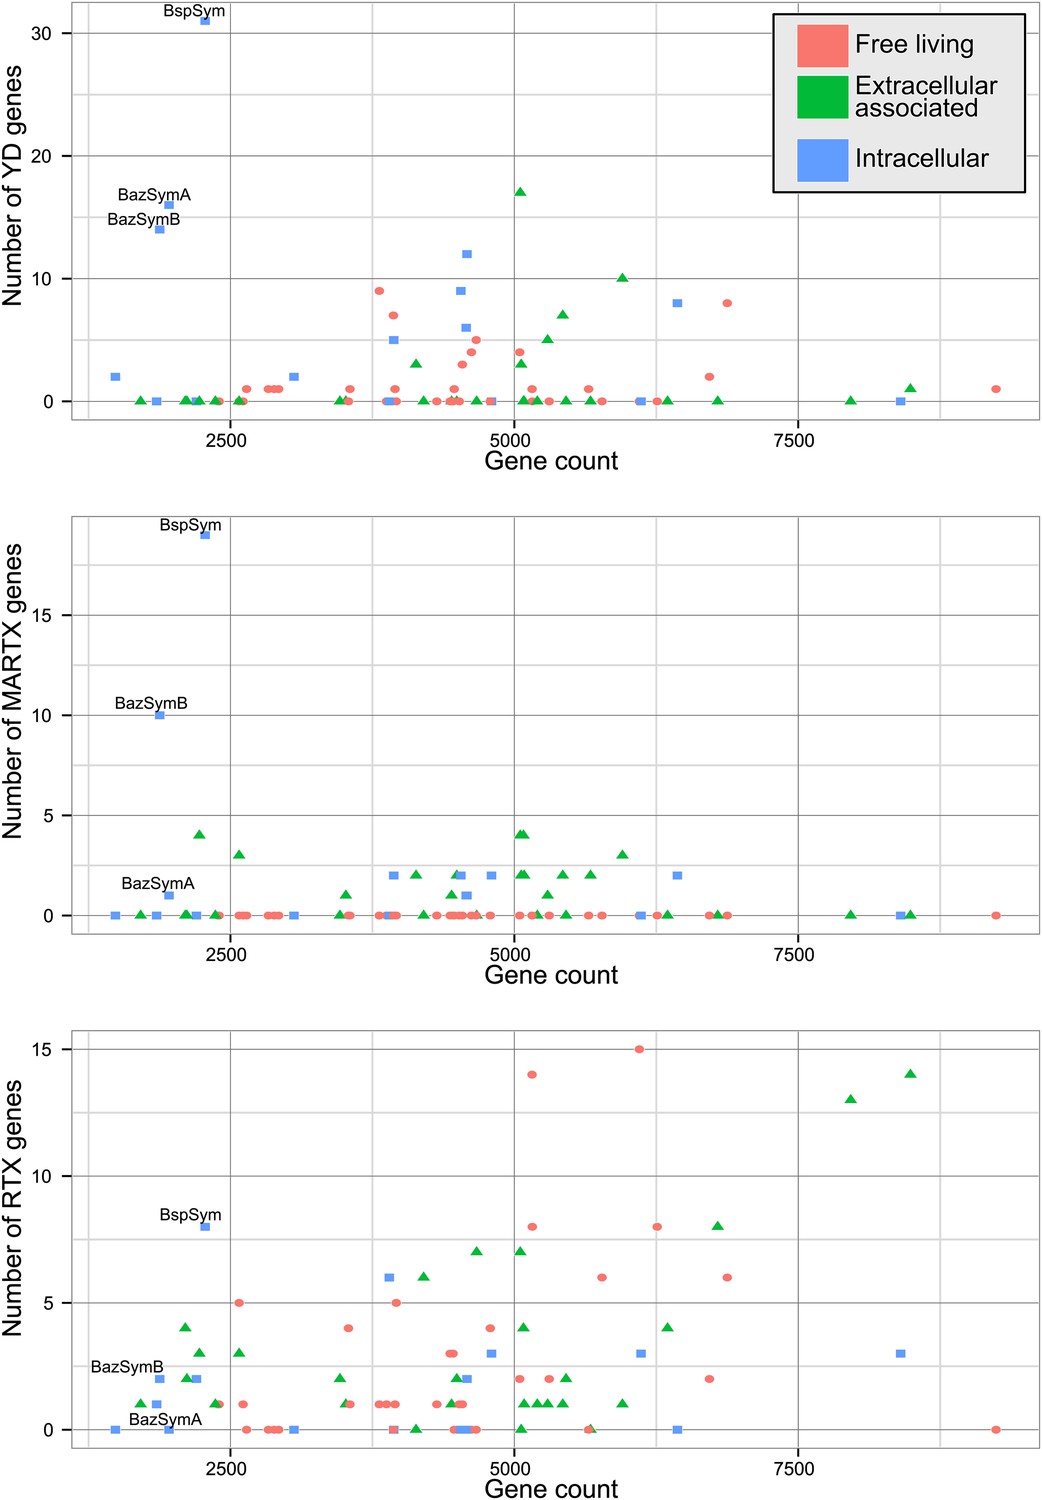
Distribution of the three major TRGs classes according to lifestyle.
Each dot represents one sequenced genome. The sum of TRGs is on the Y axis, and the total number of genes predicted in each genome is on the X axis. Free-living bacteria are shown in red, host-associated bacteria that live outside of host cells are in green, and host-associated bacteria that can live inside host cells are shown in blue. The positions of the Bathymodiolus SOX symbionts are indicated. A detailed overview of all organisms that had similar TRGs to the SOX symbiont with the number of TRGs is shown in Supplementary file 1B.
Figure 5—figure supplement 1
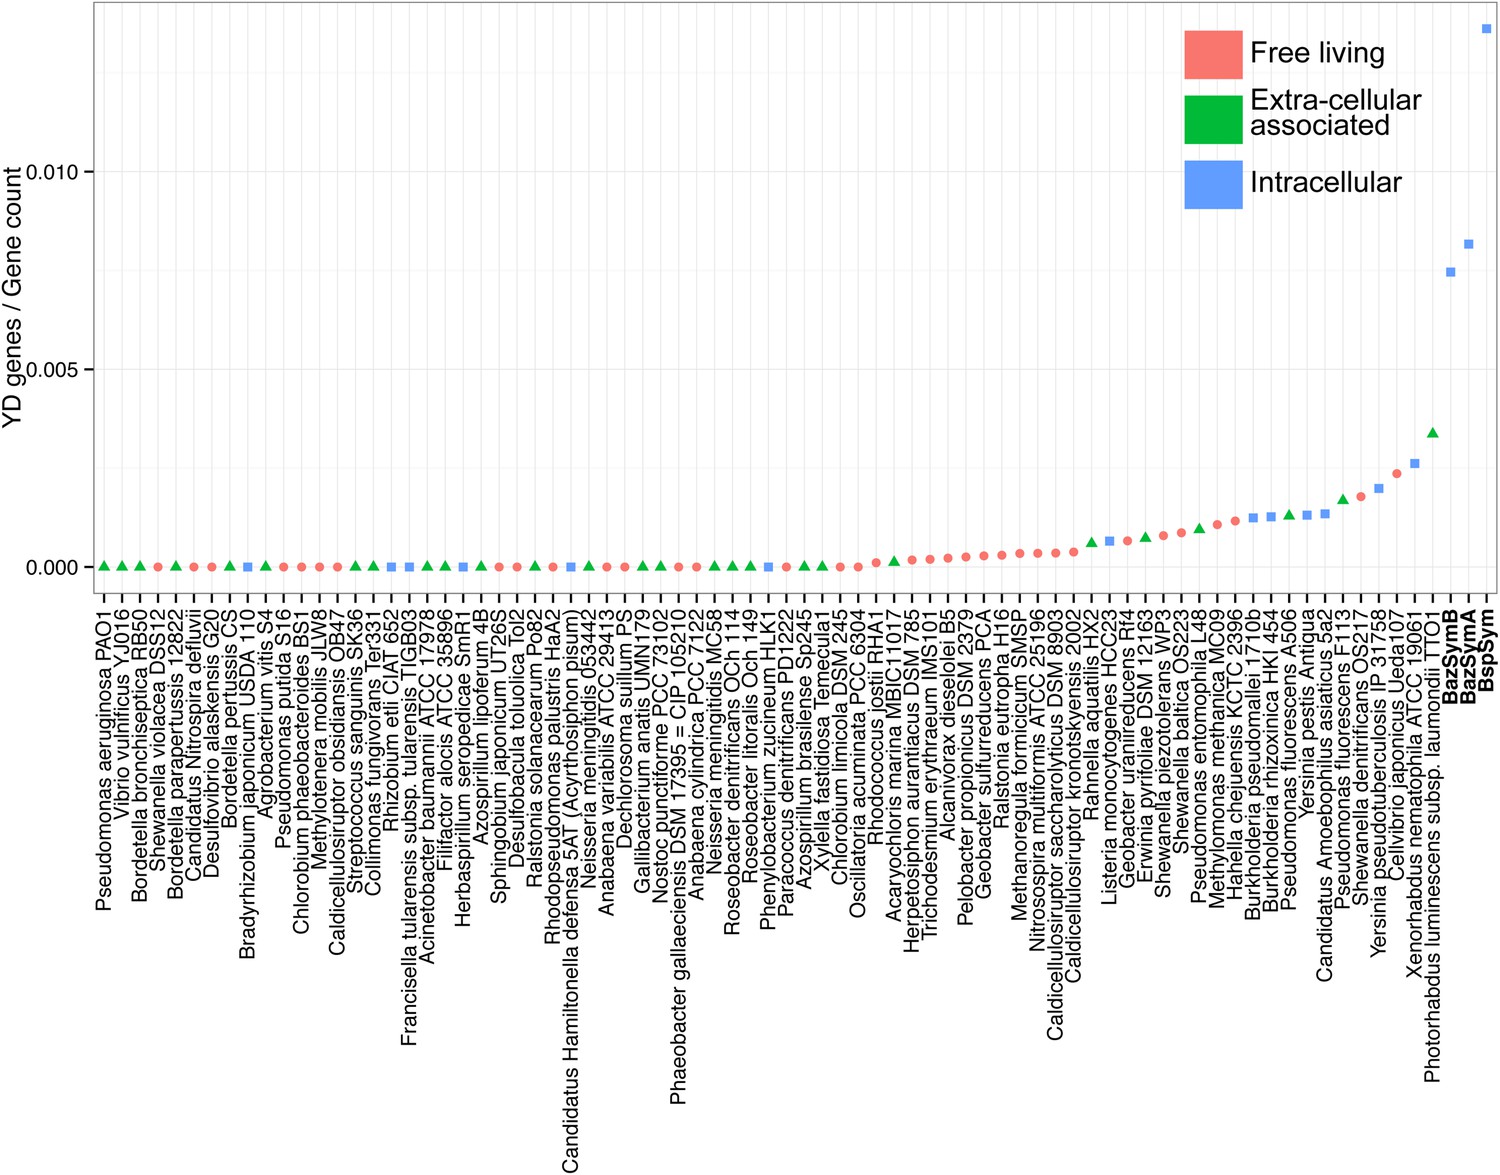
YD genes per genome, normalized to the total gene count.
Each dot is colored by the category to which they belong. Bathymodiolus SOX symbionts are highlighted.
Figure 5—figure supplement 2
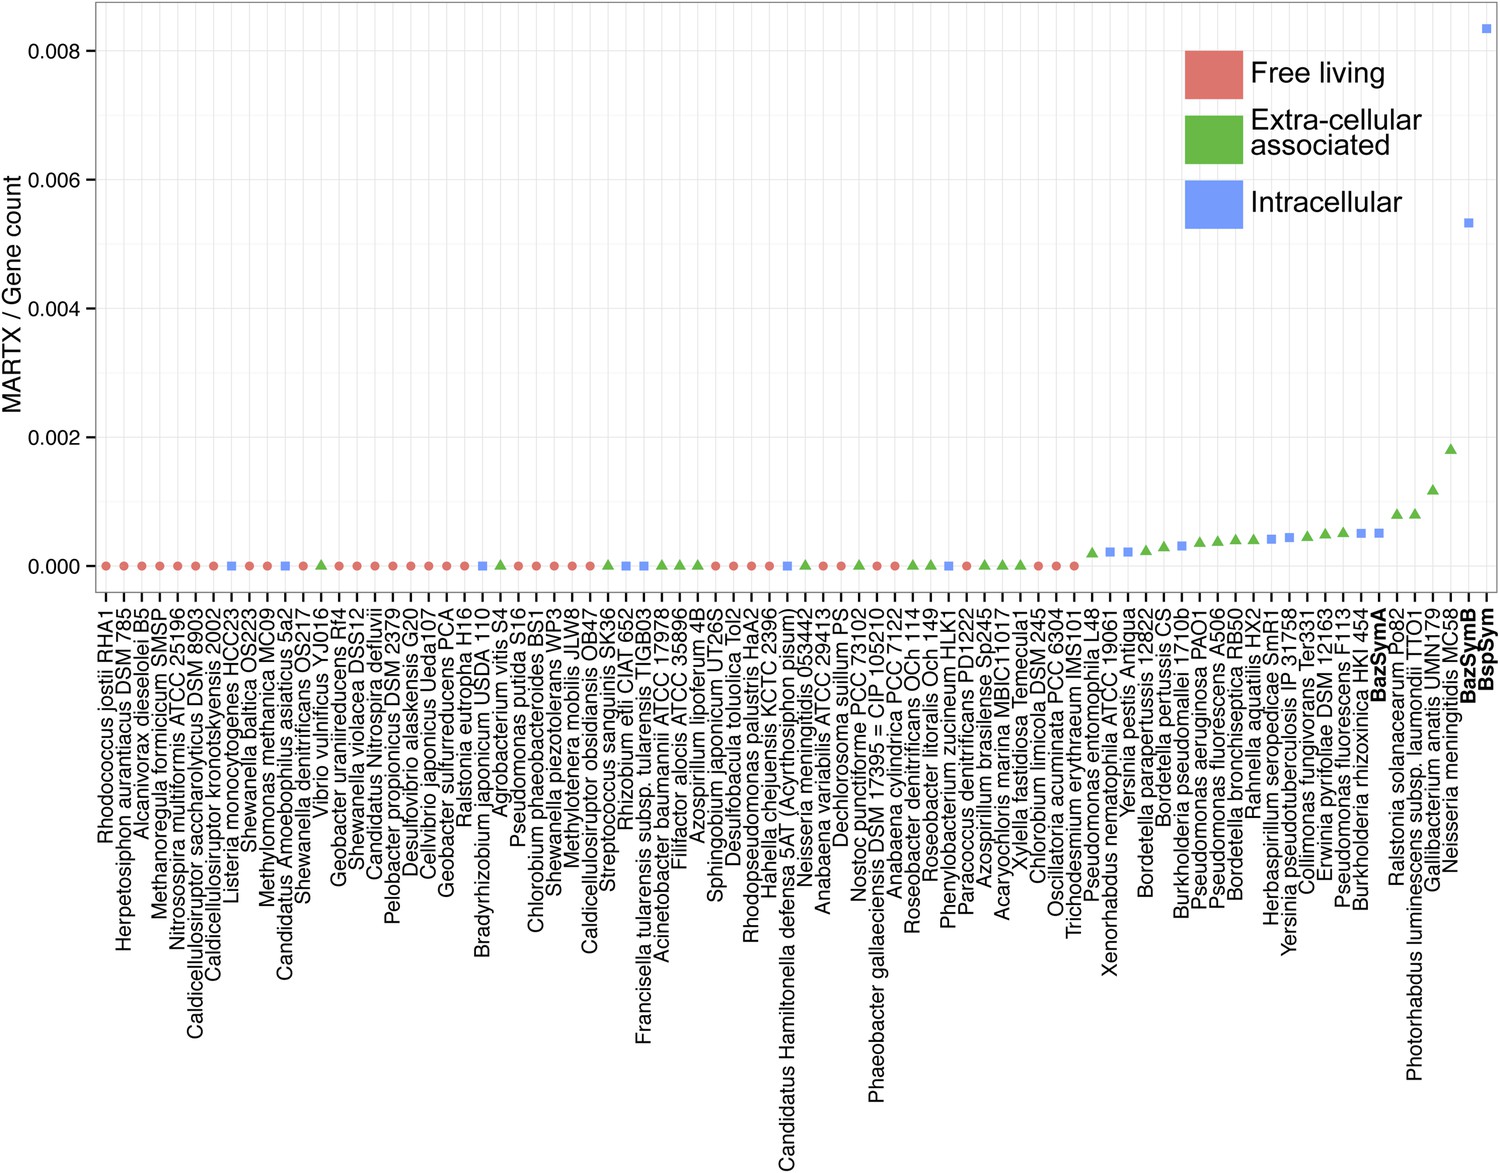
MARTX genes per genome, normalized to the total gene count.
Each dot is colored by the category to which they belong. Bathymodiolus SOX symbionts are highlighted.
Figure 5—figure supplement 3
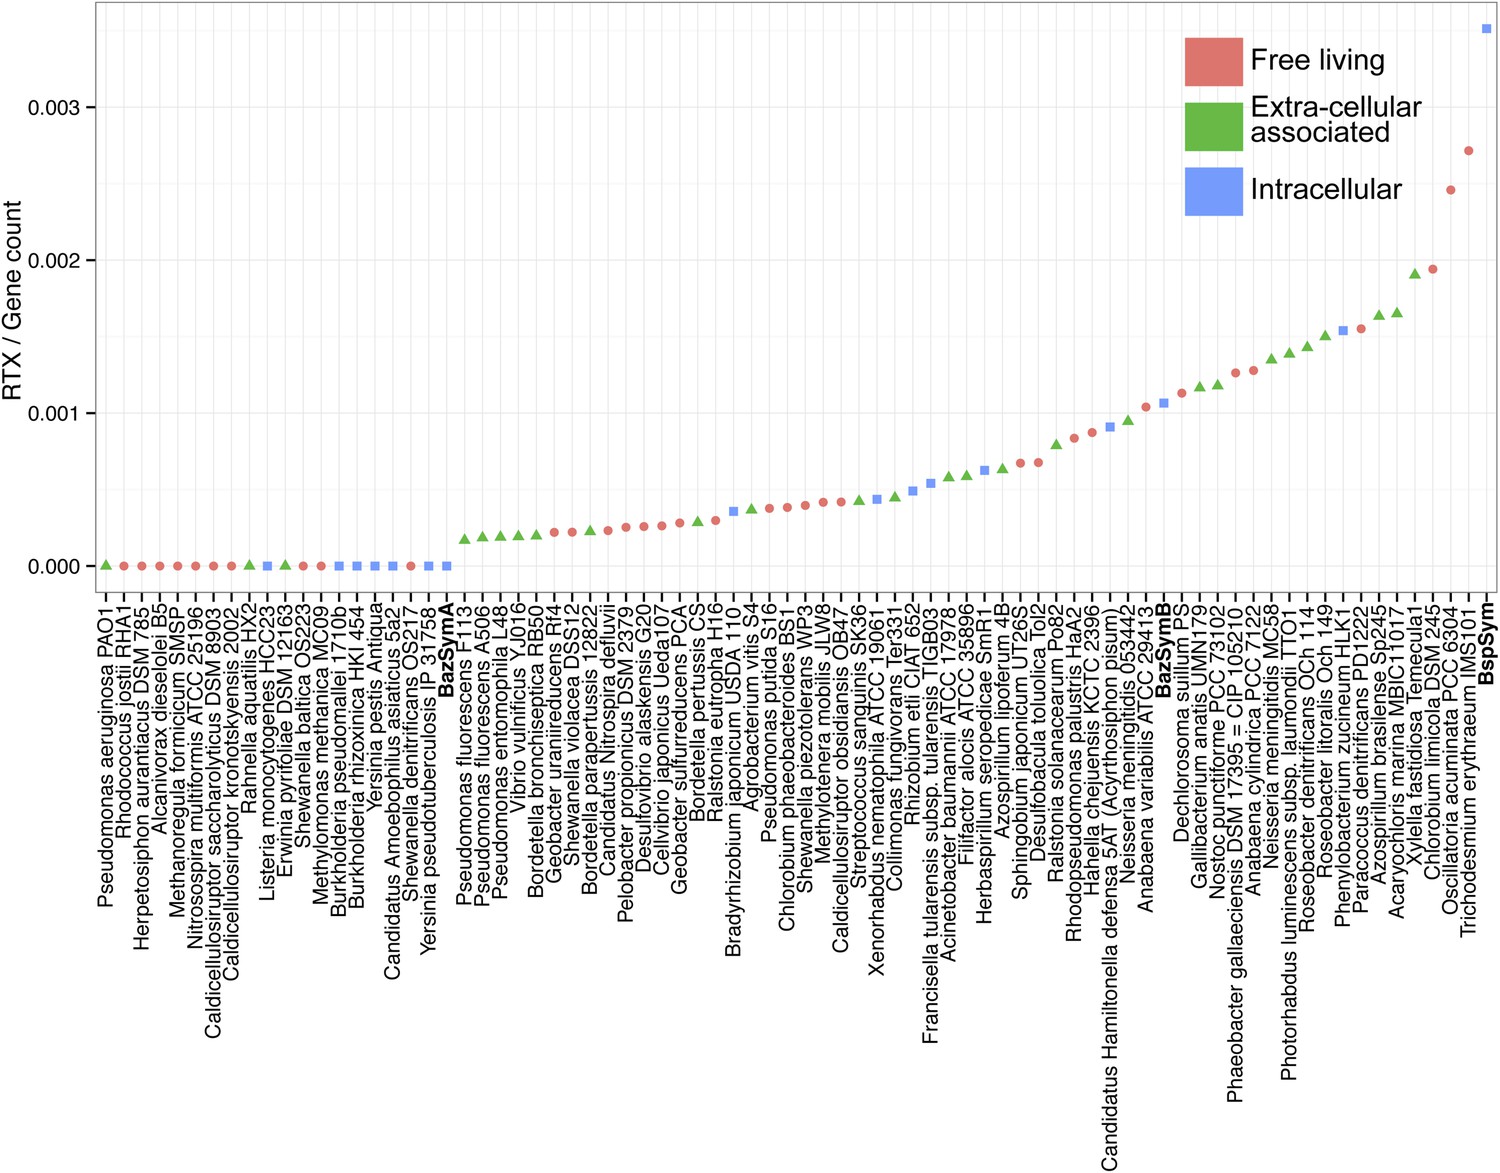
RTX genes per genome, normalized to the total gene count.
Each dot is colored by the category to which they belong. Bathymodiolus SOX symbionts are highlighted.
Figure 6
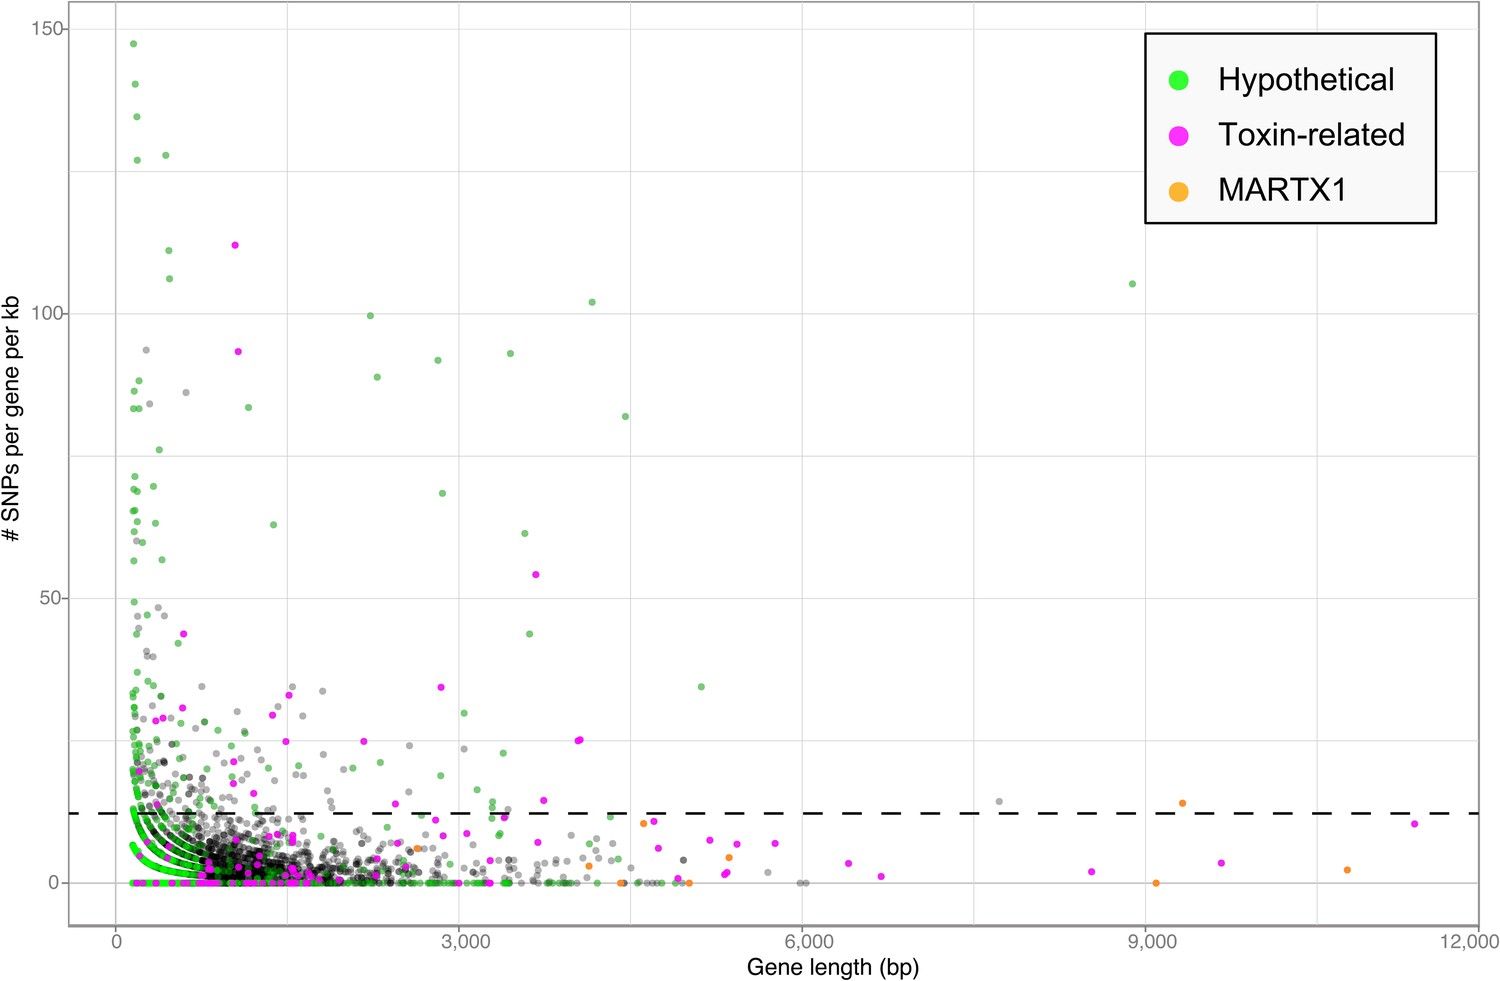
Single nucleotide polymorphisms per gene.
The number of single nucleotide polymorphisms (SNPs) per gene was normalized according to the length minus regions of unknown sequence for genes containing N's. Genes smaller than 150 bp were not considered. The dotted line represents the median plus one standard deviation of the number of SNPs per gene per kb.
-
Figure 6—source data 1
Variability in TRGs encoded by the Bathymodiolus SOX symbionts.
- https://doi.org/10.7554/eLife.07966.021
Tables
Table 1
Overview of the genomes compared in this study: SOX symbiont of B. sp, two individual SOX symbionts of B. azoricus, SOX symbiont Candidatus Vesicomyosocious okutanii, SOX symbiont of Calyptogena magnifica (Candidatus Ruthia magnifica), and free-living SUP05
| Genome | Collection site | Contigs | GC content (%) | Length/Span (Mbp)† | Number of CDSs | HGT | Estimated completeness‡ | Coverage§ | Separation method# | References |
|---|---|---|---|---|---|---|---|---|---|---|
| B. sp symbiont (BspSym) | Lilliput | 52 | 38.23 | 1.8/2.3 | 2225 | 33% | 95.39% | 22X | Filtration | Petersen et al., 2011, this study |
| B. azoricus symbiont (BazSymB) | Menez Gwen | 239 | 38.20 | 1.5/1.7 | 1802 | 30% | 90.60% | 8X | Gradient centrifugation/ binning | This study |
| B. azoricus symbiont (BazSymA)* | Menez Gwen | 506 | 37.58 | 1.85/1.85 | 2008 | 35% | 97.70% | 59X | Binning | This study |
| Ca. V. okutanii | Sagami Bay | 1 | 31.59 | 1.0/1.0 | 980 | 26% | 93.58% | – | Whole genome assembly | Kuwahara et al., 2007 |
| Ca. R. magnifica | East Pacific Rise, 9°N | 1 | 34.03 | 1.2/1.2 | 1210 | 23% | 94.84% | – | Whole genome assembly | Newton et al., 2007 |
| SUP05 | Saanich Inlet | 97 | 39.29 | 1.4/2.5 | 1586 | 30% | 85.76% | – | Binning | Walsh et al., 2009 |
-
SOX, sulfur-oxidizing.
-
*
SOX symbiont sequences recovered from metagenome of adductor muscle.
-
HGT = Genes that potentially originated from horizontal gene transfer.
-
†
Length is the total length of sequence information on contigs without Ns, and span is the entire length of scaffold assembly including Ns.
-
‡
The completeness of the genome was estimated with CheckM using a set of lineage-specific genes for proteobacteria (Parks et al., 2015).
-
§
Median coverage.
-
#
Separation method indicates the experimental separation of symbionts from host tissue and co-occurring symbionts (filtration or gradient centrifugation), or the in silico separation of genomic information from hosts and co-occurring bacteria (binning).
Table 2
p-values obtained with Kruskal–Wallis rank sum test
| B/NB df = 1 | P/NP df = 1 | Ext/Int/FL df = 2 | |
|---|---|---|---|
| YD | 0.097 | 0.5217 | 0.010* |
| RTX | 0.715 | 0.793 | 0.308 |
| MARTX | 0.773 | 0.007* | 3.21e−06* |
-
The three main lifestyle categories were tested against each toxin-related class. Number of TRGs per genome was normalized to the total gene count.
-
FL = free-living, Ext = extracellular host-associated, Int = intracellular host-associated, P = pathogen, NP = non-pathogen, B = found in biofilms, NB = not found in biofilms, df = degrees of freedom, TRG, toxin-related gene, MARTX, multifunctional autoprocessing RTX.
-
*
p-value was considered to be significant (p < 0.05).
Table 3
p-values obtained with Mann–Whitney–Wilcoxon test for enrichment of YD and MARTX genes similar to those from the SOX symbiont
Table 4
Toxin-related proteins found in the proteome of the SOX symbiont from B. azoricus
| Proteome | Identifier | Category | Annotation | Molecular weight (kDa) | Max. number of unique peptides* |
|---|---|---|---|---|---|
| SM | Host_EST_000107 | YD | IPR006530|YD repeat | 43 | 11 |
| SM | Host_EST_000115 | YD | IPR006530|YD repeat | 42 | 12 |
| N | Host_EST_000248 | YD | IPR006530|YD repeat | 37 | 7 |
| M | Host_EST_002123 | YD | IPR006530|YD repeat | 24 | 5 |
| SM† | Thio_BAZ_1943_contig360420_0 | RTX (activator) | Hemolysin-activating lysine-acyltransferase (Hemolysin C) | 19 | 3 |
| SM | Tox_BAZ_119_contig00027_0 | YD | RHS repeat-associated core domain-containing protein | 202 | 17 |
| SM | Tox_BAZ_120_contig00027_1 | YD | Virulence plasmid 28.1 kDa A protein | 62 | 11 |
| SM | Tox_BAZ_1734_contig02141_2 | RTX (transporter) | Secretion protein HlyD family protein | 43 | 10 |
| SM | Tox_BAZ_2494_contig00030_0 | YD | Virulence plasmid 28.1 kDa A protein | 183 | 33 |
| M | Tox_BAZ_3202_scaffold00038_7 | RTX | Hemolysins and related proteins containing CBS domains | 35 | 2 |
| SM | Tox_BAZ_525_contig104979_0 | YD | Virulence plasmid 28.1 kDa A protein | 52 | 2 |
| S† | ToxAzor_892893 | YD | Rhs | 114 | 2 |
| SM | ToxSMAR_1260BAT01109 | YD | [weak similarity to] Toxin complex/plasmid virulence protein | 321 | 8 |
| N | ToxSMAR_2052BAT01788, Thio_BAZ_1733_contig02141_1 or Thio_BAZ_2580_scaffold00010_8 | RTX (transporter) | Toxin secretion ATP-binding protein | 79 | 5 |
| S | ToxSMAR893-894 | YD | Rhs family protein | 103 | 1 |
| SM | ToxAzor_890891 | YD | Rhs family protein | 67 | 6 |
-
S = soluble proteome, M = membrane-enriched proteome, SM = found in both proteomes, SOX, sulfur-oxidizing.
-
*
The highest number of unique peptides detected in one sample.
-
†
Proteins that are potentially exported by the symbiont to the host gill tissue.
Additional files
-
Supplementary file 1
(A) Number of mobile elements in the genomes compared in this study. (B) Genomes with toxin-related genes (TRGs) similar to those of the sulfur-oxidizing (SOX) symbionts of Bathymodiolus. The number of genes per TRGs class is shown. (C) p-values obtained with one-way Permanova were corrected with Bonferroni correction for multiple testing. Number of TRGs per genome was normalized to the total gene count. (D) Transcriptome counts of three individuals from B. azoricus and three individuals from B. sp. were mapped to their respective reference genomes with Rockhopper. Expression values of TRGs were normalized to the expression of RubisCO. (E) Samples used in this study. (F) Primer sequences and annealing temperatures used to detect genome rearrangements. (G) Metagenomes and metatranscriptomes enriched in SUP05 from oxygen minimum zones (OMZ) or hydrothermal vents. (H) Amino acid sequences from the following genomes were used in the reference database for proteomic analysis (IncDB). The genomes belong to relatives of the SOX and methane-oxidizing (MOX) symbionts of B. azoricus, as well as the mussel host. (I) Details of expressed toxin-related proteins identified with proteomics. The values are given in % normalized spectral abundance factor (NSAF), which is a normalized spectral abundance factor that gives the relative abundance of a protein in a sample in %.
- https://doi.org/10.7554/eLife.07966.023
Download links
A two-part list of links to download the article, or parts of the article, in various formats.
Downloads (link to download the article as PDF)
Open citations (links to open the citations from this article in various online reference manager services)
Cite this article (links to download the citations from this article in formats compatible with various reference manager tools)
Abundant toxin-related genes in the genomes of beneficial symbionts from deep-sea hydrothermal vent mussels
eLife 4:e07966.
https://doi.org/10.7554/eLife.07966


