First quantitative high-throughput screen in zebrafish identifies novel pathways for increasing pancreatic β-cell mass
- Johns Hopkins University, United States
- Georgia Regents University, United States
- University of Macau, China
Figures
Figure 1 with 1 supplement
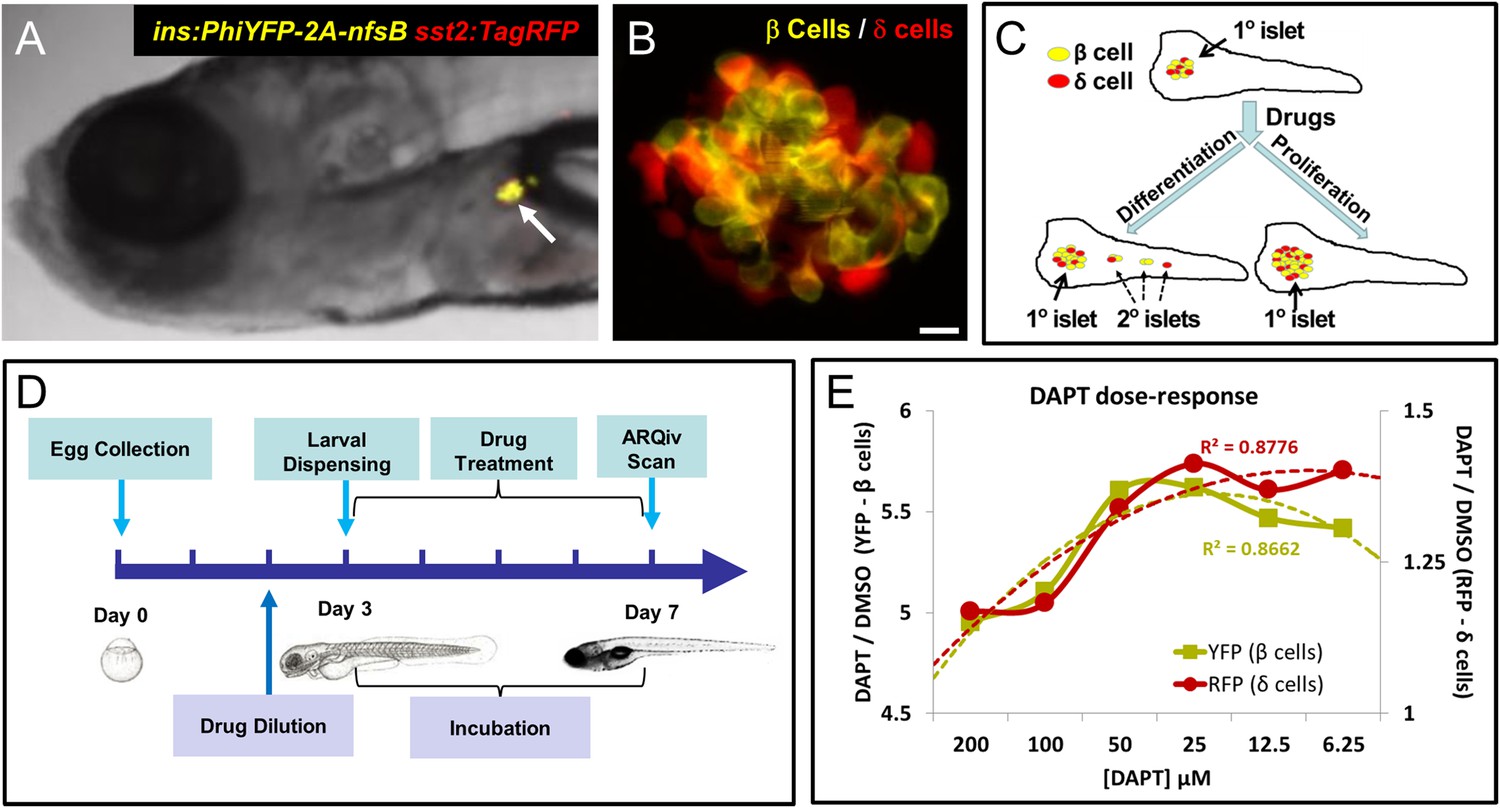
Screening resources, design, and controls.
(A) Transgenic line used for the primary screen, Tg(ins:PhiYFP-2a-nsfB, sst2:tagRFP)lmc01 (β/δ reporter; Walker et al., 2012), the insulin promoter drives YFP-expression in β cells (yellow), the somatostatin 2 promoter drives RFP expression in neighboring δ cells (red). Photomicrograph of the anterior region of a 7 dpf larva shows YFP and RFP labeling of the principal islet (arrow). (B) Confocal z-projection of the principal islet in a β/δ-reporter fish (scale bar: 10 µM), YFP labeling β cells (yellow) and RFP labeling δ cells (red)—note, apparent ‘orange’ co-labeling is an artifact of z-projection in 2D format. (C) Illustration of two potential mechanisms by which drug exposures could lead to increased β-cell mass: (1) enhanced endocrine differentiation, indicated by secondary (2°) islet formation (left path) and (2) increased β-cell proliferation, indicated by supernumerary β cell numbers in the principal islet (right path) in the absence of effects on endocrine differentiation—that is, no effect on 2° islet formation. (D) Schematic of the ARQiv-HTS screening process: Day 0, mass breeding produced 5000–10,000 eggs per day; Day 2 (evening), JHDL compounds were serially diluted into drug plates; Day 3, the COPAS-XL (Union Biometrica) was used to dispense individual 3 dpf larvae into single wells of drug plates, and plates were then maintained under standard conditions for 4 days; Day 7, larvae were anesthetized and reporters quantified by automated reporter quantification in vivo (ARQiv). (E) β/δ-reporter larvae were exposed to 0.1% DMSO (negative control) or the γ-secretase/Notch inhibitor DAPT (positive control) at six different concentrations from 3 to 7 dpf. ARQiv was then used to measure fluorescent signals from β cells (yellow line, left y-axis) and δ cells (red line, right y-axis). The DAPT to DMSO ratio (DAPT/DMSO) was used to indicate signal strength for each fluorophore independently, as per the primary screen. The β-cell data show a non-monotonic dose response (yellow dashed line, polynomial curve fit), with maximal signal observed at 25–50 μM DAPT. The δ-cell data show a similar trend (red dashed line, polynomial curve fit), but with approximately fourfold lower signal strength due to higher autofluorescent background in the RFP emission range.
Figure 1—figure supplement 1
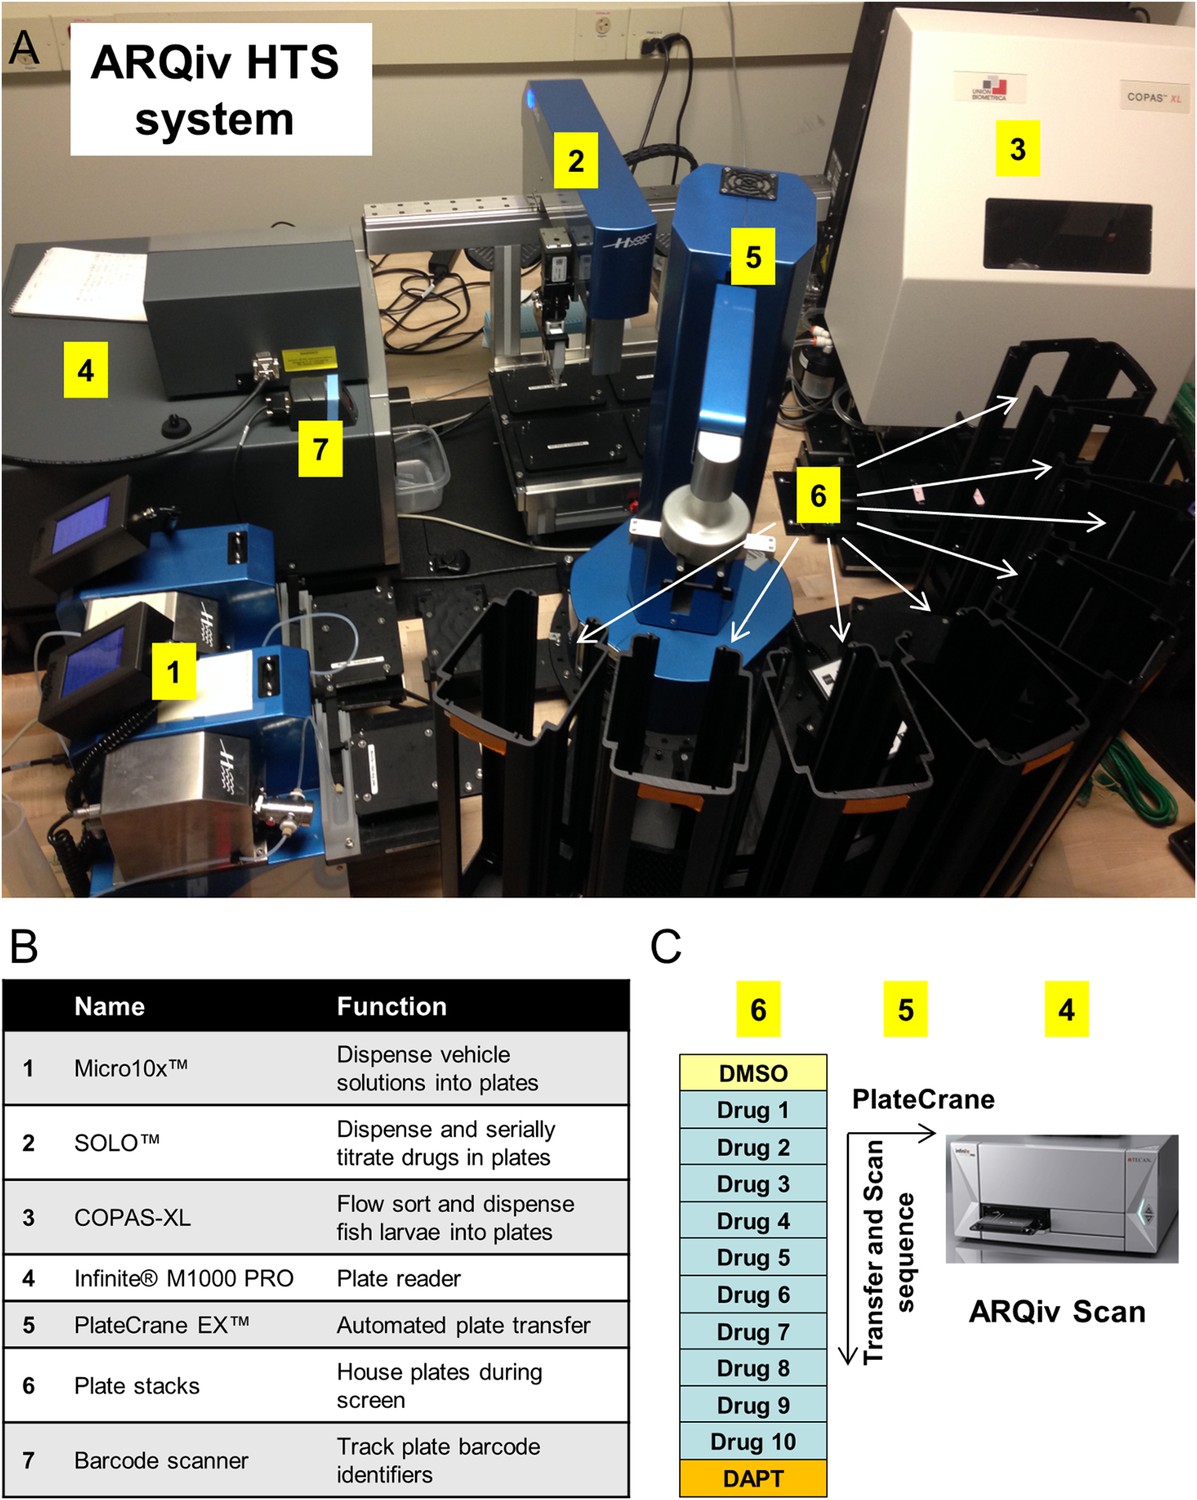
ARQiv-HTS system.
(A) Robotics-integrated ARQiv-HTS system (all units Hudson Robotics unless otherwise indicated). (1) Micro10× liquid handlers, (2) SOLO automated pipettor, (3) COPAS-XL (Complex Object Parametric Analyzer and Sorter, Union Biometrica), (4) TECAN Infinite M1000 PRO plate reader, (5) PlateCrane EX robotic arm, (6) Plate stacks (arrows), and (7) Barcode scanner (Zebra Technologies). (B) Table summarizing the function of each robotics unit. (C) Schematic of reiterative screening process, every ∼1-hr cycle 12 plates were scanned (thus, 1152 larvae): one negative control plate (0.1% DMSO), ten drug plates and one positive control plate (titration of DAPT, as per Figure 1E). In this manner, each set of ten drug plates was bounded by control plates that were used to calculate assay and compound effectiveness. On screening days, the PlateCrane EX (5) transferred plates from holding stacks (6), to an anesthetic treatment holding location (administered by Micro10×), then to the plate reader for scanning (4), and finally to return stacks (6). Real-time data analysis (MATLAB and/or R) was used to flag ‘hit call’ plates for initial visual follow-up, as described in the text.
Figure 2 with 1 supplement

ARQiv data and screen flow chart.
(A–C) Example of MATLAB/R-generated real-time data plots provided for each drug plate; note, data for YFP are shown; however, plots were provided for both fluorophores. (A) Boxplots of Drug to DMSO signal ratio (Drug/DMSO) provided dose–response and variance data. (B) Strictly standardized mean difference (SSMD) scores were used to rank compounds according to relative strength; black line shows the 1.3 cut-off used to implicate compounds of interest (i.e., ‘hit calls’). (C) Heat maps facilitated same day visual evaluation of each hit call plate. (D) Screening process—drug discovery results: the numbers of compounds tested, implicated (Hits I and II), and validated (Leads I and II) are listed at each stage. In addition, hit calls that were eliminated from further analysis due to being either fluorescent (29 compounds) or toxic (19 compounds), and others which remain to be further evaluated (131 compounds), are indicated by diagonal dashed arrows. (E) Screening process—assays utilized: schematic showing primary and secondary screening processes. In keeping with the high-throughput screening (HTS) practice of confirming implicated compounds in ‘orthogonal’ assays, different transgenic reporter lines were used for the following (progressing from the top): (1) the primary screen and initial 2° islet evaluation (β/δ-reporter), (2) validating effects on endocrine differentiation (pan-endocrine GFP reporters), and (3) validating of effects on β-cell proliferation (β-cell nuclear reporters).
Figure 2—figure supplement 1
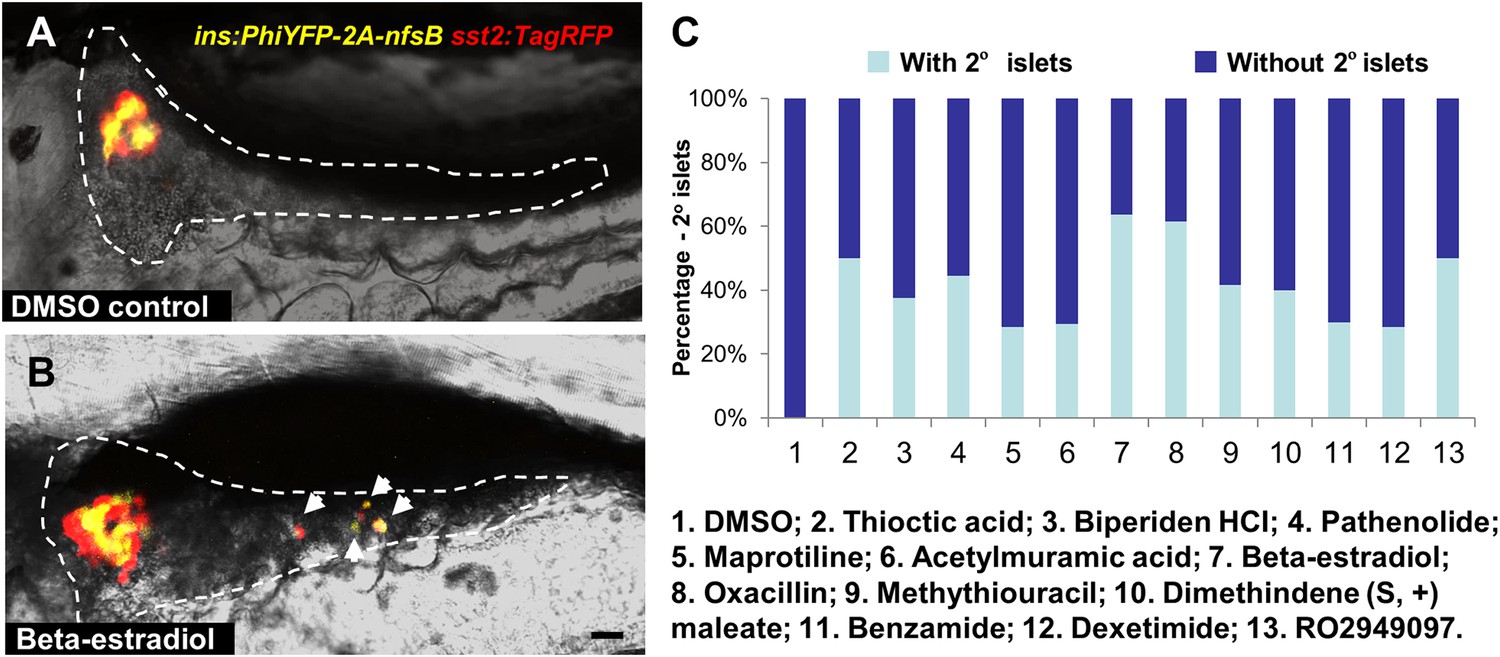
Observation of 2o islet formation in live β/δ-reporter larvae after drug treatment.
(A, B) Representative in vivo confocal images—brightfield and fluorescence images merged—of pancreata in β/δ-reporter larvae following treatment with 0.1% DMSO (A) or a representative Hit I drug (B, Beta-estradiol) from 3 to 7 dpf. White arrows indicate 2° islets in the tail of the pancreas. Scale bar = 25 µm. (C) Percentages of larvae having 2° islets following treatment from 3 to 7 dpf with the indicated control of Hit I compounds at optimal concentrations. n > 20. negative control: 0.1% DMSO. Positive control: RO2949097 (5 μM).
Figure 3 with 2 supplements
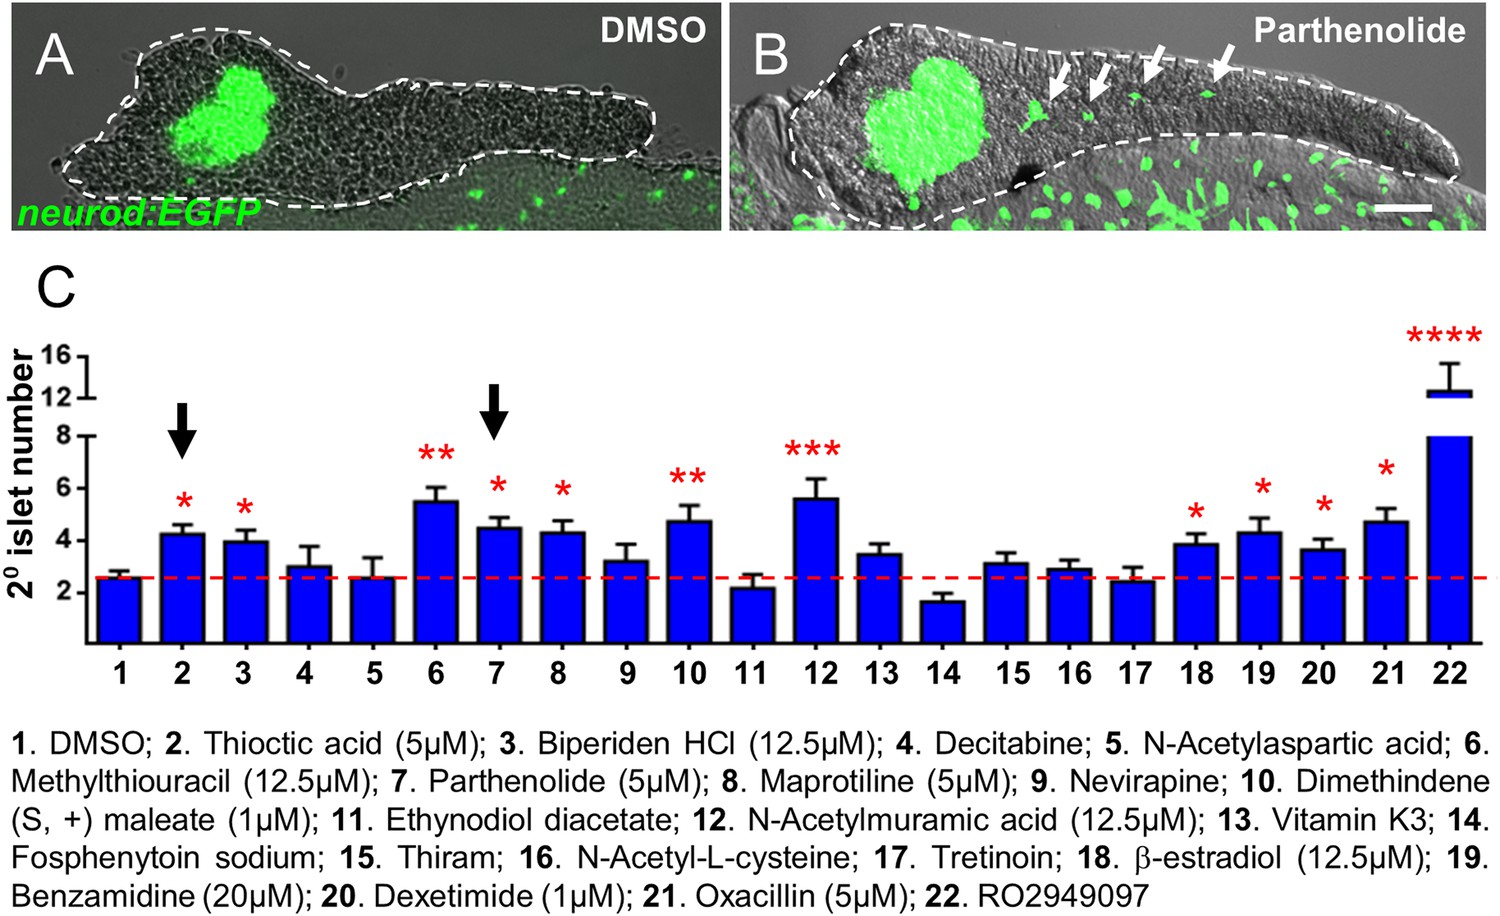
Validation of endocrine differentiation induction: precocious 2° islet assay.
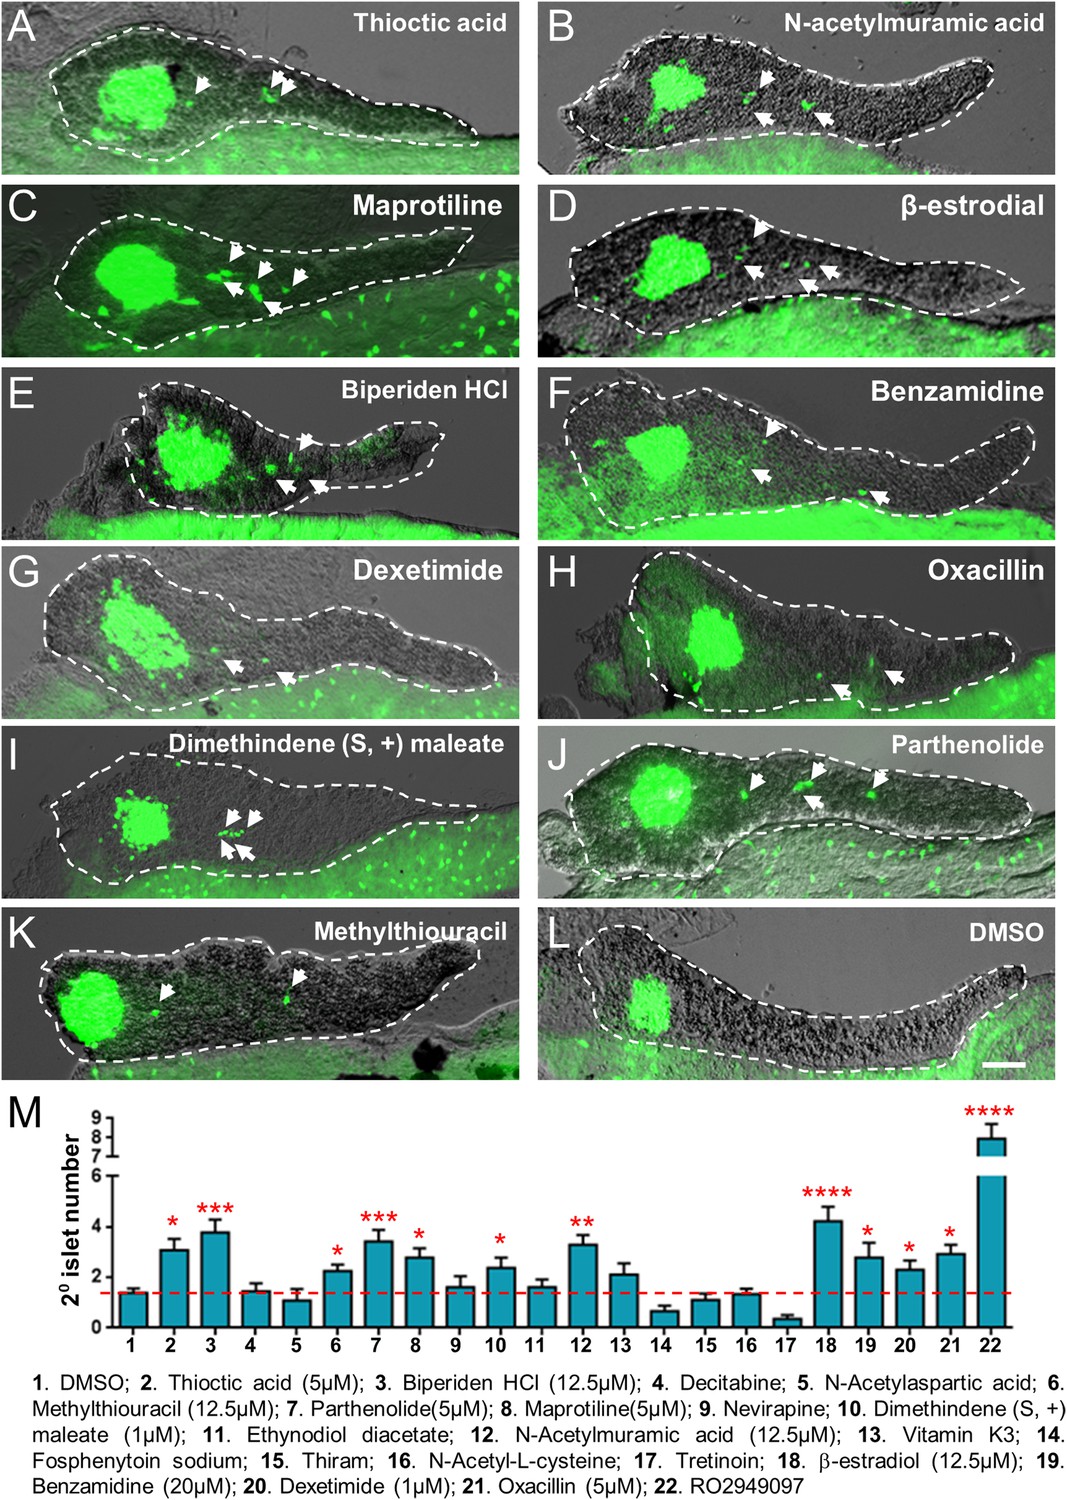
(A, B) Representative confocal images—brightfield and fluorescence images merged—of dissected pancreata (dashed lines) from neurod:EGFP transgenic larvae treated from 3 to 5 dpf with 0.1% DMSO (A) or a Hit I drug (B, example shown is parthenolide). Early endocrine cells are labeled with GFP (green) allowing precocious formation of 2° islets (white arrows) to be visualized following drug exposures. (C) The number of precocious 2° islets was quantified following treatment with the indicated Hit I compounds from 3 to 5 dpf. Results obtained with the optimal concentration were plotted relative to negative (0.1% DMSO) and positive controls (RO2949097, 5 μM). Of 20 Hit I compounds tested, 11 were confirmed as Lead I drugs for inducing endocrine differentiation (optimal concentrations for validated leads are shown in parentheses). Arrows indicate drugs that inhibit NF-κB signaling. Scale bar, 25 μm. Error bars, standard error. All p-values were calculated using Dunnett's test. *p < 0.05, **p < 0.01, ***p < 0.001, ****p < 0.0001. n = 5–10 larvae per condition, experiment was repeated 3 times per compound.
Figure 3—figure supplement 1

Validation of endocrine differentiation induction: precocious 2° islet assay (neurod reporter).
Precocious 2° islet assays were performed as per Figure 3. (A–J) Representative confocal images—brightfield and fluorescence images merged—of dissected pancreata (dashed lines) from neurod:EGFP transgenic larvae treated with indicated Lead I compounds (at optimal concentrations) from 3 to 5 dpf: (A) Thioctic acid (5 μM); (B) N-acetylmuramic acid (12.5 μM); (C) Maprotiline (5 μM); (D) β-estradiol (12.5 μM); (E) Biperiden HCl (12.5 μM); (F) Benzamidine (20 μM); (G) Dexetimide (1 μM); (H) Oxacillin (5 μM); (I) Dimethindene (S, +) maleate (1 μM); (J) Methylthiouracil (12.5 μM). Secondary islets are indicated by arrows. Scale bar, 25 μm.
Figure 3—figure supplement 2
Validation of endocrine differentiation induction: precocious 2° islet assay (pax6b reporter).
Precocious 2° islet assays were performed as per Figure 3. (A–L) Representative confocal images—brightfield and fluorescence images merged—of dissected pancreata (dashed lines) from pax6b:EGFP transgenic larvae treated with indicated Lead I compounds (at optimal concentrations) from 3 to 5 dpf: (A) Thioctic acid (5 μM); (B) N-acetylmuramic acid (12.5 μM); (C) Maprotiline (5 μM); (D) β-estradiol (12.5 μM); (E) Biperiden HCl (12.5 μM); (F) Benzamidine (20 μM); (G) Dexetimide (1 μM); (H) Oxacillin (5 μM); (I) Dimethindene (S, +) maleate (1 μM); (J) Parthenolide (5 μM); (K) Methylthiouracil (12.5 μM). Secondary islets are indicated by arrows. (M) The number of precocious 2° islets was quantified following treatment with the indicated Hit I compounds from 3 to 5 dpf. Results obtained with the optimal concentration were plotted relative to negative (0.1% DMSO) and positive controls (RO2949097, 5 μM). The same 11 Lead I compounds validated with the neurod:GFP reporter line (Figure 3, Figure 3—figure supplement 1, Table 1) showed significant results—albeit producing fewer numbers of 2° islets than the neurod:EGFP line. Scale bar, 25 μm. All p-values were calculated using Dunnett's test. *p < 0.05, **p < 0.01, ***p < 0.001, ****p < 0.0001. n = 5–10 larvae per condition, experiment was repeated 3 times per compound.
Figure 4
Validation of increased β-cell proliferation: cell counts.
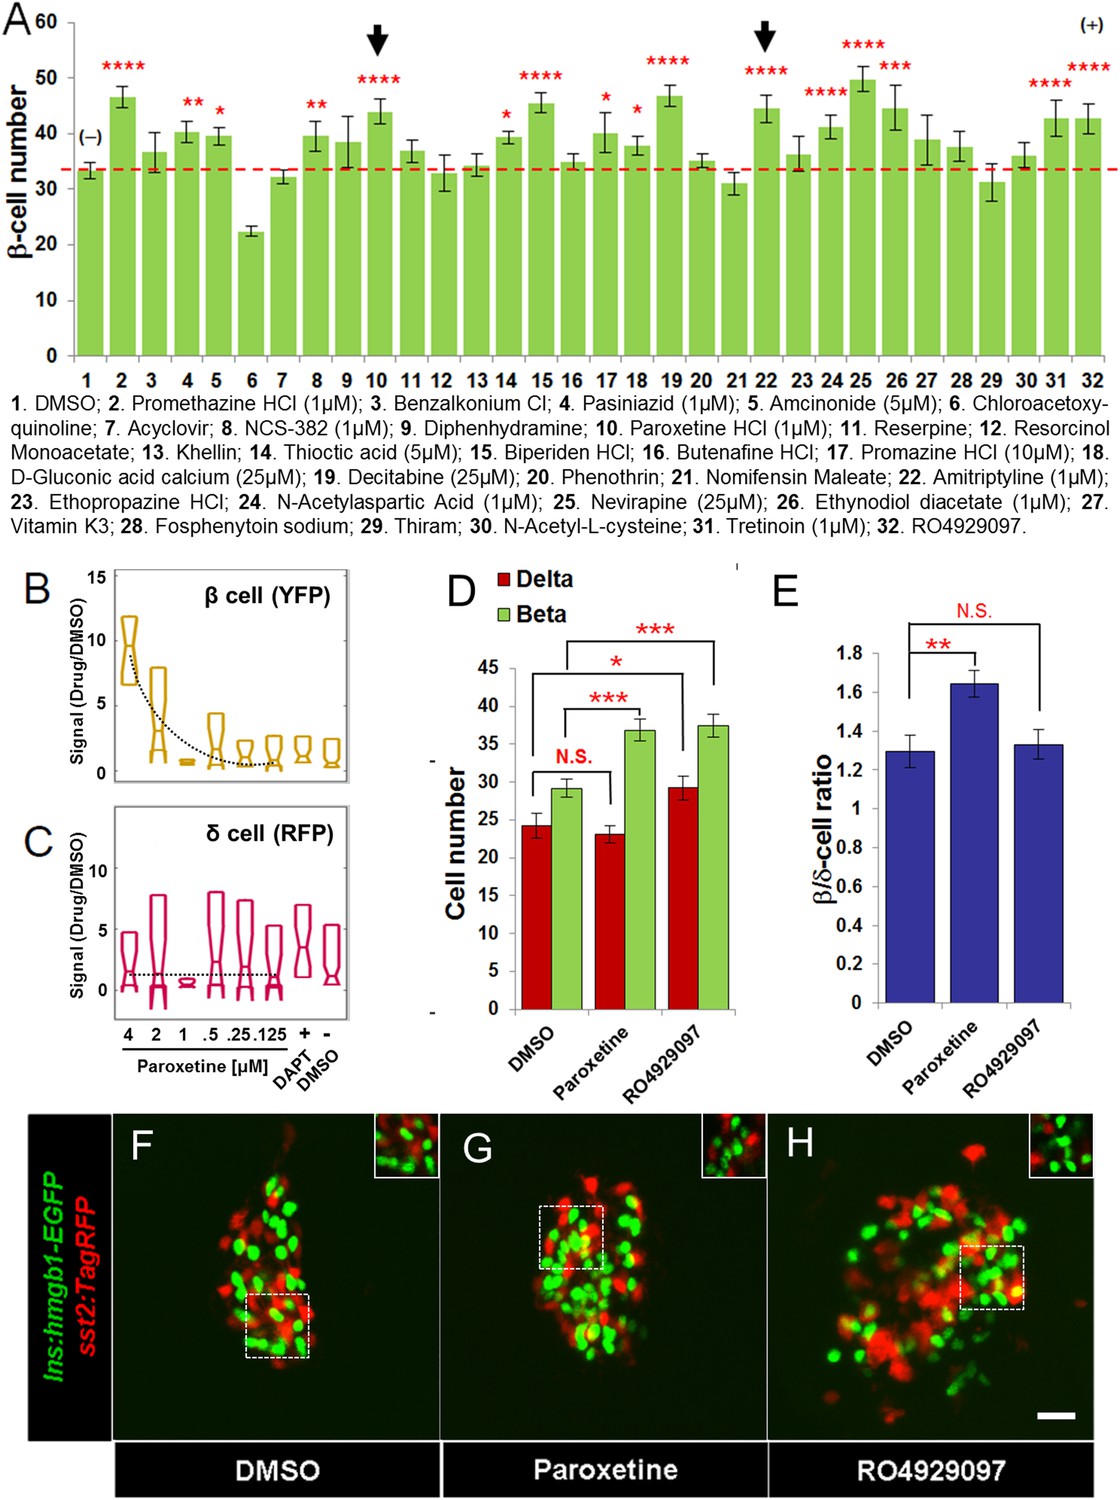
(A) Quantification of β-cell numbers following incubation of ins:hmgb1-EGFP transgenic larvae from 3 to 5 dpf in one of 30 Hit compounds, 0.1% DMSO, or the Notch inhibitor RO4929097 (5 µM). 15 compounds were confirmed as Lead II drugs for increasing β-cell numbers. Arrows indicate drugs that enhance serotonin signaling. (B, C) ARQiv screen data for paroxetine: box plots of β cells (B) and δ cells (C) suggest a β cell-specific effect—that is, a dose–response in YFP but not RFP signal (dashed line, single polynomial curve fit). (D) Numbers of δ cells (red bars) and β cells (green bars) were quantified following treatment with paroxetine, 0.1% DMSO, or RO4929097. Increased β-cell numbers were seen following paroxetine and RO4929097 treatments. However, only RO4929097 increased both β and δ cells. (E) Ratio of the number of β cells to δ cells, which confirms that the number of β cells increases following paroxetine treatment relative to δ cells, suggesting cell-type selective effects. Error bars, standard error. n = 5–10 larvae per condition, experiment was repeated 2–3 times per compound. (F–H) Representative z-projection confocal images of the principal islets in dissected pancreata (post-paraformaldehyde fixation) fromTg(ins:hmgb1-EGFP; β/δ-reporter ) triple transgenic lines treated with DMSO (F), paroxetine (G), or RO4929097 (H). Shown are EGFP+ β-cell nuclei (green) and TagRFP+ δ cells (red); note, PhiYFP in the β/δ-reporter line does not withstand fixation, allowing ‘clean’ labeling of β-cell nuclei with EGFP. In addition, apparent overlap between the β-cell and δ-cell markers (i.e., occasional ‘yellow’ cells) is an artifact of z-projection images shown in 2D format. For clarity, the inset panels show a single z-slice image of partial islet showing no co-localization of cell type specific reporters. All p-values were calculated using Dunnett's test. *p < 0.05, **p < 0.01, ***p < 0.001, ****p < 0.0001. N.S., non-significant. Scale bar, 10 μm.
Figure 5 with 1 supplement
NF-κB pathway inhibition induces endocrine differentiation.
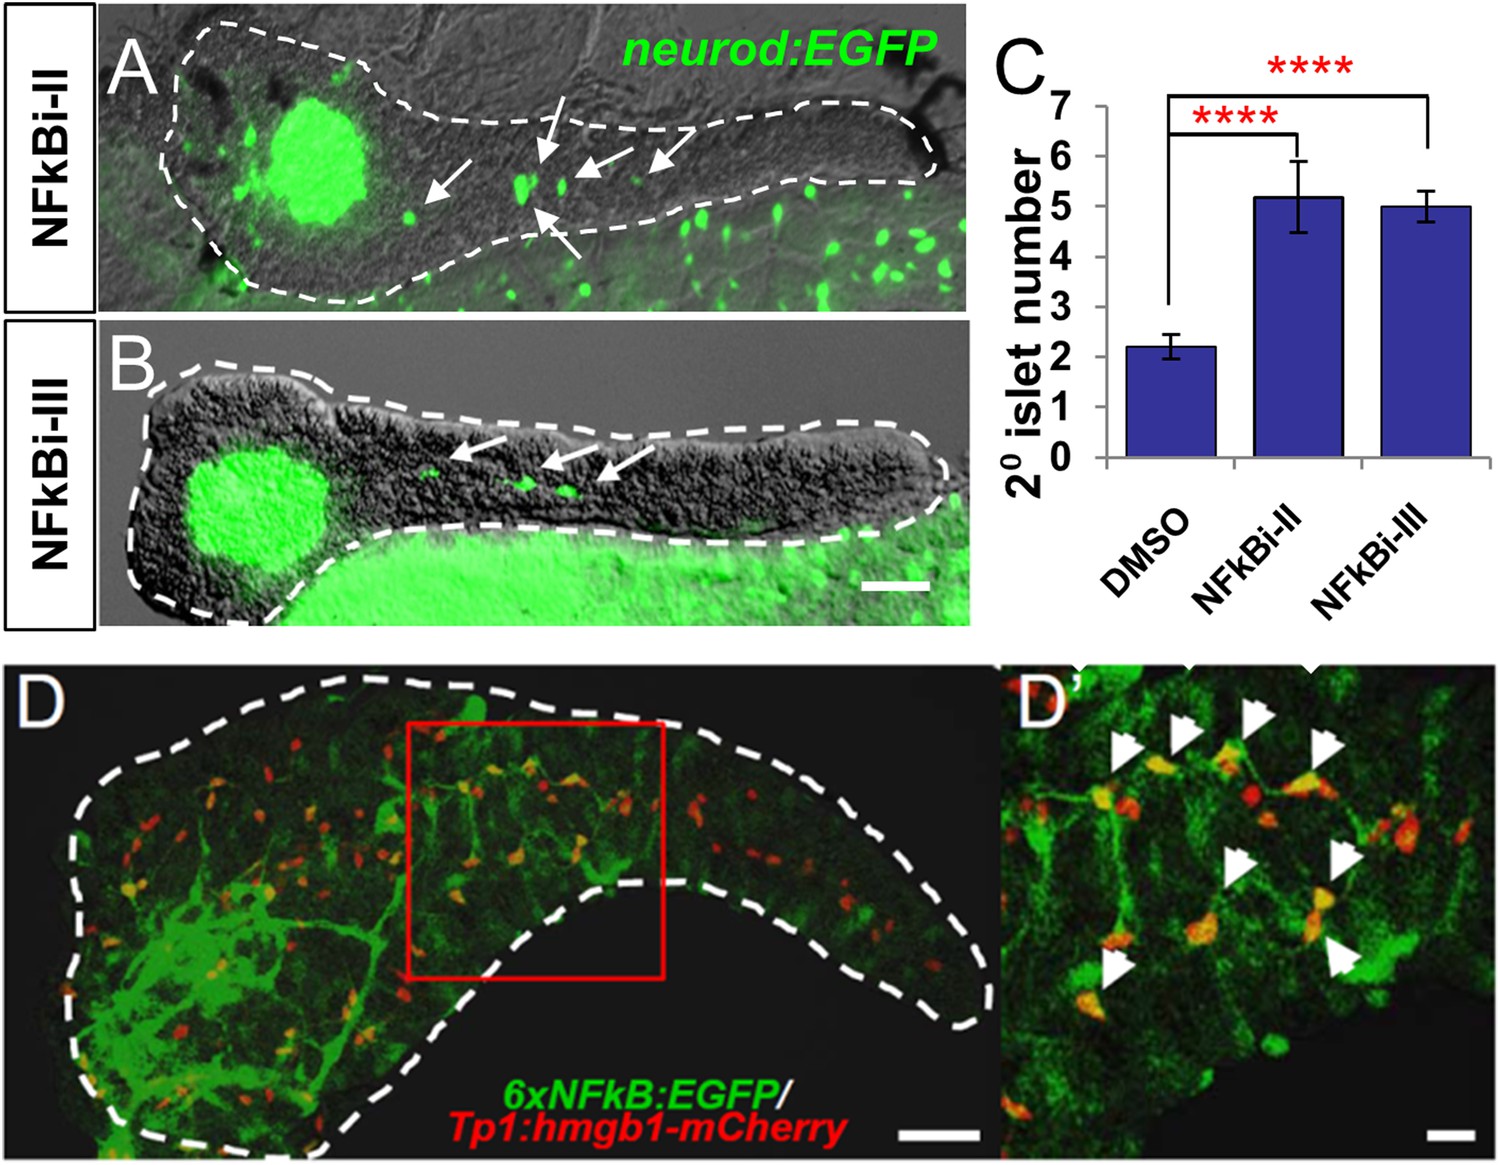
(A, B) Representative confocal images—brightfield and fluorescence images merged—of dissected pancreata (dashed lines) from neurod:EGFP transgenic larvae treated from 3 to 5 dpf with NF-κB signaling inhibitor II (A) or III (B). Both inhibitors induced precocious secondary islet formation (white arrows). (C) Secondary islet numbers were quantified and plotted relative to vehicle control (0.1% DMSO). n = 5–10 larvae per condition, experiment was repeated 3 times. Error bar, standard error. All p-values were calculated using Dunnett's test. ****p < 0.0001. (D, D′) Representative in vivo confocal z-projection of pancreas (dashed lines) in 6xNFκB:EGFP ;Tp1:hmgb1:mCherry double transgenic larvae at 5 dpf showing co-labeling of the NF-κB reporter (green) and Notch reporter (red) in endocrine progenitor cells (arrows in D′), suggesting endocrine progenitors respond to both Notch and NF-κB signaling. Scale bars, 25 μm (D), 10 μm (D′).
Figure 5—figure supplement 1
Thioctic acid and parthenolide inhibit NF-κB signaling.
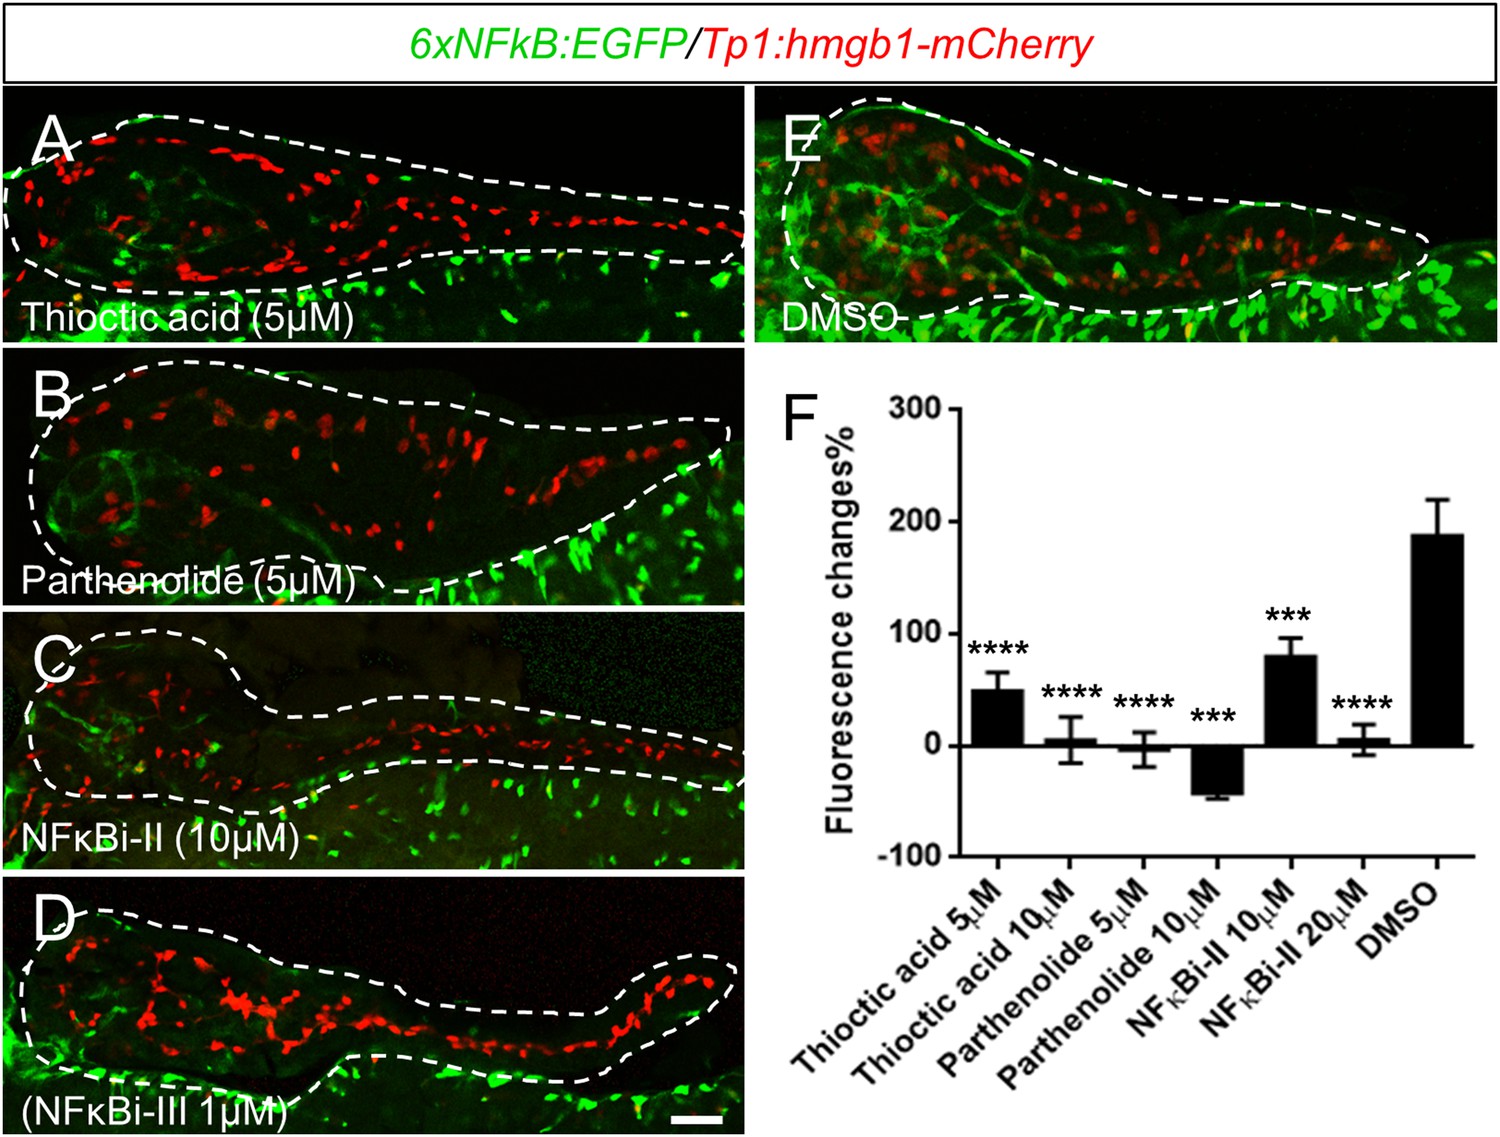
(A–E) Confocal images of 5 dpf pancreata (dashed lines) from 6xNFκB:EGFP/Tp1:hmgb1-mCherry larvae treated with indicated compounds or DMSO control from 3dpf to 5dpf. The NF-κB reporter showed reduced fluorescence levels in the pancreas following exposure to all tested NF-κB inhibitors (A–D) compared with DMSO (E). Scale bar, 25 μm. (F) ARQiv scans were performed on individually tracked 6xNFκB:EGFP/Tp1:hmgb1-mCherry larvae prior to (3 dpf) and after compound exposures (5 dpf). All compounds induced a significant reduction of NF-κB reporter activity relative to 0.1% DMSO controls. GFP reporter expression levels were normalized to pre-treatment levels—that is, plotted as percent change in fluorescence over time (as per Walker et al., 2012)—and showed significant signal loss for all tested compounds. Error bar = standard deviation. NFκBi-II: NF-κB inhibitor II, NFκBi-III: NF-κB inhibitor III. All p-values were calculated using Dunnett's test. ***p < 0.001, ****p < 0.0001.
Figure 6 with 2 supplements
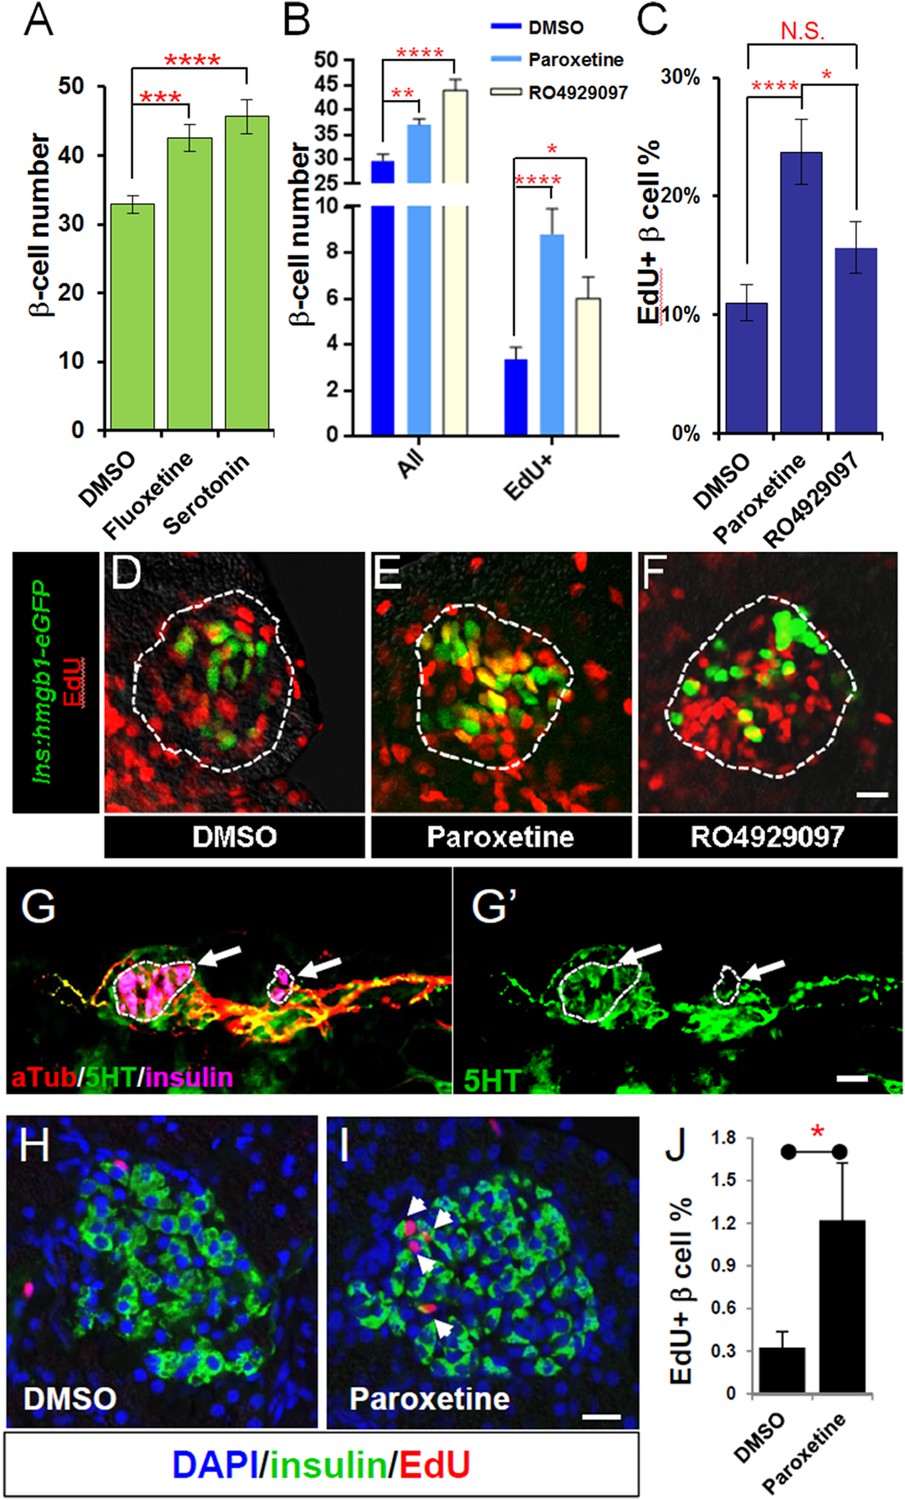
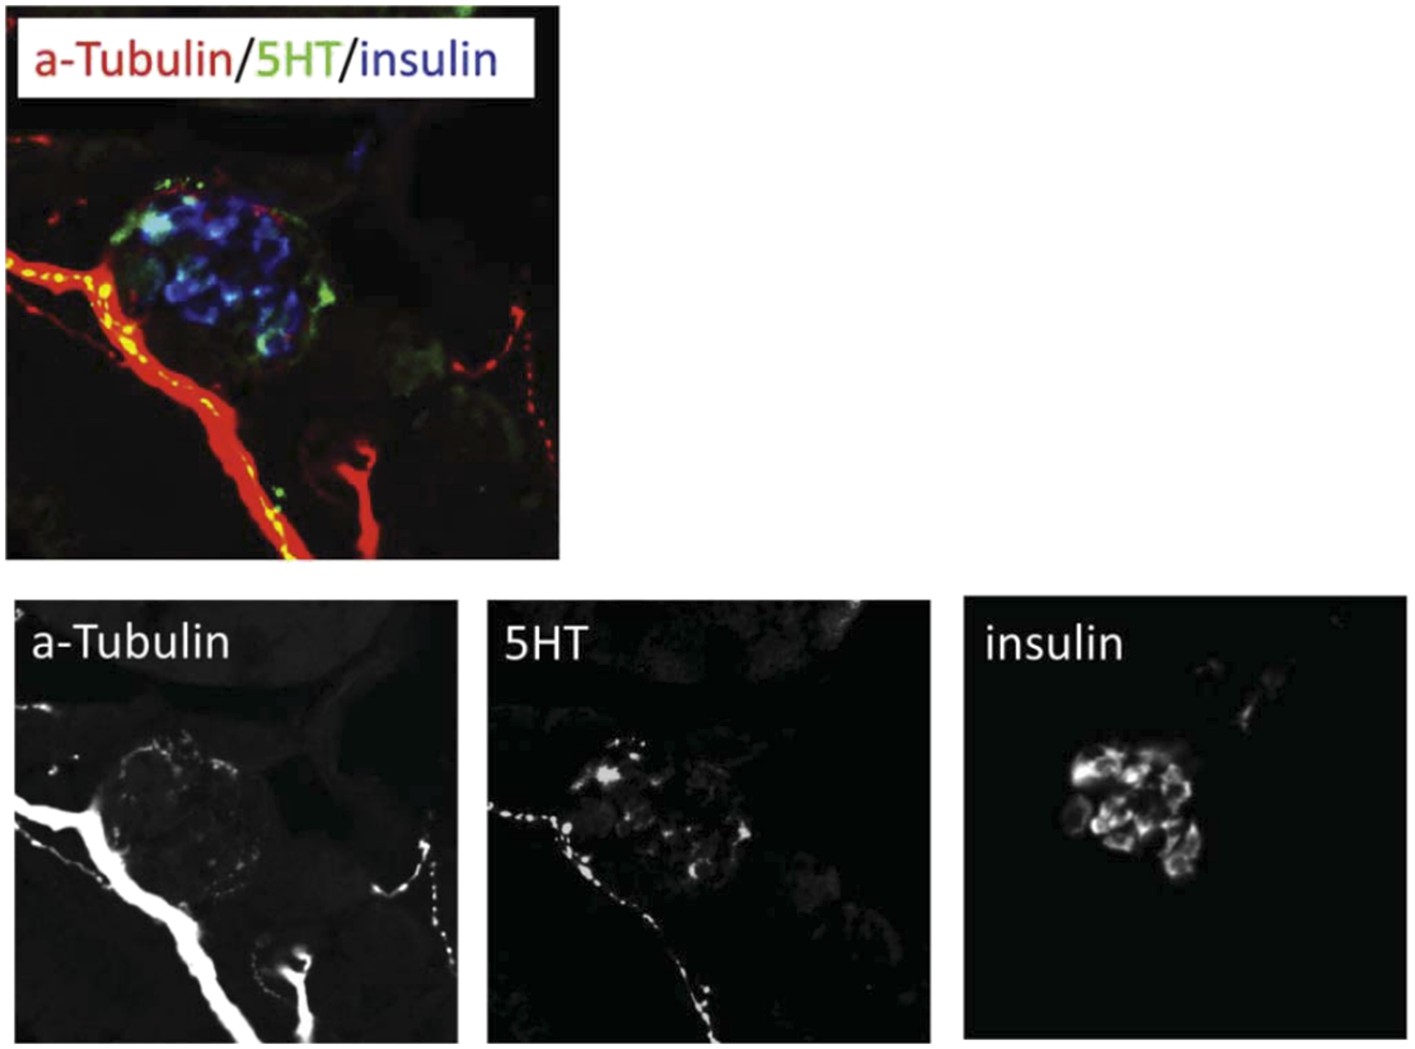
Serotonin signaling stimulates β-cell proliferation in a cell type-specific manner.
(A) β-cell quantification following 25 μM serotonin or 25 μM fluoxetine treatment of ins:hmgb1-eGFP transgenic larvae from 3 to 5 dpf indicates enhanced serotonin signaling increases β-cell numbers in zebrafish larvae. (B) β-cell quantification in the principal islet (All) and the number of EdU-labeled β cells (EdU+) are plotted following treatments with EdU and either DMSO, 1 μM paroxetine, or 5 μM RO4929097. More β cells overall, and more EdU+ β cells, are observed with 1 μM paroxetine and 5 μM RO4929097 treatments, suggesting effects on β-cell proliferation. (C) Plot of EdU+ β cells as a percentage all β cells shows that paroxetine treatment stimulates β-cell proliferation, whereas Notch inhibition does not. Error bars, standard error. (D–F) Single-plane confocal fluorescence images of ins:hmgb1-eGFP islets (dashed lines) treated with EdU and either DMSO (D), 1 μM paroxetine (E), or 5 μM RO4929097 (F)—β cell nuclei (green); EdU+ cells (red); double-labled EdU+ β cells (yellow). Scale bar, 10 μm. n = 5–10 larvae per condition, experiment was repeated 3 times. (G, G′) Confocal images of immunostained adult zebrafish pancreas indicate that serotonin signaling is active in islets (white arrows, islets indicated by dashed lines). aTub: acetylated tubulin (red); 5HT (5-hydoxytryptamine): serotonin (green); insulin (magenta). Scale bar, 10 μm. (H, I) Confocal images of adult zebrafish pancreas following injections with EdU and either DMSO (H) or 1 mM paroxetine (I), and immunostained as indicated. (J) Plot of EdU+ β cells as a percentage all β cells shows that paroxetine treatment stimulates β-cell proliferation in adult zebrafish. Error bars, standard deviation. n = 3–5 adult fish per condition, experiment was repeated 3 times. All p-values were calculated using Dunnett's test. *p < 0.05, **p < 0.01, ***p < 0.001, ****p < 0.0001.
Figure 6—figure supplement 1
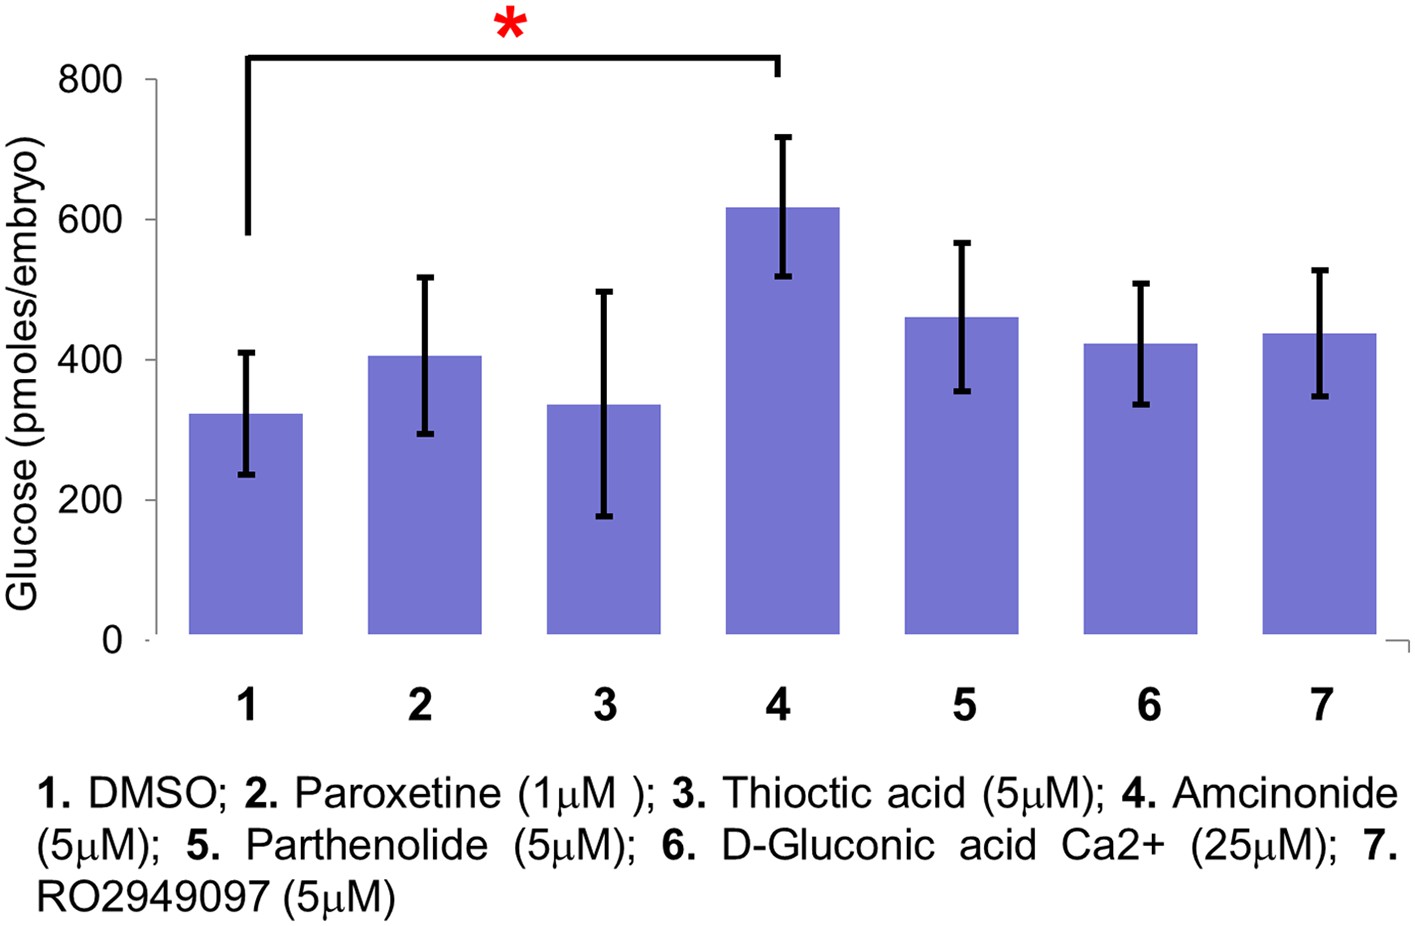
Amcinonide increases β-cell mass by inducing hyperglycemia.
Absolute glucose values in zebrafish larvae treated with selected lead compounds. For each drug, 3 treatments (20 embryos each treatment) were measured. The absolute glucose levels per embryo were calculated based on standard controls. Error bars = standard error, All p-values were calculated using Dunnett's test. *p < 0.05.
Figure 6—figure supplement 2
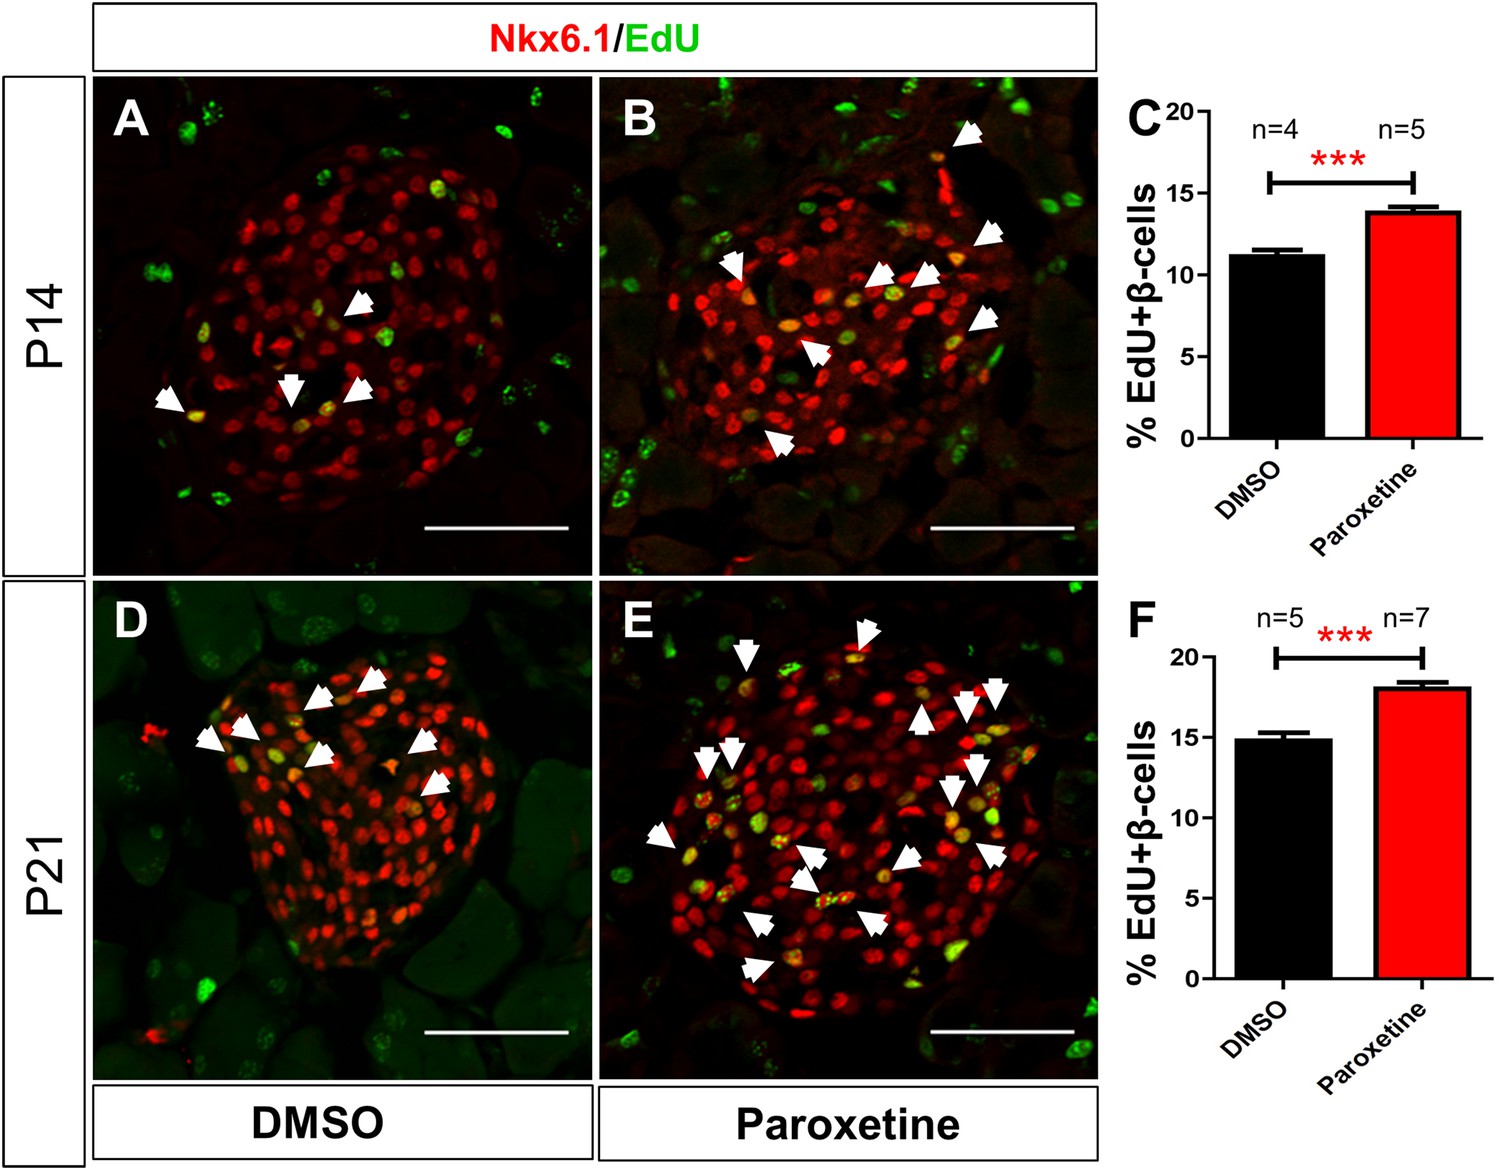
Paroxetine injection stimulates β-cell proliferation in mice.
Paroxetine effects on β-cell proliferation in postnatal mice assayed at postnatal day 14 (P14; A–C): EdU and DMSO (A), or EdU and 1 mM paroxetine (B), were injected into mice daily from P7 to P14. (A, B) Representative confocal images of a single islet in DMSO (A) and paroxetine (B) injected animals immunostained for Nkx6.1 (red) to mark β cells and EdU (green). (C) The number of EdU-positive β cells (arrows in A and B) plotted as the percentage of all β cells shows a significant increase in β-cell proliferation in paroxetine-injected mice. ***p < 0.0001, n = 4 animals, 150 islets (DMSO); 5 animals, 190 islets (paroxetine). (D–F) Paroxetine effects on β-cell proliferation in postnatal mice assayed at postnatal day 21 (P21); assay performed as above except that injections were performed from 7 to 21 days postnatal (P7–P21). (D, E) Representative confocal images of a single islet in DMSO (D) and paroxetine (E) injected animals. (F) Quantification of EdU-positive β cells (arrows in D and E) plotted as the percentage of all β cells, again, shows a significant increase in β-cell proliferation in paroxetine-injected mice. All p-values were calculated using 2-tailed Student T-test with 95% confidence intervals. ***p < 0.0001, n = 5 animals, 150 islets (DMSO); 7 animals, 210 islets (paroxetine). Scale bar, 25 μm.
Author response image 1
Tables
Table 1
Lead I drugs: inducers of endocrine differentiation
| Drug name | >2° islet # | ARQiv (µM)* | >2° islet (µM)* | |
|---|---|---|---|---|
| 1 | N-Acetylmuramic acid | +++ | 0.5 | 12.5 |
| 2 | Methylthiouracil | ++ | 0.25 | 12.5 |
| 3 | Dimethindene (S, +) maleate | ++ | 1 | 1 |
| 4 | Thioctic acid | + | 0.5 | 5 |
| 5 | Biperiden HCl | + | 1 | 12.5 |
| 6 | Parthenolide | + | 4 | 5 |
| 7 | Maprotiline | + | 0.5 | 5 |
| 8 | Estradiol diacetate → Beta-estradiol | + | 1 | 12.5 |
| 9 | Oxacillin | + | 1 | 5 |
| 10 | Benzamidine | + | 0.125 | 20 |
| 11 | Dexetimide | + | 1 | 1 |
| 12 | Decitabine | − | 0.5 | n/a |
| 13 | N-Acetylaspartic acid | − | 4 | n/a |
| 14 | Nevirapine | − | 0.25 | n/a |
| 15 | Ethynodiol diacetate | − | 0.25 | n/a |
| 16 | Vitamin K3 | − | 0.25 | n/a |
| 17 | Fosphenytoin sodium | − | 0.25 | n/a |
| 18 | Thiram | − | 0.5 | n/a |
| 19 | BOC-S-acetaminomethyl-L-cysteine→N-Acetyl-L-cysteine | − | 0.5 | n/a |
| 20 | Tretinoin | − | 0.25 | n/a |
| 21 | Iodine | nd | 0.25 | nd |
| 22 | Bayberry wax | nd | 0.25 | nd |
| 23 | 1,5-Bis (succinimidooxycarbonyloxy) pentane | nd | 0.5 | nd |
-
The 23 Hit I drugs are listed. 20 were tested for induction of endocrine differentiation, that is, precocious 2° islet formation. Compounds are ordered according to the results of the validation screen, 11 drugs were confirmed as leads (++ = p < 0.01′; + = p < 0.05), 9 failed (−). *optimal response concentration for the ARQiv and validation screens. n/a: not applicable; nd: not determined, n = 5–10 larvae per condition, experiment repeated 3 times.
Table 2
Lead II drugs: increased β-cell number
| Drug name | > β-cell # | ARQiv (µM)* | > β-cell (µM)* | |
|---|---|---|---|---|
| 1 | Promethazine HCl | ++++ | 0.125 | 1 |
| 2 | Paroxetine HCl | ++++ | 4 | 1 |
| 3 | Biperiden HCl | ++++ | 1 | 12.5 |
| 4 | Decitabine | ++++ | 0.5 | 25 |
| 5 | Amitriptyline | ++++ | 2 | 1 |
| 6 | N-Acetylaspartic acid | ++++ | 4 | 1 |
| 7 | Nevirapine | ++++ | 0.25 | 25 |
| 8 | Tretinoin | ++++ | 0.25 | 1 |
| 9 | Ethynodiol diacetate | +++ | 0.25 | 1 |
| 10 | Pasiniazid | ++ | 2 | 1 |
| 11 | NCS-382 | ++ | 0.25 | 1 |
| 12 | Amcinonide | + | 0.25 | 5 |
| 13 | Thioctic acid | + | 0.5 | 5 |
| 14 | Promazine HCl | + | 4 | 10 |
| 15 | D-Gluconic acid calcium salt | + | 2 | 25 |
| 16 | Benzalkonium chloride | − | 2 | n/a |
| 17 | Chloroacetoxyquinoline | − | 0.125 | n/a |
| 18 | Acyclovir | − | 2 | n/a |
| 19 | Diphenhydramine | − | 0.5 | n/a |
| 20 | Reserpine | − | 2 | n/a |
| 21 | Resorcinol monoacetate | − | 2 | n/a |
| 22 | Khellin | − | 2 | n/a |
| 23 | Butenafine HCl | − | 0.5 | n/a |
| 24 | Phenothrin | − | 0.25 | n/a |
| 25 | Nomifensin maleate | − | 2 | n/a |
| 26 | Ethopropazine HCl | − | 1 | n/a |
| 27 | Fosphenytoin sodium | − | 0.25 | n/a |
| 28 | Thiram | − | 0.5 | n/a |
| 29 | Vitamin K3 | − | 0.25 | n/a |
| 30 | BOC-S-acetaminomethyl-L-cysteine → N-Acetyl-L-cysteine** | − | 0.5 | n/a |
| 31 | RIAA 94 | nd | 0.5 | nd |
| 32 | Trientine | nd | 1 | nd |
| 33 | Beta propiolactone | nd | 2 | nd |
| 34 | Emodic acid | nd | 0.5 | nd |
-
All 23 Hit II drugs (non-shaded), as well as 2 Hit I validated compounds with high SSMD values (shaded light gray), and 9 Hit I ‘fails’ (shaded dark gray), are listed. The top 30 drugs were tested for increased β-cell numbers: 15 were validated as leads (++++ = p < 0.0001; +++ = p < 0.001; ++ = p < 0.01; + = p < 0.05), 15 failed (−). *optimal response concentration for the ARQiv and validation screens; **substituted compound due to availability issues; n/a: not applicable; nd: not determined. n = 5–10 larvae per condition, experiment repeated 2–3 times.
Additional files
-
Supplementary file 1
ARQiv Hit calls. The 46 compounds implicated as Hit Calls following the ARQiv screen and initial visual assessments of enhanced 2° islet formation are listed. Compounds are ordered according to SSMD value. Hit I and Hit II subsets are indicated by a check mark in the corresponding column. In addition, Hit I compounds that were evaluated in β-cell proliferation assays alongside Hit II compounds are indicated as ‘tested’. Also listed are clinical indication, FDA approval status, or naming convention for compounds approved by FDA counterparts in other countries.
- https://doi.org/10.7554/eLife.08261.018
-
Supplementary file 2
Outstanding Hit calls. The 131 compounds implicated in the primary screen but which remain to be further evaluated are listed here in subgroups according to their implicated pharmacological activity (shaded subsets). Subcategories included: neuromodulators, glucocorticoids, and retinoids—also implicated by Tsuji et al.,—as well as 11 other categories unique to our study. n/a: not applicable.
- https://doi.org/10.7554/eLife.08261.019
-
Source code 1
R-based code developed for plotting sample size data.
- https://doi.org/10.7554/eLife.08261.020
-
Source code 2
R-based code for processing a series of drug and control plates configured.
- https://doi.org/10.7554/eLife.08261.021
Download links
A two-part list of links to download the article, or parts of the article, in various formats.
Downloads (link to download the article as PDF)
Open citations (links to open the citations from this article in various online reference manager services)
Cite this article (links to download the citations from this article in formats compatible with various reference manager tools)
First quantitative high-throughput screen in zebrafish identifies novel pathways for increasing pancreatic β-cell mass
eLife 4:e08261.
https://doi.org/10.7554/eLife.08261


