Structure of a bacterial RNA polymerase holoenzyme open promoter complex
- The Rockefeller University, United States
- Saint Louis University School of Medicine, United States
- University of Wisconsin-madison, United States
- University of Wisconsin-Madison, United States
Figures
Figure 1 with 3 supplements
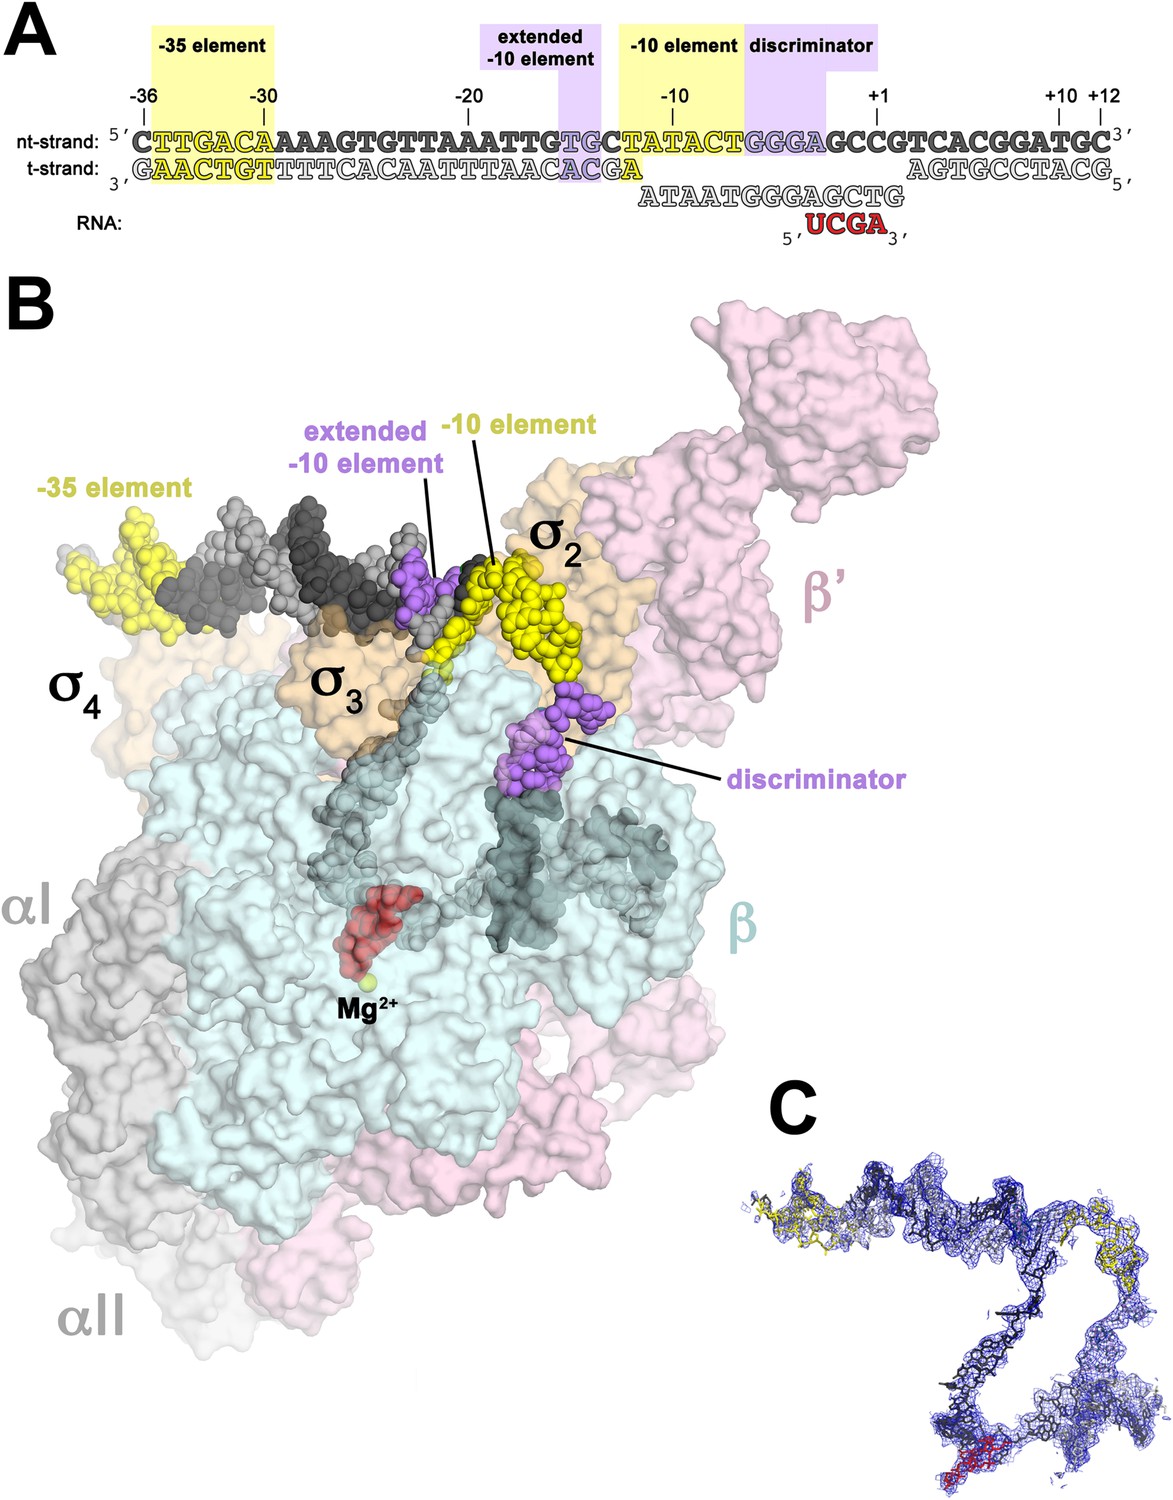
Structure of RPo.
(A) Oligonucleotides used for RPo crystallization. The numbers above denote the DNA position with respect to the transcription start site (+1). The DNA sequence is derived from the full con promoter (Gaal et al., 2001). The −35 and −10 (Pribnow box) elements are shaded yellow, the extended −10 (Keilty and Rosenberg, 1987) and discriminator (Feklistov et al., 2006; Haugen et al., 2006) elements purple. The nt-strand DNA (top strand) is colored dark grey; t-strand DNA (bottom strand), light grey; RNA transcript, red. (B) Overall structure of RPo. The nucleic acids are shown as CPK spheres and color-coded as above. The Taq EΔ1.1σA is shown as a molecular surface (αI, αII, ω, grey; β, light cyan; β′, light pink; Δ1.1σA, light orange), transparent to reveal the RNAP active site Mg2+ (yellow sphere) and the nucleic acids held inside the RNAP active site channel. (C) Electron density and model for RPo nucleic acids. Blue mesh, 2Fo − Fc maps for nucleic acids (contoured at 0.7σ).
Figure 1—figure supplement 1

(Left) Synthetic oligonucleotides used for us-fork (−12 bp) crystallization.
The numbers above the sequence denote the DNA position with respect to the transcription start site (+1). The DNA sequence is derived from the full con promoter (Gaal et al., 2001). The −35 and −10 (Pribnow box) elements are shaded yellow, the extended −10 (Keilty and Rosenberg, 1987) and discriminator (Feklistov et al., 2006; Haugen et al., 2006) elements purple. The nt-strand DNA (top strand) is colored dark grey; the t-strand DNA (bottom strand), light grey. (Right) Electron density and model for nucleic acids. Blue mesh, 2Fo − Fc maps for nucleic acids (contoured at 0.7σ).
Figure 1—figure supplement 2
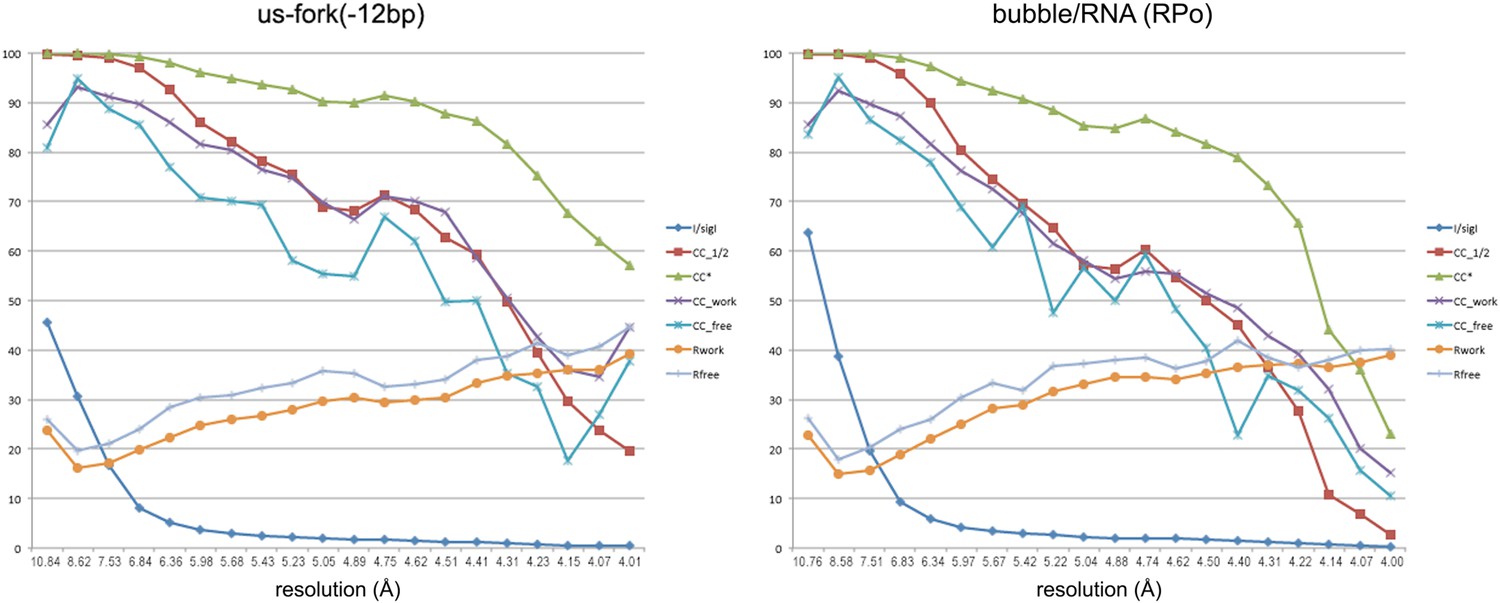
Data and model quality for us-fork (−12 bp) and RPo complexes.
Plots relating data quality with model quality at 4.0 Å-resolution) using the Pearson correlation coefficient (CC) analysis described by Karplus and Diederichs (2012). CC1/2 (red squares) was determined from the unmerged diffraction data randomly divided in half. Since CC1/2 underestimates the information content of the data (since it's calculated by dividing the dataset in half), CC* was calculated from an analytical relation to estimate the information content of the full data (Karplus and Diederichs, 2012). CC* provides a statistic that assesses data quality as well and also allows direct comparison of crystallographic model quality and data quality on the same scale through CCwork and CCfree, the standard and cross-validated correlations of the experimental intensities with the intensities calculated from the refined model. A CCwork/CCfree smaller than CC* indicates that the model does not account for all of the signal in the data, meaning it is not overfit. Plotted also are the standard <I>/σI for the diffraction data, as well as the Rwork/Rfree for the refined models. (Left) Data for Taq EΔ1.1σA/us-fork (−12 bp) at 4.0 Å-resolution. (Right) Data for Taq EΔ1.1σA RPo (with 4-nt RNA primer) at 4.0 Å-resolution.
Figure 1—figure supplement 3
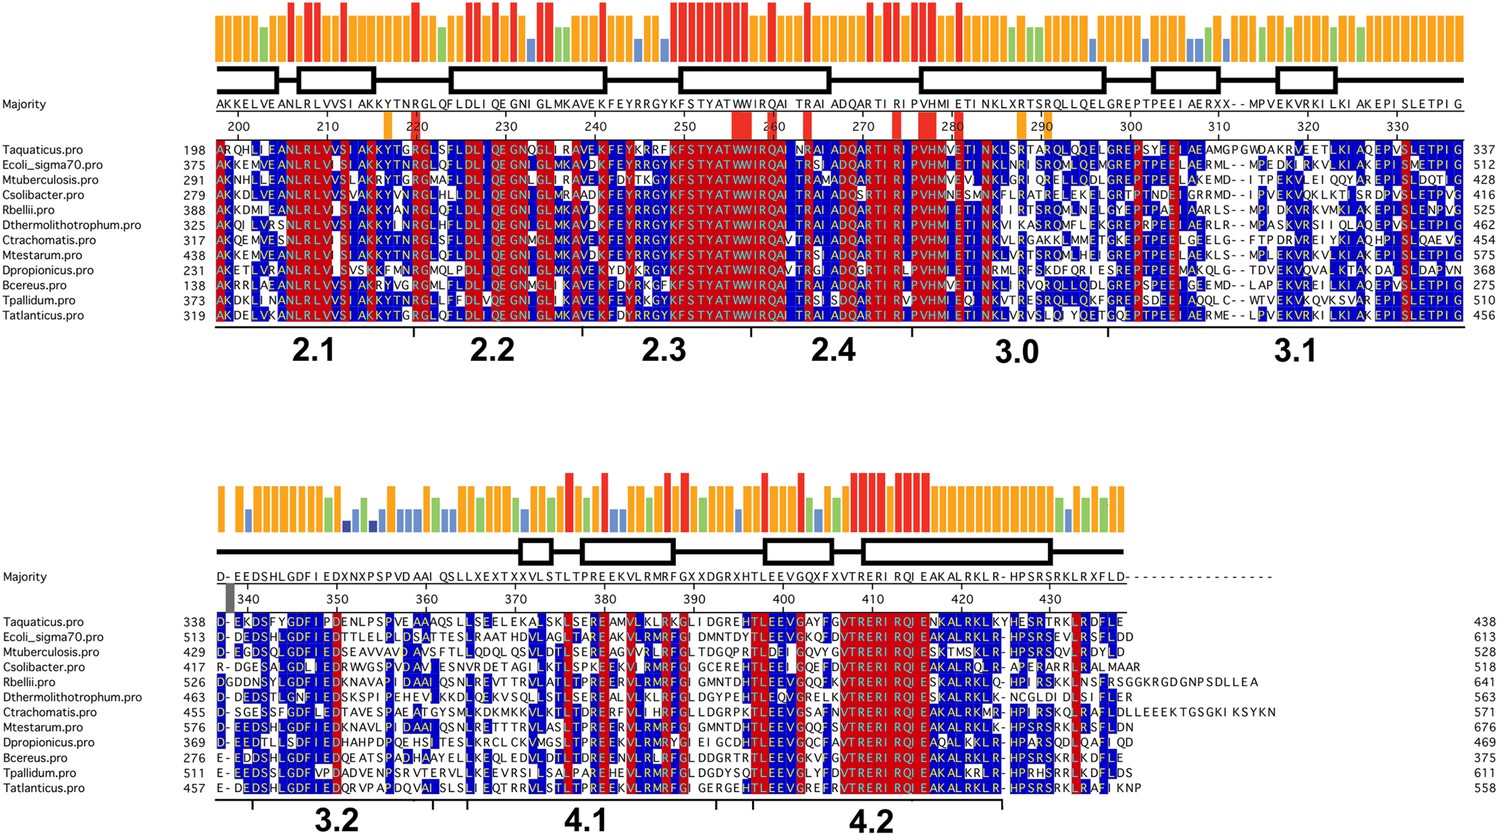
Sequence alignment of regions 2–4 of selected bacterial RNAP primary (Group I) σ subunits.
Sequence alignment of regions 2–4 (Lonetto et al., 1992) of bacterial RNAP primary (Group I) σ subunits. The sequences shown were selected from diverse phyla/groups taken from a much larger alignment of 1002 sequences. The σA sequences shown are from the following organisms chosen to represent the preceding phylum/group: Deinococcus-Thermus, Thermus aquaticus; γ-Proteobacteria, Escherichia coli; Actinobacteria, Mycobacterium tuberculosis; Acidobacteria-Candidatus Solibacter usitatus; α-Proteobacteria, Rickettsia belli; Aquificae, Desulfurobacterium thermolithotrophum; Chlamydae, Chlamydae trachomatis; Cyanobacteria, Mastigocoleus testarum; δ-Proteobacteria; Desulfobulbus propionicus; Firmicutes, Bacillus cereus; Spirochaetes, Treponema pallidum; Thermodesulfobacteria, Thermodesulfatator atlanticus. The sequences are shaded according to conservation within the sub-alignment; red shading indicates 100% identity, blue shading indicates >50% identity. The histogram at the top represents the sequence conservation within the entire 1002 sequence alignment (red bar, 100% identity; orange, 83–99%; green, 68–83%; blue, 50–67%).
Figure 2

Protein interactions with duplex DNA upstream of the transcription bubble and recognition of the extended −10 element.
(A) (Left) Overall view of RPo structure (similar to Figure 1B). The boxed area is magnified on the right. (Right) Magnified view showing protein interactions (β′ and σA) with duplex DNA from −18 to −12. Proteins are shown as backbone worms (β′, light pink; σA, light orange) with interacting side chains shown in stick format (β′, pink; σA, orange). Likely polar interactions are denoted with grey dashed lines. (B) Same as (A) (right) but rotated 180° about the x-axis. (C) Similar view as (A) (right). Superimposed is the simulated annealing omit map (grey mesh, 2Fo − Fc, contoured at 1σ), calculated from a model where the following protein segments were removed (β′ 33–36; σA 259–292) and shown only within 2 Å of omitted atoms. (D) Similar view as (B). Superimposed is the simulated annealing omit map (grey mesh, 2Fo − Fc, contoured at 1σ), calculated from a model where the following protein segments were removed (β′ 33–36; σA 259–292) and shown only within 2 Å of omitted atoms.
Figure 3 with 1 supplement
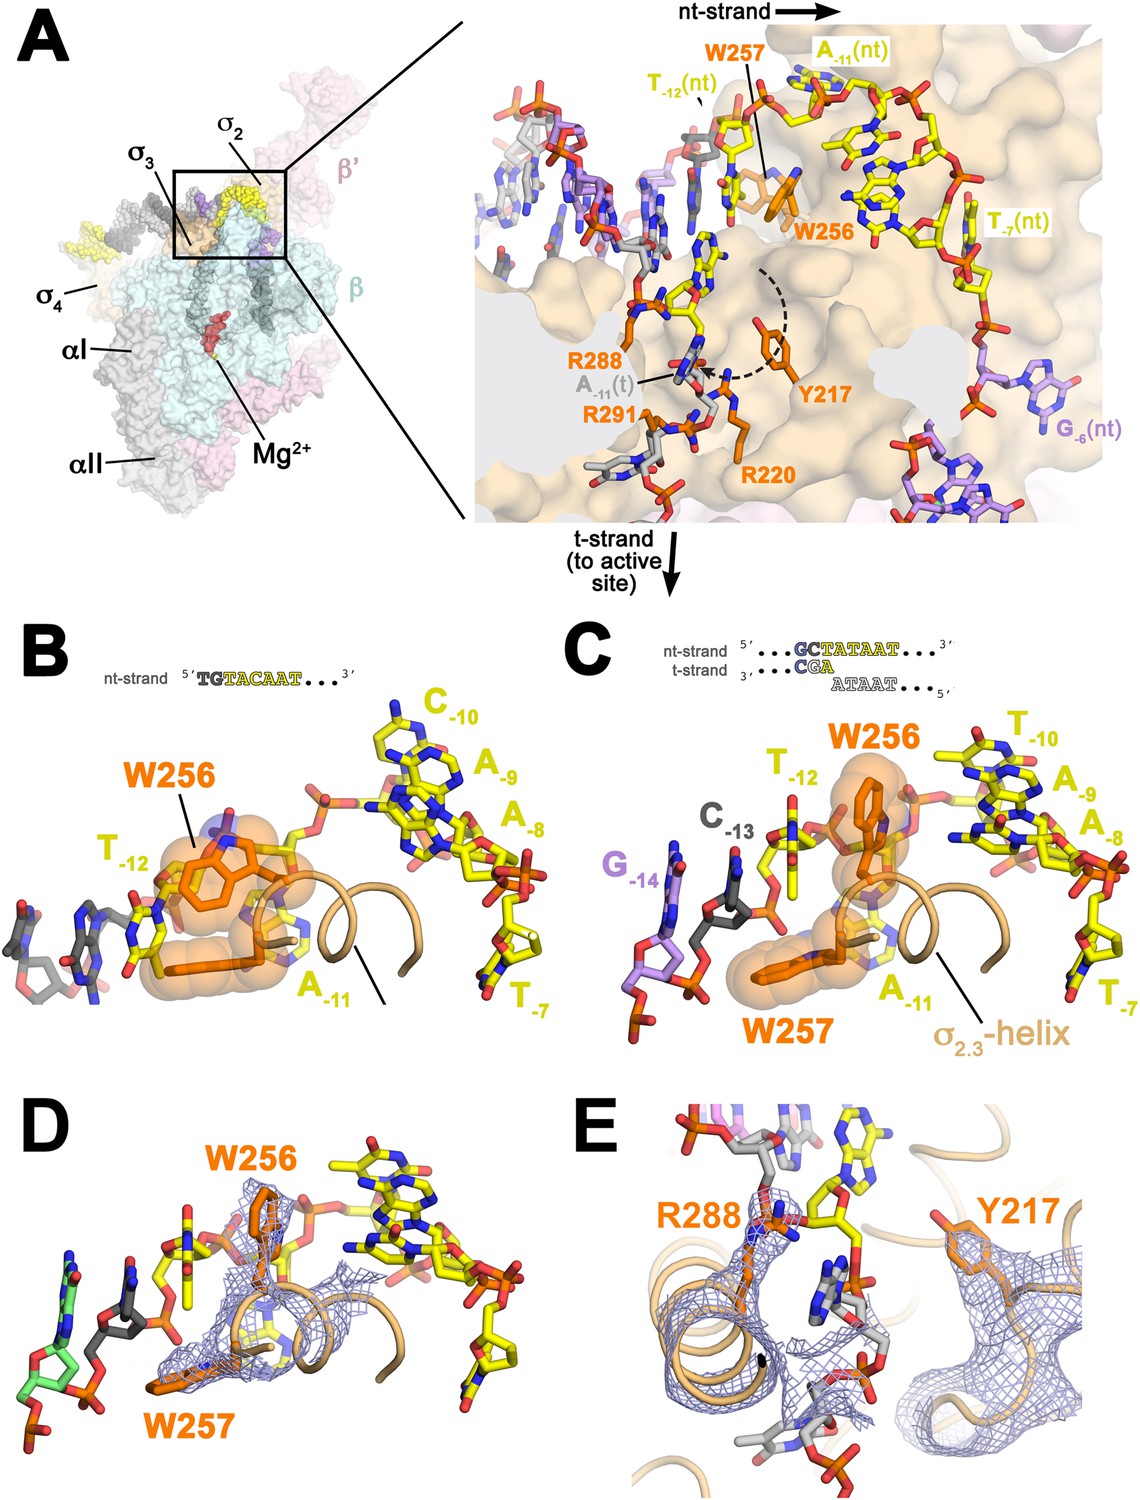
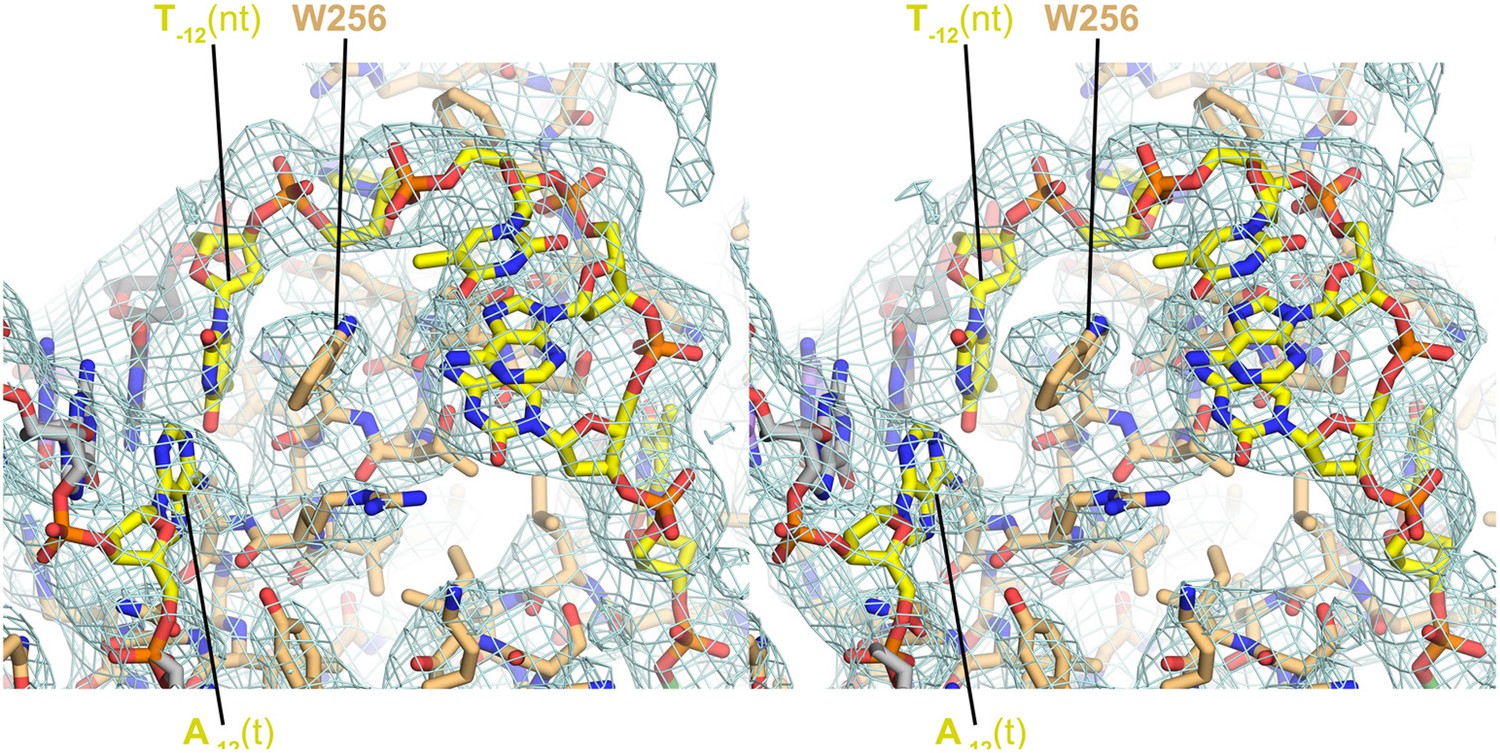
Structures maintaining the upstream ds/ss junction of the transcription bubble and directing the t-strand DNA to the RNAP active site.
(A) (Left) Overall view of RPo structure (similar to Figure 1B). The boxed area is magnified on the right. (Right) Magnified view showing the upstream ds/ss junction of the transcription bubble in RPo (the RNAP β subunit, which obscures the view, has been removed). RNAP is shown as a molecular surface, except side chains of key σA residues (R217, R220, W256, R288, R291) are shown (orange). The orthogonal directions of the ss nt- and t-strand DNA following the upstream ds/ss junction are denoted by black arrows. The dashed, curved line denotes the potential path of the t-strand −11 base from its position in the duplex DNA (base-paired to A−11(nt)) to its position in the structure. (B) Structure of Taq bound to the ss, nt-strand −10 element (PDB ID 3UGO) (Feklistov and Darst, 2011) showing the disposition of the universally conserved σA W-dyad (Taq σA W256/W257). Shown is the ss DNA from −14 to −7 (−10 element colored yellow), the (light orange) and the W-dyad (orange side chains with transparent CPK atoms). W256 makes an edge-on interaction with the face of W257, as observed in all other σ70/σA structures in many different contexts (Malhotra et al., 1996; Campbell et al., 2002; Vassylyev et al., 2002; Murakami et al., 2002a, 2002b; Feklistov and Darst, 2011; Zhang et al., 2012). (C) Disposition of the W-dyad in RPo (containing upstream ds/ss junction, shown schematically above). Only the nt-strand DNA from −14 to −7, the , and the W-dyad are shown (as in B). (D) Same view as (C). Superimposed is the simulated annealing omit map (grey mesh, 2Fo − Fc, contoured at 1σ), calculated from a model where the following segments of σA were completely removed (216–221, 255–258, and 287–292) and shown only within 2 Å of omitted atoms. (E) Similar view as (A) (right). Superimposed is the simulated annealing omit map (grey mesh, 2Fo − Fc, contoured at 1σ), calculated from a model where the following segments of σA were removed (216–221, 255–258, and 287–292) and shown only within 2 Å of omitted atoms. Clear Fourier density for σA Y217 and R288 is shown.
Figure 3—figure supplement 1
Stereo view of RPo model and resulting electron density map (grey mesh, 2Fo − Fc, contoured at 0.7σ).
The view is similar to Figure 3A.
Figure 4 with 1 supplement
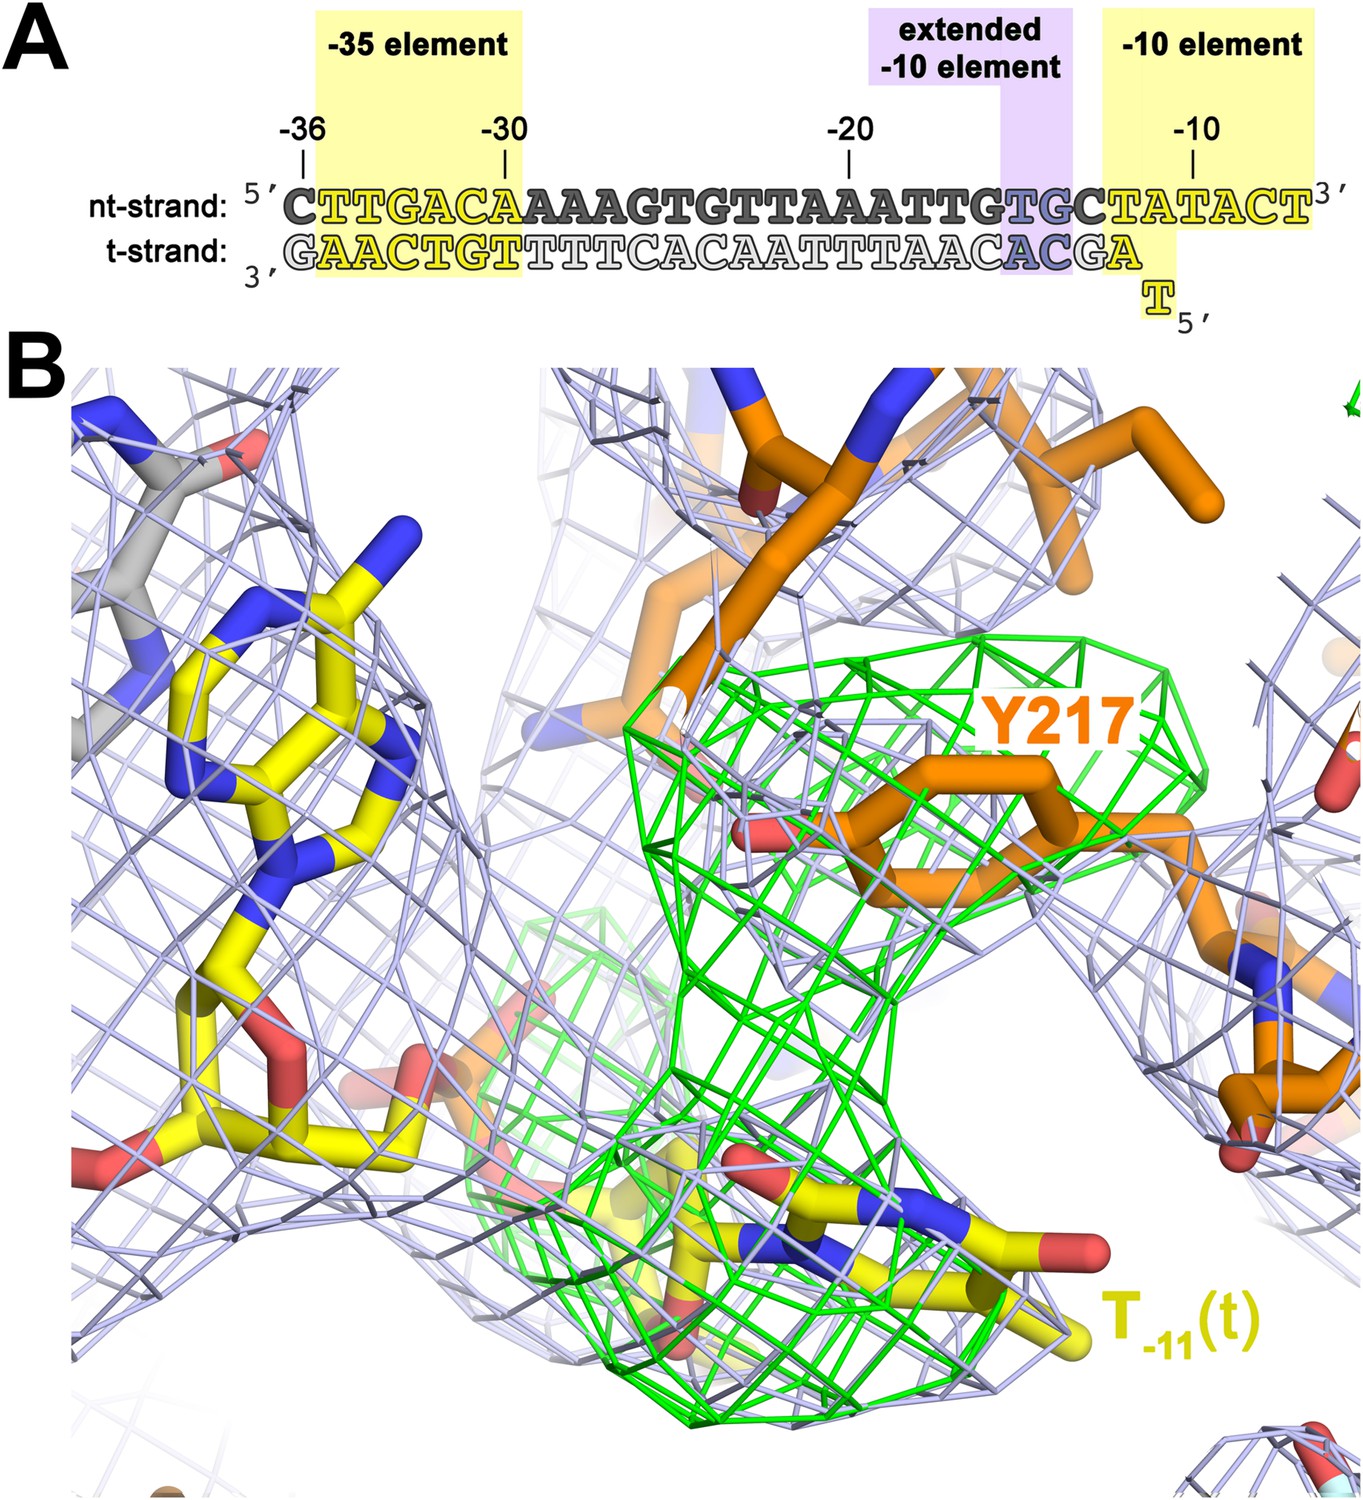
The σA Y217 may stack on the T−11(t) base orphaned by the flipped out A−11(nt) base.
(A) Synthetic oligonucleotides used for us-fork (−11 bp) crystallization. The numbers above the sequence denote the DNA position with respect to the transcription start site (+1). The DNA sequence is derived from the full con promoter (Gaal et al., 2001). The −35 and −10 (Pribnow box) elements are shaded yellow, the extended −10 element (Keilty and Rosenberg, 1987) purple. The nt-strand DNA (top strand) is colored dark grey; the t-strand DNA (bottom strand), light grey; the RNA transcript, red. (B) The T−11(t) base orphaned by the flipped out A−11(nt) stacks on σA Y217 in the us-fork (−11 bp) structure. The 4.6 Å-resolution electron density map (contoured at 0.7σ) is shown (grey mesh). Also superimposed is the simulated annealing omit map (green mesh, Fo − Fc, contoured at 3σ), calculated from a model where σA Y217 was mutated to Ala and the T−11(t) nucleotide was deleted.
Figure 4—figure supplement 1
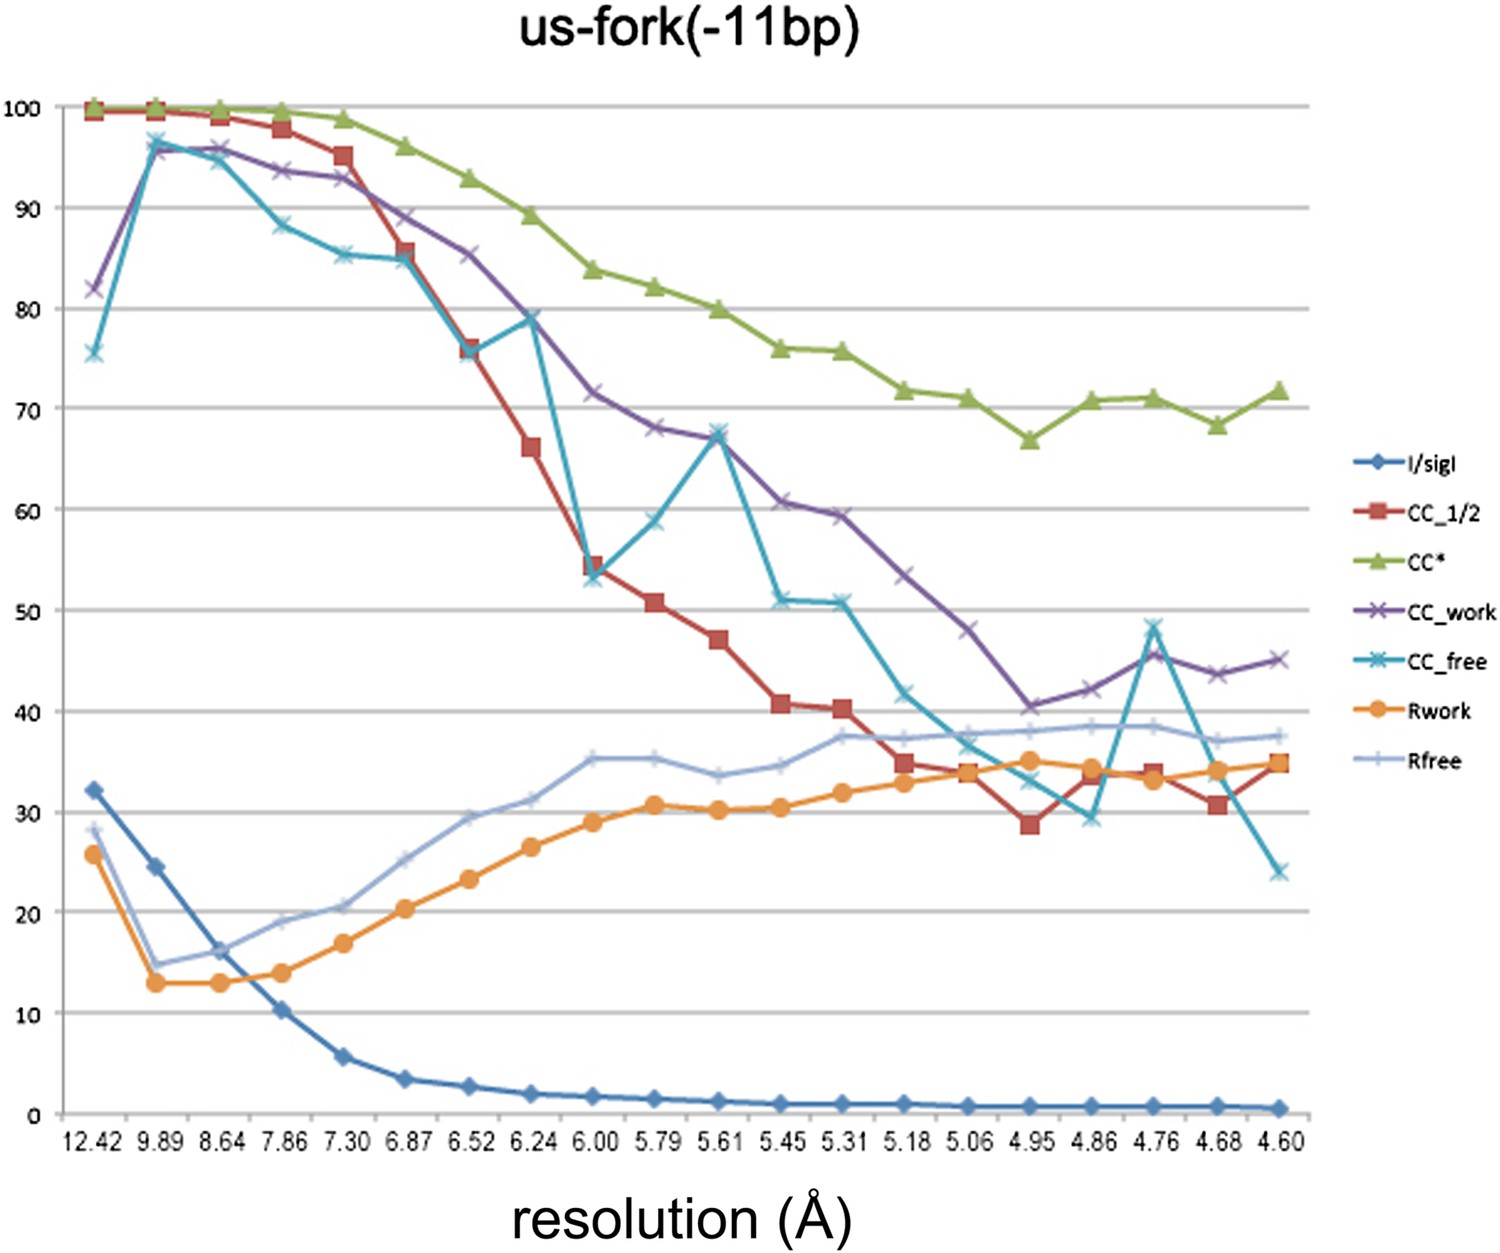
Data and model quality for us-fork (−11 bp) complex.
Plots relating data quality with model quality at 4.6 Å-resolution) using the Pearson correlation coefficient (CC) analysis described by Karplus and Diederichs (2012). CC1/2 (red squares) was determined from the unmerged diffraction data randomly divided in half. Since CC1/2 underestimates the information content of the data (since it's calculated by dividing the dataset in half), CC* was calculated from an analytical relation to estimate the information content of the full data (Karplus and Diederichs, 2012). CC* provides a statistic that assesses data quality as well and also allows direct comparison of crystallographic model quality and data quality on the same scale through CCwork and CCfree, the standard and cross-validated correlations of the experimental intensities with the intensities calculated from the refined model. A CCwork/CCfree smaller than CC* indicates that the model does not account for all of the signal in the data, meaning it is not overfit. Plotted also are the standard <I>/σI for the diffraction data, as well as the Rwork/Rfree for the refined models.
Figure 5 with 1 supplement
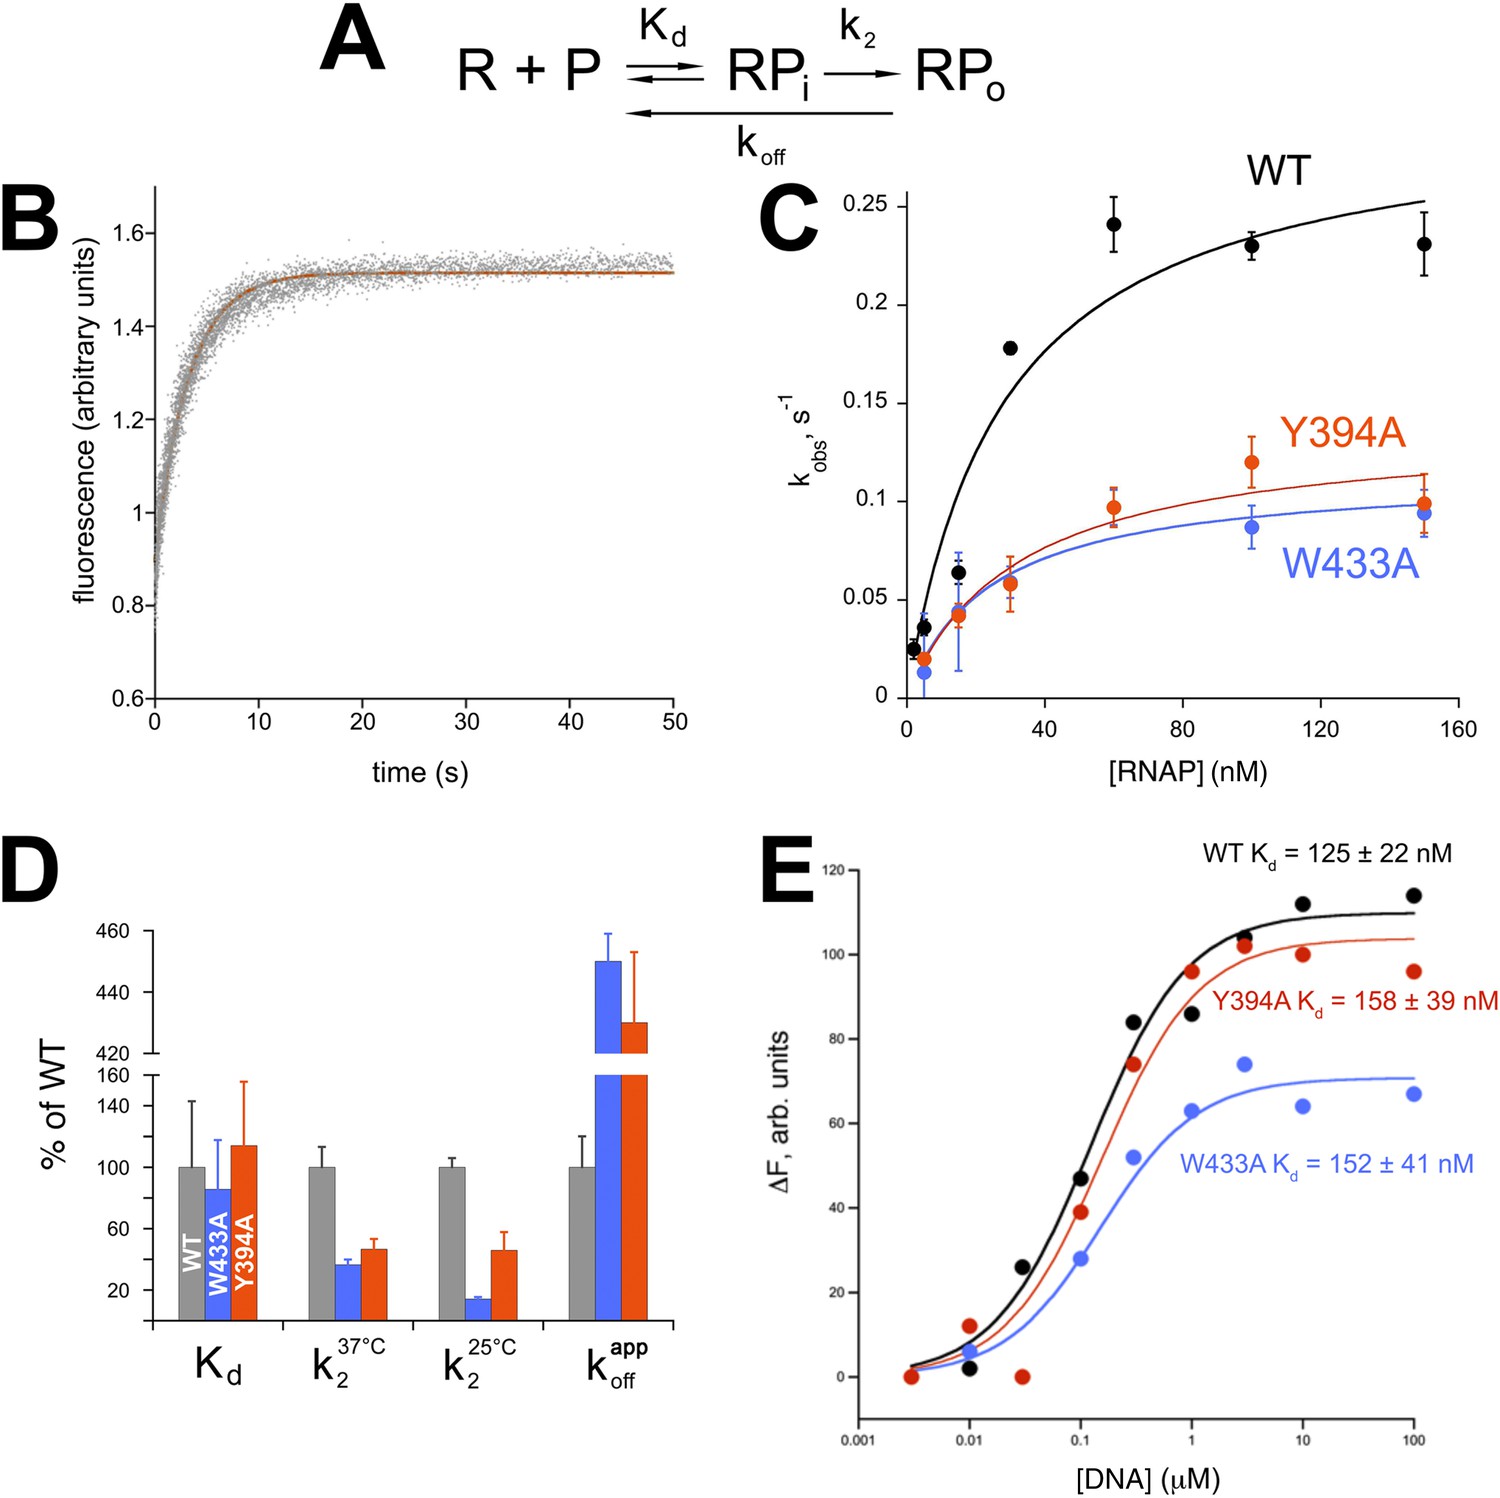
Functional role of Eco σ70 W433 and Y394 in RPo formation.
(A) Simplified, two-step kinetic scheme for RPo formation (Roe et al., 1984; Buc and McClure, 1985) (R, RNAP; P, promoter; RPi, intermediate complex). (B) Representative time trace of fluorescence increase (from Cy3 labelled promoter DNA) during RPo formation. The solid red line illustrates the non-linear regression fit to a single-exponential model (see ‘Materials and methods’), which described >90% of the fluorescence amplitude rise. (C) The RNAP-concentration dependence of the observed rate (kobs) of RPo formation detected by Cy3 fluorescence (Ko and Heyduk, 2014) for Eco holoenzymes with σ70 (wt) as well as σ70 carrying substitutions W433A or Y394A. Error bars denote standard errors of the mean for ≥three independent measurements. (D) Summary of effects of σ70 W433A and Y394A substitutions on thermodynamic and kinetic parameters of RPo formation. The data was normalized to the % observed with wild-type Eσ70. (E) Equilibrium binding of ss nt-strand oligos of λ PR promoter −10 element detected in the fluorescent RNAP beacon assay (Feklistov and Darst, 2011; Mekler et al., 2011) to Eco holoenzymes with σ70, as well as σ70 carrying substitutions W433A or Y394A.
Figure 5—figure supplement 1
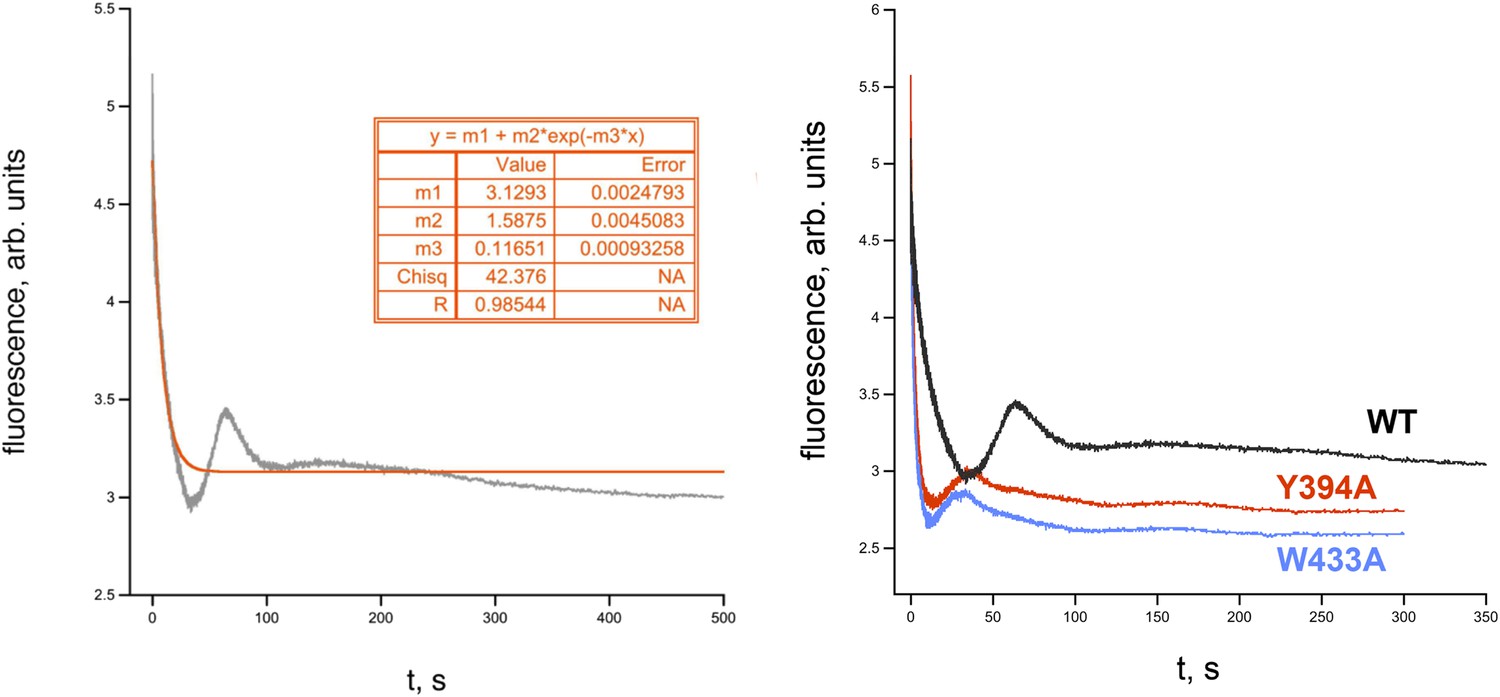
RPo dissociation data.
(Left) Representative time trace of fluorescence decay after rapid mixing of pre-formed Eco RPo (with wild-type σ70) into 1.1 M NaCl (Gries et al., 2010). The solid line illustrates the non-linear regression fit to a single-exponential model. (Right) Representative dissociation curves for holoenzymes containing wild-type σ70 and W433A and Y394A substitutions.
Figure 6
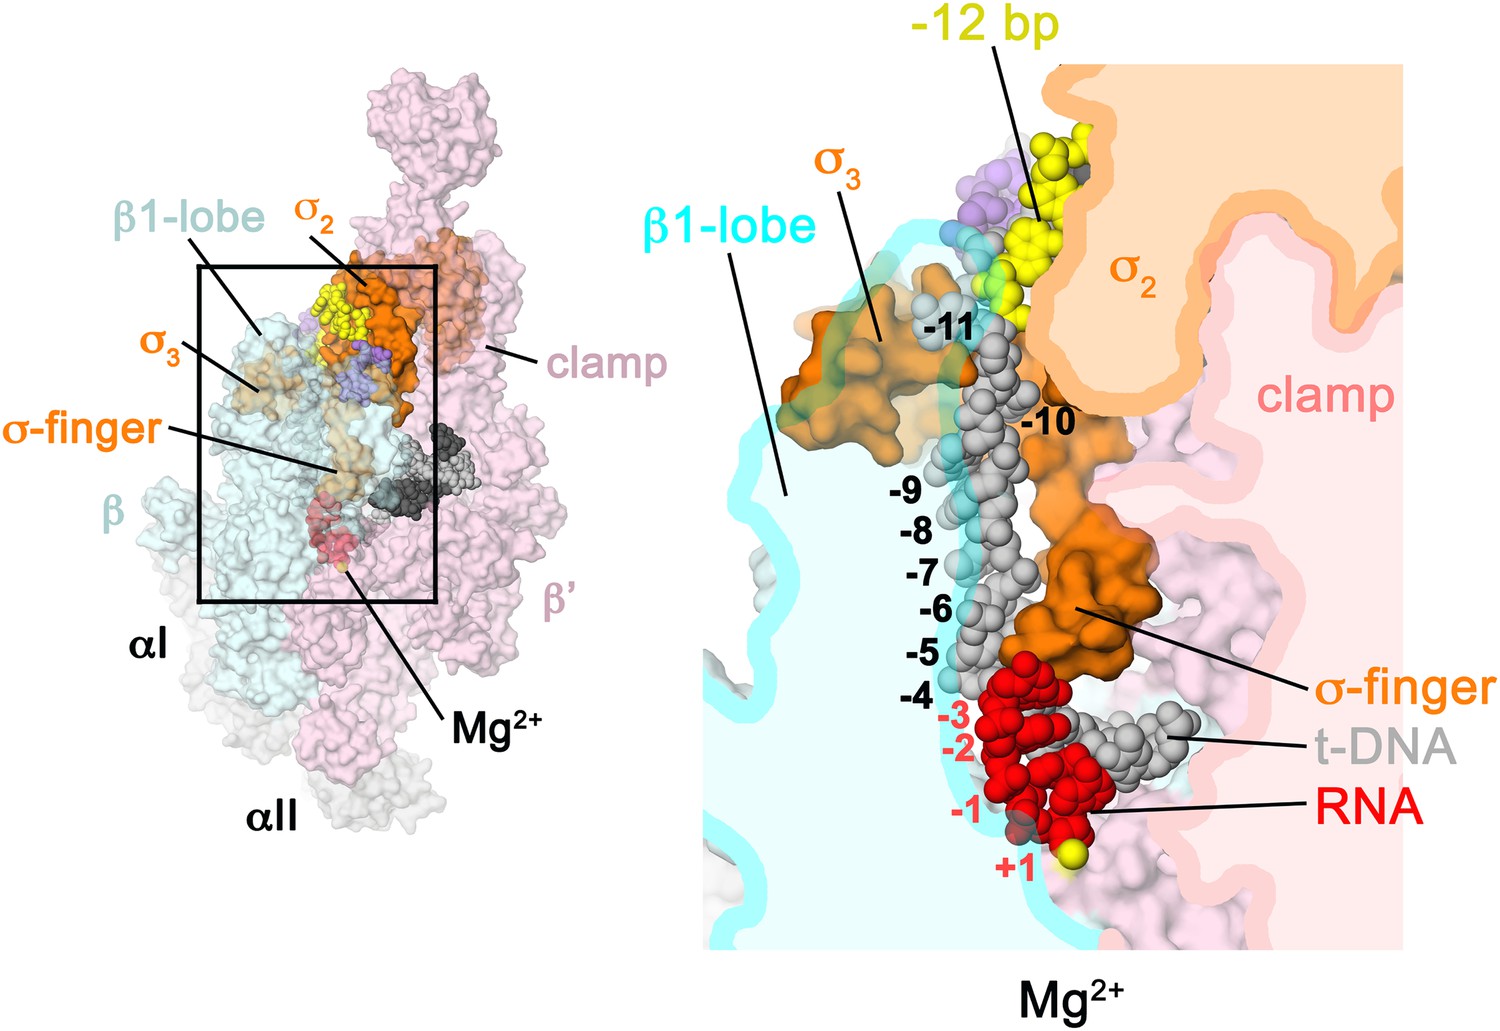
Structural role of the σ3.2-loop.
(Left) Overall view of RPo structure, colored as in Figure 1 except σA is orange. The RNAP β and β′ subunits are transparent to reveal the RNAP active site Mg2+ (yellow sphere) and the nucleic acids held inside the RNAP active site channel. The ss nt-strand DNA is omitted for clarity. The boxed area is magnified on the right. (Right) Magnified view showing a cross-section of the RNAP active site channel. For clarity, the RNAP β, β′, and domains are shown mostly as outlined shapes, with β transparent. The ss t-strand DNA (−11 to −4) is directed towards the RNAP active site through a tunnel between the σ3.2-loop and the β1-lobe. The 4-nt RNA transcript (−3 to +1) contacts the distal tip of the σ3.2-loop. Further elongation of the RNA would require displacement of the σ3.2-loop.
Tables
Table 1
Table of crystallographic statistics
| Taq EΔ1.1σA + | Us-fork (−12 bp) | Us-fork (−11 bp) | Bubble/RNA (RPo) | Bubble |
|---|---|---|---|---|
| Data collection | ||||
| Space group | P43212 | P43212 | P43212 | P43212 |
| Combined datasets | 3 | 4 | 10 | 4 |
| Cell dimensions | ||||
| a (Å) | 289.87 | 288.23 | 289.26 | 290.76 |
| b (Å) | 289.87 | 288.23 | 289.26 | 290.76 |
| c (Å) | 537.36 | 535.25 | 536.60 | 540.84 |
| Wavelength (Å) | 1.075 | 1.075 | 1.075 | 1.075 |
| Resolution (Å) | 50.03–4.01 (4.143–4.01)† | 49.43–4.60 (4.76–4.60)† | 34.96–4.14 (4.29–4.14)† | 40.00–4.74 (4.91–4.74)† |
| Total reflections | 2,192,774 (167,274) | 1,268,008 (123,590) | 5,022,989 (367,167) | 1,849,900 (143,237) |
| Unique reflections | 185,025 (18,323) | 125,012 (11,043) | 172,210 (16,966) | 116,874 (8115) |
| Multiplicity | 11.5 (9.1) | 10.1 (10.1) | 29.2 (21.6) | 15.8 (12.7) |
| Completeness (%) | 99.9 (98.6) | 99.0 (100.00) | 100 (99.8) | 99.6 (97.0) |
| <I>/σI | 6.68 (0.43) | 5.57 (0.60) | 9.4 (0.8) | 8.11 (0.81) |
| Wilson B-factor (Å2) | 133.90 | 154.68 | 101.16 | 196.78 |
| Rpim‡ | 0.173 (2.136) | 0.238 (1.816) | 0.207 (1.264) | 0.177 (2.047) |
| CC1/2§ | 0.988 (0.219) | 0.975 (0.323) | 0.983 (0.157) | 0.974 (0.205) |
| CC*§ | 0.997 (0.601) | 0.994 (0.698) | 0.996 (0.521) | 0.993 (0.584) |
| Anisotropic scaling B-factors¶ | ||||
| a*, b* (Å2) | 18.19 | 22.15 | 15.44 | 20.96 |
| c* (Å2) | −36.37 | −44.3 | −30.88 | −41.92 |
| Refinement | ||||
| Rwork/Rfree | 0.2531/0.2961 (0.3712/0.4188) | 0.2446/0.2800 (0.3464/0.3726) | 0.270/0.308 (0.358/0.371) | – |
| CCwork/CCfree§ | 0.918/0.900 (0.373/0.300) | 0.923/0.904 (0.438/0.293) | 0.897/0.890 (0.343/0.280) | – |
| No. atoms | 56,478 | 56,501 | 58,279 | – |
| Macromolecule | 56,472 | 56,495 | 58,273 | – |
| Ligand/ion | 6 | 6 | 6 | – |
| Water | 0 | 0 | 0 | – |
| Protein residues | 6871 | 6871 | 6875 | – |
| B-Factors | ||||
| Protein | 139.60 | 175.65 | 137.7 | – |
| Ligand/ion | 169.70 | 175.69 | 134.4 | – |
| R.m.s deviations | ||||
| Bond lengths (Å) | 0.004 | 0.005 | 0.003 | – |
| Bond angles (°) | 0.91 | 1.12 | 0.80 | – |
| Clashscore | 11.91 | 22.89 | 12.88 | – |
| Ramachandran favored (%) | 94 | 88 | 92 | – |
| Ramachandran outliers (%) | 0.41 | 0.83 | 0.23 | – |
-
†
Values in parentheses are for highest-resolution shell.
-
‡
-
§
-
¶
As determined by the UCLA MBI Diffraction Anisotropy Server (http://services.mbi.ucla.edu/anisoscale/).
Table 2
Conservation of RNAP β′ subunit residues
| Residue | % Identity* | Blosum62 score*, † | Distribution of residues from alignment* |
|---|---|---|---|
| β′Y34 | 99.5 | 0.976 | Y 803; H 1; Q 1; F 2 |
| β′R35 | 99.4 | 0.980 | R 829; K 5 |
-
*
Determined from an alignment of 834 bacterial RNAP β′ subunit sequences (Lane and Darst, 2010).
-
†
Blosum62 score calculated by PFAAT (Johnson et al., 2003).
Table 3
Conservation of σA residues
| Residue | % Identity* | Blosum62 score*, † | Distribution of residues from alignment* |
|---|---|---|---|
| σA Y217 | 99.4 | 0.988 | 996 Y; 5 H; 1 F |
| σA R220 | 100 | 0.998 | – |
| σA W256 | 100 | 0.998 | – |
| σA W257 | 100 | 0.998 | – |
| σA Q260 | 100 | 0.998 | – |
| σA R264 | 100 | 0.998 | – |
| σA R274 | 100 | 0.998 | – |
| σA V277 | 100 | 0.998 | – |
| σA H278 | 100 | 0.998 | – |
| σA E281 | 100 | 0.998 | – |
| σA R288 | 99.7 | 0.993 | 999 R; 3 K |
| σA R291 | 99.7 | 0.988 | 997 R; 2 K; 1 H; 1 S; 1 L |
-
*
Determined from an alignment of 1002 bacterial RNAP primary σ subunit sequences (Supplementary file 1).
-
†
Blosum62 score calculated by PFAAT (Johnson et al., 2003).
Download links
A two-part list of links to download the article, or parts of the article, in various formats.
Downloads (link to download the article as PDF)
Open citations (links to open the citations from this article in various online reference manager services)
Cite this article (links to download the citations from this article in formats compatible with various reference manager tools)
Structure of a bacterial RNA polymerase holoenzyme open promoter complex
eLife 4:e08504.
https://doi.org/10.7554/eLife.08504


