The evolution of adhesiveness as a social adaptation
- Université Pierre et Marie Curie, France
- École Normale Supérieure, PSL Research University, France
Figures
Figure 1
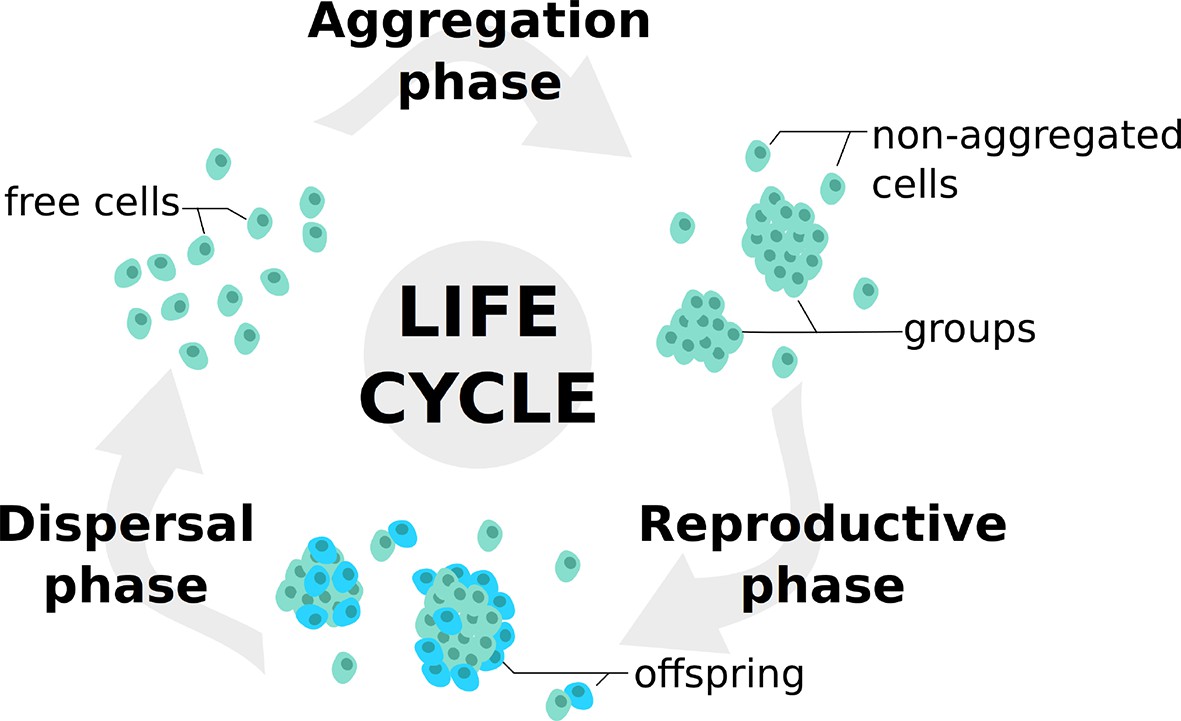
Life cycle used in the model.
At each generation, individuals undergo a succession of three steps: an aggregation phase (AP) during which they form groups depending on their adhesiveness trait; a reproduction phase (RP) in which they leave offspring with a probability dependent on their strategies and their payoffs in groups; a dispersal phase (DP) when all individuals are scattered anew for the next generation. Such life cycle is consistent with those observed in facultative multicellular microorganisms such as dictyostelids and myxobacteria.
Figure 2
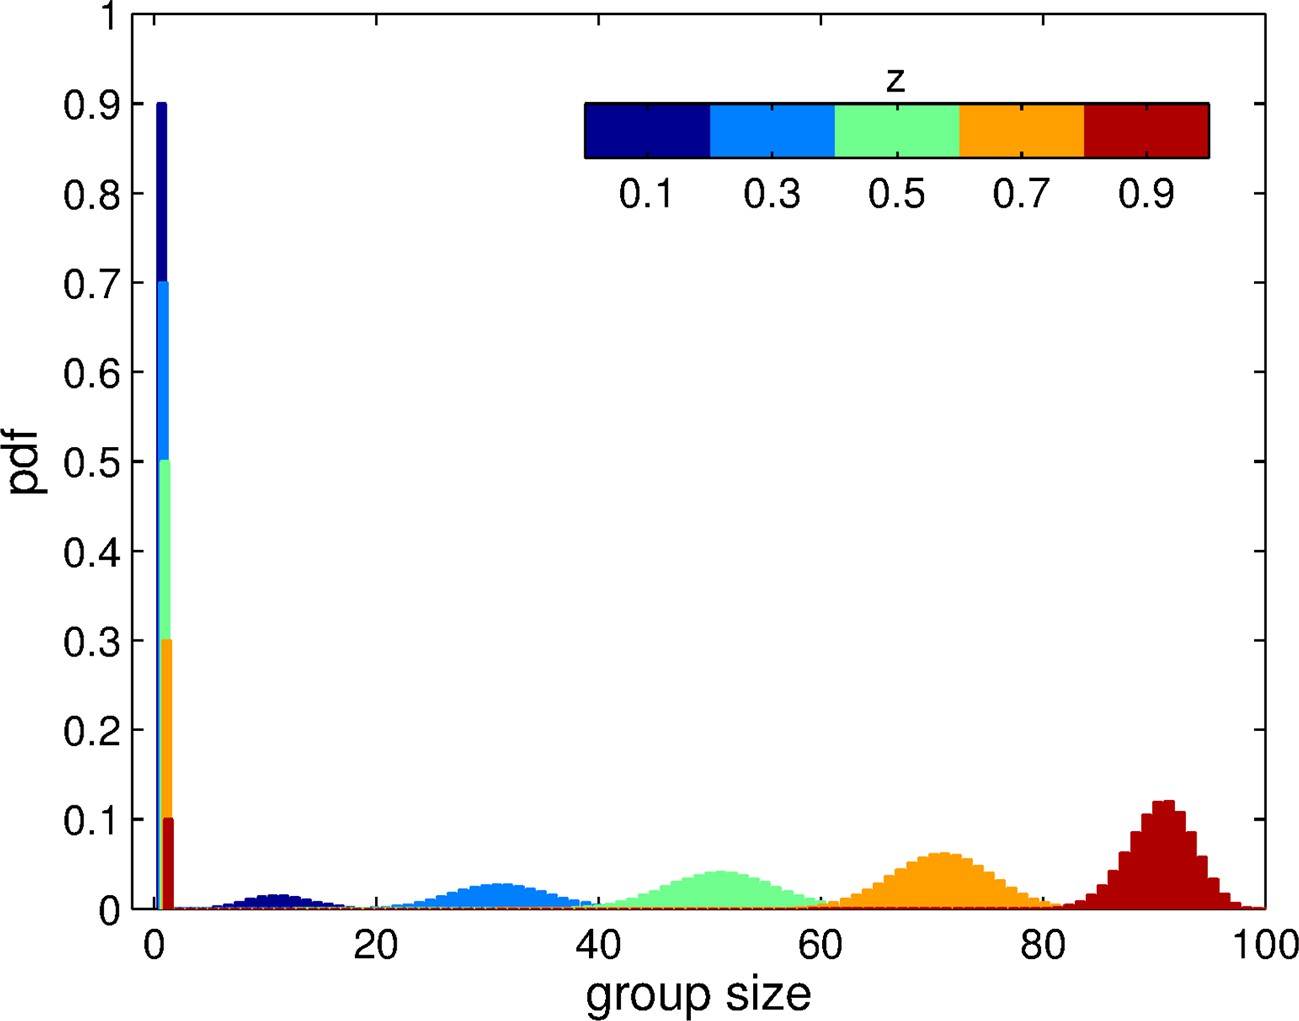
Group size distribution experienced by individuals in a momomorphic population with trait value , for the aggregation process based on adhesion.
The size of each patch is . The distribution is composed of a fraction of ungrouped individuals () and a binomial distribution of grouped individuals centered on . Here, we display this distribution for 5 distinct values of .
Figure 3
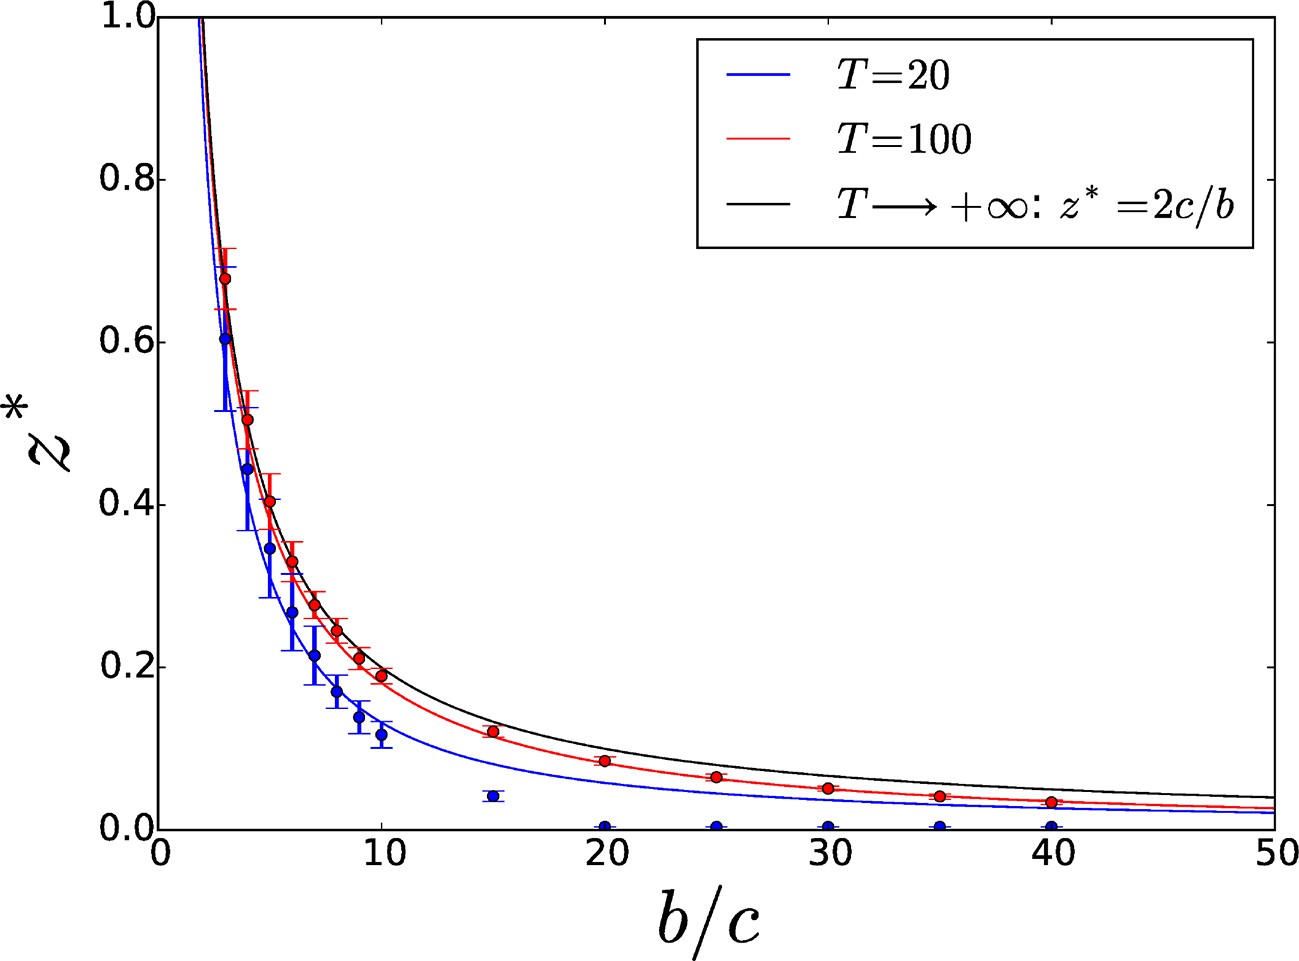
Threshold adhesiveness value required for the evolution of increased adhesion.
In the case of group formation by attachment, the theoretical value of in the limit of infinite is , as demonstrated in Section 4.1. Analytical thresholds (full lines) as well as numerical estimations (circles) are displayed for small () and large () values of . As decreases, threshold values decrease too because of enhanced direct benefits. Numerical results are consistent with analytical predictions. Error bars indicate the variability—associated with the finite size of the population—in the estimation of the threshold across multiple computations of the aggregation process.
Figure 4
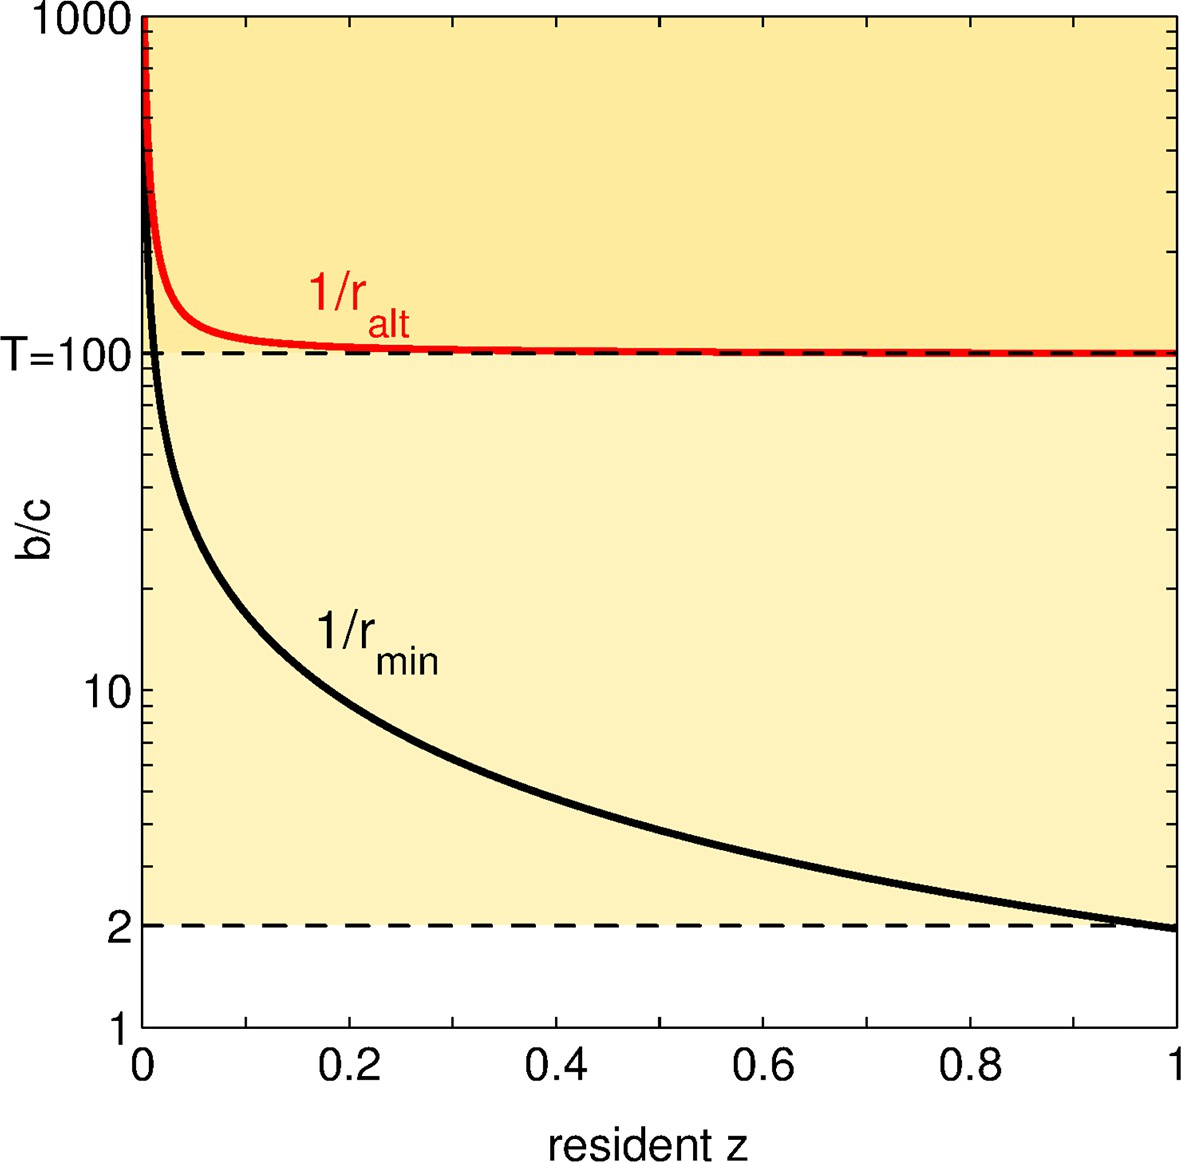
Status of social mutations.
For any resident adhesiveness value between and , we display, in black: the minimal benefit-to-cost ratio for a social (or positive) mutation to be selected; in red: the maximal benefit-to-cost ratio such that this mutation is altruistic. Let us choose a fixed (i.e. an horizontal line in the graph). According to the value of , the fate and the social status of positive mutations change. For low (), all social mutations are altruistic but none of them is ever selected: the population is doomed to full asociality. For intermediate (between and ), social mutations are favored as soon as overcomes a threshold (crossing of the black line with the horizontal line ), and are altruistic all along the evolutionary dynamics. For large (), once the threshold is overcome and increases, social mutations are altruistic until some value of (crossing of the red line with the horizontal line ); afterwards, social mutations turn directly beneficial.
Figure 5
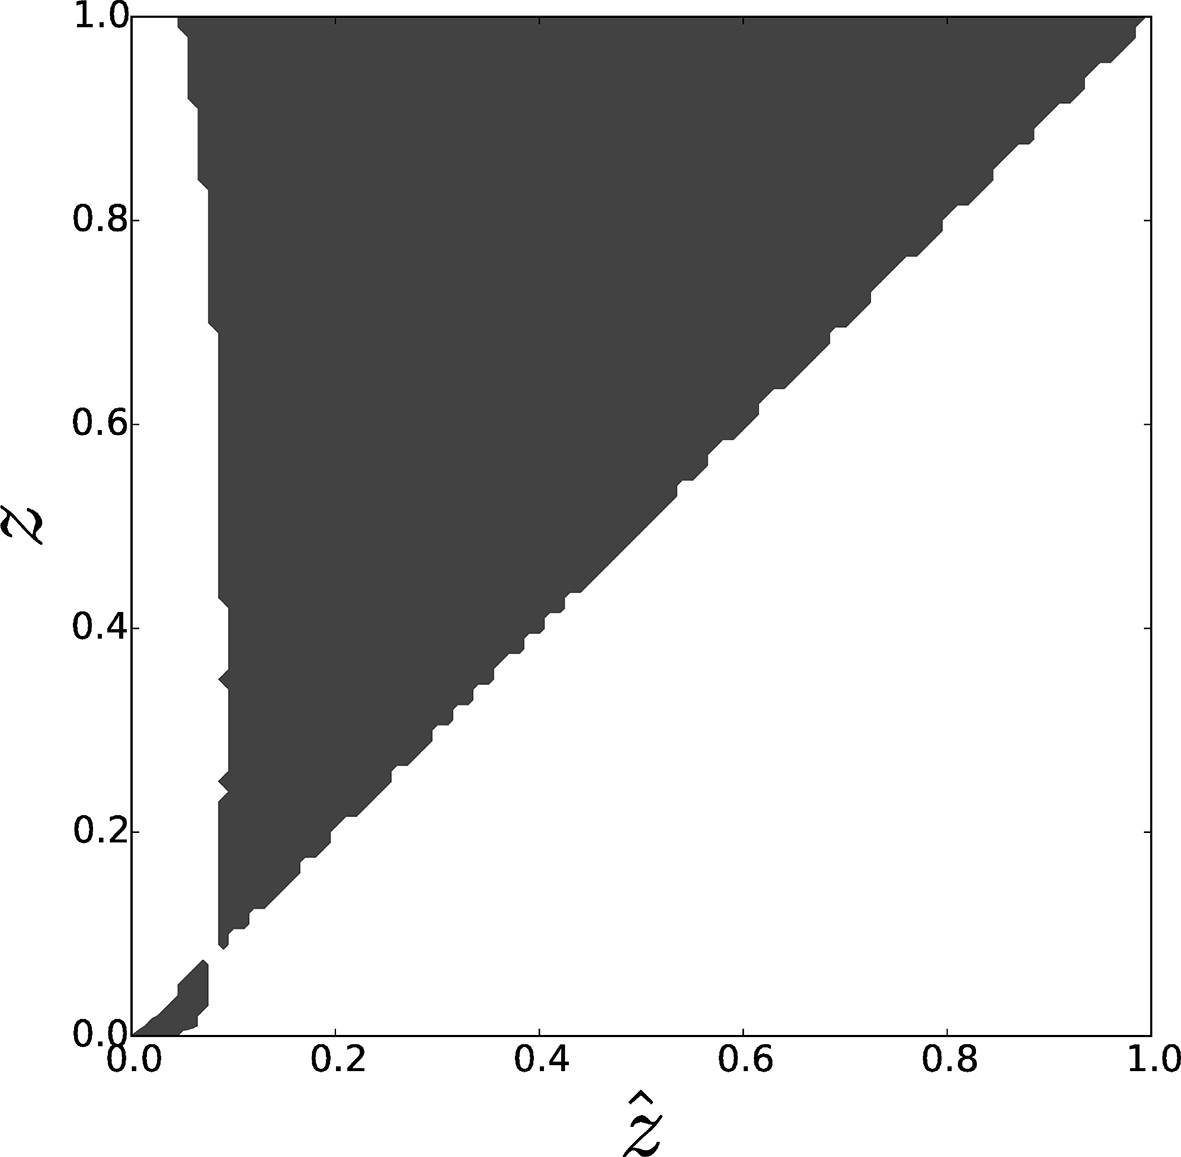
Pairwise invasibility plot obtained by simulation of the toy model for differential attachment.
A positive invasion fitness (gray) means that the mutant can invade the population and replace the resident trait whereas a negative invasion fitness (white) means that the mutant is outcompeted. A singular point is found around , consistently with analytical predictions. This equilibrium can be characterized as a 'garden of Eden' (non-invasible repellor), which means that, depending on the position of the initial value of with respect to , evolutionary dynamics leads to the selection of either (when ) or (when ), i.e. either full asociality or full sociality. Parameters: , , .
Figure 6
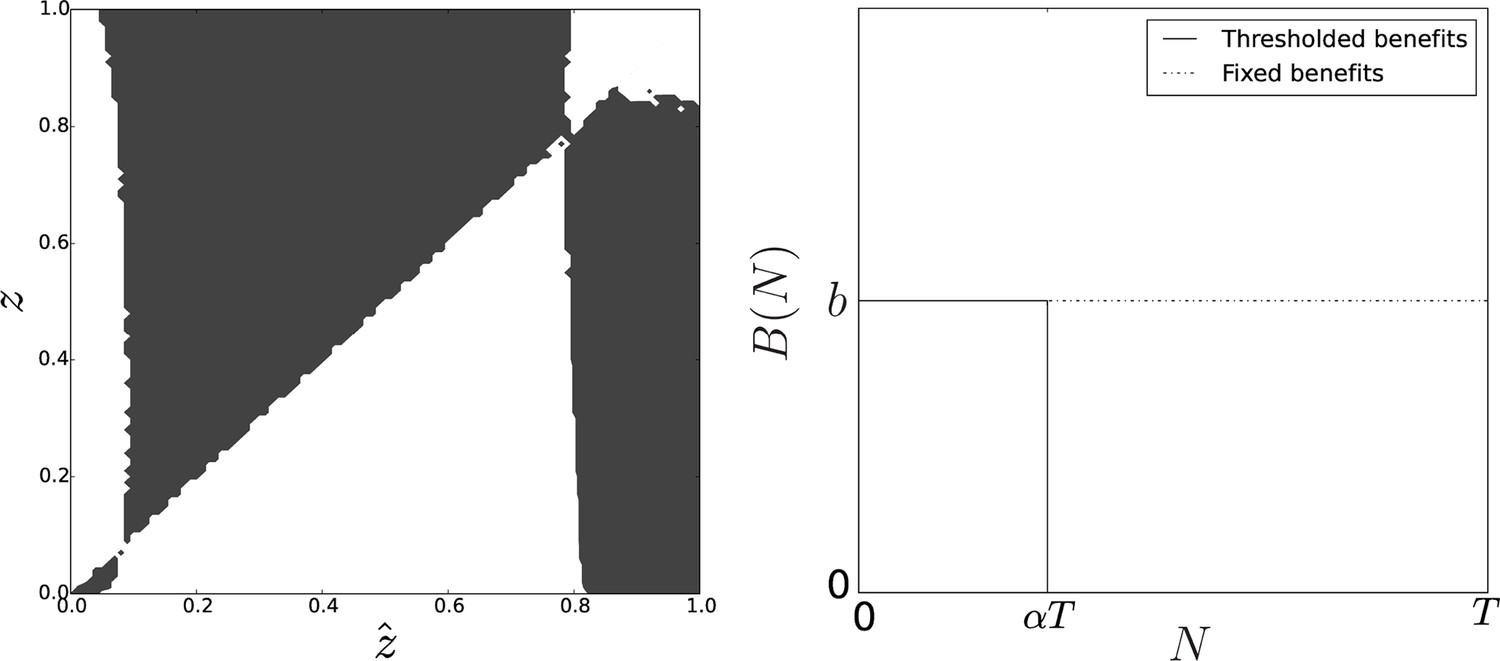
Pairwise invasibility plot obtained when group-related benefits are null above group size .
Here, the change in the benefit function leads to the appearance of a second equilibrium that is convergence-stable and non-invasible. As soon as the initial value of the adhesiveness trait is larger than the adhesiveness threshold , selection favors adhesion level at equilibrium. Parameters: , .
Figure 7
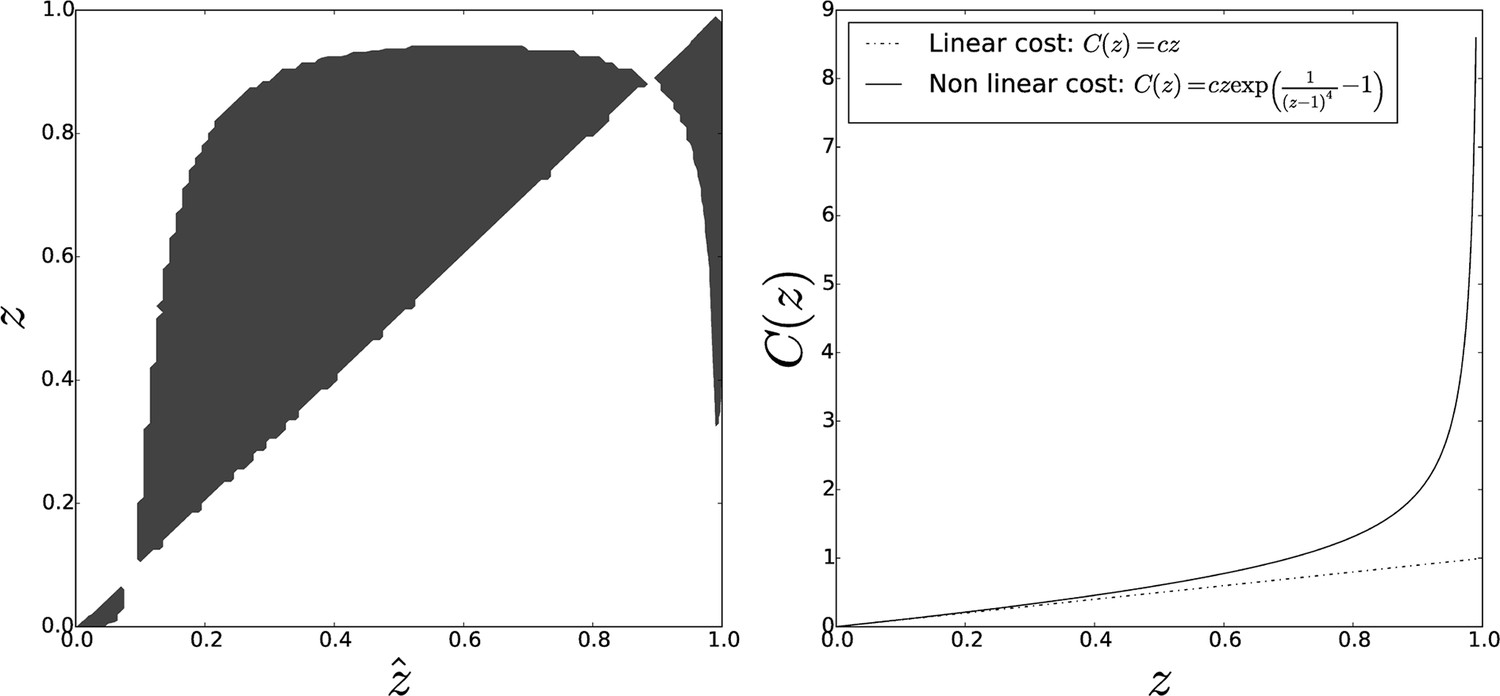
Pairwise invasibility plot obtained when individual cost diverges for large adhesiveness values.
As in the previous case, an other equilibrium appears that is a CSS (convergence-stable strategy), hence the evolutionary endpoint as soon as the initial adhesiveness value overcomes the threshold . Parameters: , .
Download links
A two-part list of links to download the article, or parts of the article, in various formats.
Downloads (link to download the article as PDF)
Open citations (links to open the citations from this article in various online reference manager services)
Cite this article (links to download the citations from this article in formats compatible with various reference manager tools)
The evolution of adhesiveness as a social adaptation
eLife 4:e08595.
https://doi.org/10.7554/eLife.08595


