The 133-kDa N-terminal domain enables myosin 15 to maintain mechanotransducing stereocilia and is essential for hearing
- University of Michigan, United States
- University of Kentucky, United States
- National Institute on Deafness and Other Communication Disorders, United States
- University of Michigan Medical School, United States
Figures
Figure 1 with 1 supplement

A mutation targeting isoform 1 causes deafness in Myo15ΔN/ΔN mice.
(A) Two protein isoforms are generated from alternatively spliced transcripts of Myo15. Transcripts incorporating exon 2 encode isoform 1 (396 kDa; Genbank: NM_010862.2), while exclusion of this exon produces isoform 2 (262 kDa; Genbank: NM_182698.2). Both isoforms have identical motor and tail domains, including a PDZ ligand, SH3, MyTH4 and FERM moieties. The mutant Myo15 alleles used in this study are shown along with antibody epitopes. (B) Auditory brainstem response (ABR) thresholds at 4, 20 and 48 kHz for Myo15+/+, Myo15+/ΔN and Myo15ΔN/ΔN mice at 6 weeks of age. Data are mean ± SD (n = 3–6 animals per group). (C) ABR thresholds at 20 kHz, measured from 2, 4 and 6 weeks old Myo15+/+, Myo15+/ΔN and Myo15ΔN/ΔN mice. Data are mean ± SD (n = 3–6 animals per group). (D) Distortion product otoacoustic emission (DPOAE) levels (2F1-F2) at 12 kHz in Myo15+/+ and Myo15ΔN/ΔN mice at 6 weeks. Data are mean ± SD (n = 3–4 animals per group). (E–G) Relative expression of Myo15 isoforms in wild-type cochleae measured with RT-qPCR at ages indicated. Probes target exon junction 13–14, detecting the motor domain common to both isoforms 1 and 2 (E); exon junction 2–3, detecting isoform 1 (F); exon junction 1–3, detecting isoform 2 (G). Relative expression 2^(-∆∆CT) for each Myo15 transcript was normalized first to the housekeeping gene (Tbp) and then to the respective isoform expression at P0. The total expression of both isoforms remains stable (E), however there is a transition from isoform 2 to isoform 1, which becomes the dominant mRNA species by P21 (see Figure 1—figure supplement 1D). Data are mean ± SD (n = 3–5 biological replicates per condition). Asterisks indicate significance: n.s., p > 0.05; **, p < 0.01; ****, p < 0.0001 (ANOVA with Tukey's multiple comparison test). (H) Identical qPCR probes were used to assay Myo15 expression in Myo15+/ΔN and Myo15ΔN/ΔN cochleae at P0. Relative expression 2^(-∆∆CT) values were normalized to Tbp and then to expression in heterozygous Myo15+/∆N samples. Data are mean ± SD (n = 3–4 biological replicates per condition). n.s., p > 0.05 (t-test of independent variables).
Figure 1—figure supplement 1
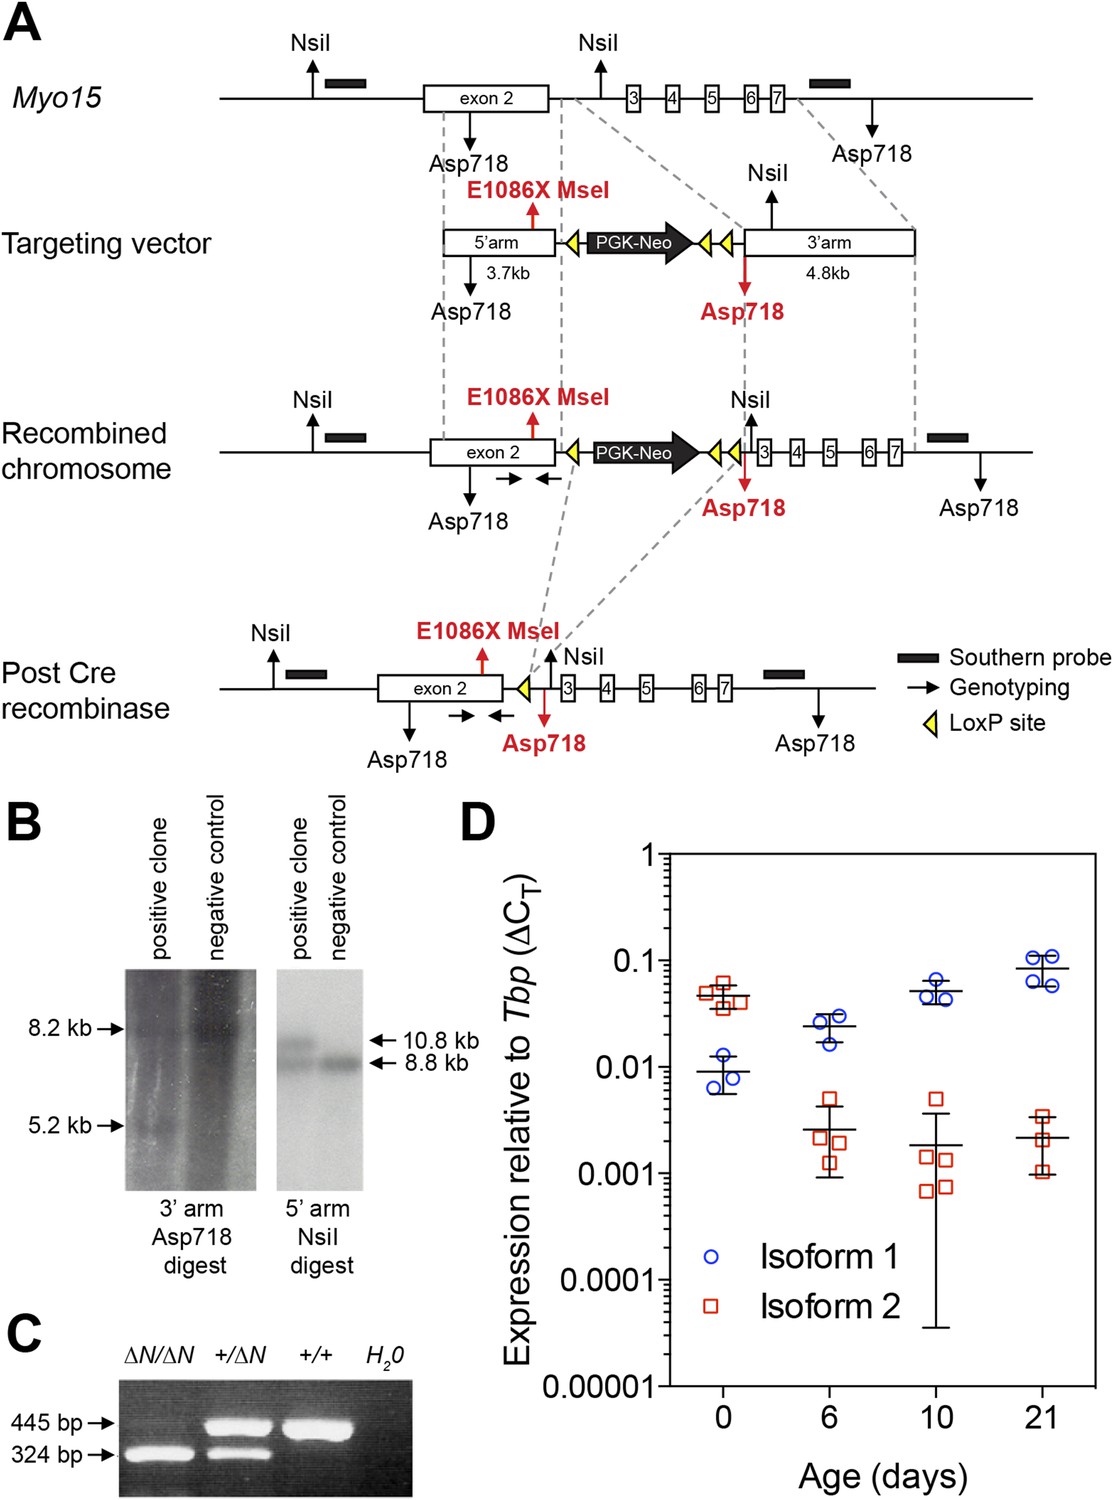
Generation of a mouse model for human p.E1105X DFNB3 deafness.
(A) Genomic locus of the wild-type mouse Myo15 allele and targeting strategy to introduce the p.E1086X mutation into exon 2 by homologous recombination. Southern blot probes (black bars) and loxP sites (yellow triangles) are shown. A single loxP site remains after excision of the PGK-Neo cassette by cre recombinase. Restriction sites unique to the recombined allele are highlighted in red. Homozygous mutants of both sexes were fertile and obtained in normal Mendelian ratios expected for an autosomal recessive allele (data not shown). (B) Validation of homologous recombination by Southern blot analysis. ES cell genomic DNA was digested with Asp718 (left panel) or NsiI (right panel) and hybridized with DNA probes to the 3′ arm (left panel) or 5′ arm (right panel). The restriction fragment sizes expected for a correctly recombined locus are shown (arrows). (C) PCR confirmation of germ-line transmission from mouse tail genomic DNA. Introduction of the p.E1086X mutation creates a new MseI endonuclease restriction site that is used for genotyping. Amplicons were digested with MseI and restriction fragments analyzed by gel electrophoresis. The expected restriction fragments for different genotypes are shown (arrows). (D) Quantitative PCR (qPCR) analysis of Myo15 isoform expression in mouse cochleae. The qPCR data for isoforms 1 and 2 (previously presented in Figure 1), were reanalyzed as fold changes (2^-ΔCT) relative to the housekeeping gene Tbp. Note: the large errors bars at day 10 are due to the use of semi-logarithmic axes.
Figure 2
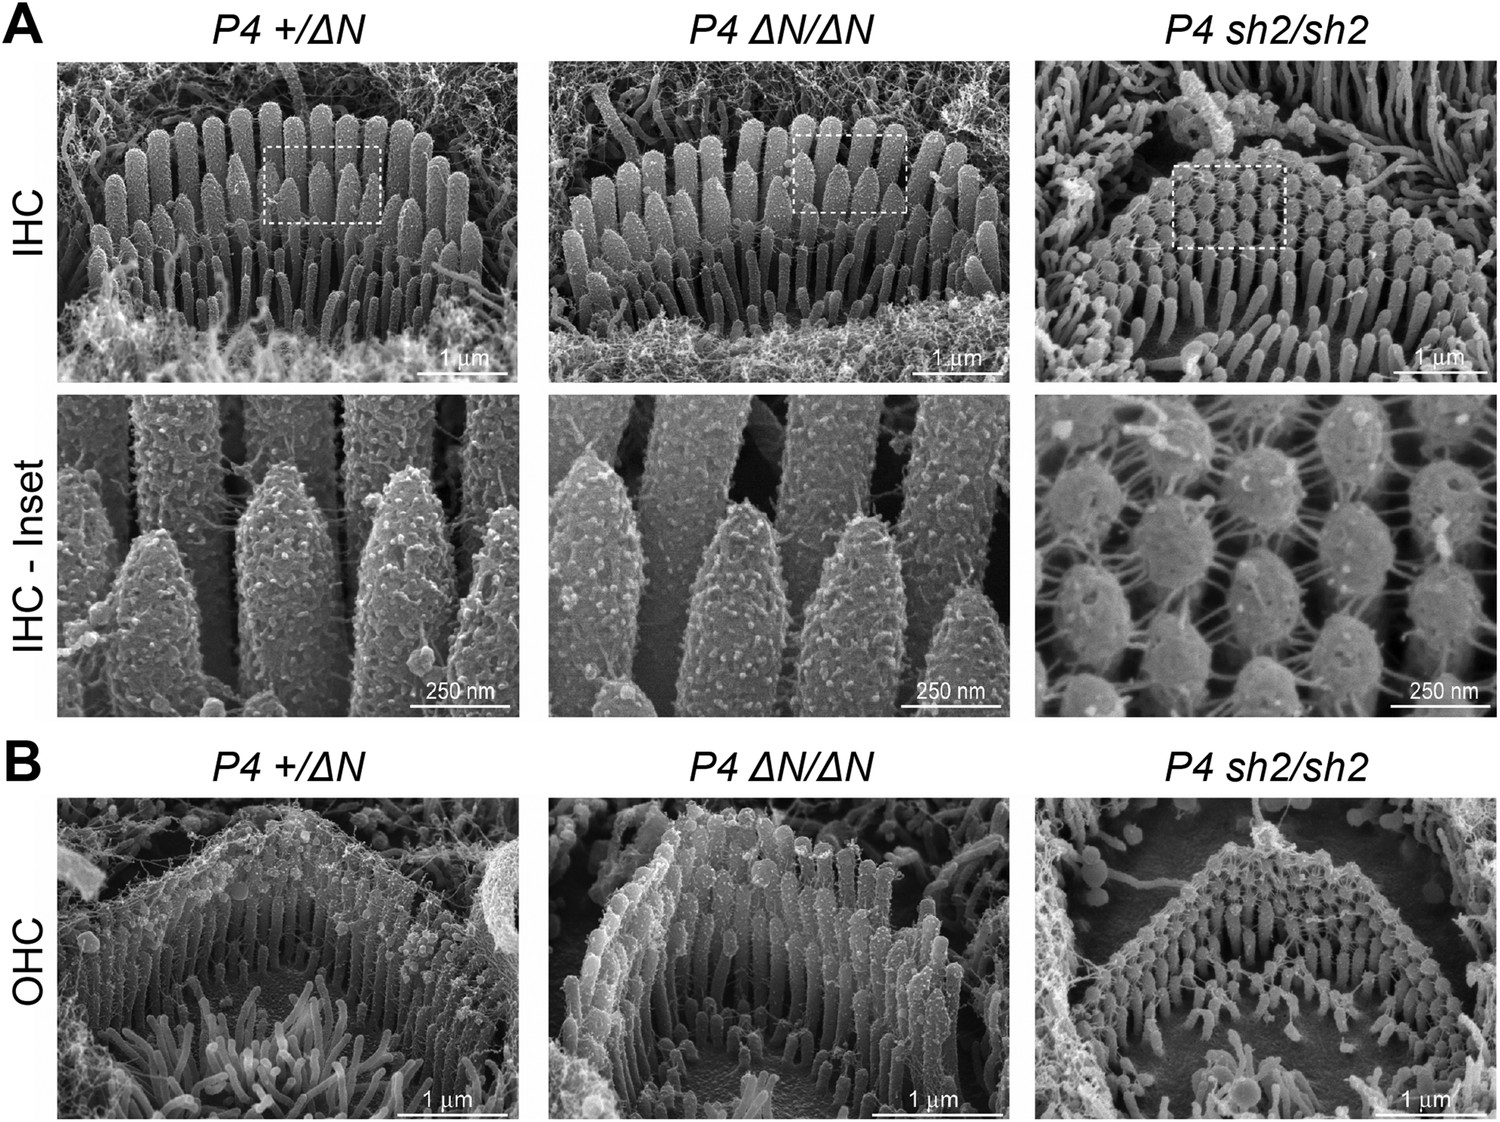
Myo15ΔN/ΔN hair cells initially develop normal stereocilia bundles.
(A, B) Scanning electron microscopy (SEM) of inner (A) and outer (B) hair cells from Myo15ΔN/ΔN, normal hearing Myo15+/ΔN littermates and Myo15sh2/sh2 cochleae at P4. Highlighted regions of IHC bundles (white boxes) are shown at higher magnification below. Myo15ΔN/ΔN stereocilia bundles develop the characteristic staircase architecture (see Figure 7—figure supplement 2) that is strikingly absent from age-matched Myo15sh2/sh2 hair cells. Scale bars are 1 µm (A, upper row and B) and 250 nm (A, lower row).
Figure 3 with 1 supplement
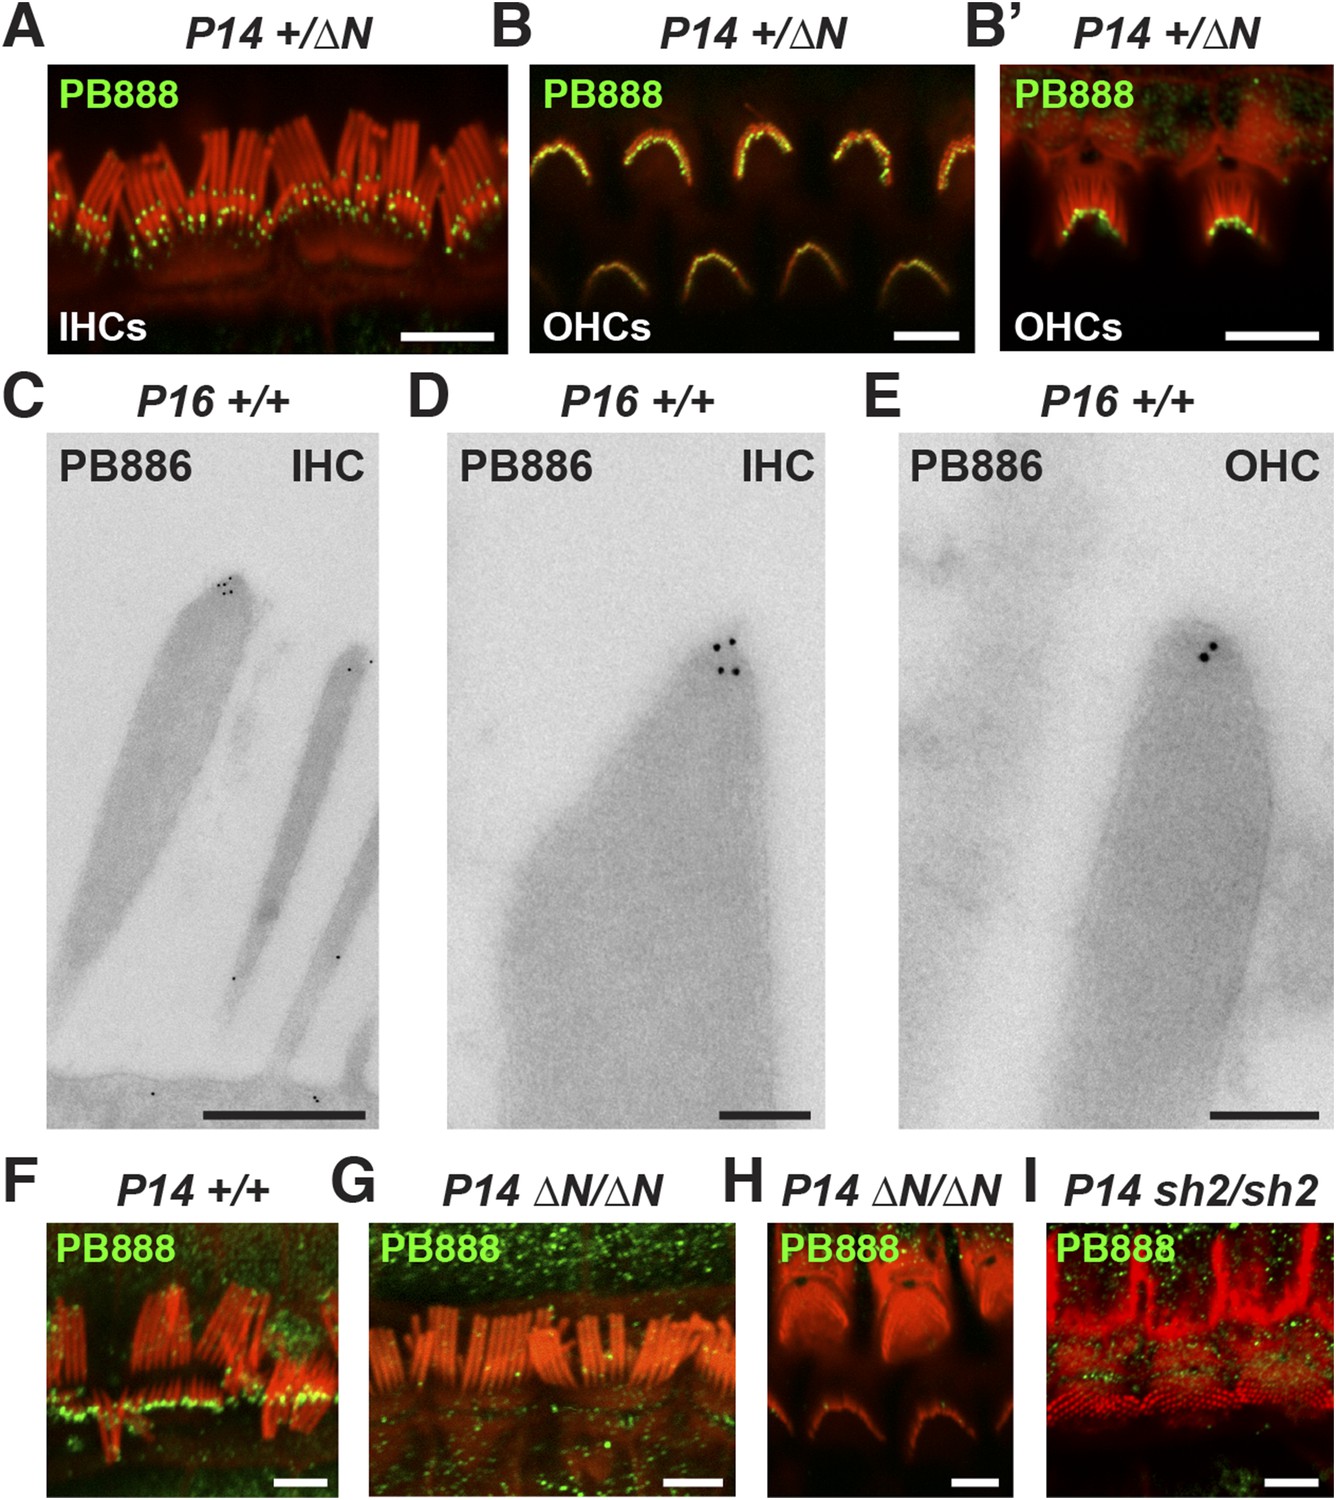
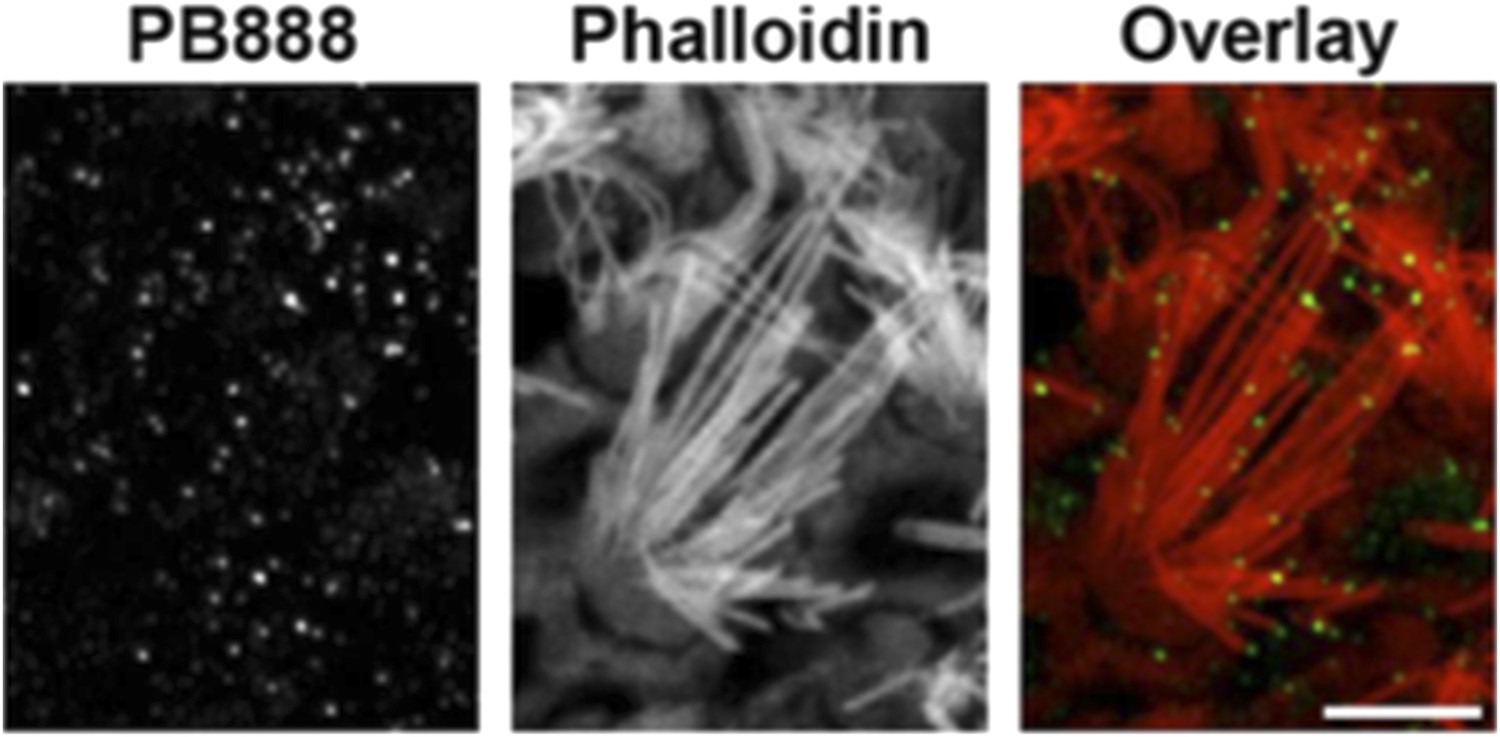
Isoform 1 targets to the tips of shorter mechanotransducing stereocilia.
(A) PB888 antibody (green) detects isoform 1 at the tips of shorter row stereocilia of IHCs from normal hearing Myo15+/∆N mice. (B) Isoform 1 is present at the tips of all stereocilia in OHCs of normal hearing Myo15+/∆N mice at P14. An oblique view confirms the presence of isoform 1 on the tallest row (B′). (C–E) TEM micrographs of immuno-gold labeled PB886 in ultrathin stereocilia sections. Isoform 1 is localized in proximity to the stereocilia tip density. Labeling was infrequently observed along the stereocilia core. (F) PB888 does not localize to the upper tip-link insertion point on the tallest IHC stereocilia row in intentionally splayed bundles. (G, H) Loss of reactivity in Myo15∆N/∆N IHCs and OHCs confirms the loss of isoform 1 protein from the hair bundle and the specificity of PB888 labeling. (I) PB888 does not label the stereocilia tips in Myo15sh2/sh2 hair cells which have the p.C1779Y motor domain mutation. Scale bars are 5 µm (A, B, B′, F, G–I), 500 nm (C), 100 nm (D, E). Immunofluorescence samples are counter-stained with rhodamine phalloidin (red) to reveal the stereocilia actin cytoskeleton. See also Figure 3—figure supplement 1.
Figure 3—figure supplement 1

Isoform 1 localization during cochlear development.
(A–D) PB888 antibody labeling (green) of isoform 1 in cochlear whole mounts from wild-type Myo15+/+ (A, C) and isoform 1-null Myo15∆N/∆N (B, D) cochleae at P1 (A, B) and P7 (C, D). (E) PB888 antibody (green) in adult wild-type Myo15+/+ IHCs and OHCs at P28. The same OHCs are presented at different focal planes to show the tips of each stereocilia row. (F) PB888 antibody (green) in normal Myo15+/∆N IHCs at P14. Two focal planes of the same IHCs are shown. Note the presence of isolated punctae (arrows) on the tallest row. Rhodamine phalloidin (magenta) labels actin filaments in all panels. Scale bars are 5 µm.
Figure 4 with 1 supplement
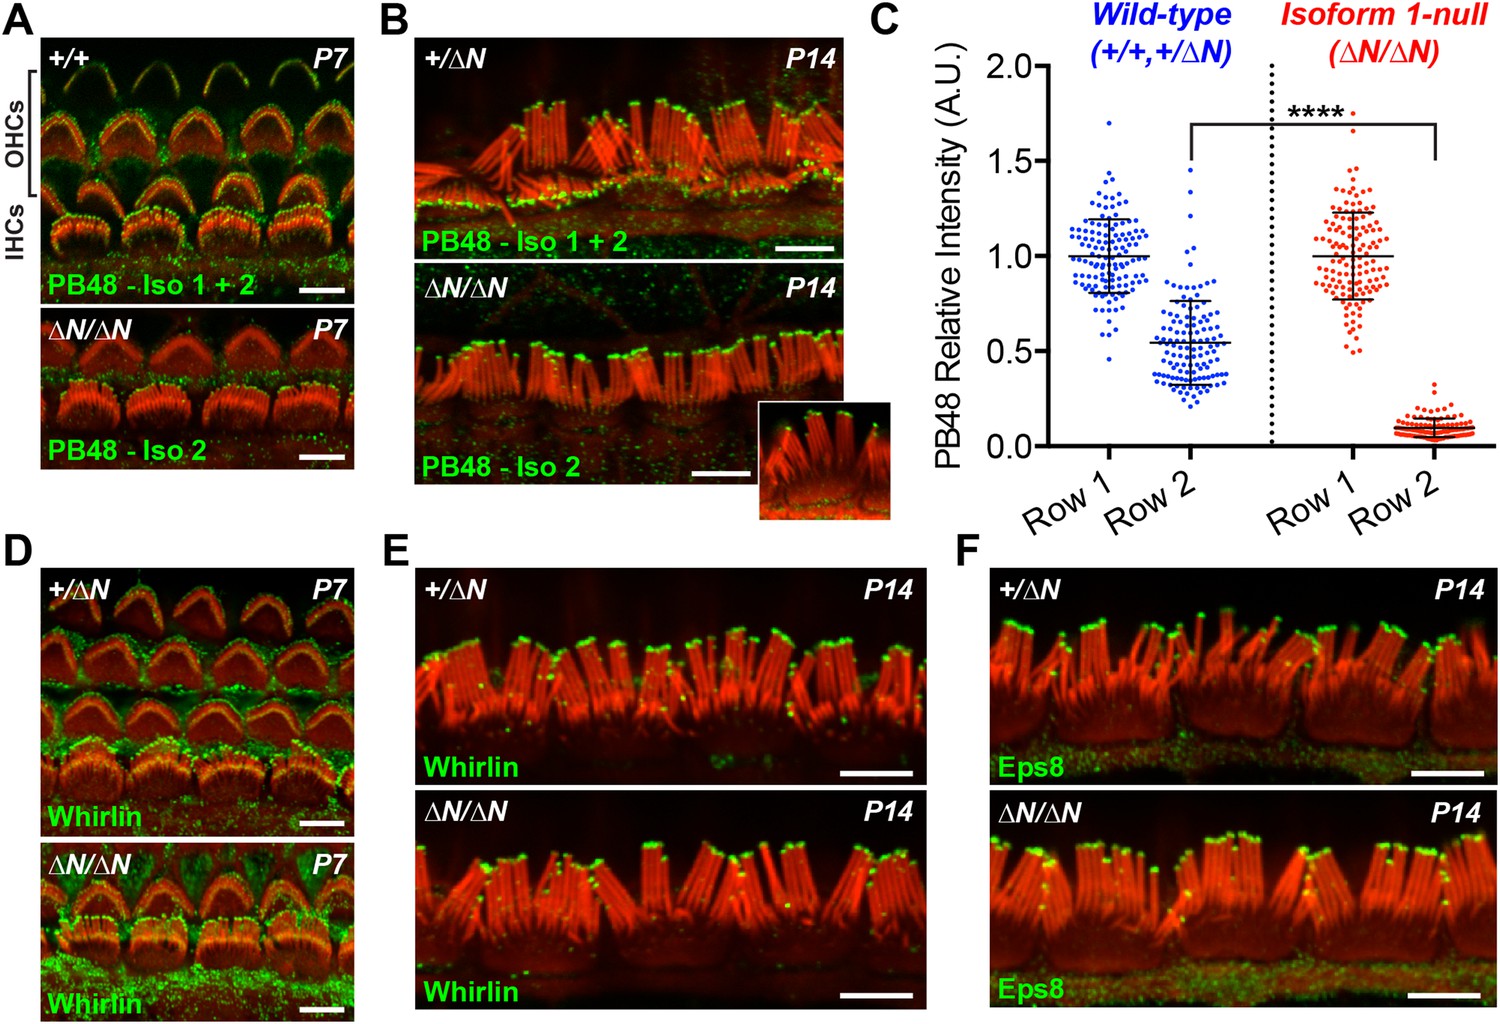
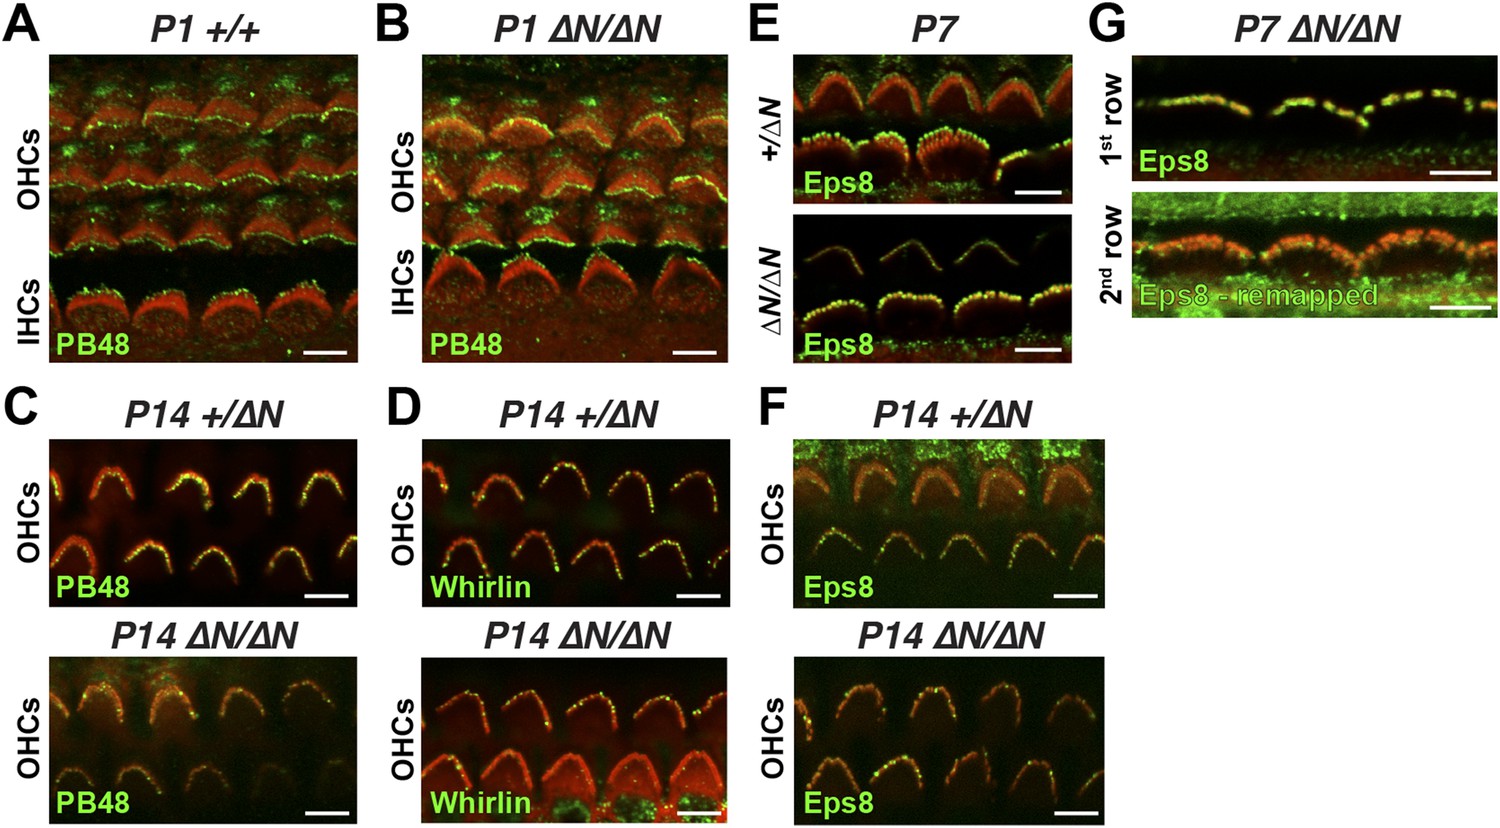
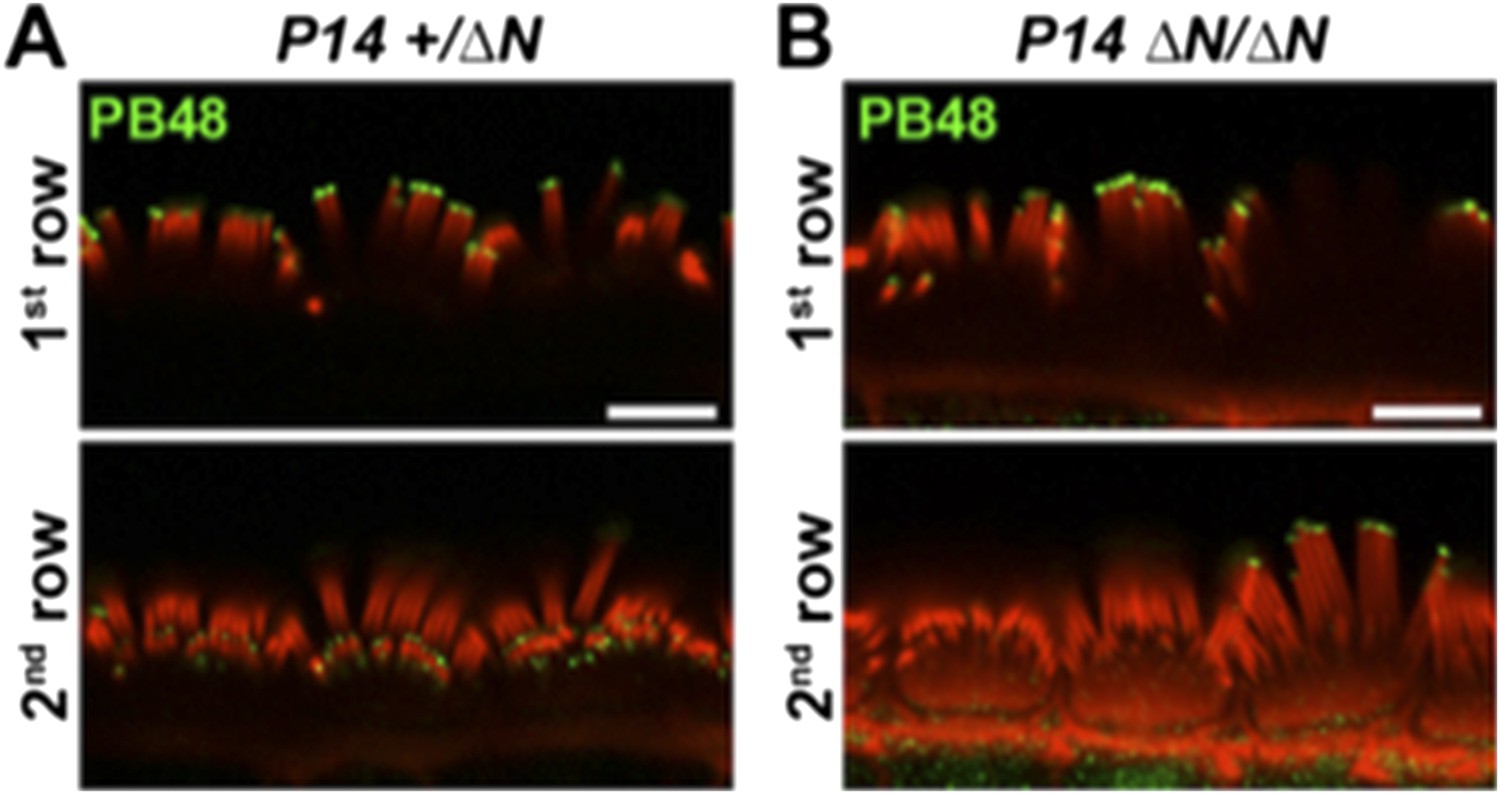
Isoform 2 traffics predominantly to the tallest stereocilia row and is sufficient to target Eps8 and Whirlin.
(A, B) PB48 antibody (green) was raised to an epitope common to isoforms 1 and 2 (Figure 1A) and labels all stereocilia rows in wild-type Myo15+/+ and Myo15+/∆N hair cells at P7 (A) and P14 (B). In isoform 1-null Myo15∆N/∆N hair cells, PB48 is predominantly detected on the tallest stereocilia row at P7 (A) and at P14 (B), identifying isoform 2 at these locations. (C) Quantification of PB48 fluorescence on the shorter second stereocilia row of IHCs at P7 normalized to the first (tallest) row. Data points represent individual stereocilia from wild-type (blue, Myo15+/+ and Myo15+/∆N combined, n = 125 stereocilia, 3 animals) or Myo15∆N/∆N (red, n = 112 stereocilia, n = 4 animals) IHCs at P7, overlaid with mean ± SD. Asterisks indicate significance: *, p < 0.0001 (t-test of independent variables). (D, E) Whirlin antibody localizes primarily to the tallest stereocilia row of control Myo15+/∆N hair cells at P7 (D) and at P14 (E). The localization of whirlin remains unchanged in isoform 1-null Myo15∆N/∆N hair cells at P7 (D) or P14 (E). (F) Eps8 antibody localizes primarily to the tallest stereocilia row of control Myo15+/∆N and isoform 1-null Myo15∆N/∆N IHCs at P14. All samples are co-labeled with rhodamine phalloidin (red). Scale bars are 5 µm.
Figure 4—figure supplement 1
Isoform 2 is sufficient to traffic Eps8 and Whirlin within the hair bundle.
(A, B) PB48 labeling (green) of isoforms 1 and 2 in whole mount Myo15+/+ (A) and isoform 1-null Myo15∆N/∆N (B) hair cells at P1. (C) PB48 labeling (green) of P14 Myo15+/∆N (top panel) and Myo15∆N/∆N OHCs (lower panel). (D) Whirlin antibody (HL5136) labeling (green) of Myo15+/∆N (top panel) and Myo15∆N/∆N (lower panel F) OHCs at P14. (E and F) Eps8 antibody labeling (green) in Myo15+/∆N (upper panels) and Myo15∆N/∆N (lower panels) hair cells at P7 (E) and P14 (F). Only OHCs are shown at P14 (F). (G) Alternate view of stereocilia bundles in Myo15∆N/∆N IHCs labeled for Eps8 at P7. The Eps8 antibody signal on the second row was boosted (remapped) to reveal weak labeling at the tips. Actin filaments are labeled in all samples with rhodamine phalloidin (red). Scale bars are 5 µm.
Figure 5
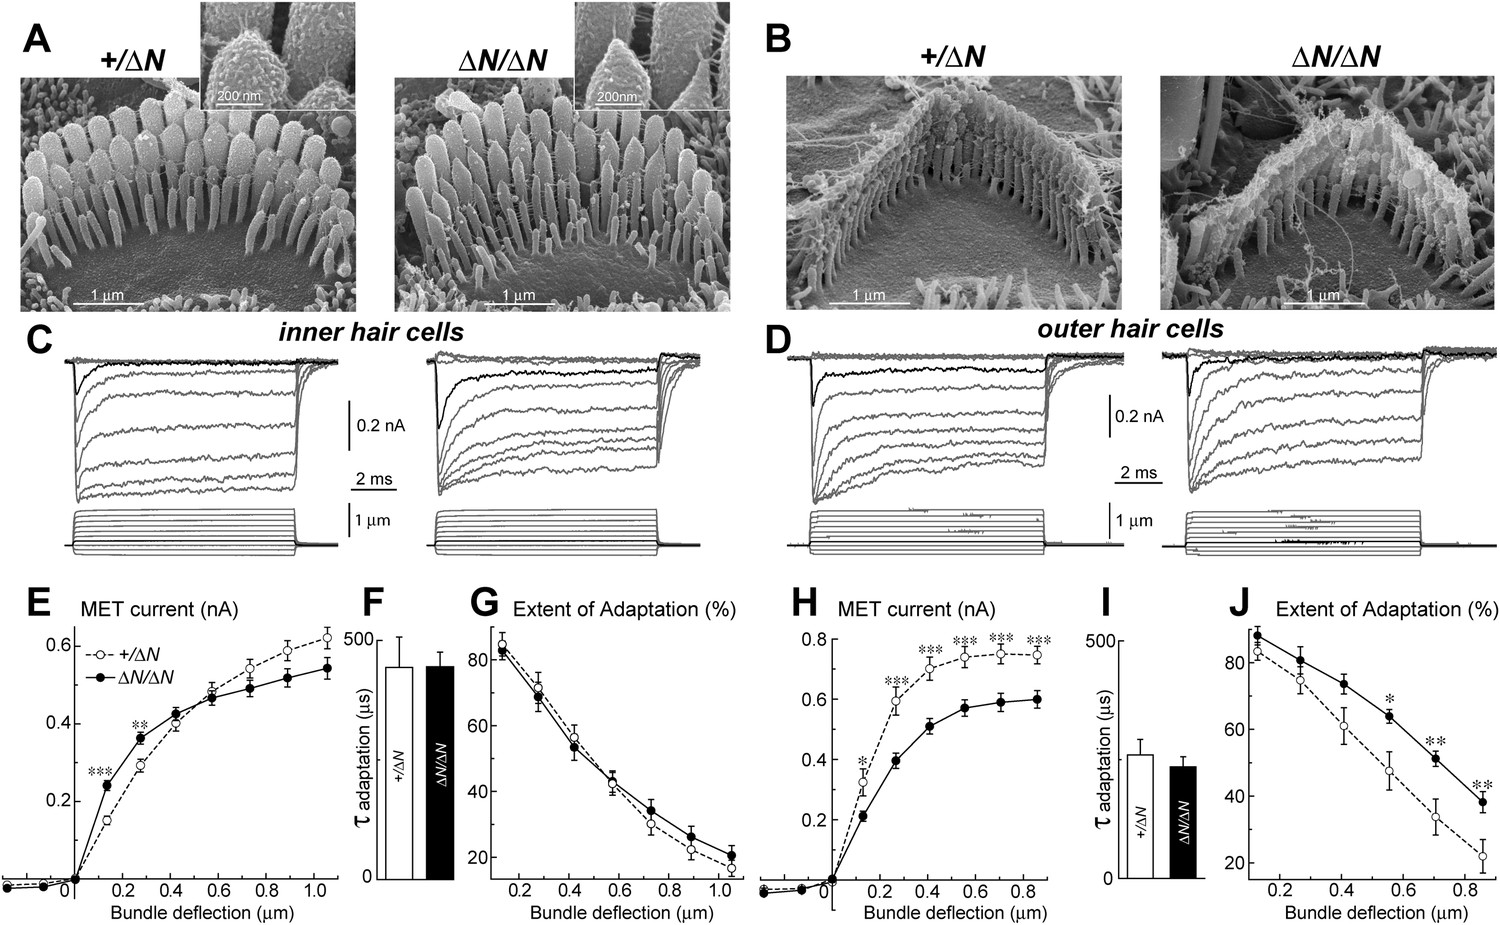
Isoform 1 is not required for MET but influences the deflection sensitivity of IHCs.
(A, B) SEM images of IHC (A) and OHC (B) stereocilia bundles in Myo15+/ΔN (left panels) and Myo15ΔN/ΔN (right panels) hair cells. Higher magnification of the second row IHC stereocilia tips are shown (inset). (C, D) Whole cell current responses (top traces) evoked by graded deflections of the stereocilia bundles (bottom traces) in IHCs (C) and OHCs (D) in Myo15+/ΔN (left) and Myo15ΔN/ΔN (right) hair cells. (E, H) Relationship between the peak MET current and stereocilia bundle displacement in IHCs (E) and OHCs (H) from Myo15+/ΔN (open circles) and Myo15ΔN/ΔN (closed circles) cochleae. (F, I) Time constants of MET adaptation in IHCs (F) and OHCs (I) for Myo15ΔN/ΔN and Myo15+/ΔN. Time constants were determined from a single exponential fit of MET responses evoked by the small bundle deflections of ∼150 nm (see black traces in C, D). (G, J) Percent changes of the MET current 10 ms after a stimulation step (extent of adaptation) as a function of stimulus intensity in IHCs (G) and OHCs (J). The same MET records contribute to all averaged data. Data are mean ± SE. Asterisks indicate statistical significance: *, p < 0.01; **, p < 0.001; ***, p < 0.0001 (t-test of independent variables). Holding potential was −90 mV. Age of the cells: P3-4 + 3–5 days in vitro. SEM images were obtained from cultured samples used for MET recordings. Number of cells: n = 10 (IHCs, Myo15+/ΔN), n = 12 (IHCs, Myo15ΔN/ΔN), n = 7 (OHCs, Myo15+/ΔN), n = 9 (OHCs, Myo15ΔN/ΔN).
Figure 6 with 1 supplement
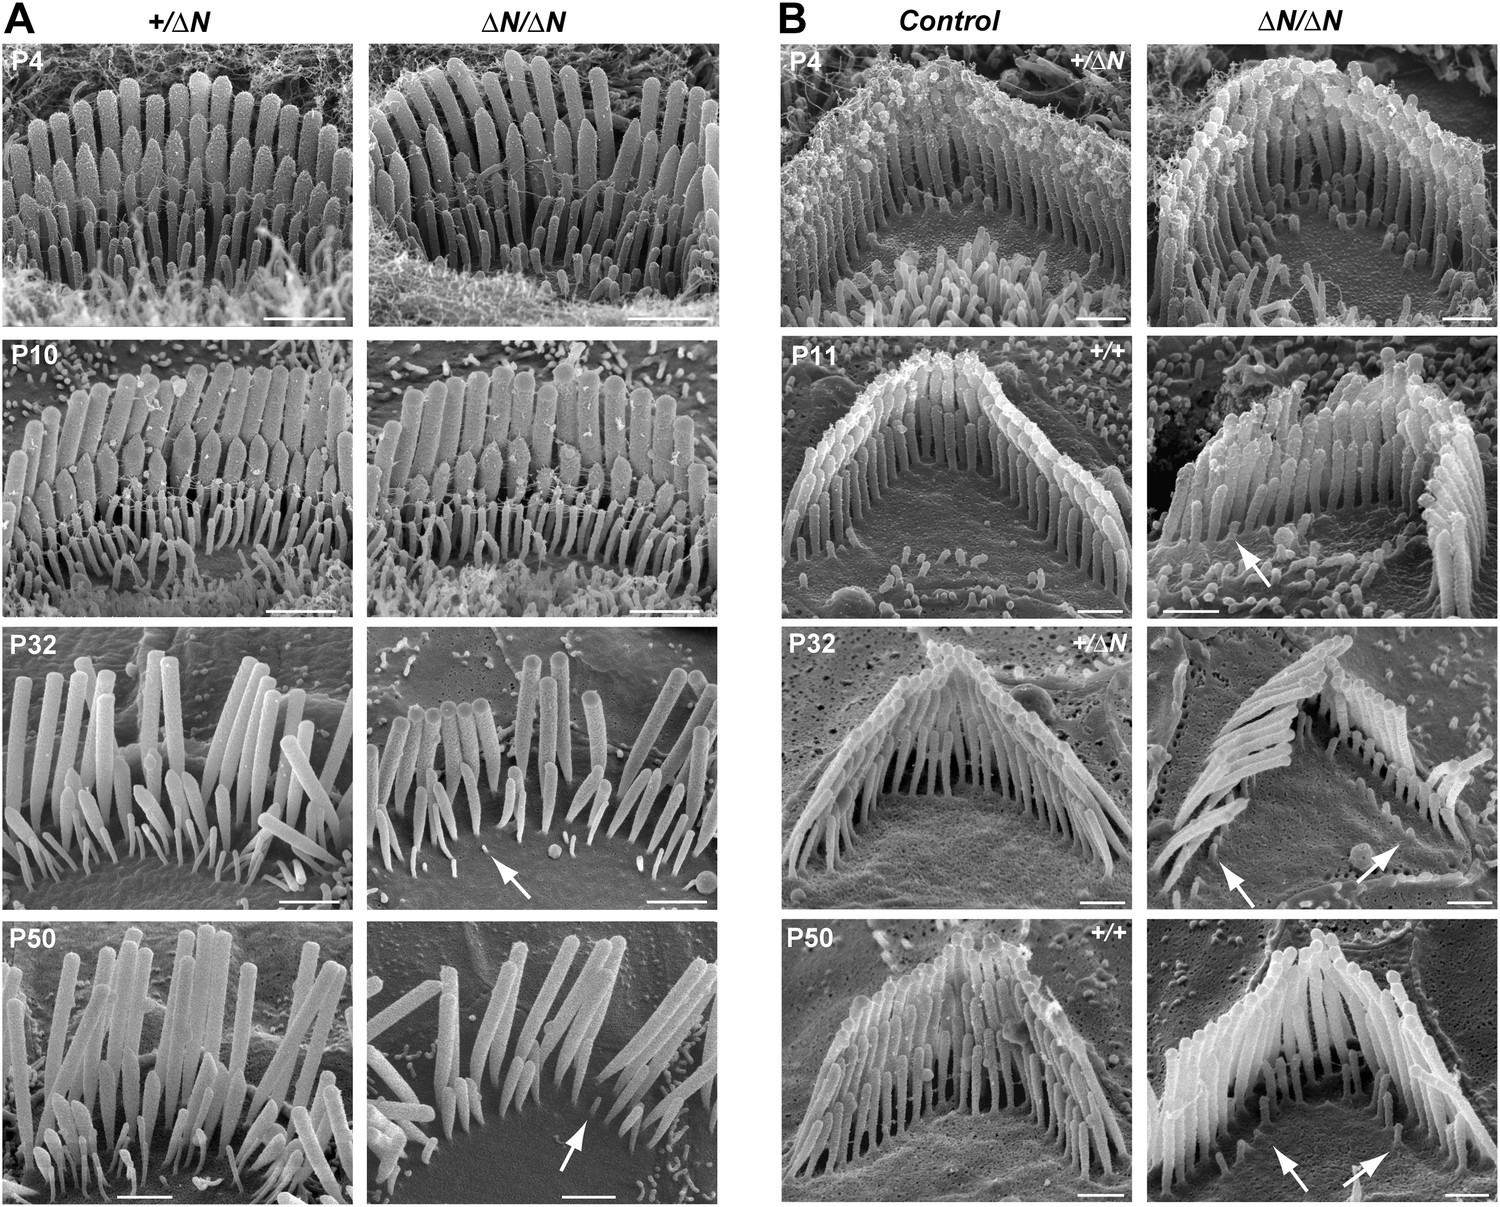
Degeneration of mechanotransducing shorter row stereocilia in isoform 1-null hair cells.
(A) SEM micrographs of IHC stereocilia bundles of normal Myo15+/ΔN (left) and Myo15ΔN/ΔN mutant (right) mice at different stages of postnatal development. Arrows point to examples of almost completely resorbed stereocilia. Note that the tallest stereocilia row does not thin, or shorten. (B) SEM micrographs of OHC stereocilia bundles show a similar degeneration pattern to IHCs. Shorter row stereocilia are retracted (arrows) but the tallest stereocilia row remains unaffected. All cells were located approximately at the middle of the cochlea. Scale bars are 1 µm (A) and 0.5 µm (B). See also Figure 6—figure supplement 1 and Table 1.
Figure 6—figure supplement 1
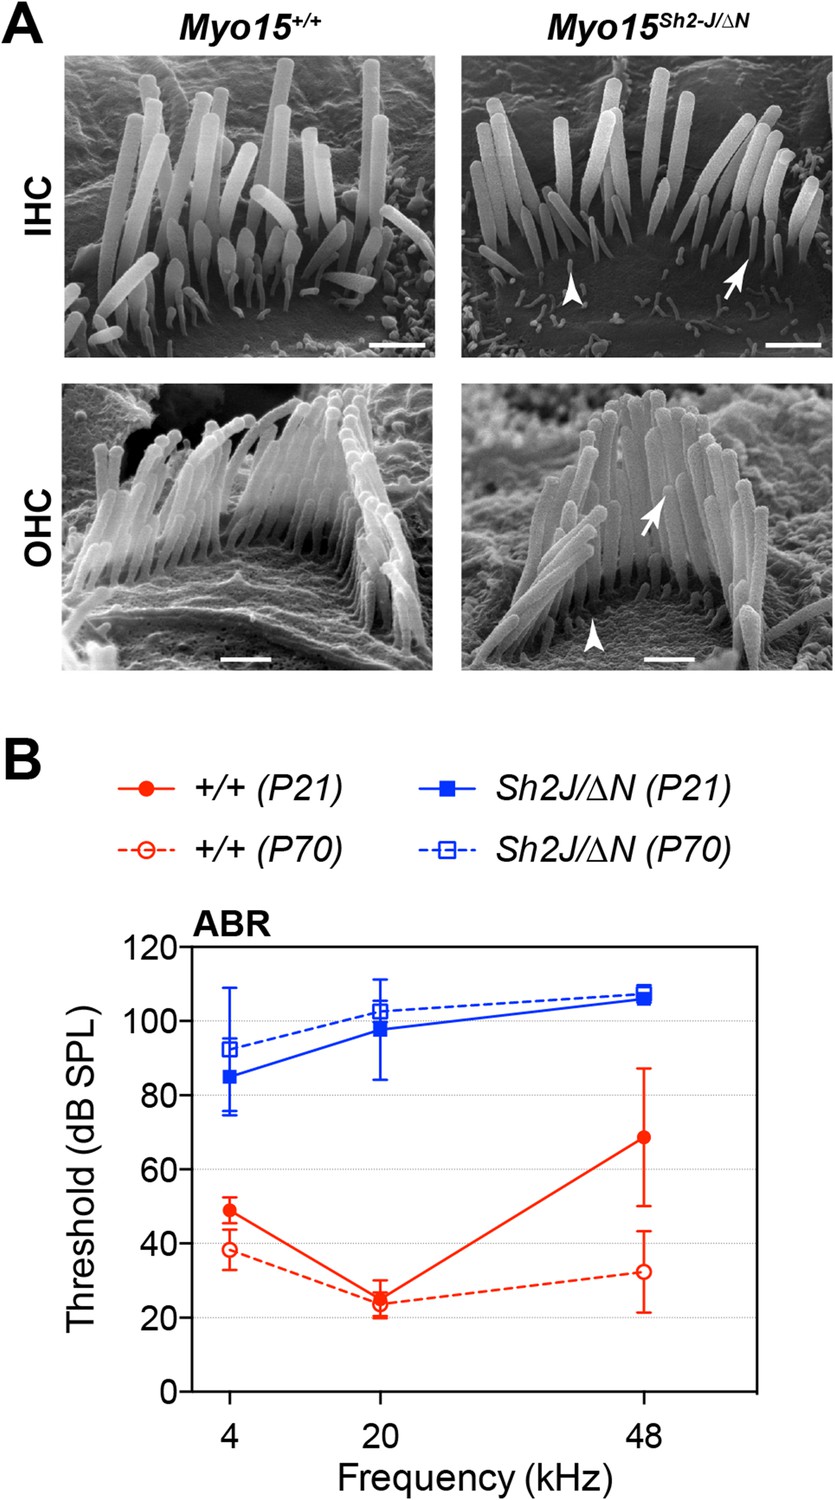
Myo15sh2-J does not complement Myo15ΔN.
(A) Scanning electron micrographs of stereocilia hair bundles from wild-type Myo15+/+ and Myo15sh2-J/ΔN compound heterozygotes at P28. The shorter stereocilia rows in compound heterozygotes undergo retraction (arrows) and resorption (arrowheads) similar to Myo15ΔN/ΔN hair cells (see Figure 6). Scale bars are 1 µm (IHCs) and 0.5 µm (OHCs). (B) ABR thresholds measured at 4, 20 and 48 kHz in Myo15+/+ and Myo15sh2-J/ΔN mice at P21 and P70. Compound heterozygotes have profound hearing impairment at both ages tested.
Figure 7 with 3 supplements
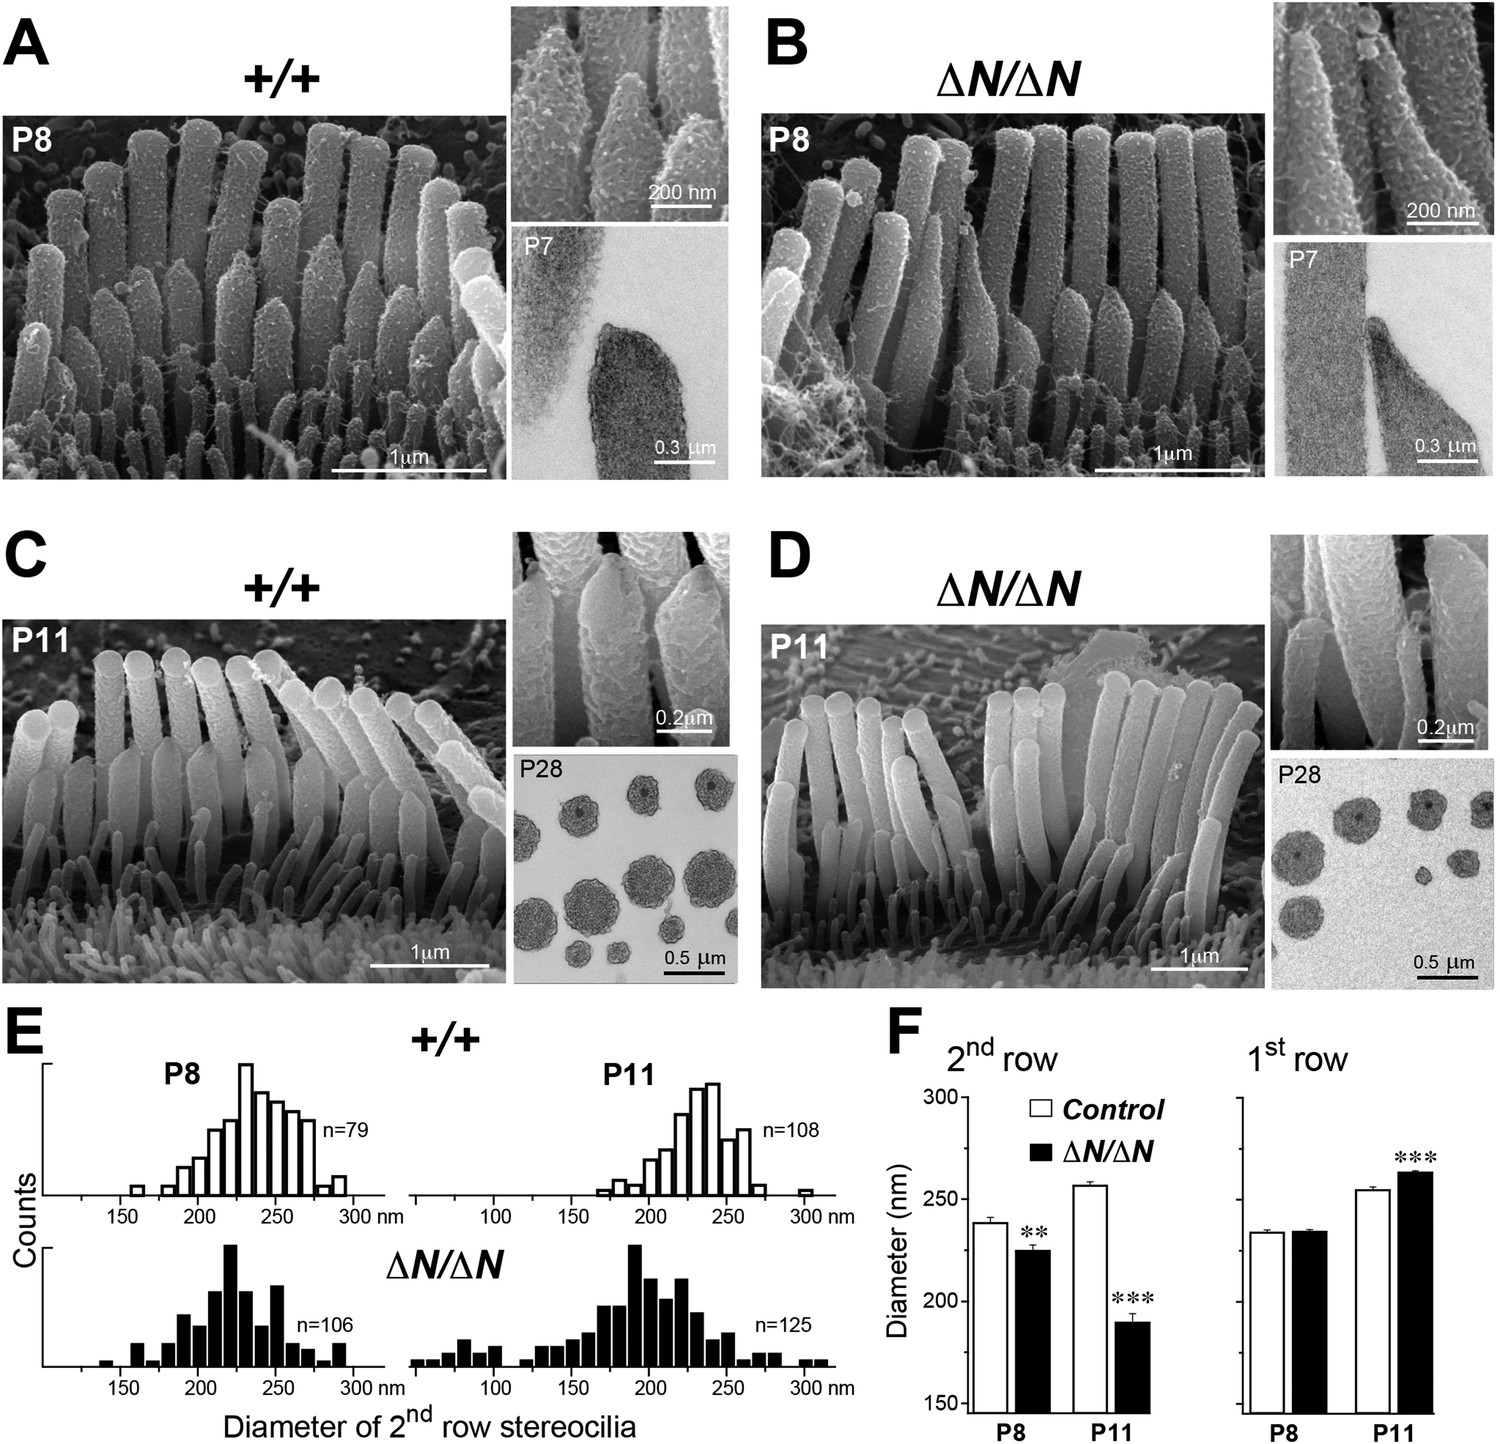
Isoform 1 maintains the diameter of mature mechanosensitive stereocilia and regulates the actin cytoskeleton at their tips.
(A–D) SEM images of stereocilia bundles from Myo15+/+ and Myo15ΔN/ΔN IHCs at P8 (A, B) and P11 (C, D). The inset (top right) is a higher magnification image of the second row stereocilia tips. The insets (lower right) are TEM images of either longitudinal (A, B) or axial (C, D) cross-sections of the stereocilia core. Note the electron-dense material at the tips of Myo15ΔN/ΔN stereocilia (B) and similar density of actin filaments in the thinning stereocilia of second row Myo15ΔN/ΔN IHCs (D). (E) Distribution of diameters of second row stereocilia in Myo15+/+ (upper histogram) and Myo15ΔN/ΔN (lower histogram) IHCs at P8 (left), and at P11 (right). The diameters were measured from SEM images and are likely underestimated by ∼30% due to the uniform tissue shrinkage during critical point drying. Number of IHCs: n = 9 (P8, Myo15+/ΔN), n = 9 (P8, Myo15ΔN/ΔN), n = 8 (P11, Myo15+/ΔN), n = 8 (P11, Myo15ΔN/ΔN). (F) Average diameter of stereocilia in the first and second rows of Myo15+/+ (white bars) and Myo15ΔN/ΔN (black bars) IHC bundles at P8 and P11 (data from panel E). Data are shown as mean ± SE. Asterisks indicate statistical significance: **, p < 0.001; ***, p < 0.0001 (t-test of independent variables).
Figure 7—figure supplement 1

Isoform 2 is necessary for tip density formation.
(A–D) TEM images of IHCs (A) and OHCs (B–D) stereocilia bundles in P7 Myo15ΔN/ΔN and control Myo15+/ΔN littermates. An electron-dense material (arrows) is present at the tips of stereocilia of all rows in both isoform 1-null Myo15ΔN/ΔN (A–C) and Myo15+/ΔN (D) littermates. (E–I) TEM images of OHCs (E, F, I) and IHCs (G, H) stereocilia bundles in P8 Myo15sh2/sh2 and P7 Myo15+/sh2 mice. The electron-dense material at the tips of stereocilia is absent from Myo15sh2/sh2 stereocilia that lack isoforms 1 and 2 (arrows), compared with Myo15+/sh2. Note: the smaller insertional tip density (arrowheads) can be still observed in P8 Myo15sh2/sh2 hair cells (F, H). Scale bars are 200 nm.
Figure 7—figure supplement 2
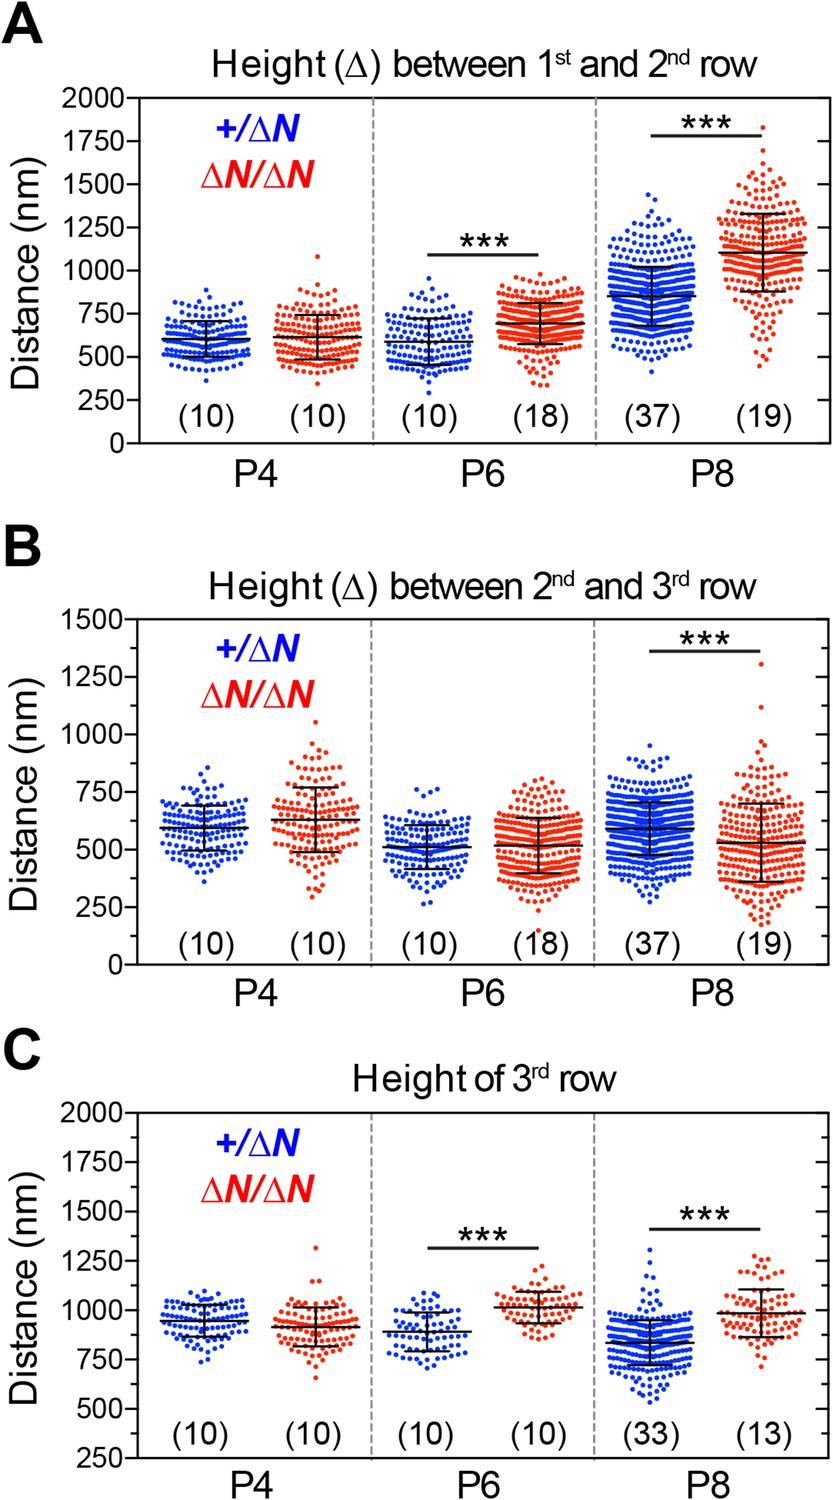
Analysis of stereocilia staircase architecture in Myo15ΔN/ΔN hair cells.
(A–C) Tip to tip measurements of IHC stereocilia heights from SEM preparations of mutant Myo15ΔN/ΔN and normal hearing Myo15+/ΔN littermates at P4, P6 and P8. (A) Distance from the tip of the tallest stereocilia (first) row to the tip of the corresponding second row stereocilium. (B) Distance from the tip of the second stereocilia row to the third row. (C) Height of third row stereocilia. Each data point corresponds to an individual stereocilium with mean ± SD overlaid (number of hair cells sampled is shown in brackets). Asterisks indicate statistical significance: ***, p < 0.0001 (ANOVA with Tukey's multiple comparisons test). SEM images were obtained from cultured samples used for MET recordings (see also Figure 5). The same images were analyzed in Figure 7—figure supplements 2, 3.
Figure 7—figure supplement 3
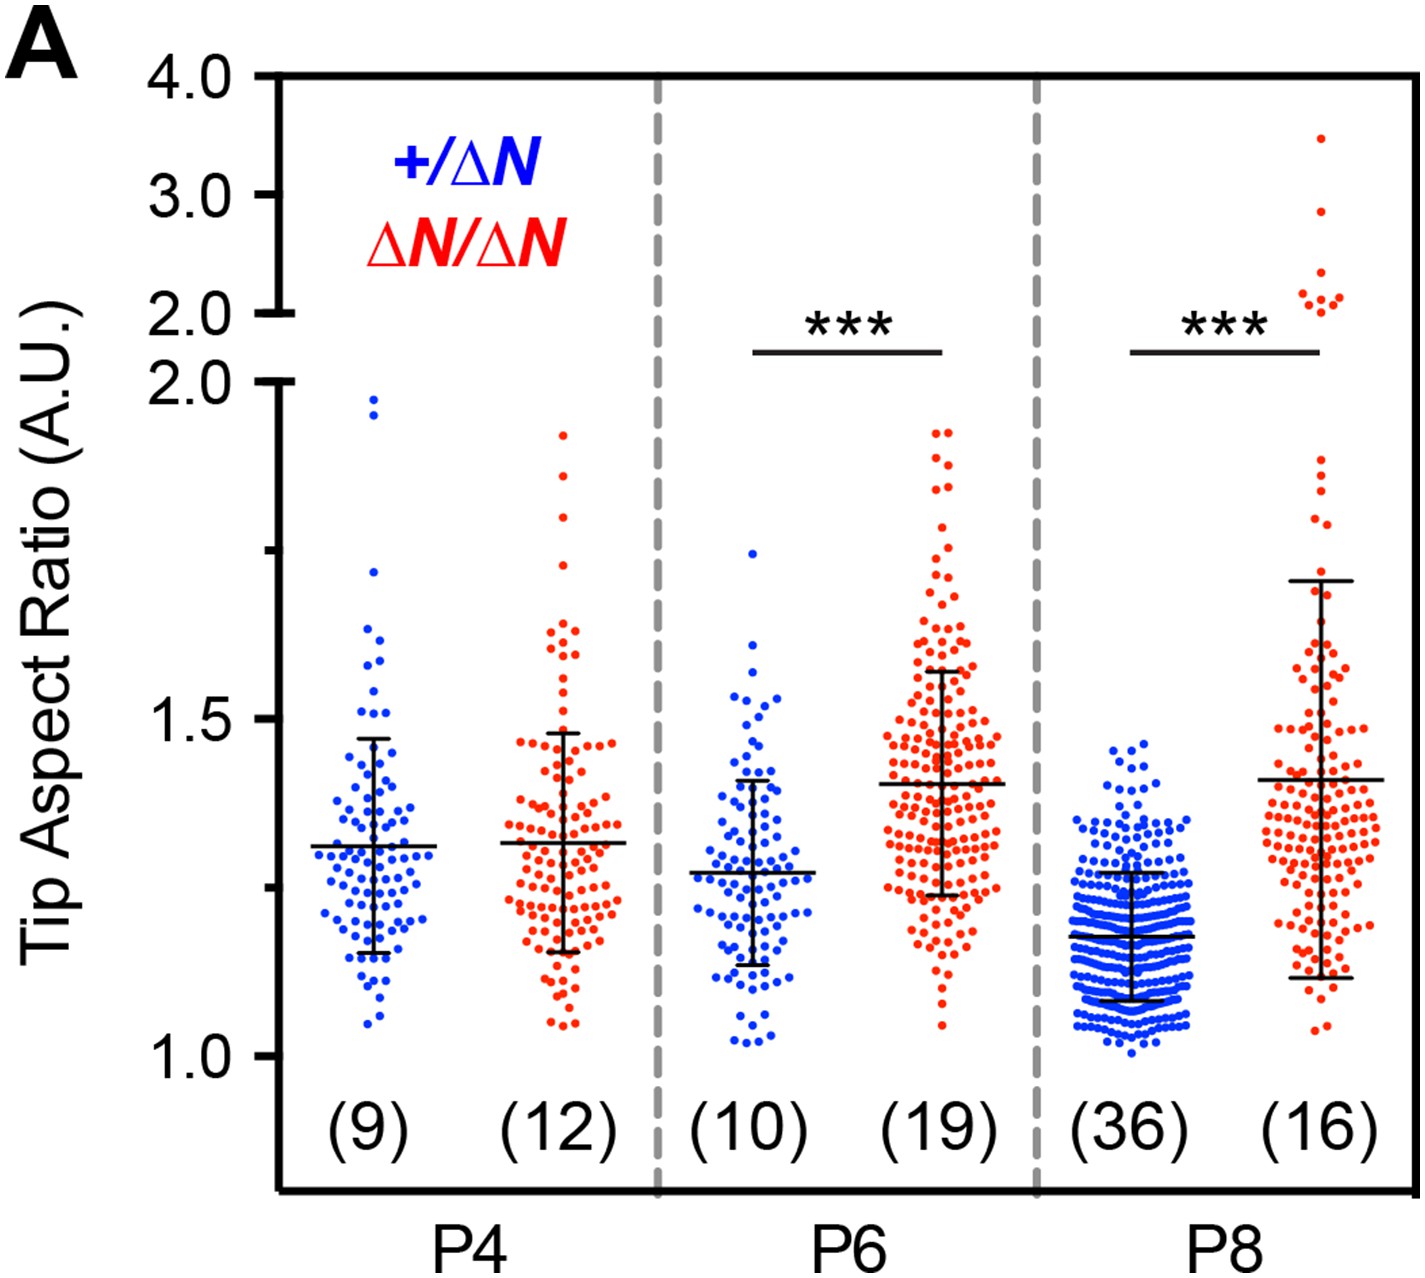
Analysis of stereocilia tip morphology in Myo15ΔN/ΔN hair cells.
(A) Quantification of stereocilia tip shape from SEM preparations of mutant Myo15ΔN/ΔN and Myo15+/ΔN IHCs at P4, P6 and P8. An ellipse was fitted to the tip of mechanotransducing stereocilia (second row) and used to calculate an aspect ratio (major axis divided by minor axis). An aspect ratio of 1 indicates a perfect circle, whilst aspect ratios >1 indicate elongation. Note the presence of aspect ratios >2 in mutant Myo15ΔN/ΔN hair cells at P8 (a split scale is used for the ordinate). Data points correspond to individual stereocilia with mean ± SD overlaid (number of hair cells sampled in brackets). Asterisks indicate statistical significance: ***, p < 0.0001 (ANOVA with Tukey's multiple comparisons test). SEM images were obtained from cultured samples used for MET recordings (see also Figure 5). The same images were analyzed in Figure 7—figure supplements 2, 3.
Author response image 1
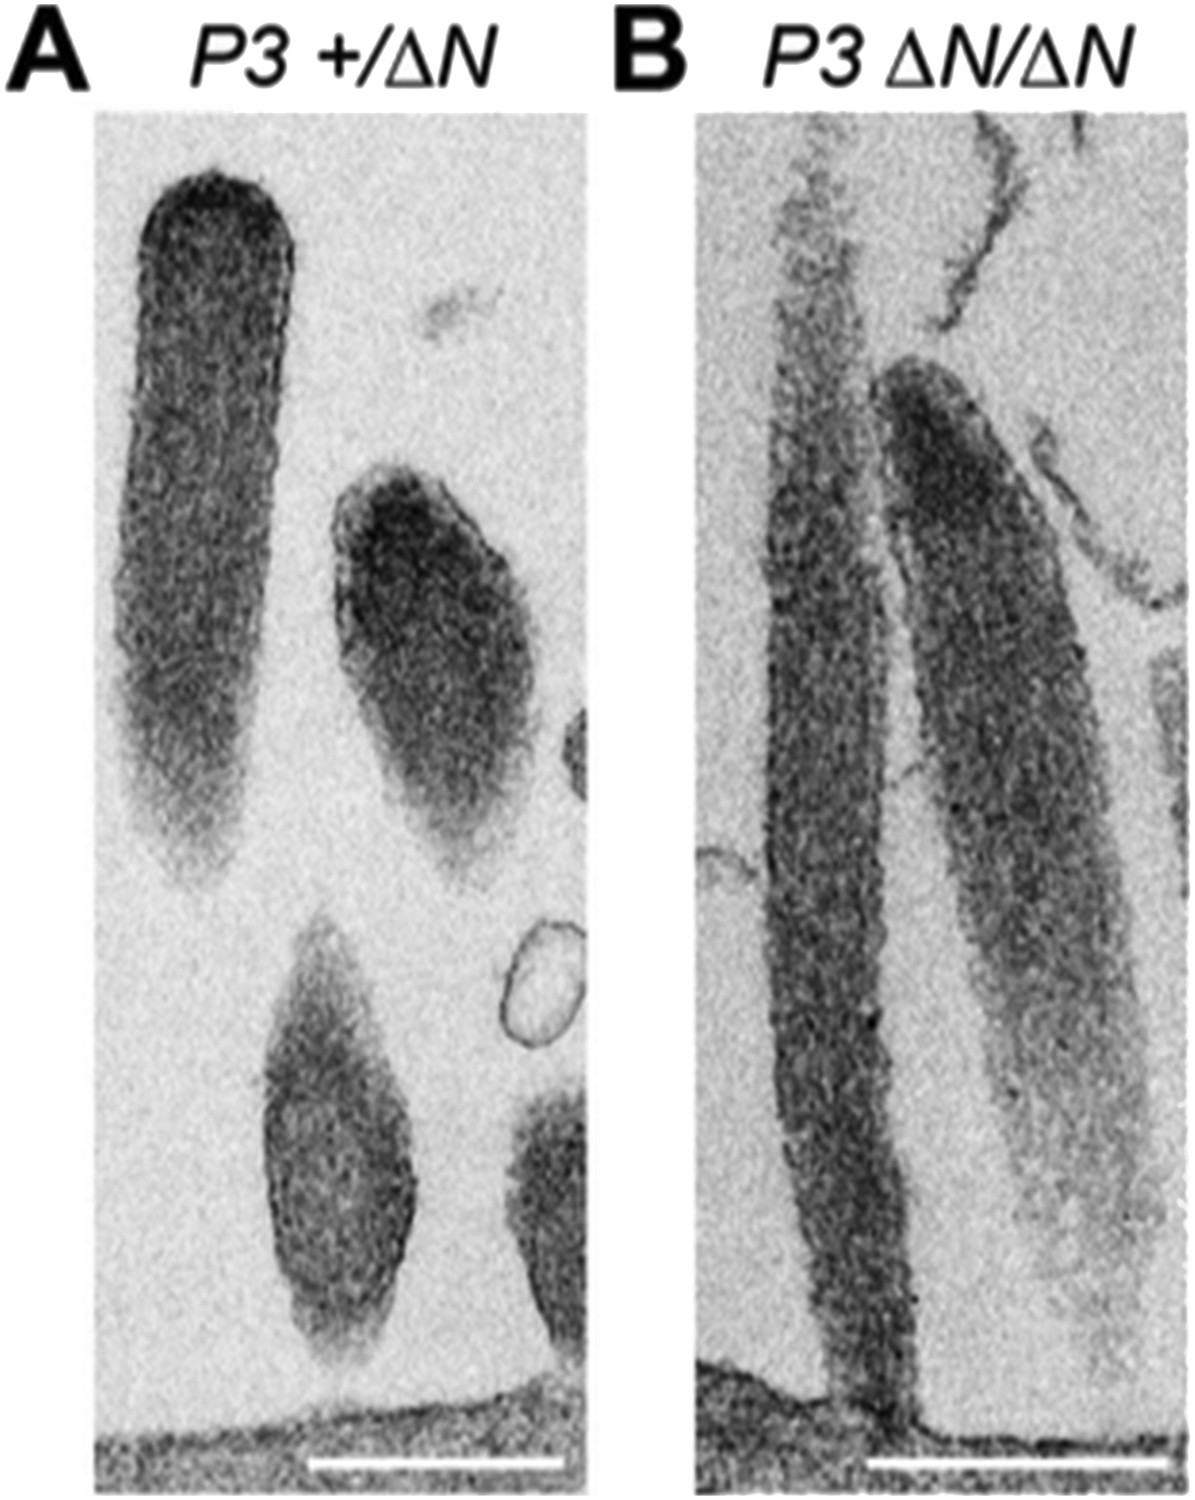
TEM images of ultrathin sections cut along the longitudinal stereocilia axis of Myo15+/ΔN (A) and Myo15ΔN/ΔN (B) inner hair cells at P3. Scale bars are 500 nm.
Author response image 2
PB888 labeling of isoform 1 in a striola hair cell from a P14 utricle. Phalloidin was used to stain the stereocilia actin core. PB888 is detected at the tips of all stereocilia rows. Scale bar is 5 µm.
Author response image 3
PB48 labeling (green) of myosin 15 in normal hearing (A) and isoform 1-null (B) IHCs at P14. In the isoform 1-null background, PB48 labeling is primarily restricted to the 1st (tallest) stereocilia row (B), compared to the normal-hearing control where both 1st and 2nd / 3rd rows are labeled (A). Rhodamine phalloidin is overlaid in red. Scale bar, 5 µm.
Tables
Table 1
Hair bundle phenotypes resulting from the combination of Myo15 alleles
| Myo15 genotype | Functional isoforms generated by: | |||
|---|---|---|---|---|
| Allele A | Allele B | Allele A | Allele B | Hair bundle phenotype |
| + | + | 1 and 2 | 1 and 2 | Normal |
| + | ∆N | 1 and 2 | 2 | Normal * |
| + | sh2 | 1 and 2 | - | Normal † |
| + | sh2-J | 1 and 2 | - | Normal ‡ |
| ∆N | ∆N | 2 | 2 | Normal staircase, short rows degenerate * |
| sh2-J | ∆N | - | 2 | Normal staircase, short rows degenerate * |
| sh2 | sh2 | - | - | Short staircase, additional stereocilia rows † |
| sh2-J | sh2-J | - | - | Short staircase, additional stereocilia rows ‡ |
| sh2 | sh2-J | - | - | Short staircase, additional stereocilia rows ‡ |
-
*
Data reported in this study.
-
†
-
‡
-
In wild-type hair cells both Myo15 alleles can independently generate mRNA and encode protein for isoforms 1 and 2. The Myo15sh2-J and Myo15sh2 alleles disrupt production of functional isoform 1 and isoform 2, whilst the Myo15∆N allele reported in this study disrupts isoform 1, but leaves isoform 2 functionally intact. Comparing different combinations of Myo15 alleles reveals a clear genotype–phenotype correlation. Mice deficient for both isoform 1 and 2 (Myo15sh2/sh2, Myo15sh2-J/sh2-J, Myo15sh2/sh2-J) have short hair bundles with additional stereocilia rows. In the presence of at least one Myo15 allele competent to generate isoform 2 (Myo15∆N/∆N, Myo15∆N/sh2-J), the stereocilia bundle develops the normal staircase architecture, but shorter stereocilia rows degenerate postnatally. At least one functional copy of isoform 1, in addition to isoform 2 is required for normal hair bundle development and its long-term maintenance.
Download links
A two-part list of links to download the article, or parts of the article, in various formats.
Downloads (link to download the article as PDF)
Open citations (links to open the citations from this article in various online reference manager services)
Cite this article (links to download the citations from this article in formats compatible with various reference manager tools)
The 133-kDa N-terminal domain enables myosin 15 to maintain mechanotransducing stereocilia and is essential for hearing
eLife 4:e08627.
https://doi.org/10.7554/eLife.08627


