NOCA-1 functions with γ-tubulin and in parallel to Patronin to assemble non-centrosomal microtubule arrays in C. elegans
- University of California, San Diego, United States
- Université de Strasbourg, France
- Institut Clinique de la Souris, France
Figures
Figure 1 with 5 supplements
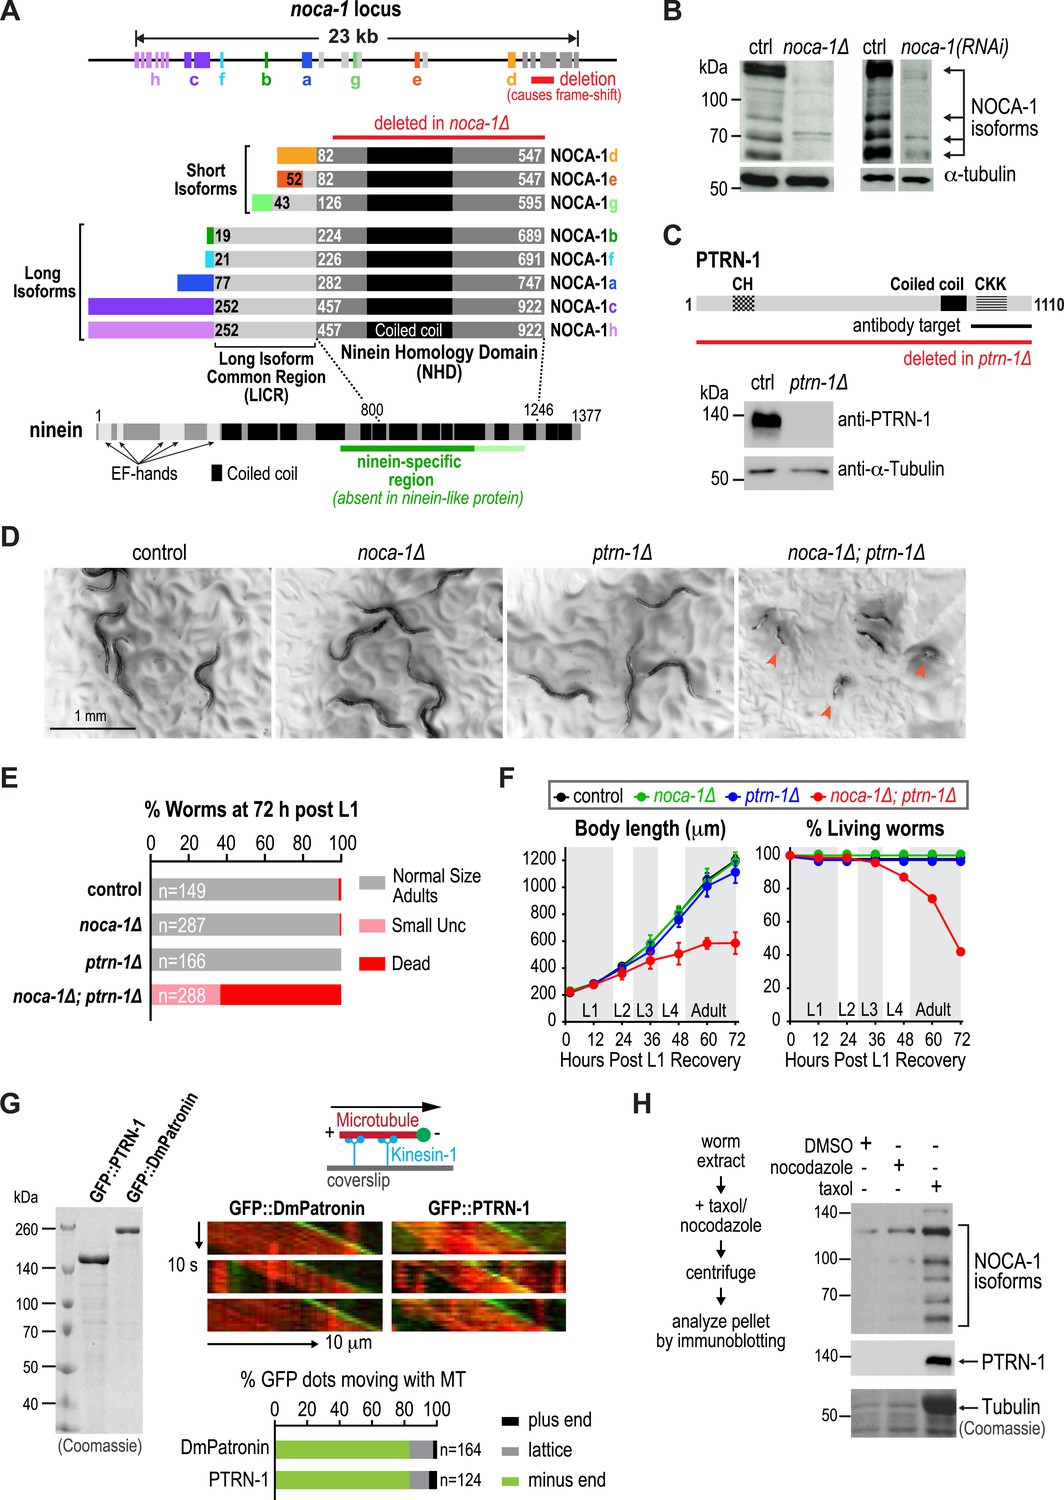
NOCA-1 is a protein with homology to vertebrate ninein that functions redundantly with PTRN-1/Patronin to promote larval development and viability.
(A) Schematics of the noca-1 locus, encoded NOCA-1 isoforms, and a short human ninein isoform showing the region with homology to NOCA-1 (alignment in Figure 1—figure supplement 1A). The region of ninein absent from (dark green) or with low homology to (light green) ninein-like protein is underlined. Red line above the NOCA-1 isoforms shows the region deleted in the ok3692 allele. (B) Immunoblot of NOCA-1 in lysates from control, noca-1∆, and noca-1(RNAi) worms. (C) Top: schematic of the Caenorhabditis elegans Patronin homolog, PTRN-1. Bottom: immunoblot of PTRN-1 in lysates from control and ptrn-1∆ worms. (D) Images of control and mutant worms 72 hr post L1 recovery (snapshots from Video 1). Arrowheads mark dead worms. (E) Plot of percentage of normal-sized adults, small uncs, and dead worms 72 hr post L1 for the indicated genotypes. n is number of worms analyzed in 3–5 independent experiments. (F) Plots of body length (left) and % living worms (right) vs time for worms with the indicated genotypes. (G) Left: Coomassie blue staining of recombinant proteins purified from baculovirus-infected insect cells. Right top: schematic of flow-cell-based kinesin gliding assay. Right center: kymographs showing microtubule gliding in the presence of indicated GFP-tagged proteins. Right bottom: plot of frequencies of plus end, minus end, or side binding. (H) Left: flow chart of microtubule co-sedimentation experiment. Right: immunoblots probing for NOCA-1 or PTRN-1 (top and center) and Coomassie blue staining showing tubulin (bottom) after sedimentation. Markers are in kDa. Coiled-coil predictions were performed using Paircoil2 (28 aa window, 0.025 threshold). Error bars are SEM.
Figure 1—figure supplement 1
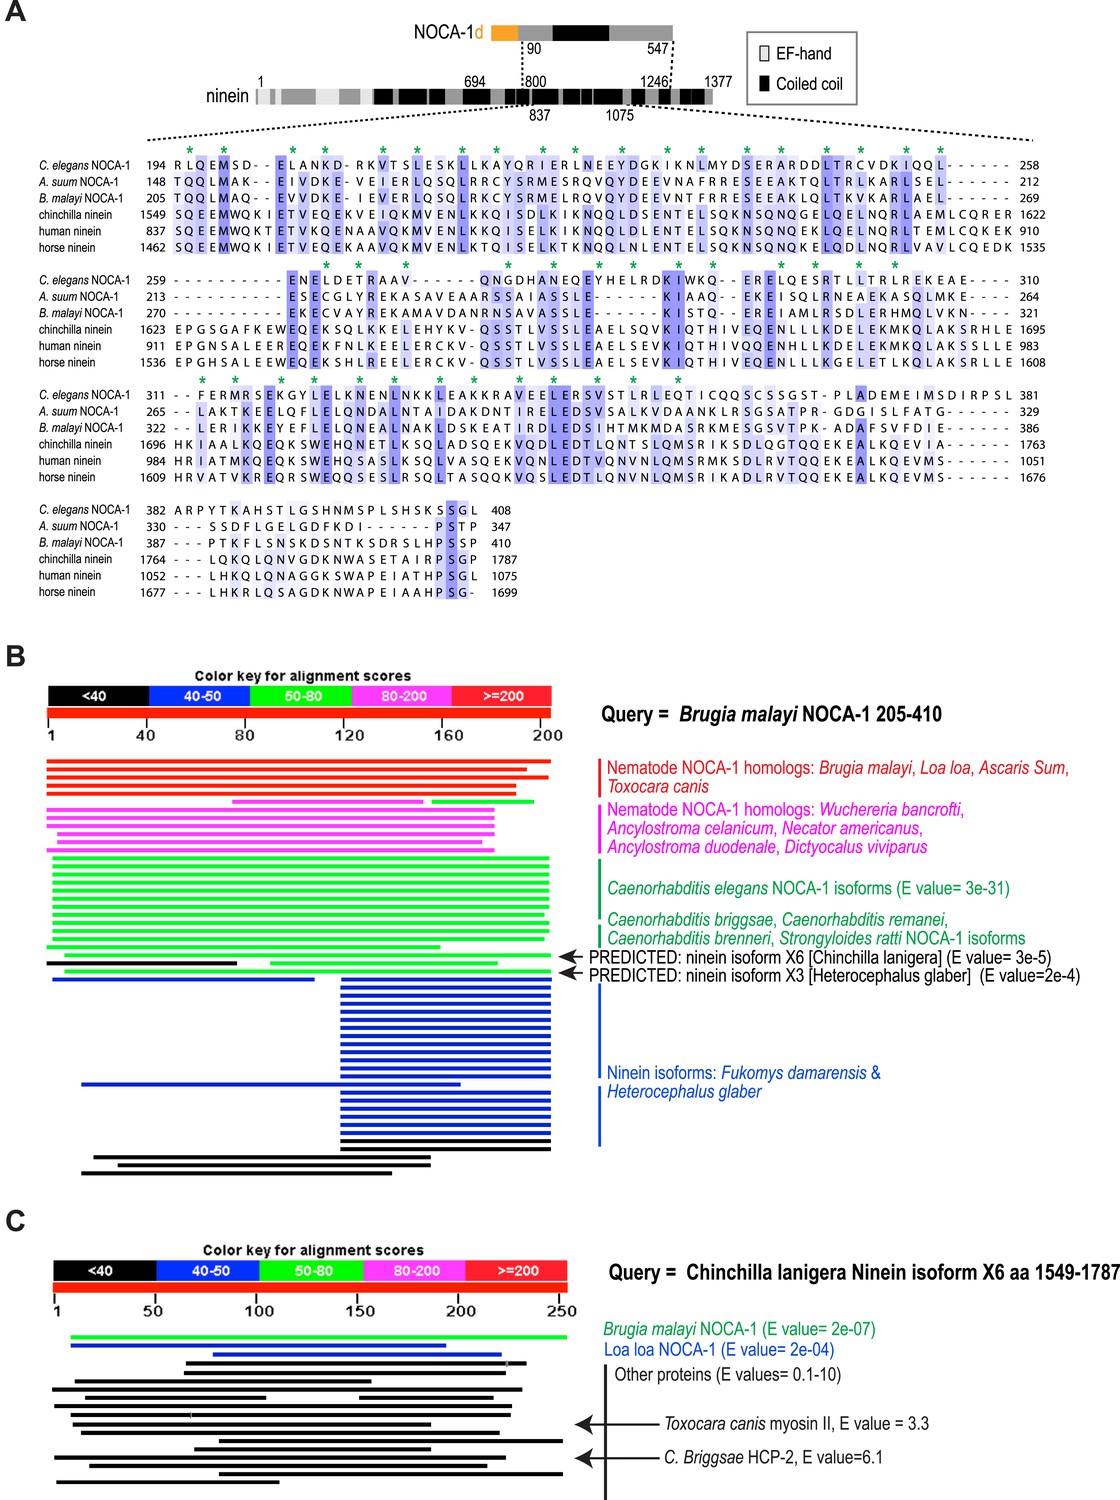
NOCA-1 has homology to vertebrate ninein.
(A) Alignment of nematode NOCA-1 homologs with vertebrate nineins. Mafft WS sequence alignment of the indicated regions from nematode NOCA-1s (C. elegans, GI 32567236; Ascaris suum, GI 541046681; Brugia malayi, GI 671417611) and vertebrate nineins (Chinchilla lanigera isoform 6, GI 533123118; Homo sapiens isoform X4, GI 530403936; Equus prezewalskii isoform X4, GI 664719818). Color-coding is based on the BLOSUM62 matrix. Green asterisks mark the a and d positions of a predicted coiled coil (Paircoil2) in the C. elegans sequence. (B) The homology between nematode NOCA-1 homologs and vertebrate nineins was discovered in an NCBI BLAST using the conserved region of NOCA-1 from B. malayi as the query. This is one of the best ways to identify non-nematode homologs of C. elegans proteins, since Brugia sequences tend to be among the least divergent for nematode species. The BLAST using the Brugia sequence identified all of the nematode NOCA-1 homologs (red, pink, and green text), along with the C. lanigera, Heterocephalus glaber, and Fukomys damrensis nineins (black and blue text). (C) Reverse BLAST of aa 1549–1801 of C. lanigera ninein isoform X4 against all nematode sequences yielded B. malayi NOCA-1 as the top hit (E value = 2e−07) and Loa loa NOCA-1 as the second hit (E value = 2e−04). Other coiled-coil proteins were also detected, but with substantially less significant E values (i.e., Toxocara canis myosin II, E value = 3.3; C. Briggsae HCP-2, E value = 6.1).
Figure 1—figure supplement 2

Expanded view of the immunoblot for NOCA-1 in lysates from control and noca-1(RNAi) worms shown in the right panel of Figure 1B.
Black arrows, NOCA-1 isoforms. Markers are in kDa.
Figure 1—figure supplement 3

Construction of a deletion allele for the gene encoding C. elegans Patronin, PTRN-1.
Schematic showing the strategy used to generate a null ptrn-1 deletion allele. Briefly, a double-stranded break was generated by injecting a plasmid-expressing Mos1 transposase into a strain with a Mos1 transposon insertion in a ptrn-1 intron (ttTi21011). A repairing plasmid was co-injected with the transposase to induce homology-based repair that resulted in deletion of the majority of ptrn-1 coding sequence, including the transcription start site.
Figure 1—figure supplement 4
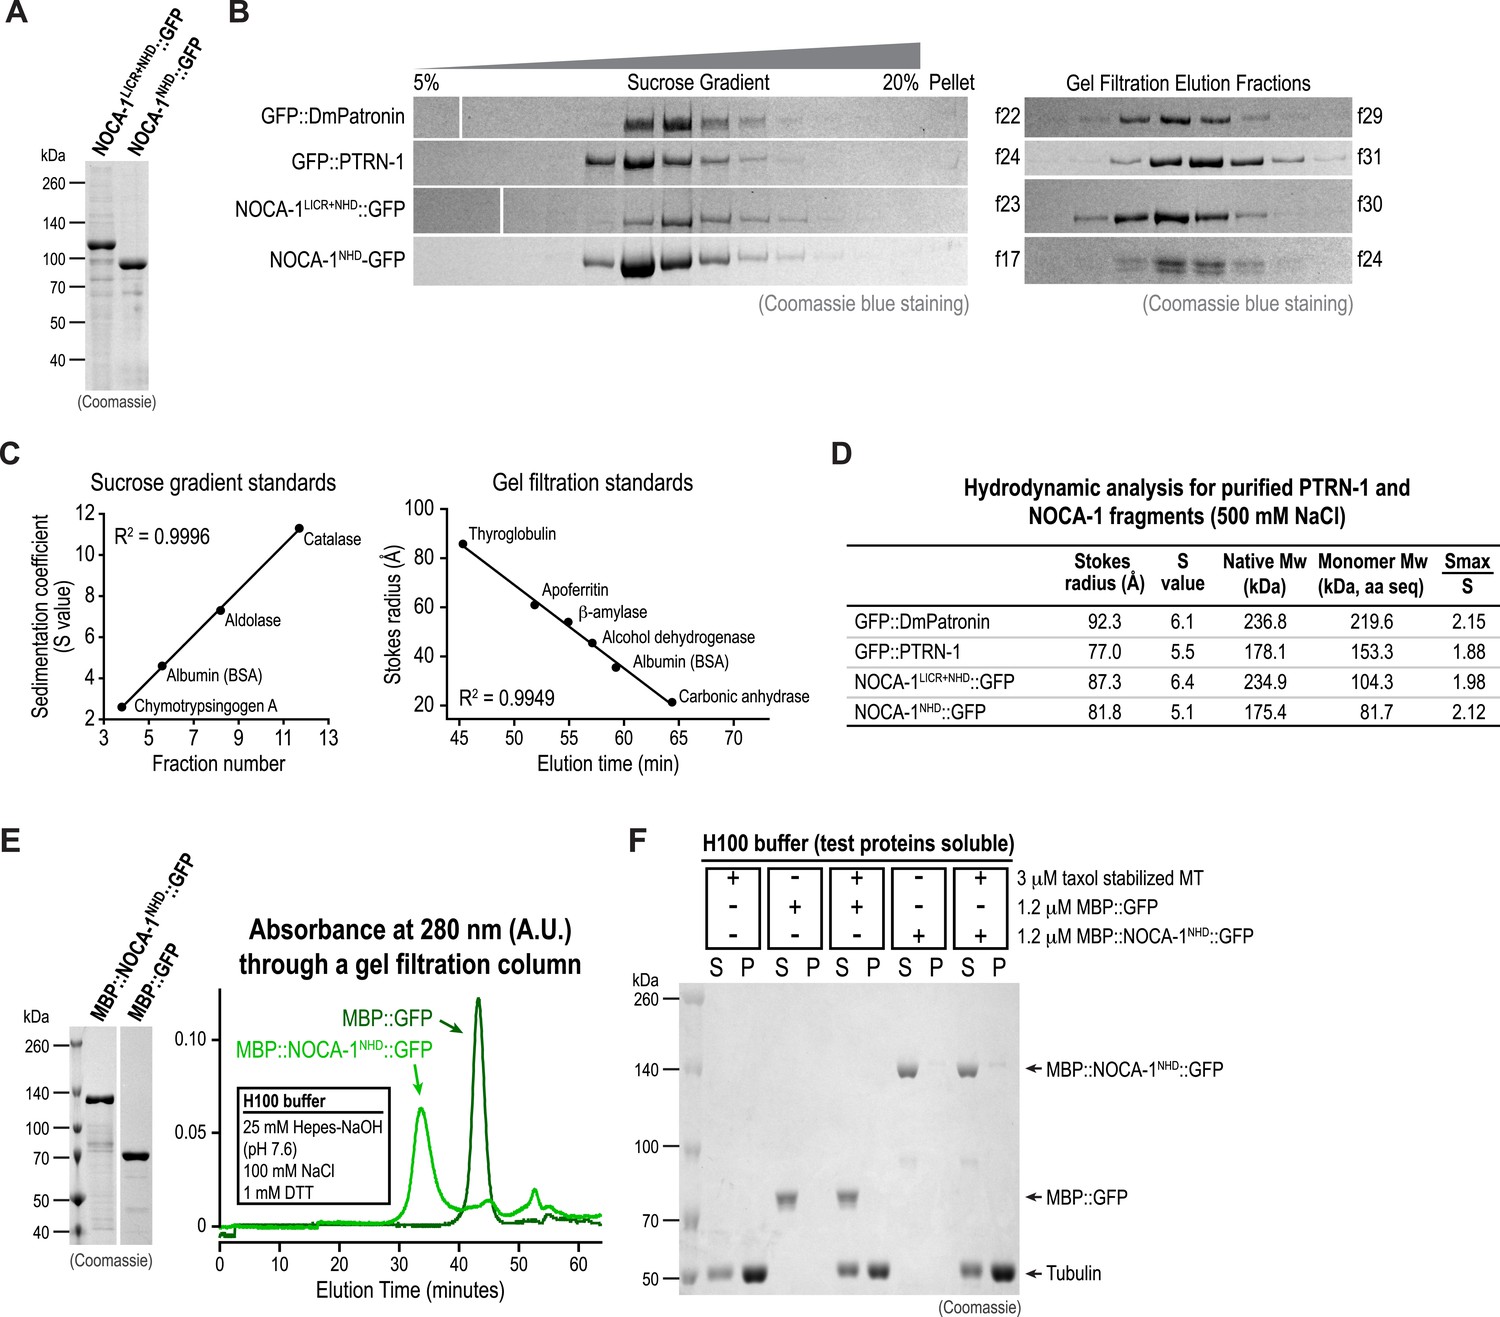
Hydrodynamic analysis of purified NOCA-1 and PTRN-1 proteins.
(A) Coomassie blue stained gel of recombinant NOCA-1 proteins purified from baculovirus-infected insect cells. (B) Coomassie blue stained gels of purified GFP fusions with DmPatronin, PTRN-1, NOCA-1LICR+NHD, and NOCA-1NHD subjected to sucrose gradient sedimentation (left) or gel filtration (right). (C) Plots of fraction number vs sedimentation coefficient (left) or elution time vs Stokes radius (right) for the standards used to estimate the S value and Stokes radius of the test proteins. R2 is the coefficient of determination for linear regression. (D) The sedimentation coefficient (S) and Stokes radius (Rs) for each test protein were estimated using the standard curves in (B), and the molecular weight was calculated by Mw = 4205 × S × Rs (Siegel and Monty, 1966). The ‘Monomer Mw’ was calculated from the amino acid sequence of each protein. The Smax is the S value assuming the protein is a smooth sphere, calculated by Smax = 0.00361 × M2/3. The ratio Smax/S for all test proteins are ∼2.0, indicating these proteins are moderately elongated in solution (Erickson, 2009). (E) Left: Coomassie blue-stained gel of recombinant MBP fusions purified from baculovirus-infected insect cells. Right: elution profiles of purified proteins on a Superose 6 size-exclusion column in H100 buffer (25 mM Hepes-NaOH pH 7.6, 100 mM NaCl and 1 mM DTT). (F) Coomassie blue-stained gel of supernatant (S) or pellet (P) samples from a microtubule co-sedimentation assay performed in H100 buffer.
Figure 1—figure supplement 5
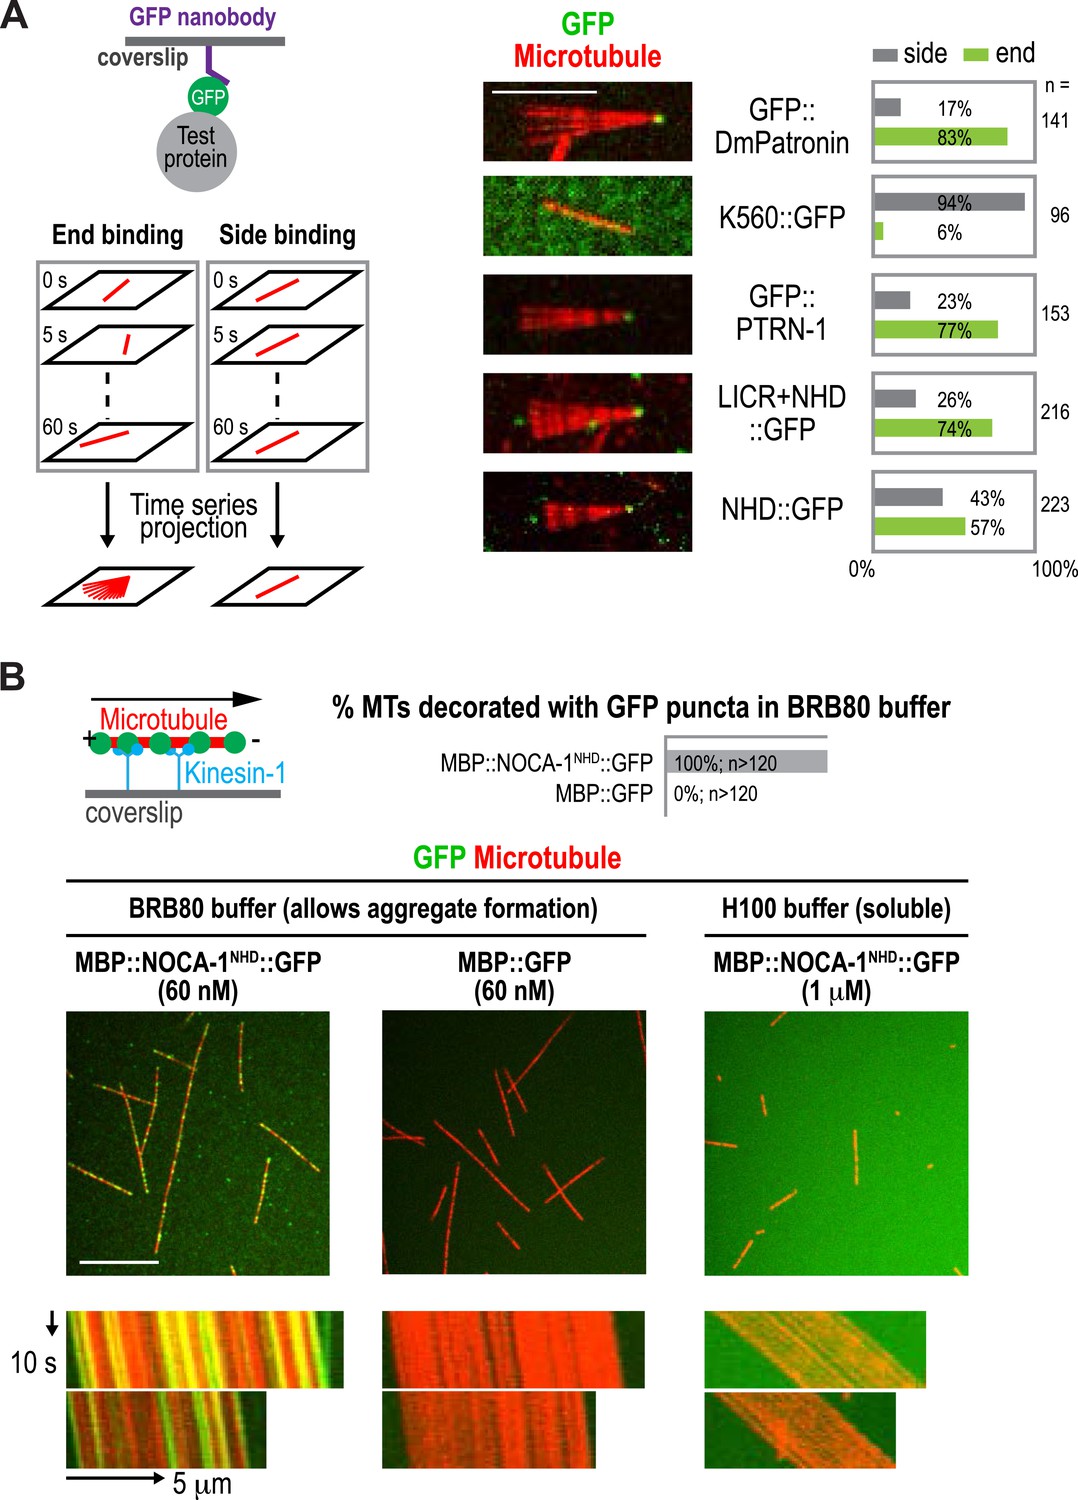
Purified NOCA-1 binds to microtubules in aggregated forms.
(A) Left: schematic of flow-cell based microtubule anchoring assay. Middle: maximum intensity projections of time lapse fluorescence confocal images of microtubules bound by the indicated proteins. Right: plots of frequencies of microtubule side and end binding. (B) Top: schematic of the kinesin gliding assay (left) and the plot of frequency of microtubules (MTs) decorated with GFP puncta. Center: fluorescence confocal images of the coverslip surface of flow cells containing rhodamine-labeled microtubules (red) and 60 nM GFP-fused test proteins (green). BRB80 buffer: 80 mM Pipes-KOH pH 6.8, 1 mM MgCl2, and 1 mM EGTA. Bottom: kymographs showing microtubule gliding in the presence of indicated GFP tagged proteins. Scale bars, 10 μm or as indicated.
Figure 2 with 6 supplements
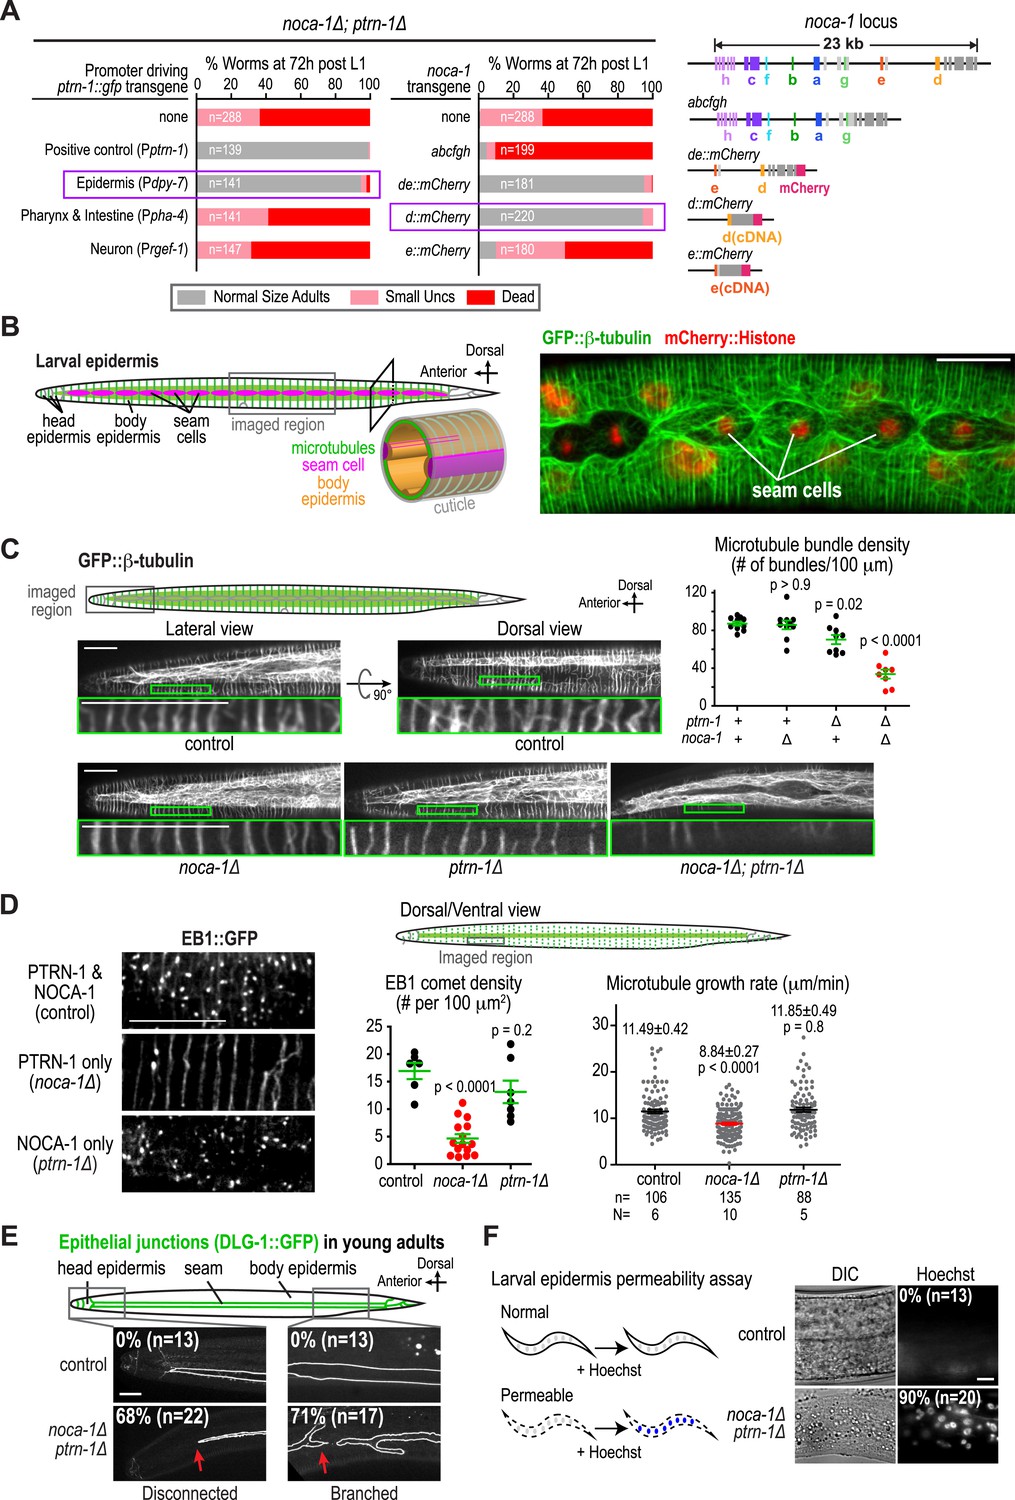
NOCA-1 and PTRN-1 control assembly of a circumferential microtubule array required for the integrity of the larval/adult epidermis.
(A) Left: plots of the percentage of normal-sized adults, small uncs, and dead worms 72 hr post L1 for noca-1∆; ptrn-1∆ worms-expressing PTRN-1::GFP under the control of the indicated promoters or with noca-1 transgenes directing expression of the indicated isoforms from their own promoters. n is number of worms analyzed in 3–5 independent experiments. Right: schematics of noca-1 transgenes. Note that the data for noca-1∆; ptrn-1∆ worms in both plots are the same as in Figure 1E. (B) Left: schematics illustrating the organization of the larval epidermis. The body epidermis (gold in 3D view) is a large, thin multinucleated syncytial cell that covers the majority of the worm's body; rows of seam cells (pink) are embedded within the body epidermis in rows that run along either side of the worm. Right: maximum intensity projection of fluorescence confocal image of GFP::β-tubulin and mCherry::Histone in the larval epidermis of an L3 stage worm (n = 20). (C) Schematic and fluorescence confocal images of L3 stage worms of the indicated genotypes expressing GFP::β-tubulin. Right: plot of microtubule bundle density in worms of the indicated genotypes. (D) Left: fluorescence confocal images of L3 stage worms expressing EB1::GFP. Right top: schematic of the imaged region. Right bottom: plots of EB1 comet density and microtubule growth rate in worms of the indicated genotypes. (E) Top: schematic of early adult worm expressing DLG-1::GFP, which marks the junctions between the body epidermis and the seam cell syncytia. Bottom: fluorescence confocal images of control and noca-1∆; ptrn-1∆ worms expressing DLG-1::GFP. (F) Left: schematic of the permeability assay. Right: DIC and fluorescence images of worms after treatment with Hoechst. Statistics, one-way ANOVA followed by Dunnett's multiple comparisons test. p-values are the probability of obtaining the observed results assuming the test group is the same as control. Error bars are SEM. Scale bars, 10 µm.
Figure 2—figure supplement 1
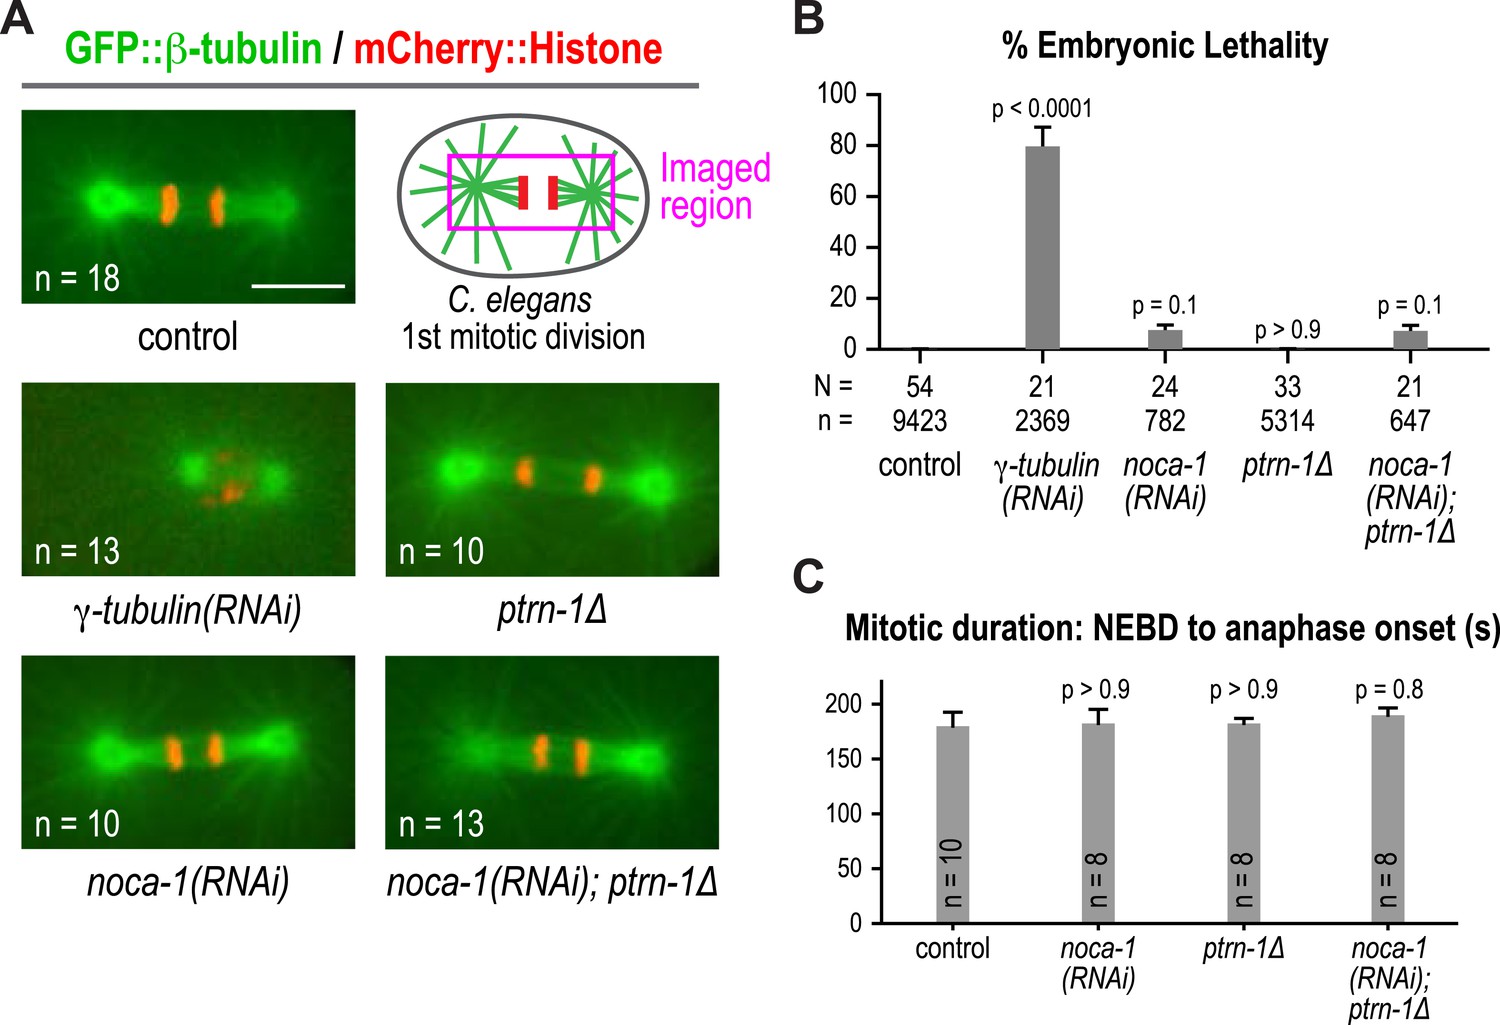
Both NOCA-1 and PTRN-1 are dispensable for mitotic divisions.
(A) Schematic and fluorescence confocal images of the spindle at early anaphase of the first mitotic division in C. elegans embryos from the indicated genotypes. (B) Plot of percent embryonic lethality for hermaphrodites with indicated perturbations. N = number of worms, n = number of embryos. The low level lethality observed for noca-1(RNAi) embryos is likely a secondary consequence of the effect of NOCA-1 depletion on germline structure. (C) Plot of the duration of the first C. elegans embryonic division for the indicated perturbations. NEBD, nuclear envelope break-down. n is the number of scored embryos. Statistics, one-way ANOVA followed by Dunnett's multiple comparisons test. p-values indicate the probability of obtaining the observed or more extreme results assuming the test group is the same as control. Error bars are SEM. Scare bar, 10 μm.
Figure 2—figure supplement 2
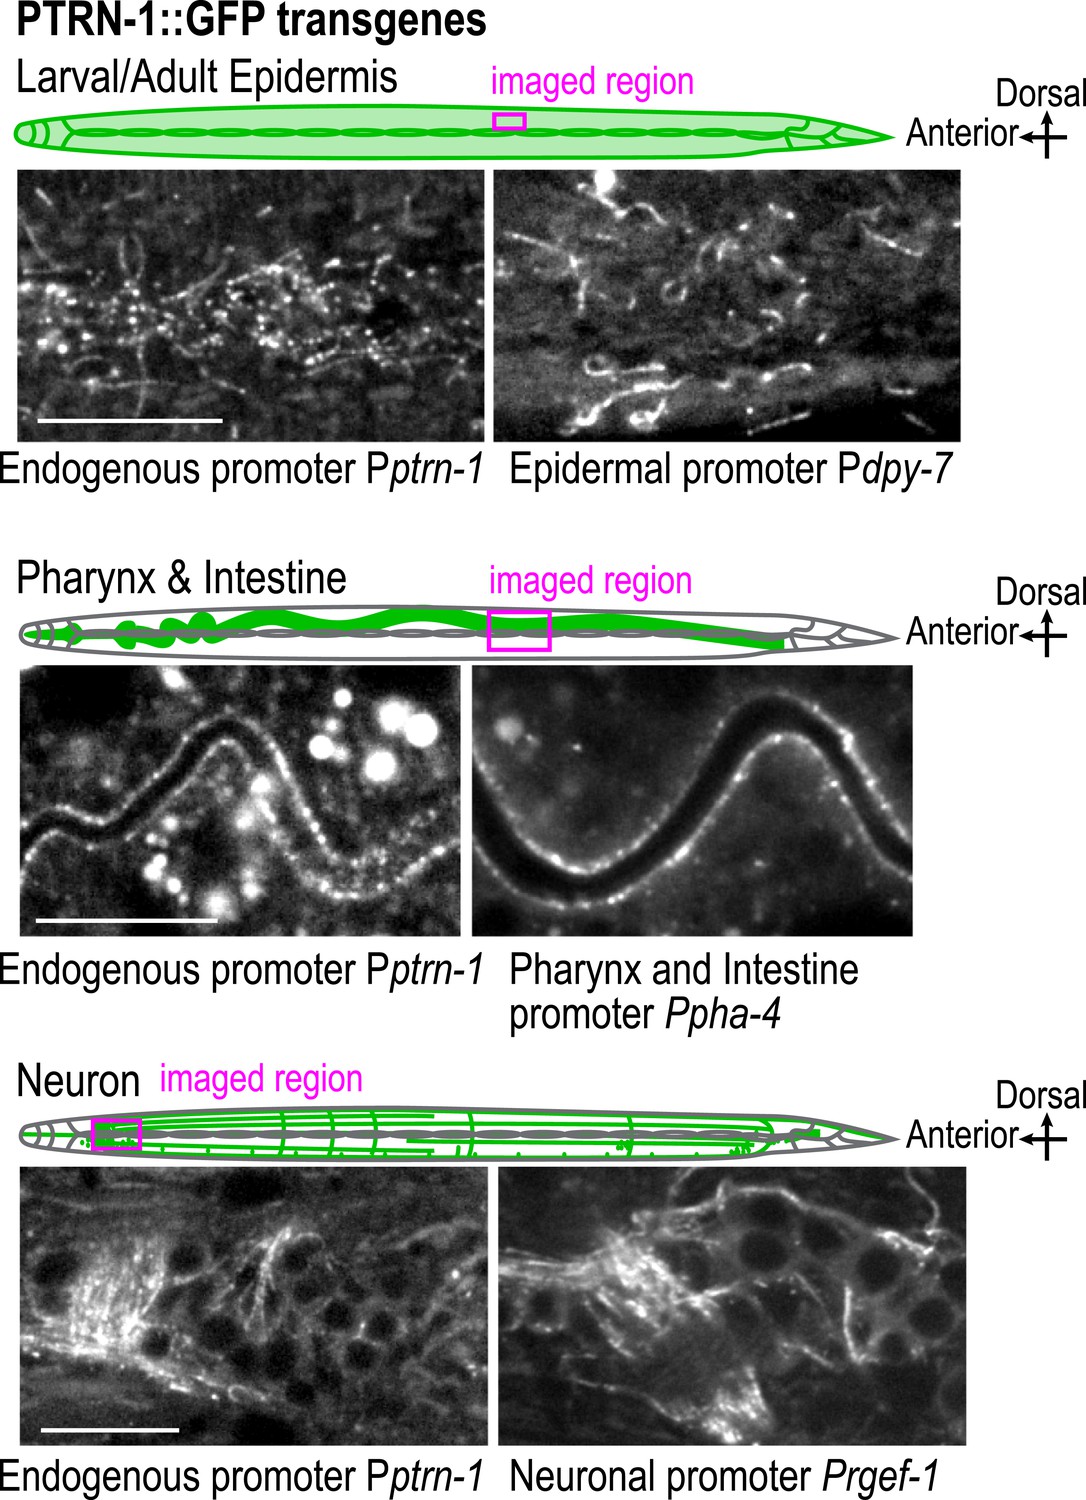
Expression of PTRN-1::GFP in multiple tissues.
Schematic and fluorescence confocal images of PTRN-1::GFP expressed from transgenes under the control of the endogenous ptrn-1 promoter (left panels, Pptrn-1, n = 9) or promoters specific for the larval/adult epidermis (Pdpy-7; n = 7), the pharynx and intestine (Ppha-4; n = 20) or neurons (Prgef-1; n = 7). Scale bar, 10 μm.
Figure 2—figure supplement 3
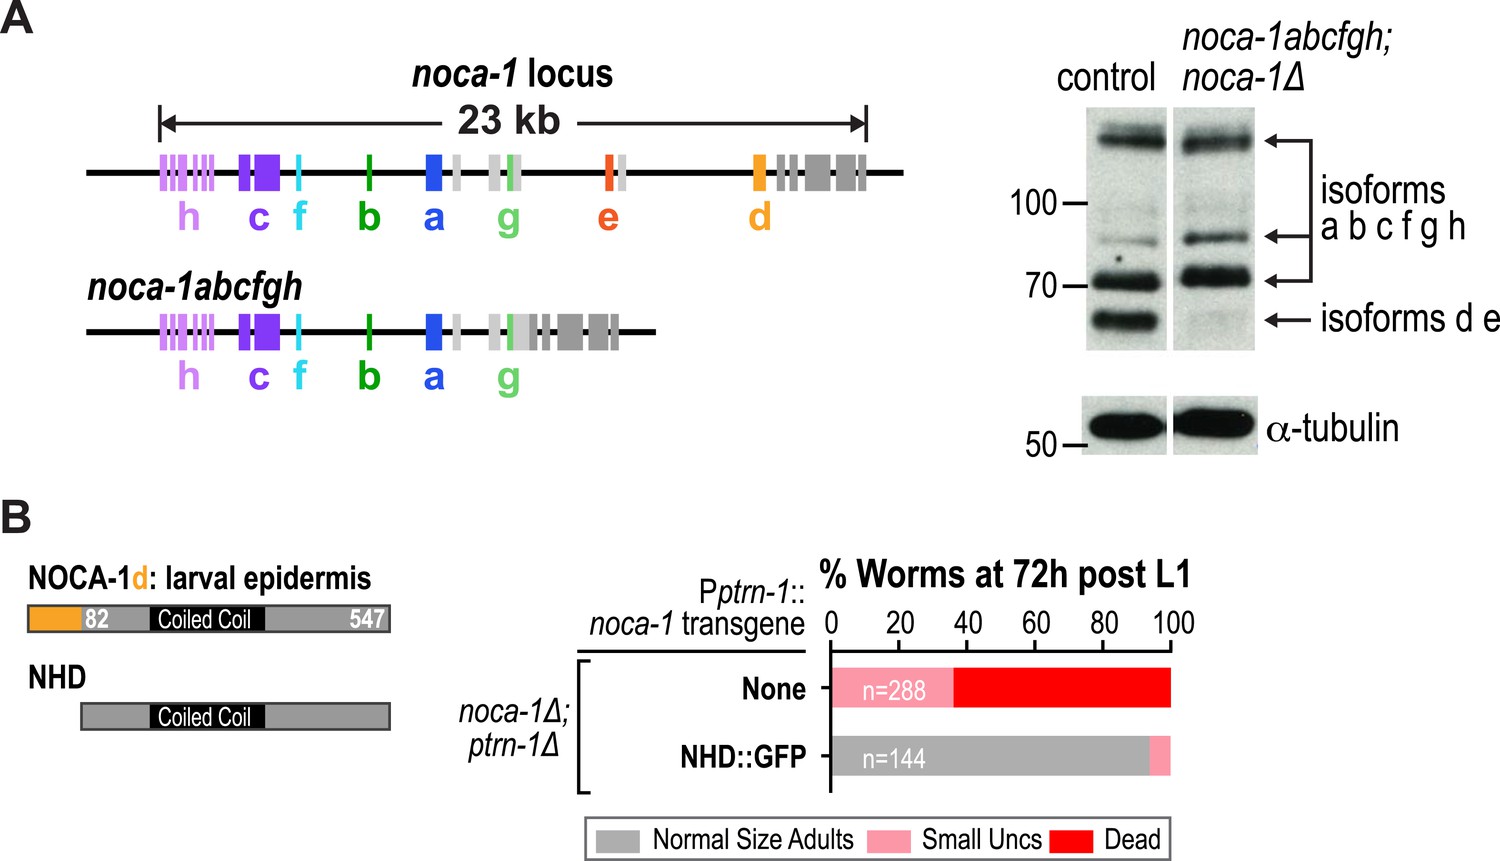
NOCA-1 immunoblot in lysate from noca-1Δ worms expressing noca-1abcfgh and the NOCA-1d isoform-specific region is dispensable for its function in the larval epidermis.
(A) Left: schematics of the noca-1 locus and noca-1abcfgh transgene. Right: immunoblot of NOCA-1 in lysates from control worms and noca-1Δ worms expressing noca-1abcfgh. Markers are in kDa. (B) Left: schematic illustrating the analyzed truncation. Right: plot of percentage of normal-sized adults, small uncs, and dead worms 72 hr post L1 for the indicated genotypes. n is number of worms analyzed in 3–5 independent experiments. Note that the data for noca-1∆; ptrn-1∆ worms shown for comparison is the same as that in Figures 1E, 2A.
Figure 2—figure supplement 4
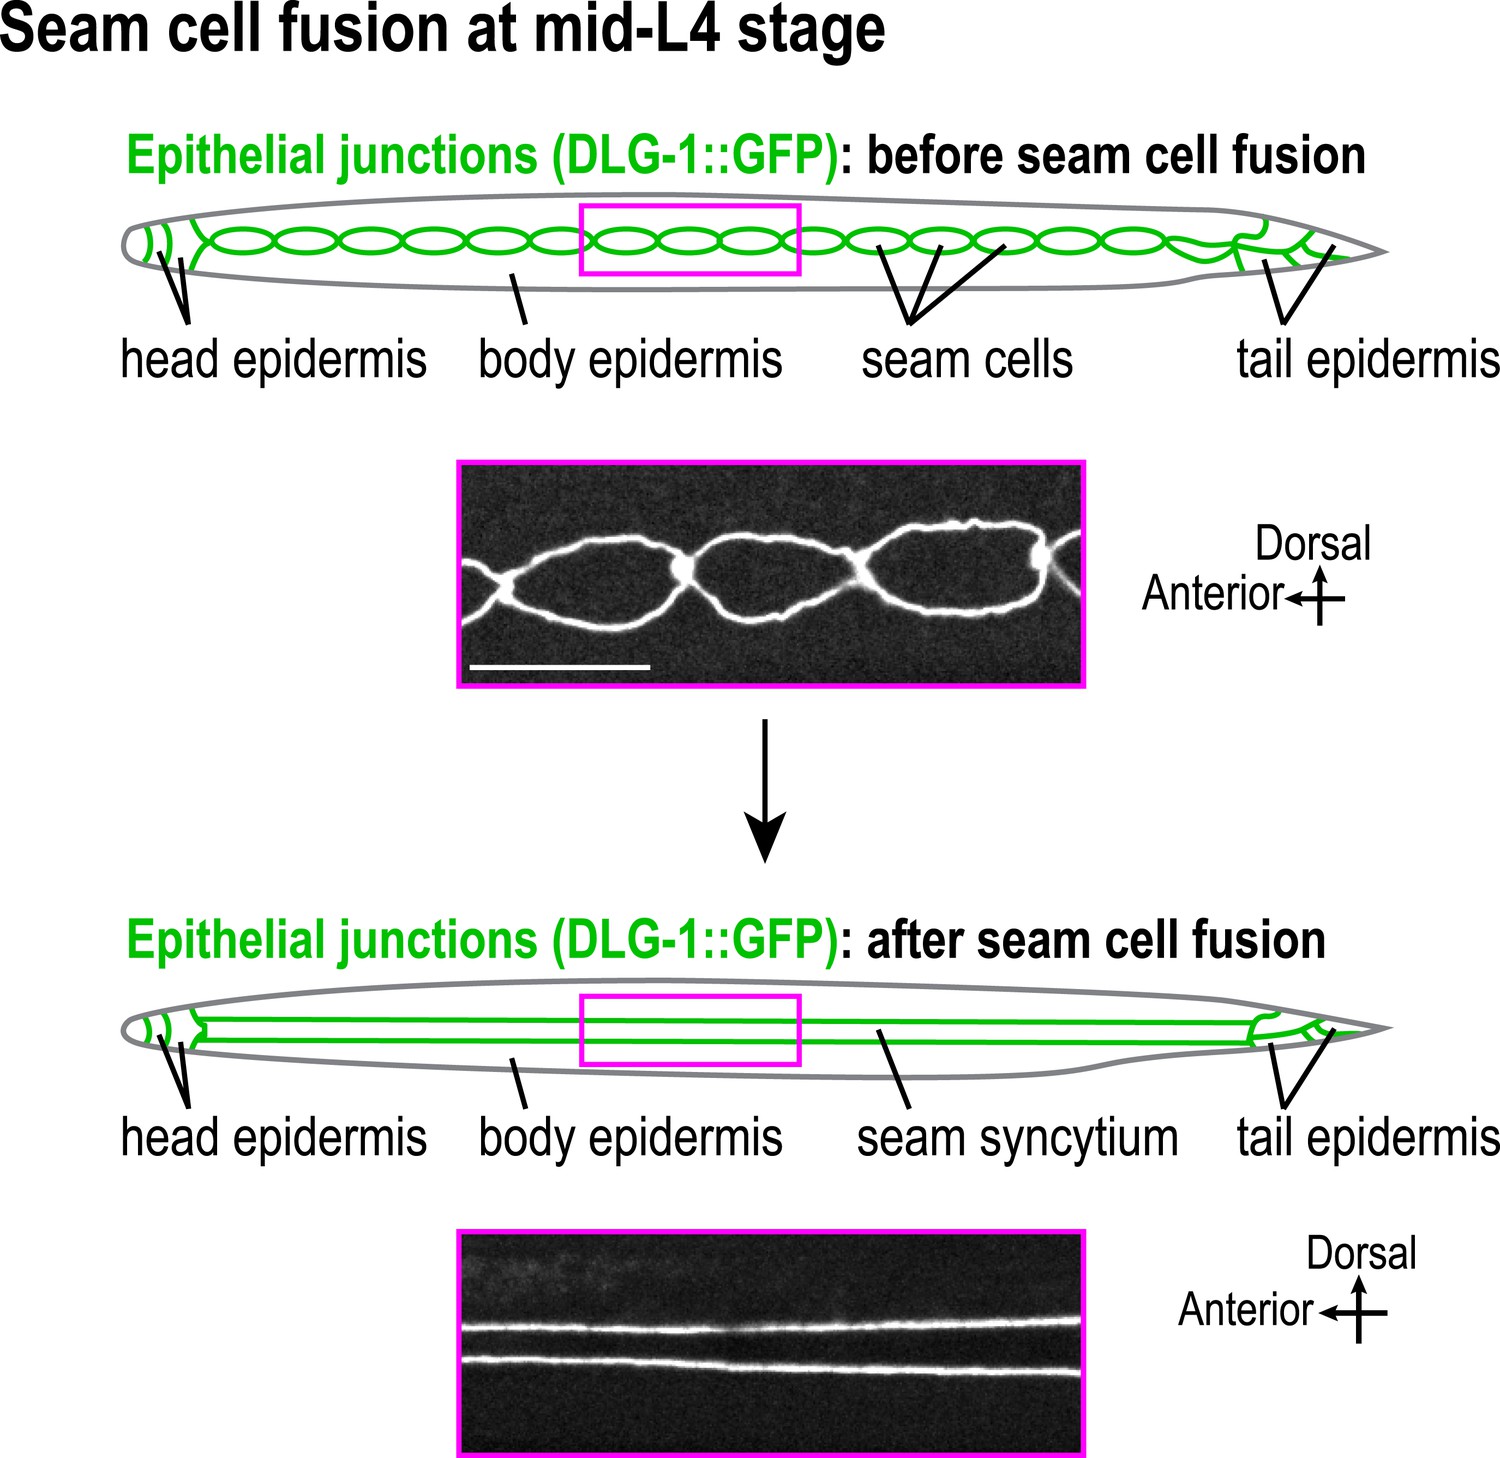
Illustration of seam cell fusion event at mid-L4 stage.
Schematic and fluorescence confocal images of worms expressing the epithelial junction marker DLG-1::GFP before (n = 13) and after (n = 13) the seam cells fuse at the mid-L4 stage. Scale bar, 10 μm.
Figure 2—figure supplement 5
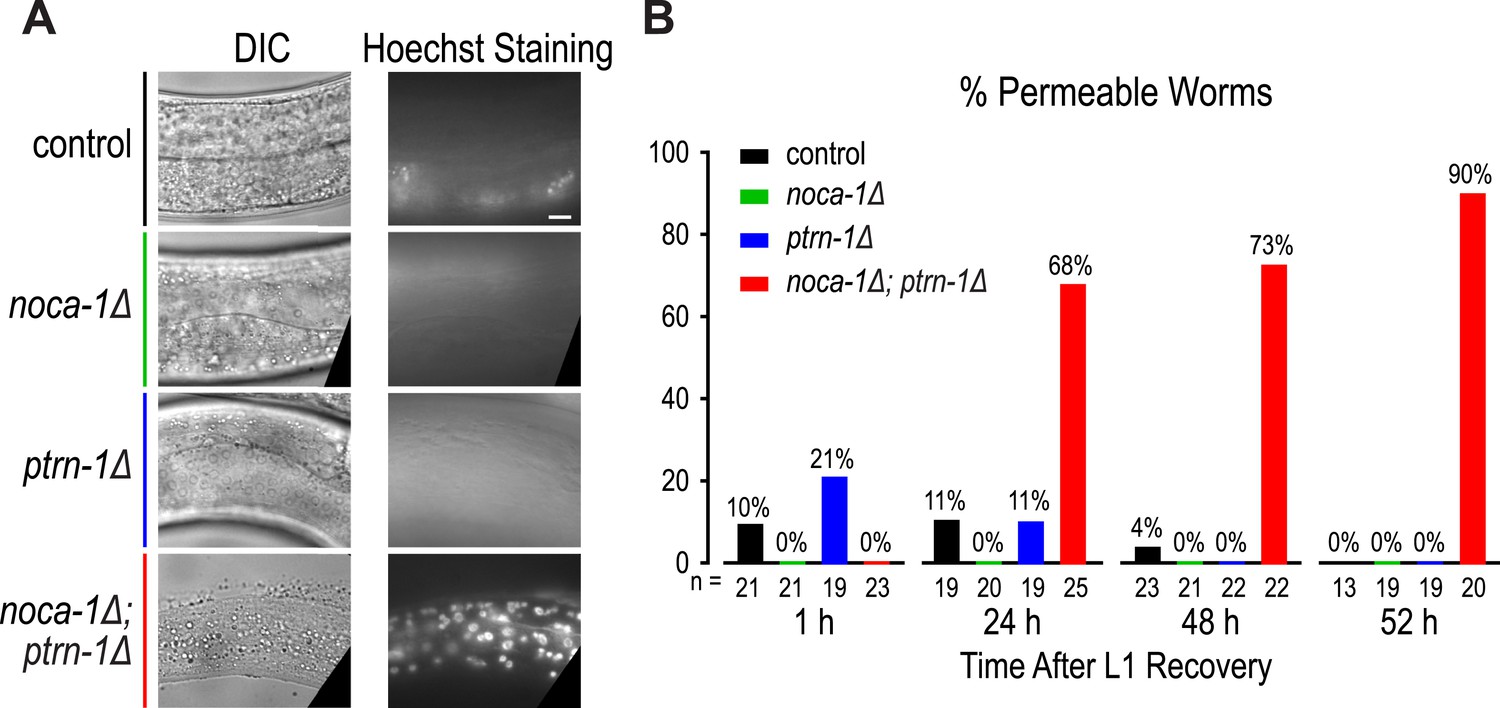
Time course of larval permeability in control and mutant backgrounds.
(A) DIC and fluorescent images of worms after incubation in Hoechst dye. (B) Plot of percentage of permeable worms for the indicated genotypes at the indicated developmental stages. n is the number of analyzed worms. Scale bar, 10 μm.
Figure 2—figure supplement 6
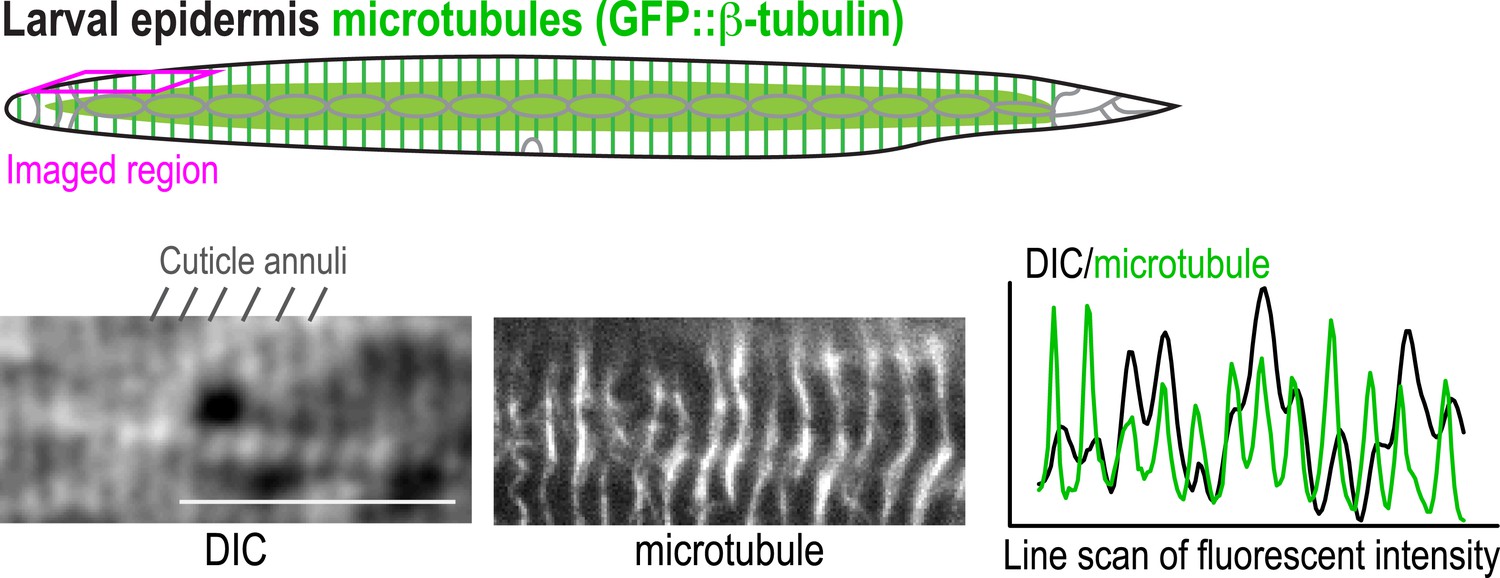
Microtubule bundles in the post-embryonic epidermis co-align with cuticle annuli.
Top: schematic of the microtubule array in the post-embryonic epidermis. Bottom left: DIC image showing the cuticle annuli and fluorescence confocal image showing the microtubule bundles. Bottom right: line-scan plots of the center panel images. 16 worms between the L3 and adult stages were imaged. Scale bar, 10 μm.
Figure 3 with 2 supplements
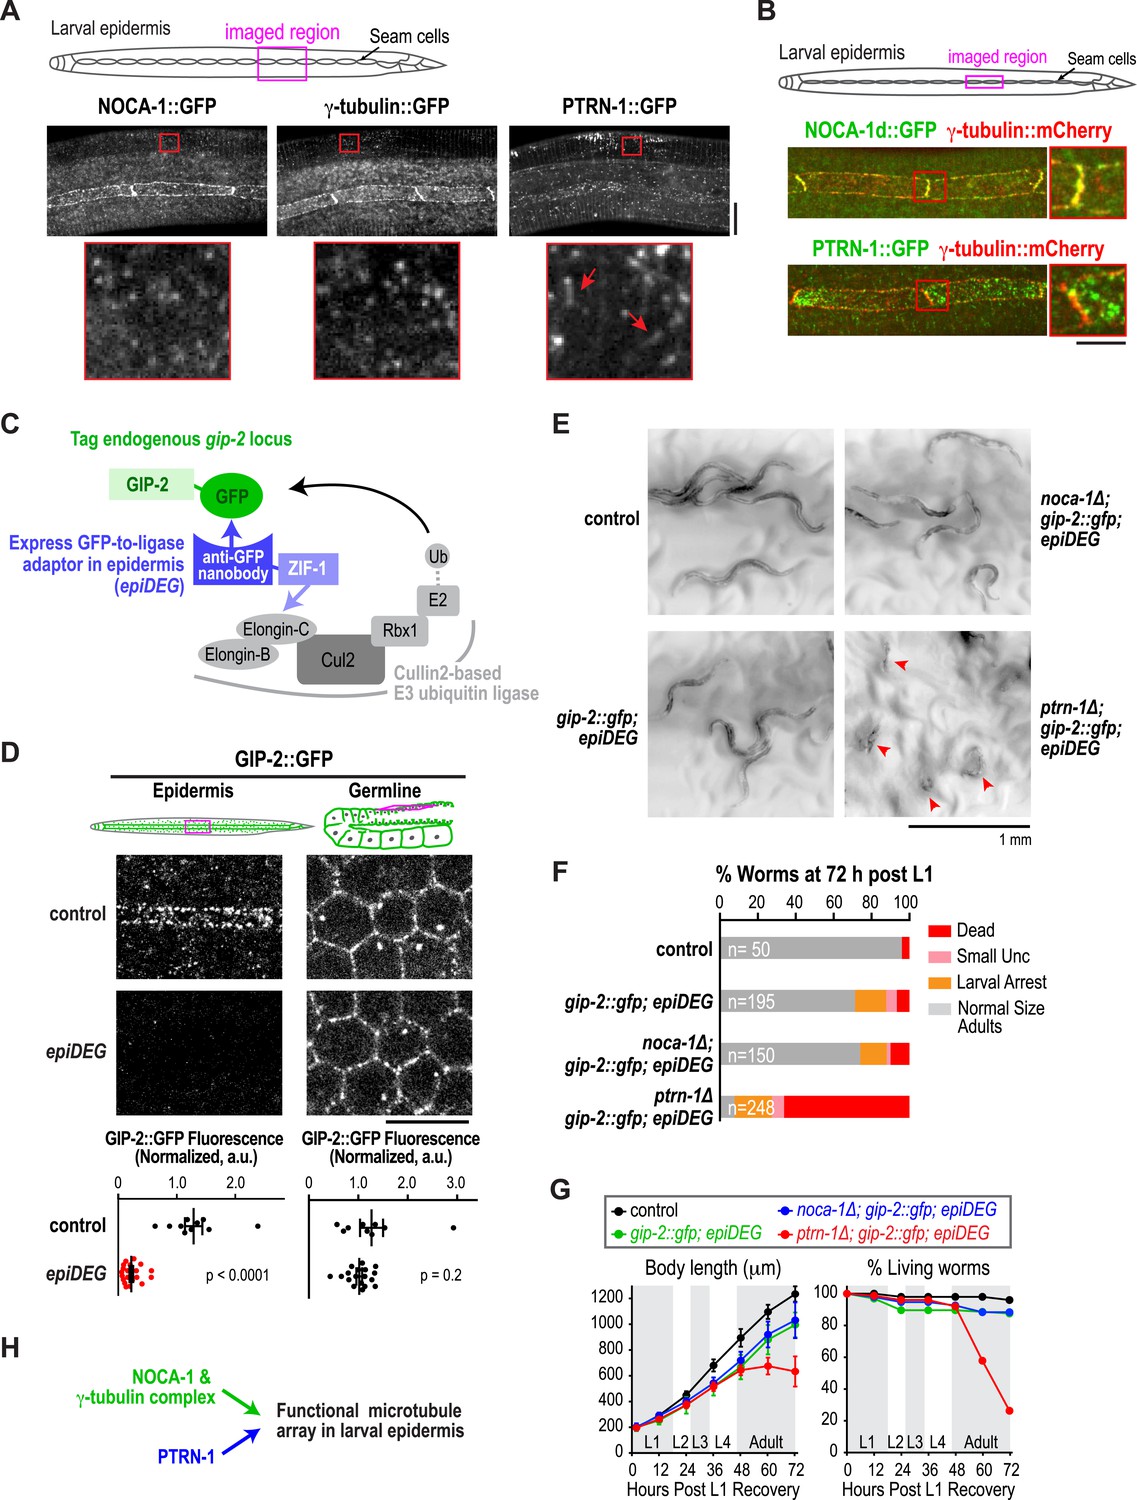
The γ-tubulin complex functions coordinately with NOCA-1 and in parallel to PTRN-1 to promote larval development and viability.
(A) Top: schematic of the imaged region. Bottom: fluorescence confocal images of L3 stage worms expressing NOCA-1::GFP (n = 27), γ-tubulin::GFP (n = 6), or PTRN-1::GFP (n = 17). Insets below are magnified eightfold. Arrowheads point to examples of stretches observed in worms expressing PTRN-1::GFP. Note that the vertical lines in the images are cuticle auto-fluorescence due to high laser power and long exposure times required to visualize the GFP puncta/stretches. (B) Top: schematic of the imaged region. Bottom: fluorescence confocal images of L3-stage worms co-expressing NOCA-1d::GFP (n = 12) or PTRN-1::GFP (n = 4) with γ-tubulin::mCherry. (C) Schematic outlining the method used to specifically degrade the essential γ-tubulin complex component GIP-2::GFP in the epidermis. (D) Top: schematics and fluorescence confocal images of L4 stage worms expressing GIP-2::GFP with or without Pdpy-7::GFP nanobody::ZIF-1 (epiDEG). Bottom: plots of normalized GIP-2::GFP fluorescence intensity in the epidermis or germline from worms with indicated genotypes. (E) Images of control and mutant worms 72 hr post L1 recovery (snapshots from Video 4). Arrowheads mark dead worms. (F) Plot of percentage of normal-sized adults, larval arrest, small uncs, and dead worms 72 hr post L1 for the indicated genotypes. n is total number of worms analyzed in 1 (control), 2 (gip-2::gfp; epiDEG and gip-2::gfp; epiDEG ;noca-1∆), or 3 (gip-2::gfp; epiDEG; ptrn-1∆) independent experiments. (G) Plots of body length (left) and % living worms (right) vs time for worms with the indicated genotypes. (H) Schematic describing two parallel pathways for assembly of a functional microtubule array in larval epidermis. Statistics, Student's t-test. p-values are the probability of obtaining the observed results assuming the test group is the same as control. Error bars are SEM. Scale bars, 10 µm or as indicated.
Figure 3—figure supplement 1
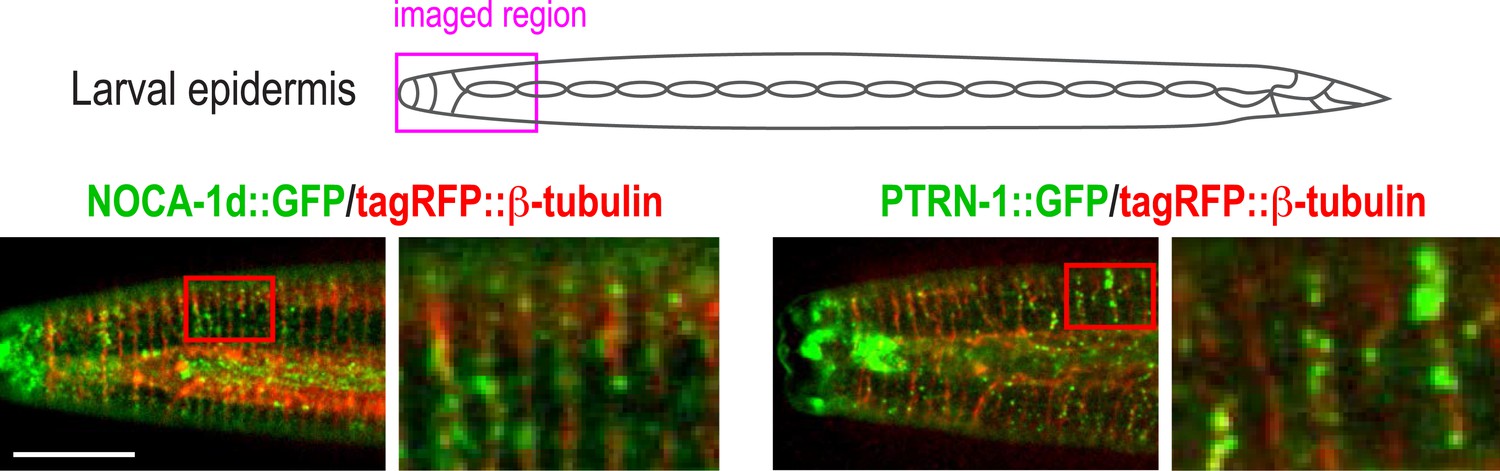
NOCA-1 and PTRN-1 localize along microtubules in the larval epidermis.
Schematic showing the imaged region and fluorescence confocal images of NOCA1d::GFP (n = 23) or PTRN-1::GFP (n = 10) along with tagRFP::β-tubulin in the epidermis of L3 stage worms. Both NOCA-1d and PTRN-1 are observed in puncta (sometimes PTRN-1 as short stretches), many of which co-localize with microtubule bundles. Scale bar, 10 µm.
Figure 3—figure supplement 2

Strategy to selectively inhibit the γ-tubulin complex in the larval/adult epidermis of C. elegans.
To selectively inhibit the γ-tubulin complex in the larval epidermis, we used a CRISPR/Cas9-based approach to insert a sequence encoding GFP downstream of the gip-2 gene at its endogenous locus on Chr I and introduced the ‘epiDEG’ transgene encoding a fusion of an anti-GFP nanobody with ZIF-1, which recruits the target to a Cullin2-based ubiquitin ligase, on Chr II.
Figure 4 with 2 supplements
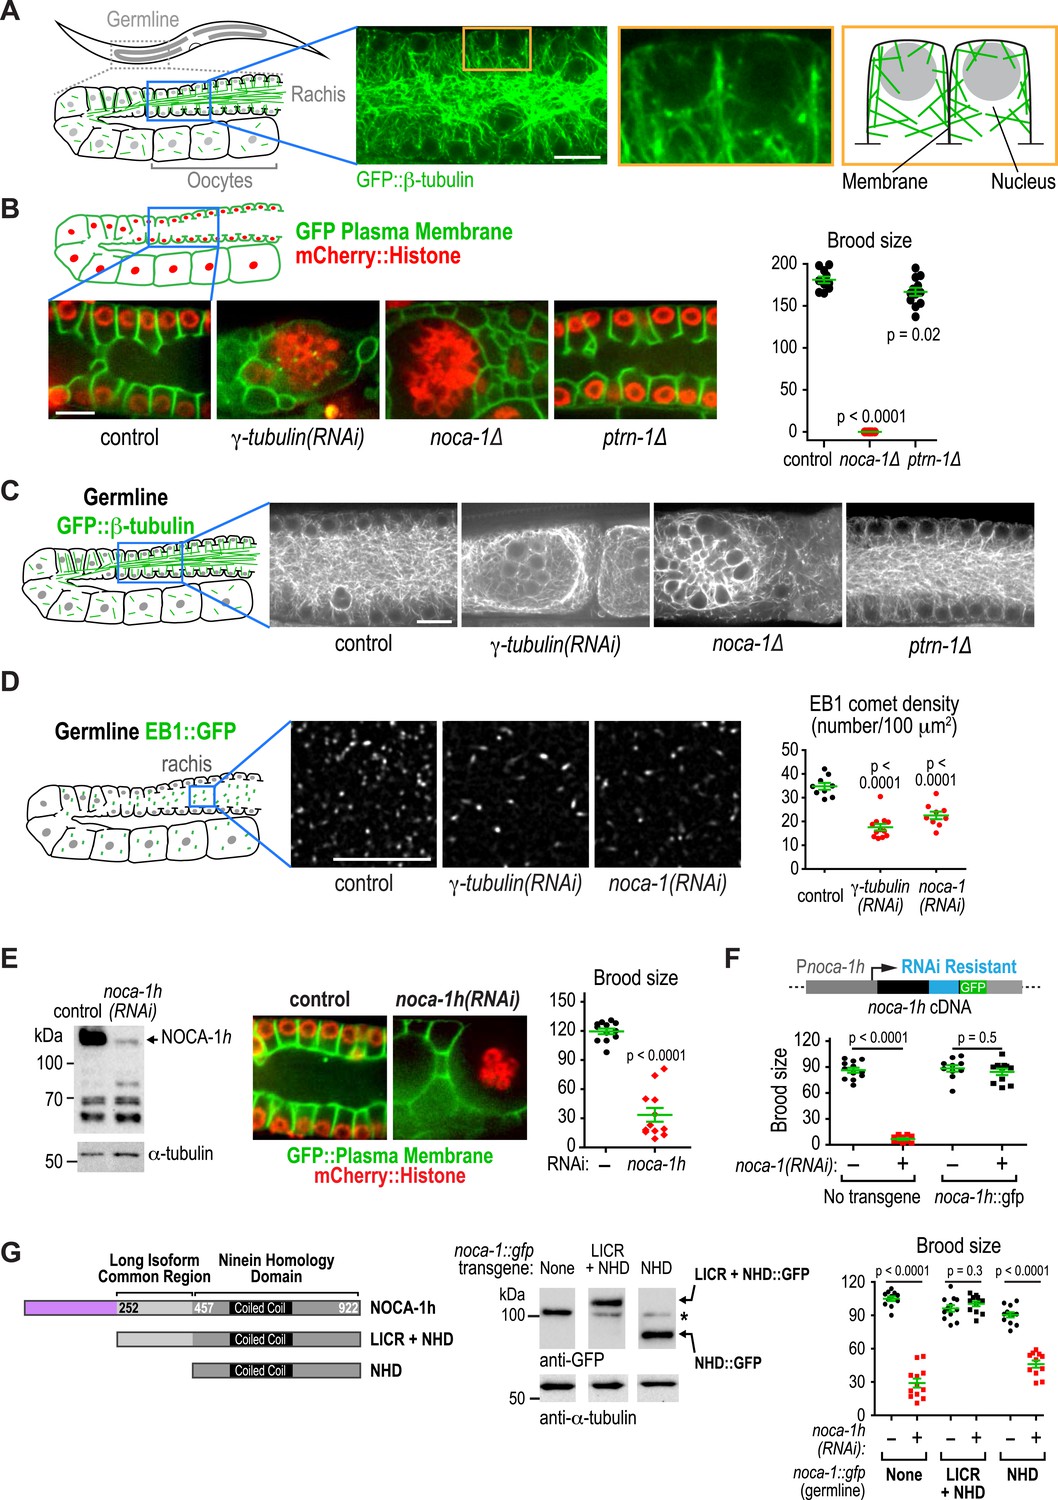
NOCA-1 isoform h functions in the germline to assemble a non-centrosomal microtubule array for nuclear positioning.
(A) Left: schematic showing the germline and location of the imaged region. Middle: fluorescence confocal image of the germline in a worm expressing GFP::β-tubulin. Inset to the right is magnified 3.3-fold. Right: Schematic of the region highlighted in the inset, illustrating the organization of the microtubule arrays in the compartments that hold the nuclei near the cell surface and prevent them from falling into the rachis. (B) Left top: schematic illustrating the structure of the syncytial germline. Left bottom: fluorescence confocal images of germlines in control (n = 14), γ-tubulin(RNAi) (n = 7), noca-1∆ (n = 12), and ptrn-1∆ (n = 11) worms expressing a GFP-tagged plasma membrane marker and mCherry-tagged histone H2B. Frequencies of disorganized germlines with nuclei falling out of their compartments were 100% in γ-tubulin(RNAi) and noca-1Δ worms and 0% in control and ptrn-1∆ worms. Right: plot of brood size for worms of the indicated genotypes. (C) Left: schematic illustrating microtubule organization in the germline. Right: fluorescence confocal images of germlines in control (n = 22), γ-tubulin(RNAi) (n = 10), noca-1Δ (n = 13) and ptrn-1Δ (n = 7) worms expressing GFP::β-tubulin. Frequencies of the nuclear fall-out phenotype were 100% in γ-tubulin(RNAi) and noca-1Δ worms and 0% in control and ptrn-1Δ worms. (D) Left: schematic showing the location of the imaged region. Middle: fluorescence confocal images of growing microtubule ends marked by EB1::GFP in the germline. Right: plot of EB1 comet density in worms depleted of the indicated proteins by RNAi. (E) Left: immunoblot of NOCA-1 in lysates from control and noca-1h(RNAi) worms. Middle: fluorescence confocal images of germlines in control (n = 13) and noca-1h(RNAi) (n = 10) worms expressing a GFP-tagged plasma membrane marker and mCherry::histone. Frequencies of disorganized germlines with nuclear fallout were 100% in noca-1h(RNAi) and 0% in control worms. Right: plot of brood size for control and noca-1h(RNAi) worms. (F) Top: schematic illustrating the RNAi-resistant noca-1h::gfp transgene. Bottom: brood size plot for worms subjected to the indicated perturbations. (G) Left: schematic showing NOCA-1h and the two analyzed truncations. Germline expression was driven by the noca-1h promoter. Middle: immunoblot of lysates prepared from worms with the indicated genotypes. The asterisk marks a non-specific band. Right: Plot of brood size for worms subjected to indicated perturbations. Statistics in B and D, one-way ANOVA followed by Dunnett's multiple comparisons test. Statistics in E, F and G, Student's t-test. p-values are the probability of obtaining the observed results assuming the test group is the same as control. Error bars are SEM. Scale bar, 10 µm.
Figure 4—figure supplement 1

Ectopic germline expression of PTRN-1 does not substitute the germline function of NOCA-1.
(A) Schematic and fluorescence confocal images of the germline in control (n = 6), noca-1(RNAi) (n = 5), and noca-1Δ (n = 6) worms ectopically expressing PTRN-1::GFP under control of the Pnoca-1h germline promoter. (B) Plot of brood size for worms with indicated perturbations. Statistics, one-way ANOVA followed by Dunnett's multiple comparisons test. p-values indicate the probability of obtaining the observed or more extreme results assuming the test group is the same as control (no transgene, no RNAi). Error bars are SEM. Scare bar, 10 μm.
Figure 4—figure supplement 2
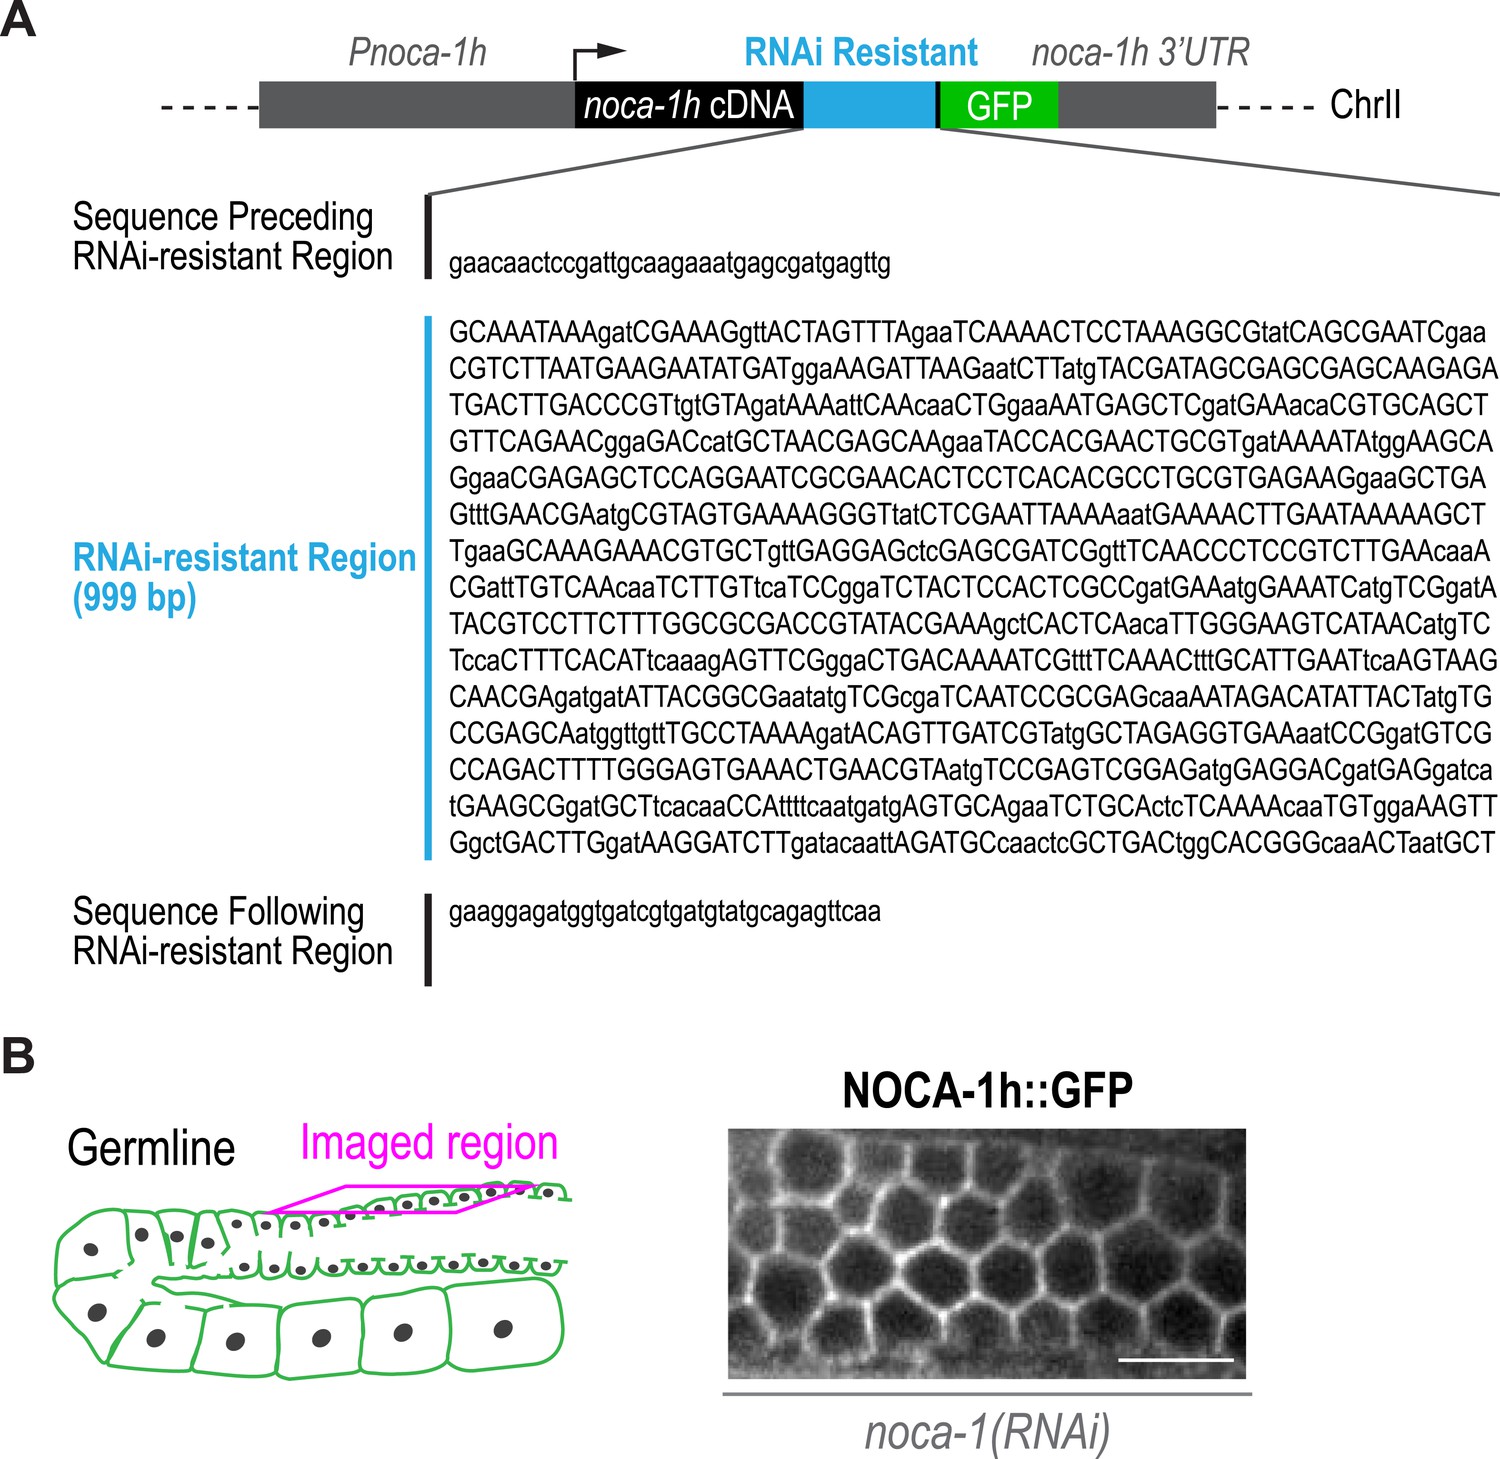
Sequence of the RNAi-resistant region of the NOCA-1h::GFP transgene and localization of NOCA-1h::GFP in the germline.
(A) Schematic of the RNAi-resistant NOCA-1h::GFP single-copy transgene showing the sequence of the RNAi-resistant region. The codons in the RNAi-resistant region were shuffled to prevent targeting of the transgene by dsRNA directed against the corresponding region of the endogenous gene, while maintaining amino acid sequence. Capital letters indicate the altered codons. (B) Left: schematic showing the location of the imaged region of the germline. Right: fluorescence confocal image showing the membrane localization of NOCA-1h::GFP (n = 5). Scale bar, 10 µm.
Figure 5 with 1 supplement
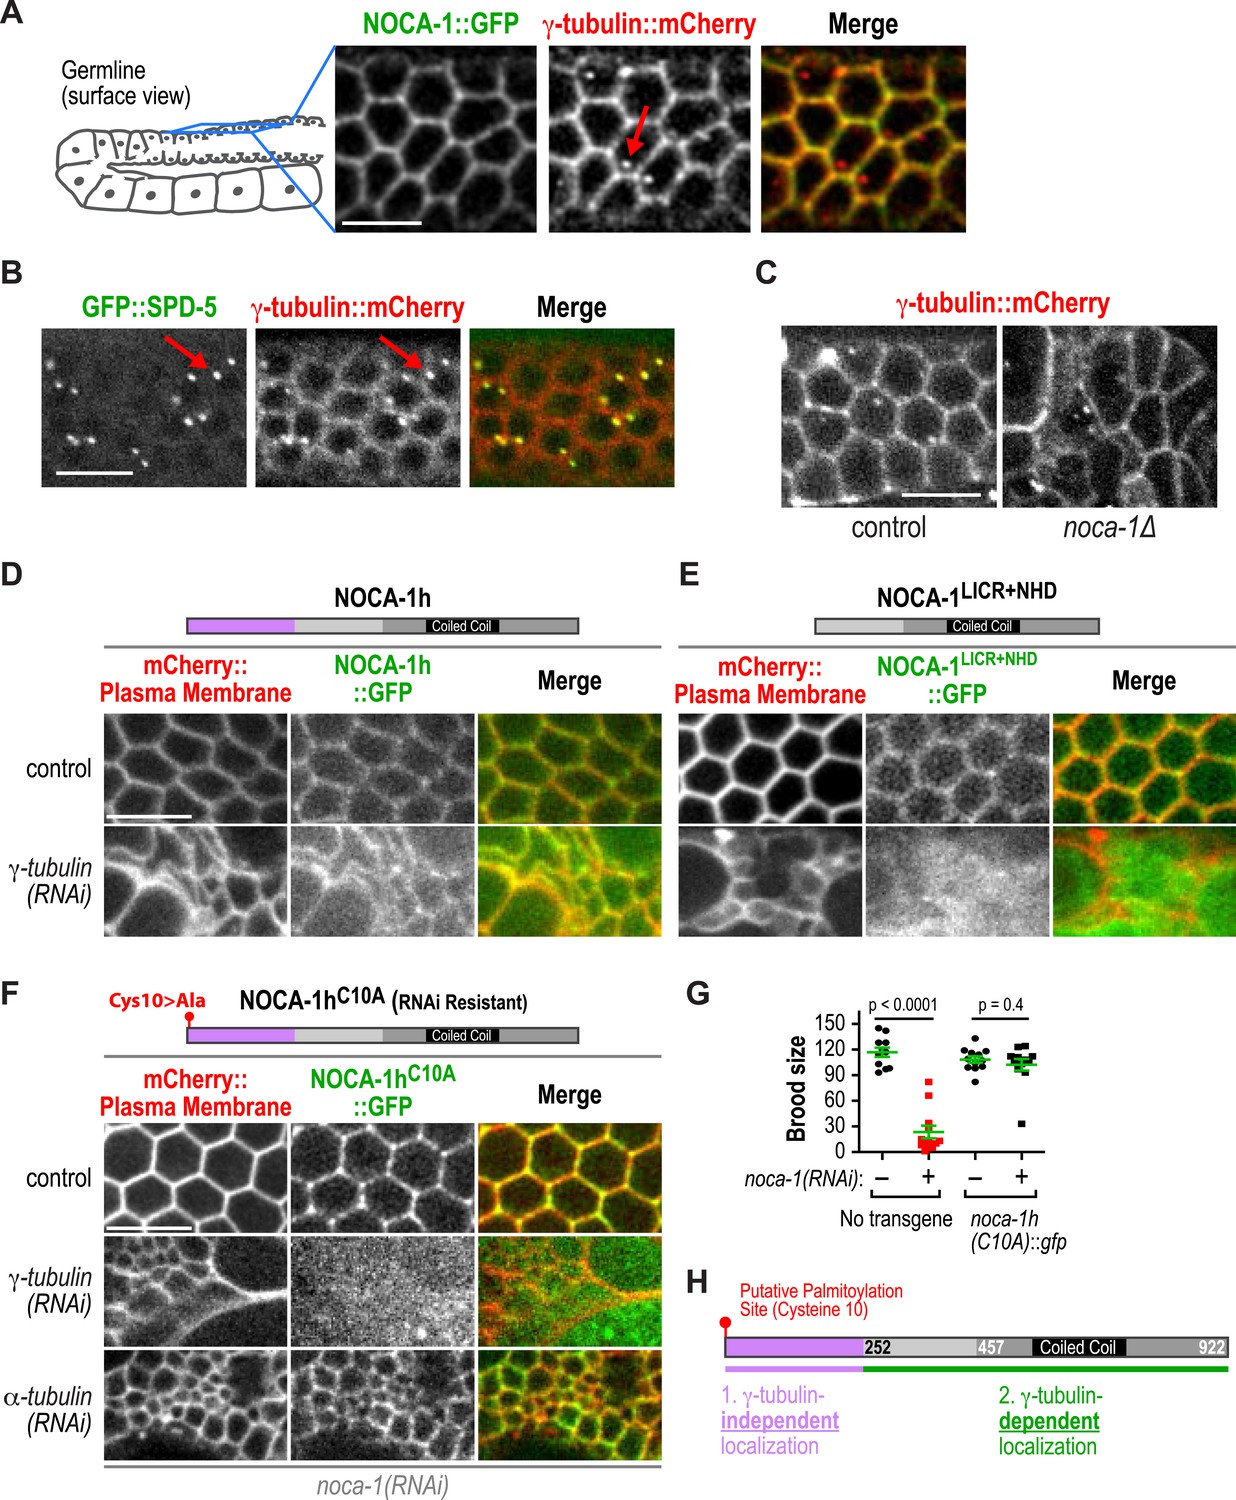
γ-tubulin-dependent and independent mechanisms target NOCA-1 to the plasma membrane in the germline.
(A) Left: schematic of region imaged in A–F. Right: fluorescence confocal images of the germline in worms co-expressing NOCA-1::GFP and γ-tubulin::mCherry (n = 10). Arrow points to a centrosome. (B) Fluorescence confocal images of a germline in a worm co-expressing GFP::SPD-5 (a centrosome marker) and γ-tubulin::mCherry (n = 13). Arrows point to centrosomes. (C) Fluorescence confocal images of γ-tubulin::mCherry in the germline of control (n = 11) and noca-1∆ (n = 8) worms. (D) Fluorescence confocal images of the germline in control (n = 16) and γ-tubulin(RNAi) (n = 10) worms co-expressing NOCA-1h::GFP and an mCherry-tagged plasma membrane marker. (E) Fluorescence confocal images of the germline from control (n = 25) and γ-tubulin(RNAi) (n = 23) worms expressing NOCA-1LICR+NHD::GFP and an mCherry-tagged plasma membrane marker. (F) Fluorescence confocal images of the germline in worms expressing NOCA-1hC10A::GFP and an mCherry-tagged plasma membrane marker that were depleted of endogenous NOCA-1 by RNAi. Images are shown for control worms (n = 17) or worms that were also depleted of γ-tubulin (n = 20) or α-tubulin (n = 18). (G) Top: schematic illustrating the RNAi-resistant NOCA-1hC10A::GFP transgene. Bottom: brood size plot for worms subjected to indicated perturbations. (H) Schematic summarizing the mechanisms that target NOCA-1h to the cell surface in the germline. Statistics, Student's t-test. p-values are the probability of obtaining the observed results assuming the test group is the same as control. Scale bars, 10 µm.
Figure 5—figure supplement 1

The isoform specific region of NOCA-1h localizes to the plasma membrane through a putative palmitoylation.
(A) Left: schematic of imaged region on the top. Right: fluorescence confocal images of worms expressing NOCA-1h(1-251)::GFP with (n = 13) or without (n = 25) the C10A mutation. Scale bar, 10 μm. (B) Immunoblot of worms expressing indicated transgenes using GFP antibody. Markers are in kDa.
Figure 6
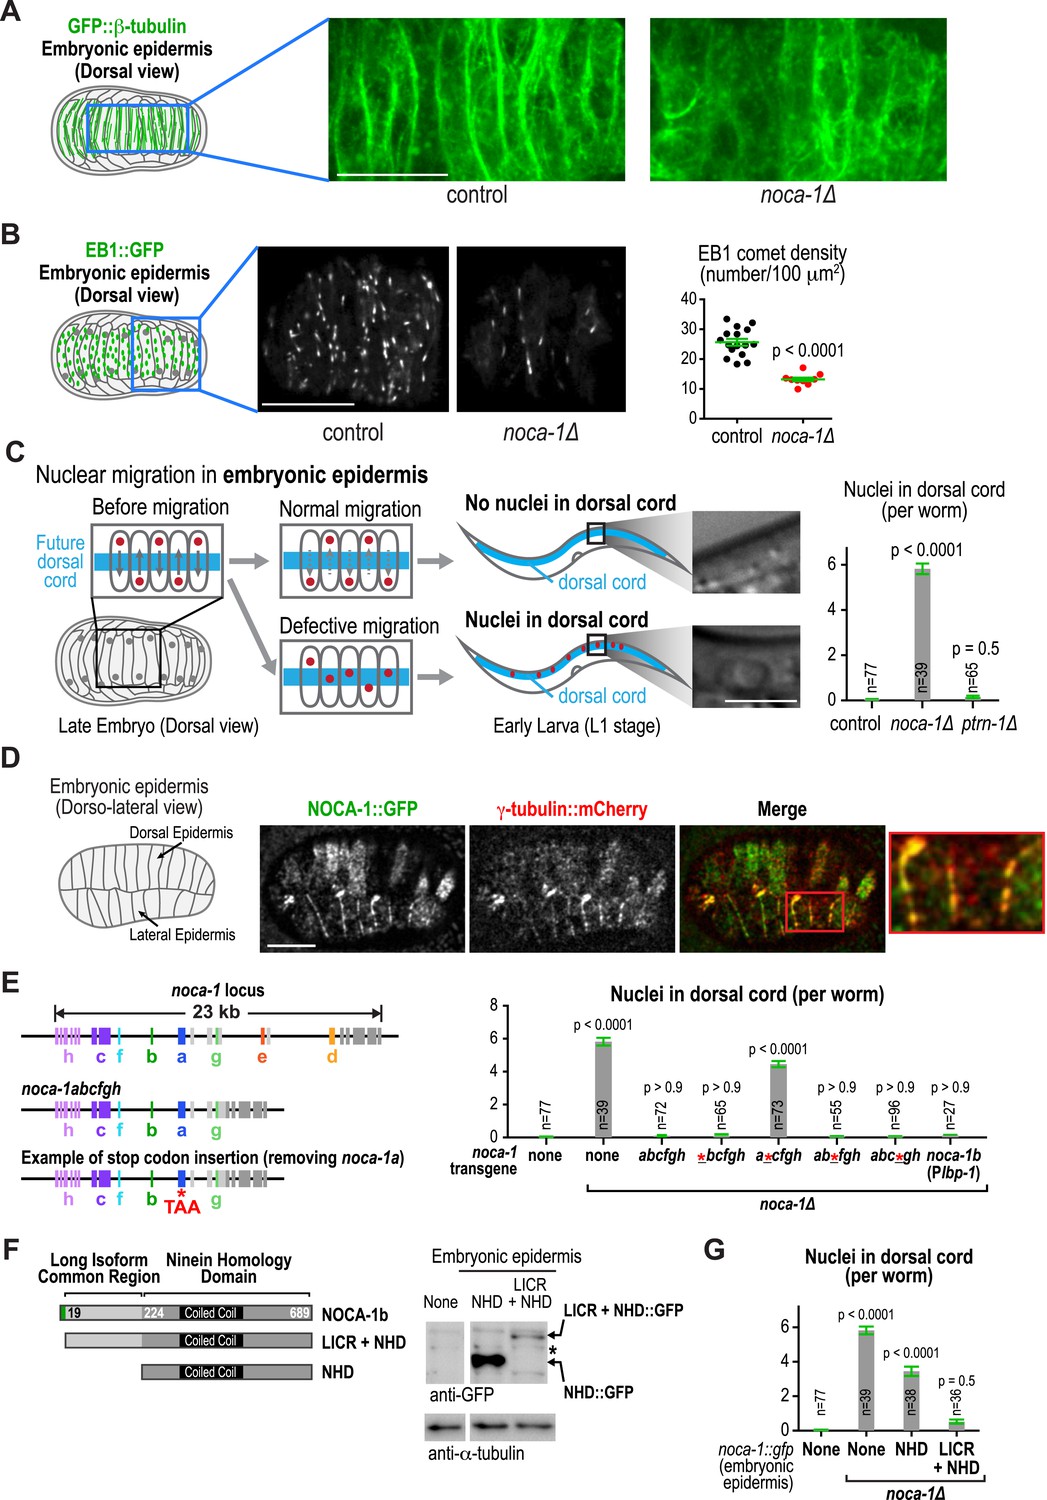
NOCA-1, but not PTRN-1, is required for the function of a non-centrosomal microtubule array that positions nuclei in the embryonic epidermis.
(A) Left: schematic showing the imaged region of the dorsal embryonic epidermis. Right: maximum intensity projections of fluorescence confocal images of the dorsal epidermis in control (n = 4) and noca-1∆ (n = 5) embryos expressing GFP::β-tubulin. Images were captured and displayed using identical settings. (B) Left and Middle: schematic and images of control (n = 16) and noca-1∆ (n = 10) embryos expressing EB1::GFP to mark growing microtubule ends. Right: plot of EB1 comet density in control and noca-1∆ embryos. (C) Left: schematic illustrating nuclear migration in the developing dorsal epidermis of C. elegans embryos. Right: plot of the number of nuclei in the dorsal cord for worms with indicated genotypes. (D) Left: schematic showing location of the imaged region. Right: images of C. elegans embryos co-expressing NOCA-1::GFP and γ-tubulin::mCherry (n = 14). (E) Left: schematic illustrating noca-1 transgenes expressing different isoform subsets. 2.4 kb of 5′ UTR and 1.2 kb of 3′ UTR were used in all transgenes. Right: plot of nuclei number in dorsal cord for worms with indicated genotypes. Plbp-1 is an epidermis specific promoter. Data for control and noca-1∆ are the same as in (C). (F) Left: schematic of the two analyzed truncations. Embryonic epidermis expression was driven by Plbp-1. Right: GFP immunoblot of worm lysates prepared from worms with indicated genotypes. ‘*’ marks a non-specific band. (G) Plot of nuclei number in dorsal cord for worms with indicated genotypes. Note that data for control and noca-1∆ are the same as in (C) and (E). Error bars are SEM. Statistics in C, E and G, one-way ANOVA followed by Dunnett's multiple comparisons test. Statistics in B, Student's t-test. p-values indicate the probability of obtaining the observed results assuming the test group is the same as control. Scale bars, 10 µm.
Figure 7
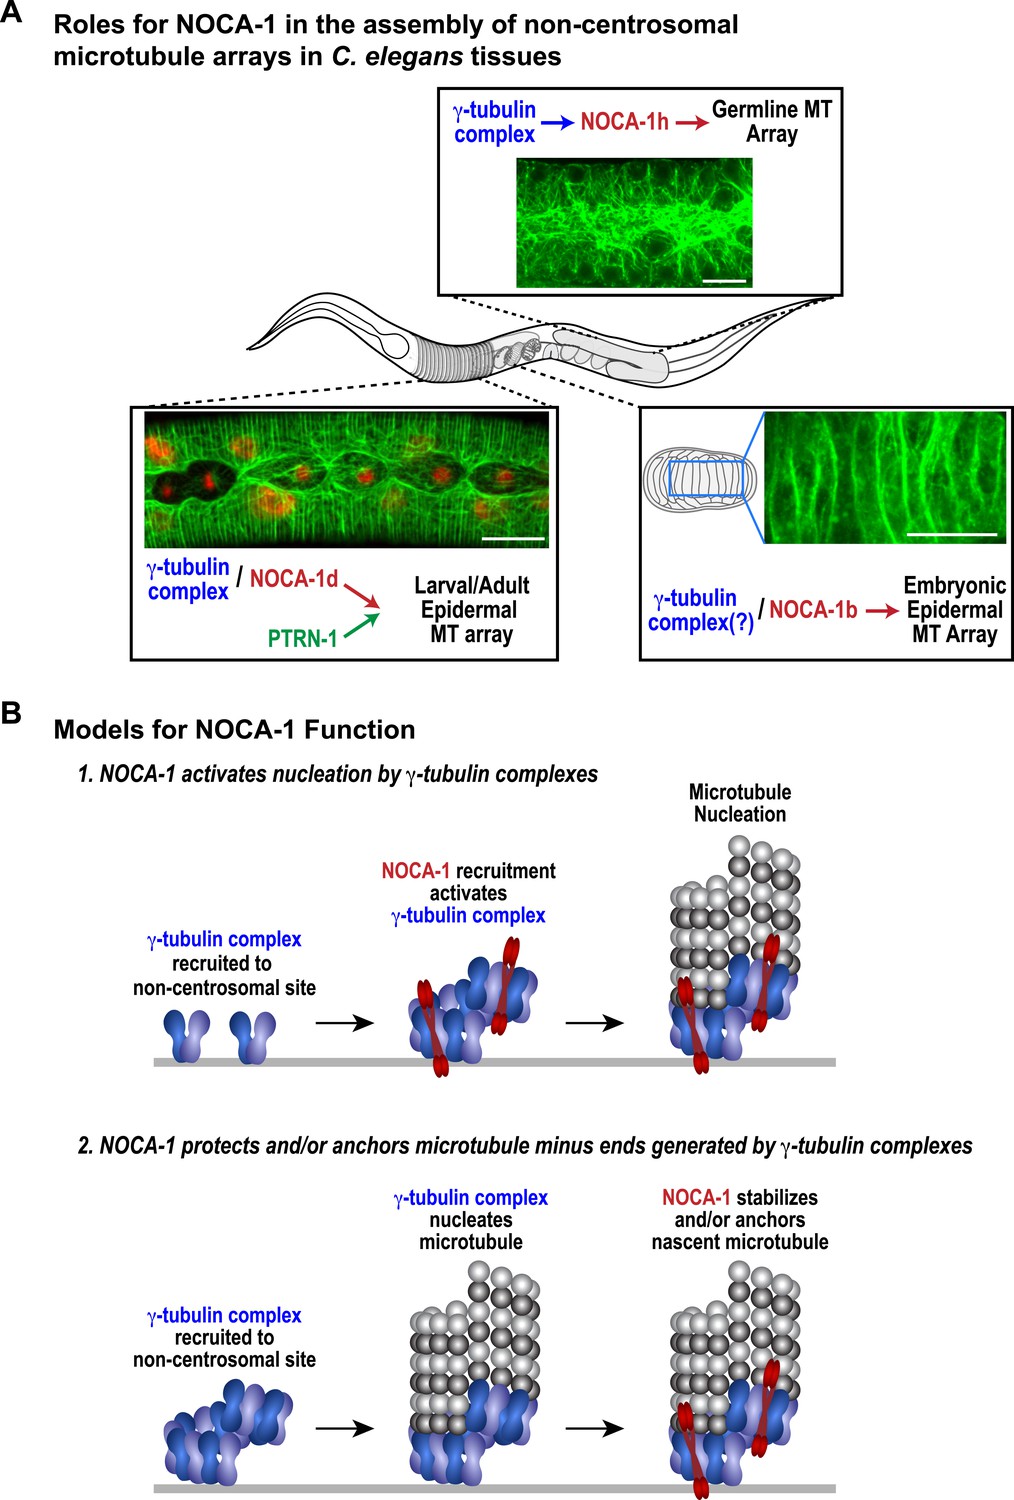
NOCA-1 functions in multiple C. elegans tissues to assemble non-centrosomal microtubule arrays.
(A) Schematics and images summarizing the pathways that control the assembly of non-centrosomal microtubule arrays in three C. elegans tissues. (B) Schematics illustrating two speculative models for how NOCA-1 could function coordinately with the γ-tubulin complex to generate microtubule arrays. Scale bars, 10 µm.
Videos
Video 1
NOCA-1 and PTRN-1 redundantly perform a function essential for larval development.
Worms with the indicated genotypes were filmed using an eyepiece camera (DinoEye) mounted on a dissection scope 72 hr after release from a synchronized L1 stage. Playback is 2× realtime.
Video 2
NOCA-1 and PTRN-1 function in parallel to control microtubule array formation in the larval epidermis.
Timelapse fluorescence confocal microscopy was used to acquire images of the head epidermal region of control, noca-1Δ, ptrn-1Δ, and noca-1Δ; ptrn-1Δ worms expressing GFP::β-tubulin. Images were acquired at 1 s intervals. Playback is 6× realtime.
Video 3
NOCA-1 makes the microtubule arrays in the larval/adult epidermis more dynamic.
Timelapse fluorescence confocal microscopy was used to acquire images of the dorsal or ventral side of larval body epidermis in control, noca-1Δ, and ptrn-1Δ worms expressing EB1::GFP (marks growing microtubule ends). Images were acquired at 1-s intervals. Playback is 6× realtime.
Video 4
Epidermal degradation of GIP-2::GFP synergizes with ptrn-1Δ but not noca-1Δ.
Worms with the indicated genotypes were filmed using an eyepiece camera (DinoEye) mounted on a dissection scope 72 hr after release from a synchronized L1 stage. Playback is 2× realtime.
Video 5
Depletion of γ-tubulin or NOCA-1 reduces growing microtubule ends in the germline.
Timelapse fluorescence confocal microscopy was used to acquire images of a central plane of the pachytene region of the germline in worms expressing EB1::GFP (marks growing microtubule ends). Images of control, γ-tubulin(RNAi), and noca-1(RNAi) worms were acquired at 1-s intervals. Playback is 6× realtime.
Video 6
Deletion of NOCA-1 reduces growing microtubules in the embryonic epidermis.
Timelapse fluorescence confocal microscopy was used to acquire images of the dorsal epidermis in C. elegans embryos expressing EB1::GFP (Plbp-1::EB1::GFP). Images of embryos from control and noca-1(RNAi) worms were acquired at 1 s intervals. Playback is 6× realtime.
Tables
Table 1
C. elegans strains used in this study
| Strain # | Genotype |
|---|---|
| N2 | wild type (ancestral) |
| OD522 | unc-119(ed3)III; ltSi62[pOD1110/pSW008; CEOP3608 TBG-1::mCherry; cb-unc-119(+)]II |
| OD523 | unc-119(ed3)III; ltSi63[pOD1111/pSW009; CEOP3608 TBG-1::GFP; cb-unc-119(+)]II |
| OD528 | unc-119(ed3)III; ttTi22935 V (Mos1 insertion) |
| OD723 | noca-1(ok3692)V/nT1[qIs51](IV;V) |
| OD726 | ltSi77[pOD1112/pSW032; Plbp-1::mCherry; cb-unc-119(+)]V |
| OD747 | unc-119(ed3) III; ttTi21011 X |
| OD752 | unc-119(ed3)III; ItSi182[pOD1237/pSW055; Pnoca-1::noca-1abcfgh; cb-unc-119(+)]II |
| OD758 | unc-119(ed3)III?; ItSi182[pOD1237/pSW055; Pnoca-1::noca-1abcfgh; cb-unc-119(+)]II; noca-1(ok3692)V |
| OD843 | unc-119(ed3) III?; ltIs38 [pAA1; pie-1/GFP::PH(PLC1delta1); unc-119 (+)]; ltIs37 [pAA64; pie-1/mCHERRY::his-58; unc-119 (+)] IV; noca-1(ok3692)V/nT1[qIs51](IV;V) |
| OD851 | unc-119(ed3) III?; ltSi62[pOD1110/pSW008; CEOP3608 TBG-1::mCherry; cb-unc-119(+)]II; noca-1(ok3692)V/nT1[qIs51](IV;V) |
| OD854 | ptrn-1(lt1::cb-unc-119+)X |
| OD866 | ltSi219[pOD1248/pSW076; Pmex-5::GFP::PH(PLC1delta1)::operon_linker::mCHerry::his-11; cb-unc-119(+)]I |
| OD868 | ltSi220[pOD1249/pSW077; Pmex-5::GFP::tbb-2::operon_linker::mCHerry::his-11; cb-unc-119(+)]I |
| OD891 | noca-1(ok3692)V/nT1[qIs51](IV;V); ptrn-1(lt1::cb-unc-119+)X |
| OD907 | ltSi222[pOD1250/pSW078; Plbp-1::GFP::tbb-2::operon_linker::mCHerry::his-11; cb-unc-119(+)]I; noca-1(ok3692)V/nT1[qIs51](IV;V) |
| OD909 | ltSi222[pOD1250/pSW078; Plbp-1::GFP::tbb-2::operon_linker::mCHerry::his-11; cb-unc-119(+)]I; ltSi77[pOD1112/pSW032; Plbp-1::mCherry; cb-unc-119(+)]V |
| OD911 | ltSi220[pOD1249/pSW077; Pmex-5::GFP::tbb-2::operon_linker::mCHerry::his-11; cb-unc-119(+)]I; ptrn-1(lt1::cb-unc-119+)X |
| OD952 | unc-119(ed3)III; ltSi246[pOD1270/pSW082; Pnoca-1::noca-1abcfgh::superfolderGFP; cb-unc-119(+)]II |
| OD961 | ltSi249[pOD1274/pSW098; Pdlg-1delta7::dlg-1::GFP::unc-54-3′ UTR; cb-unc-119(+)]I |
| OD1011 | ltSi220[pOD1249/pSW077; Pmex-5::GFP::tbb-2::operon_linker::mCHerry::his-11; cb-unc-119(+)]I; noca-1(ok3692)V/nT1(IV;V) |
| OD1222 | ItSi182[pOD1237/pSW055; Pnoca-1::noca-1abcfgh; cb-unc-119(+)]II; unc-119(ed3)III?; noca-1(ok3692)V; ptrn-1(lt1::cb-unc-119+)X |
| OD1223 | unc-119(ed3)III; ltSi364[pOD1330/pSW147; Pnoca-1h::noca-1h(1-251)::superfolderGFP; cb-unc-119(+)]II |
| OD1225 | unc-119(ed3)III; ltSi366[pOD1332/pSW149; Pnoca-1h::noca-1h(457-922)::superfolderGFP; cb-unc-119(+)]II |
| OD1227 | unc-119(ed3)III; ltSi368[pOD1334/pSW151; Pnoca-1h::noca-1h(252-922)::superfolderGFP; cb-unc-119(+)]II |
| OD1233 | ltSi369[pOD1335/pSW152; Pnoca-1h::noca-1h(RNAi resistant)::superfolderGFP; cb-unc-119(+)]II |
| OD1339 | unc-119(ed3)III; ltSi417[pOD1342/pSW159; Pnoca-1de::noca-1de::mCherry; cb-unc-119(+)]II |
| OD1345 | ltSi417[pOD1342/pSW159; Pnoca-1de::noca-1de::mCherry; cb-unc-119(+)]II; unc-119(ed3)III?; noca-1(ok3692)V/nT1[qIs51](IV;V); ptrn-1(lt1::cb-unc-119+)X |
| OD1347 | ltSi419[pOD1465/pSW177; Pnoca-1h::ptrn-1(cDNA)::superfolderGFP; cb-unc-119(+)]II; unc-119(ed3)III |
| OD1359 | ltSi716[pOD1935/pDC208; Pmex-5::EBP-2::GFP::tbb-2_3′ UTR; cb-unc-119(+)]I; unc-119(ed3)III |
| OD1394 | ltSi443[pOD1471/pSW182; Pnoca-1h::noca-1h(1-251)::superfolderGFP (C10A); cb-unc-119(+)]II; unc-119(ed3)III |
| OD1426 | ltSi449[pOD1461/pSW173; Plbp-1::EBP-2::GFP::opLinker::mCHerry::PH; cb-unc-119(+)]I; unc-119(ed3)III |
| OD1442 | ltSi458[pOD1477/pSW188; Pnoca-1d::noca-1d(cDNA)::mCherry; cb-unc-119(+)]II; unc-119(ed3)III |
| OD1443 | ltSi459[pOD1478/pSW189; Pnoca-1e::noca-1e(cDNA)::mCherry; cb-unc-119(+)]II; unc-119(ed3)III |
| OD1446 | ltSi461[pOD1340/pSW157; Pnoca-1::noca-1abc*gh (STOP in the first exon of isoform f); cb-unc-119(+)]II; unc-119(ed3)III |
| OD1504 | ltSi449[pOD1461/pSW173; Plbp-1::EBP-2::GFP::opLinker::mCHerry::PH; cb-unc-119(+)]I; unc-119(ed3)?III; noca-1(ok3692)V/nT1[qIs51](IV;V) |
| OD1505 | ltSi449[pOD1461/pSW173; Plbp-1::EBP-2::GFP::opLinker::mCHerry::PH; cb-unc-119(+)]I; unc-119(ed3)?III; ltSi77[pOD1112/pSW032; Plbp-1::mCherry; cb-unc-119(+)]V |
| OD1510 | ltSi249[pOD1274/pSW098; Pdlg-1delta7::dlg-1::GFP::unc-54-3′ UTR; cb-unc-119(+)]I; noca-1(ok3692)V/nT1[qIs51](IV;V) |
| OD1511 | ltSi249[pOD1274/pSW098; Pdlg-1delta7::dlg-1::GFP::unc-54-3′ UTR; cb-unc-119(+)]I; ptrn-1(lt1::cb-unc-119+)X |
| OD1512 | ltSi249[pOD1274/pSW098; Pdlg-1delta7::dlg-1::GFP::unc-54-3′ UTR; cb-unc-119(+)]I; noca-1(ok3692)V/nT1[qIs51](IV;V); ptrn-1(lt1::cb-unc-119+)X |
| OD1516 | ltSi458[pOD1477/pSW188; Pnoca-1d::noca-1d(cDNA)::mCherry; cb-unc-119(+)]II; unc-119(ed3)?III; noca-1(ok3692)V/nT1[qIs51](IV;V); ptrn-1(lt1::cb-unc-119+)X |
| OD1517 | ltSi459[pOD1478/pSW189; Pnoca-1e::noca-1e(cDNA)::mCherry; cb-unc-119(+)]II; unc-119(ed3)?III; noca-1(ok3692)V/nT1[qIs51](IV;V); ptrn-1(lt1::cb-unc-119+)X |
| OD1521 | ltSi461[pOD1340/pSW157; Pnoca-1::noca-1abc*gh (STOP in the first exon of isoform f); cb-unc-119(+)]II; unc-119(ed3)?III; noca-1(ok3692)V |
| OD1558 | ltSi518[pOD1338/pSW155; Pnoca-1::noca-1a*cfgh(STOP coden in the first exon of isoform b); cb-unc-119(+)]II; unc-119(ed3)III |
| OD1578 | ltSi523[pOD1339/pSW156; Pnoca-1::noca-1ab*fgh(STOP coden in the first exon of isoform c); cb-unc-119(+)]II; unc-119(ed3)III |
| OD1580 | ltSi518[pOD1338/pSW155; Pnoca-1::noca-1a*cfgh(STOP coden in the first exon of isoform b); cb-unc-119(+)]II; unc-119(ed3)III?; noca-1(ok3692)V |
| OD1600 | ltSi523[pOD1339/pSW156; Pnoca-1::noca-1ab*fgh(STOP coden in the first exon of isoform c); cb-unc-119(+)]II; unc-119(ed3)III?; noca-1(ok3692)V |
| OD1605 | ltSi531[pOD1337/pSW154; Pnoca-1::noca-1*bcfgh(STOP coden in the first exon of isoform a); cb-unc-119(+)]II; unc-119(ed3)III |
| OD1606 | ltSi531[pOD1337/pSW154; Pnoca-1::noca-1*bcfgh(STOP coden in the first exon of isoform a); cb-unc-119(+)]II; unc-119(ed3)III?; noca-1(ok3692)V |
| OD1652 | ltSi540[pOD1343/pSW160; Pnoca-1de::noca-1de::superfolderGFP; cb-unc-119(+)]II; unc-119(ed3)III |
| OD1653 | ltSi541[pOD1505/pSW210; Pdpy-7::PTRN-1(cDNA)::superfolderGFP; cb-unc-119(+)]II; unc-119(ed3)III |
| OD1654 | ltSi542[pOD1506/pSW211; Pptrn-1::PTRN-1(cDNA)::superfolderGFP; cb-unc-119(+)]II; unc-119(ed3)III |
| OD1690 | ltSi561[pOD1508/pSW213; Pptrn-1::noca-1h(457-922)::superfolderGFP; cb-unc-119(+)]II; unc-119(ed3)III |
| OD1691 | ltSi562[pOD1509/pSW214; Pptrn-1::noca-1h(252-922)::superfolderGFP; cb-unc-119(+)]II; unc-119(ed3)III |
| OD1708 | ltSi568[pOD1518/pSW223; Pmex-5::mCherry::PH::tbb-2_3′ UTR; cb-unc-119(+)]I; unc-119(ed3)III |
| OD1709 | ltSi569[oxTi185; pOD1110/pSW008; CEOP3608 TBG-1::mCherry; cb-unc-119(+)]I; unc-119(ed3)III |
| OD1727 | ltSi569[oxTi185; pOD1110/pSW008; CEOP3608 TBG-1::mCherry; cb-unc-119(+)]I; ltSi246[pOD1270/pSW082; Pnoca-1::noca-1abcfgh::superfolderGFP; cb-unc-119(+)]II; unc-119(ed3)III? |
| OD1731 | ltSi568[pOD1518/pSW223; Pmex-5::mCherry::PH::tbb-2_3′ UTR; cb-unc-119(+)]I; ltSi369[pOD1335/pSW152; Pnoca-1h::noca-1hRR::superfolderGFP; cb-unc-119(+)]II; unc-119(ed3)III? |
| OD1737 | ltSi542[pOD1506/pSW211; Pptrn-1::PTRN-1(cDNA)::superfolderGFP; cb-unc-119(+)]II; unc-119(ed3)III?; noca-1(ok3692)V/nT1[qIs51](IV;V); ptrn-1(lt1::cb-unc-119+)X |
| OD1739 | ltSi561[pOD1508/pSW213; Pptrn-1::noca-1h(457-922)::superfolderGFP; cb-unc-119(+)]II; unc-119(ed3)III?; noca-1(ok3692)V/nT1[qIs51](IV;V); ptrn-1(lt1::cb-unc-119+)X |
| OD1740 | ltSi562[pOD1509/pSW214; Pptrn-1::noca-1h(252-922)::superfolderGFP; cb-unc-119(+)]II; unc-119(ed3)III?; noca-1(ok3692)V/nT1[qIs51](IV;V); ptrn-1(lt1::cb-unc-119+)X |
| OD1741 | ltSi570[pOD1527/pSW232; Pdpy-7::GFP::tbb-2::mCHerry::his-11; cb-unc-119(+)]I; unc-119(ed3)III |
| OD1742 | ltSi419[pOD1465/pSW177; Pnoca-1h::ptrn-1(cDNA)::superfolderGFP; cb-unc-119(+)]II; unc-119(ed3)III?; noca-1(ok3692)V/nT1[qIs51](IV;V) |
| OD1780 | ltSi570[pOD1527/pSW232; Pdpy-7::GFP::tbb-2::mCHerry::his-11; cb-unc-119(+)]I; unc-119(ed3)III?; noca-1(ok3692)V/nT1[qIs51](IV;V) |
| OD1781 | ltSi570[pOD1527/pSW232; Pdpy-7::GFP::tbb-2::mCHerry::his-11; cb-unc-119(+)]I; unc-119(ed3)III?; ptrn-1(lt1::cb-unc-119+)X |
| OD1782 | ltSi570[pOD1527/pSW232; Pdpy-7::GFP::tbb-2::mCHerry::his-11; cb-unc-119(+)]I; unc-119(ed3)III?; noca-1(ok3692)V/nT1[qIs51](IV;V); ptrn-1(lt1::cb-unc-119+)X |
| OD1864 | ltSi598[pOD1553/pSW252; Plbp-1::noca-1b::superfolderGFP::opLinker::mCHerry::PH; cb-unc-119(+)]II; unc-119(ed3)III |
| OD1865 | ltSi599[pOD1554/pSW253; Plbp-1::noca-1h(252-922)::superfolderGFP::opLinker::mCHerry::PH; cb-unc-119(+)]II; unc-119(ed3)III |
| OD1866 | ltSi600[pOD1555/pSW254; Plbp-1::noca-1h(457-922)::superfolderGFP::opLinker::mCHerry::PH; cb-unc-119(+)]II; unc-119(ed3)III |
| OD1867 | ltSi601[pOD1542/pSW244; Ppha-4int1::PTRN-1(cDNA)::superfolderGFP; cb-unc-119(+)]II; unc-119(ed3)III |
| OD1869 | ltSi603[pOD1544/pSW246; Prgef-1::PTRN-1(cDNA)::superfolderGFP; cb-unc-119(+)]II; unc-119(ed3)III |
| OD1908 | ltSi598[pOD1553/pSW252; Plbp-1::noca-1b::superfolderGFP::opLinker::mCHerry::histone; cb-unc-119(+)]II; unc-119(ed3)III?; noca-1(ok3692)V/nT1[qIs51](IV;V) |
| OD1909 | ltSi599[pOD1554/pSW253; Plbp-1::noca-1h(252-922)::superfolderGFP::opLinker::mCHerry::histone; cb-unc-119(+)]II; unc-119(ed3)III?; noca-1(ok3692)V/nT1[qIs51](IV;V) |
| OD1910 | ltSi600[pOD1555/pSW254; Plbp-1::noca-1h(457-922)::superfolderGFP::opLinker::mCHerry::histone; cb-unc-119(+)]II; unc-119(ed3)III?; noca-1(ok3692)V/nT1[qIs51](IV;V) |
| OD1911 | ltSi601[pOD1542/pSW244; Ppha-4int1::PTRN-1(cDNA)::superfolderGFP; cb-unc-119(+)]II; unc-119(ed3)III?; noca-1(ok3692)V/nT1[qIs51](IV;V); ptrn-1(lt1::cb-unc-119+)X |
| OD1913 | ltSi603[pOD1544/pSW246; Prgef-1::PTRN-1(cDNA)::superfolderGFP; cb-unc-119(+)]II; unc-119(ed3)III?; noca-1(ok3692)V/nT1[qIs51](IV;V); ptrn-1(lt1::cb-unc-119+)X |
| OD1914 | ltSi219[pOD1248/pSW076; Pmex-5::GFP::PH(PLC1delta1)::operon_linker::mCHerry::his-11; cb-unc-119(+)]I; ptrn-1(lt1::cb-unc-119+)X |
| OD2006 | ltSi541[pOD1505/pSW210; Pdpy-7::PTRN-1(cDNA)::superfolderGFP; cb-unc-119(+)]II; unc-119(ed3)III?; noca-1(ok3692)V/nT1[qIs51](IV;V); ptrn-1(lt1::cb-unc-119+)X |
| OD2074 | ltSi670[pSW268/pOD1786; Pmex-5::noca-1h(252-922)::superfolderGFP::opLinker::mCHerry::PH; cb-unc-119(+)]I; unc-119(ed3)III |
| OD2111 | ltSi673[pSW279/pOD1787; Pdpy-7::tagRFP::tbb-2; cb-unc-119(+)]I; unc-119(ed3)III |
| OD2113 | ltSi673[pSW279/pOD1787; Pdpy-7::tagRFP::tbb-2; cb-unc-119(+)]I; ltSi540[pOD1343/pSW160; Pnoca-1de::noca-1de::superfolderGFP; cb-unc-119(+)]II; unc-119(ed3)III? |
| OD2114 | ltSi673[pSW279/pOD1787; Pdpy-7::tagRFP::tbb-2; cb-unc-119(+)]I; ltSi542[pOD1506/pSW211; Pptrn-1::PTRN-1(cDNA)::superfolderGFP; cb-unc-119(+)]II; unc-119(ed3)III |
| OD2115 | ltSi569[oxTi185; pOD1110/pSW008; CEOP3608 TBG-1::mCherry; cb-unc-119(+)]I; ltSi540[pOD1343/pSW160; Pnoca-1de::noca-1de::superfolderGFP; cb-unc-119(+)]II; unc-119(ed3)III? |
| OD2116 | ltSi569[oxTi185; pOD1110/pSW008; CEOP3608 TBG-1::mCherry; cb-unc-119(+)]I; ltSi542[pOD1506/pSW211; Pptrn-1::PTRN-1(cDNA)::superfolderGFP; cb-unc-119(+)]II; unc-119(ed3)III? |
| OD2396 | mcIs46[pCL08(dlg-1::RFP); cb-unc-119(+)]?; mcSi53[Pdpy-7::EB1::GFP; cb-unc-119(+)]II; noca-1(ok3692)V/nT1[qIs51](IV;V); |
| OD2397 | mcIs46[pCL08(dlg-1::RFP); cb-unc-119(+)]?; mcSi53[Pdpy-7::EB1::GFP; cb-unc-119(+)]II; ptrn-1(lt1::cb-unc-119+)X |
| OD2435 | ltSi569[oxTi185; pOD1110/pSW008; CEOP3608 TBG-1::mCherry; cb-unc-119(+)]I; ltSi202[pVV103; Pspd-2::GFP::SPD-5 reencoded; cb-unc-119(+)]II; unc-119(ed3) III |
| OD2442 | ltSi794[pOD1988/pSW302; Pdpy-7::vhhGFP4::ZIF-1::unc-54_3′ UTR; cb-unc-119(+)]II; unc-119(ed3)III |
| OD2509 | gip-2(lt19[gip-2::GFP]::loxP::cb-unc-119(+)::loxP)I; unc-119(ed3)III |
| OD2624 | gip-2(lt19[gip-2::GFP]::loxP::cb-unc-119(+)::loxP)I; ltSi794[pOD1988/pSW302; Pdpy-7::vhhGFP4::ZIF-1::unc-54_3′ UTR; cb-unc-119(+)]II; unc-119(ed3)III?; noca-1(ok3692)V/nT1[qIs51](IV;V) |
| OD2625 | gip-2(lt19[gip-2::GFP]::loxP::cb-unc-119(+)::loxP)I/hT2[bli-4(e937) let-?(q782) qIs48](I;III); ltSi794[pOD1988/pSW302; Pdpy-7::vhhGFP4::ZIF-1::unc-54_3′ UTR; cb-unc-119(+)]II; unc-119(ed3)III?; ptrn-1(lt1::cb-unc-119+)X |
| OD2626 | gip-2(lt19[gip-2::GFP]::loxP::cb-unc-119(+)::loxP)I; ltSi794[pOD1988/pSW302; Pdpy-7::vhhGFP4::ZIF-1::unc-54_3′ UTR; cb-unc-119(+)]II; unc-119(ed3)III?; ptrn-1(lt1::cb-unc-119+)X |
| ML1654 | mcIs46[pCL08(dlg-1::RFP); cb-unc-119(+)]?; mcSi53[Pdpy-7::EB1::GFP; cb-unc-119(+)]II |
Table 2
Oligos used for dsRNA production
| Gene | Oligonucleotide 1 | Oligonucleotide 2 | Template | mg/ml |
|---|---|---|---|---|
| T09E8.1 (noca-1) | AATTAACCCTCACTAAAGGggcgaacaaggatcgtaaag | TAATACGACTCACTATAGGctgcatttgtttgaccatgc | N2 cDNA | 1.8 |
| T09E8.1h (noca-1h) | AATTAACCCTCACTAAAGGgcttgcaataactgctggaa | TAATACGACTCACTATAGGaagcgactcggttccttttt | N2 cDNA | 1.1 |
| F58A4.8 (tbg-1) | AATTAACCCTCACTAAAGGctcaagccttctggaaatcg | TAATACGACTCACTATAGGccatgctcttcagcaacg | N2 cDNA | 1.1 |
| F26E4.8 (tba-1) | AATTAACCCTCACTAAAGGccgatactggaaacggaaga | TAATACGACTCACTATAGGtggtgtaacttggacggtca | N2 cDNA | 1.5 |
Table 3
Oligos used in antibody production
| Target | Oligonucleotide 1 | Oligonucleotide 2 | Template |
|---|---|---|---|
| NOCA-1 | ttgaattcCTCcgattgcaagaaatga | ttgaattcTTAgagttcttcaactgctcg | N2 cDNA |
| PTRN-1 | aagttctgttccaggggcccAAGGAGCTCGGTGCTGAG | agtcgacccgggaattcttaGTTATTCTTATGAGCCGGAGTTC | N2 cDNA |
Download links
A two-part list of links to download the article, or parts of the article, in various formats.
Downloads (link to download the article as PDF)
Open citations (links to open the citations from this article in various online reference manager services)
Cite this article (links to download the citations from this article in formats compatible with various reference manager tools)
NOCA-1 functions with γ-tubulin and in parallel to Patronin to assemble non-centrosomal microtubule arrays in C. elegans
eLife 4:e08649.
https://doi.org/10.7554/eLife.08649


