Attenuation of AMPK signaling by ROQUIN promotes T follicular helper cell formation
- Australian National University, Australia
- Baker IDI Heart and Diabetes Institute, Australia
- Walter and Eliza Hall Institute of Medical Research, Australia
- McGill University, Canada
- Garvan Institute of Medical Research, Australia
Figures
Figure 1 with 3 supplements
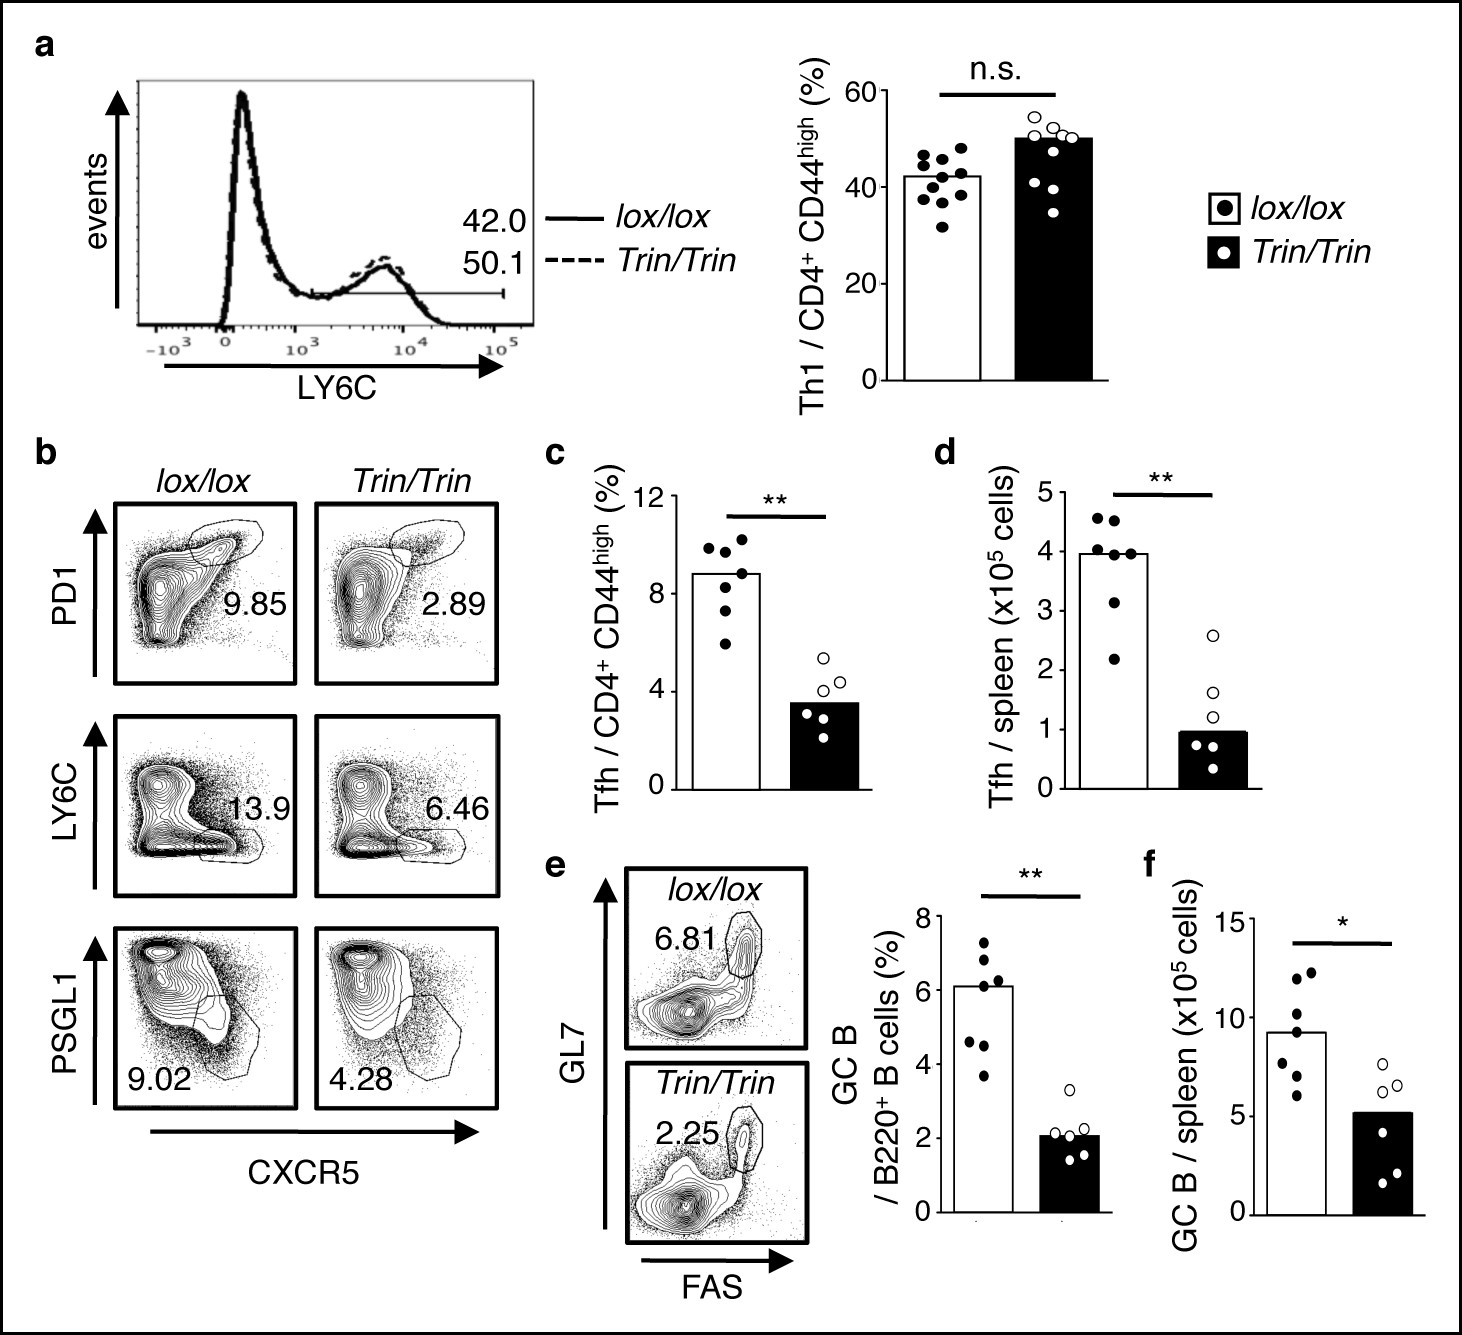
ROQUIN RING deletion in T cells preferentially controls Tfh cell formation.
(a-f) Flow cytometric examination of mice d10 post-LCMV infection. (a) Proportion of LY6C+ total Th1 cells from CD4+CD44high T cells. (b) Identification of total Tfh cells pre-gated on CD4+CD44 high T cells. (c) Proportion of PD1highCXCR5high Tfh cells from CD4+CD44high T cells. (d) PD1highCXCR5highCD44 high Tfh cell numbers from spleen. (e) Proportion and (f) cell count of GL7 highFAShigh GC B cells in spleen. Data are pooled from three independent experiments (n = 2–3). Statistics were calculated by Student’s t-test, n.s., not significant; *p<0.05; **p<0.005. Dot symbols, individual mice; columns, median.
Figure 1—figure supplement 1
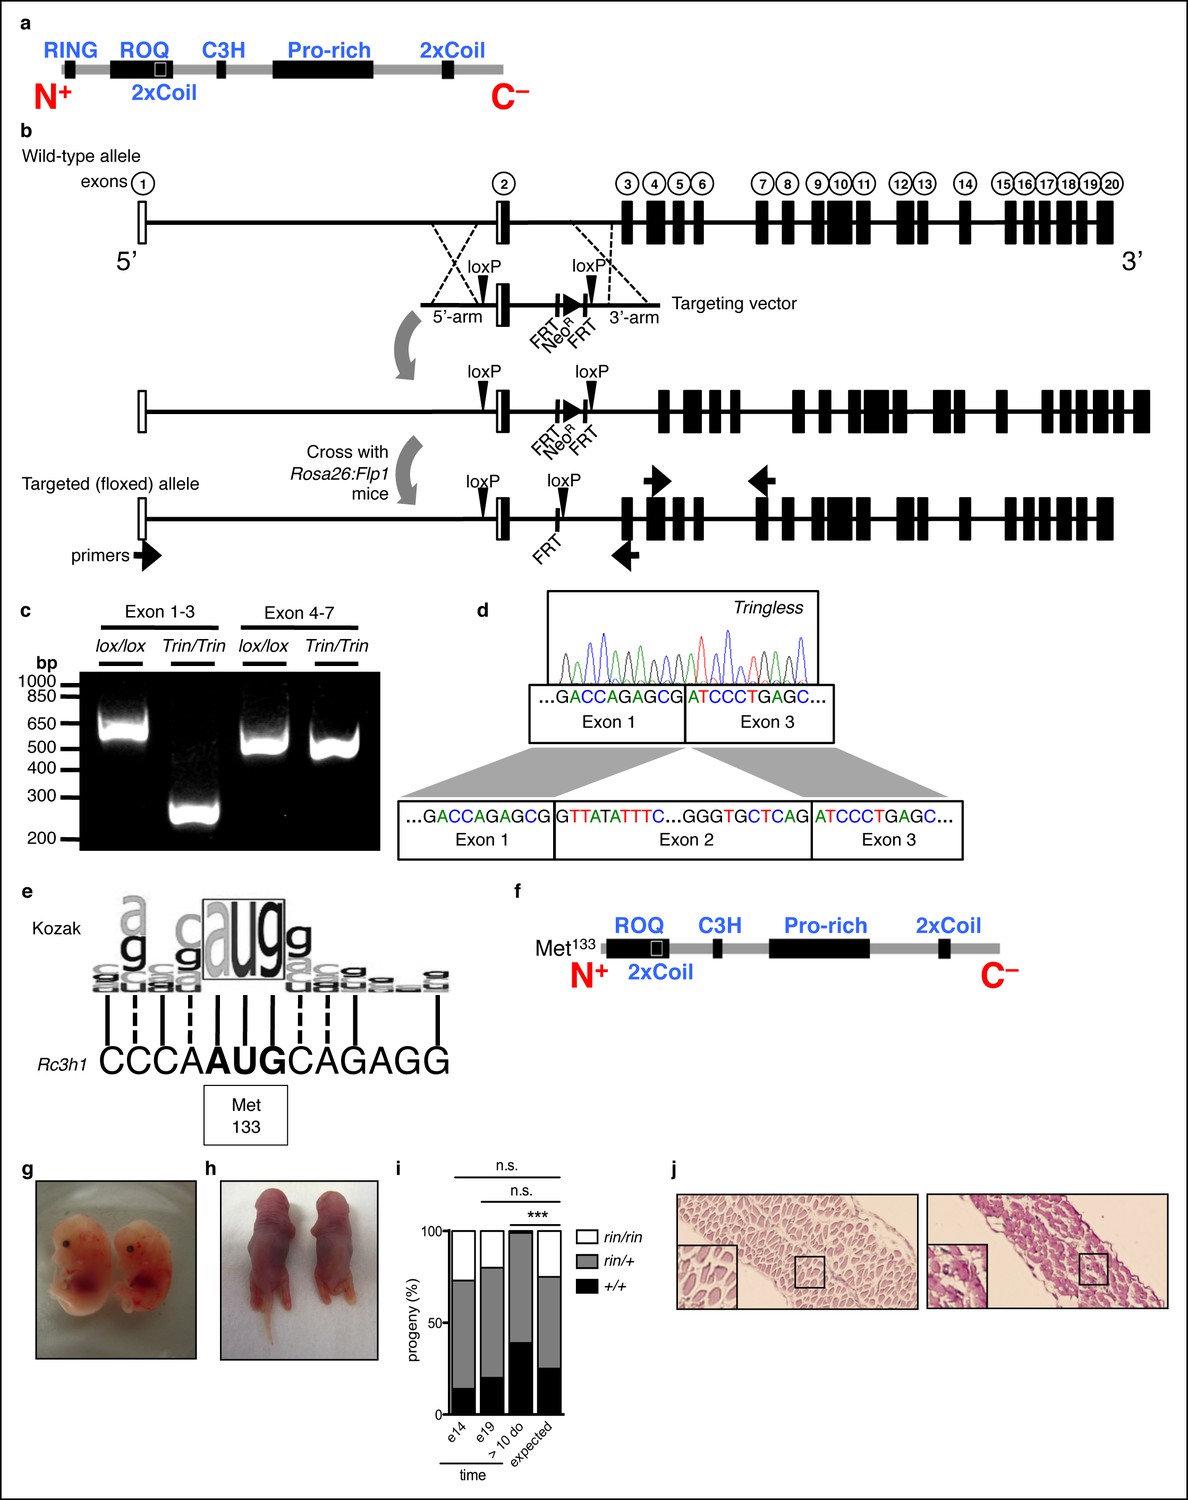
Generation of mice with a ROQUIN RING deletion.
(a) Secondary structure of mammalian ROQUIN protein. (b) Generation of ringless or Tringless mice with a deletion of Rc3h1 exon 2 when crossed to Rosa:Cre or Lck:Cre transgenic strains, respectively. White boxes, non-coding exons; black boxes, protein encoding exons; NeoR, Neomycin resistance cassette. (c,d) Deletion of Rc3h1 exon 2 detected in CD4+ T cells by Polymerase chain reaction (PCR; c) and sequencing (d) from cDNA. (e) Alignment of the mammalian Kozak sequence and alternative translational start site at Met133 in Rc3h1ringless. Solid lines, identical; dotted lines, similar. (f) ROQUIN protein map lacking the 14.5 kDa RING finger with translational rescue at Met133. (g,h) Wild-type (left) ringless (right) embryos harvested at E14 (g) and E19 (h) from timed matings between ringless heterozygotes. (i) Embryonic genotyping and litter count from ringless heterozygous intercrosses (n = 100 per time point). Statistics were calculated by Chi-square test, d.f. = 2 (j) Periodic acid-Schiff staining of the thoracic diaphragm from preterm animals taken at E19. Wild-type (left) and ringless (right) are shown. Data are representative of two independent experiments.
Figure 1—figure supplement 2
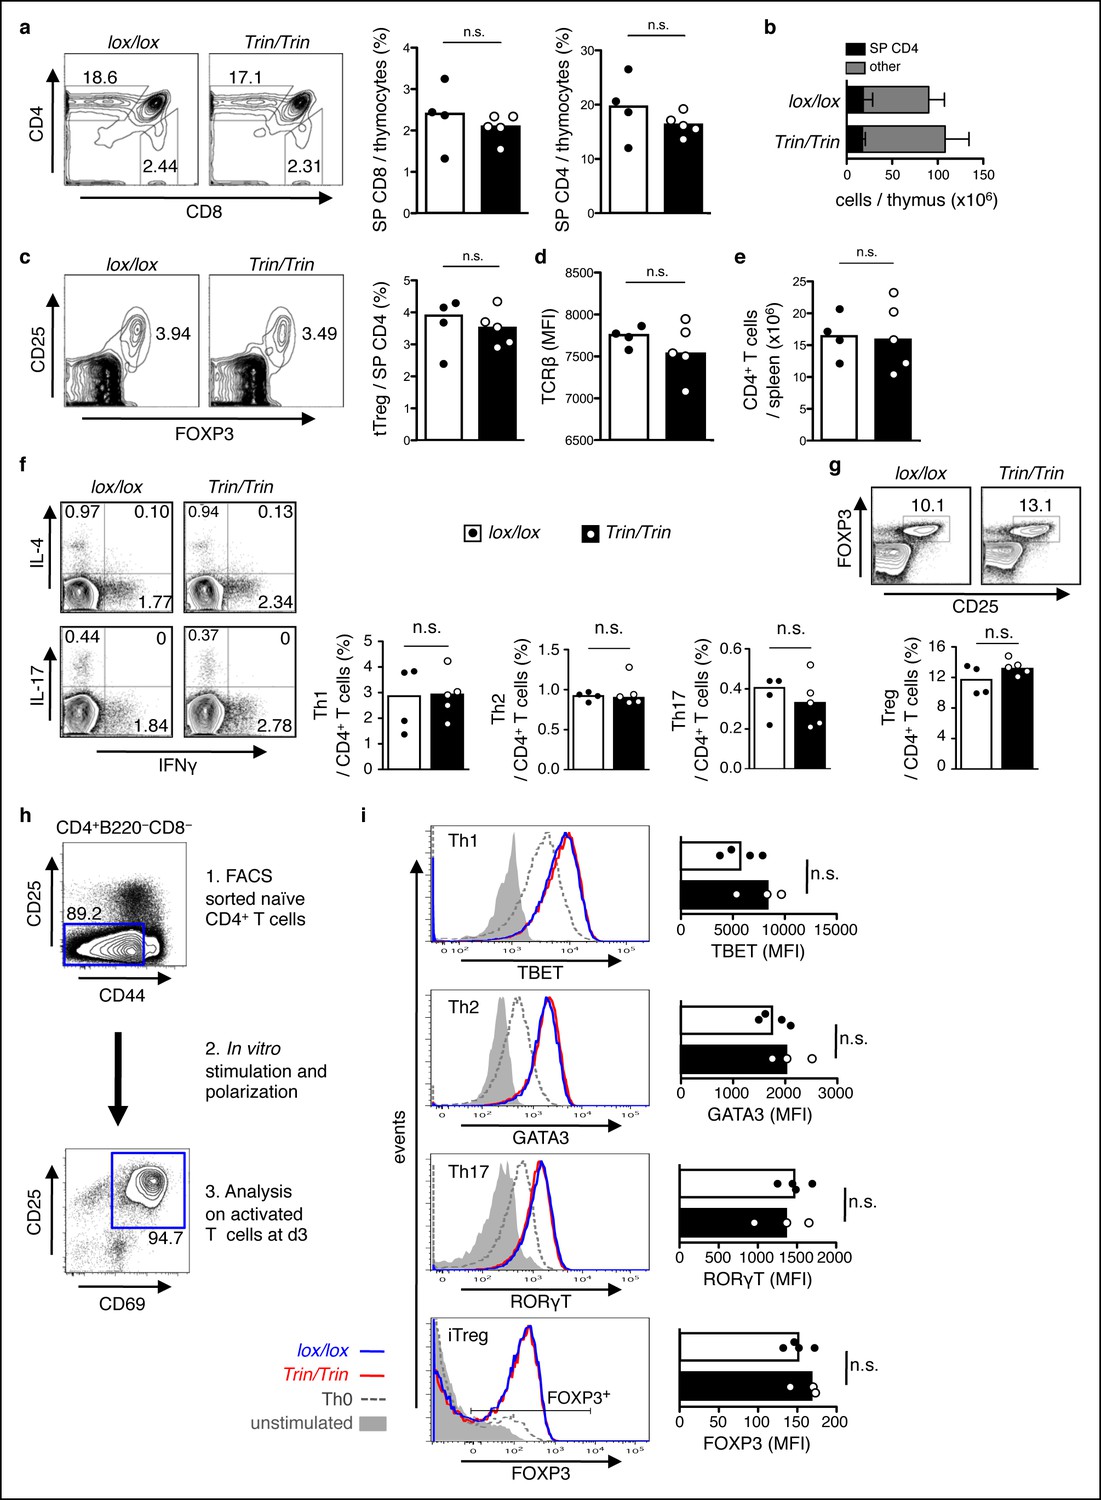
Phenotype of mice with a T cell-specific ROQUIN RING deletion.
(a-e) Flow cytometric assessment of thymocyte development showing proportion of single positive (SP) CD4 and SP CD8 thymocytes (a), total number of SP CD4 thymocytes (b), proportion and count of FOXP3+CD25+ thymic regulatory T cells (tTreg) from SP CD4 thymocytes (c), surface expression TCRβ on SP CD4 thymocytes (d), and cell number of peripheral CD4+ T cell output in the spleen (e). (f,g) d8 post-sheep red blood cell (SRBC) immunization of mice showing the proportion of IFNγ+ Th1, IL4+ Th2, and IL-17+ Th17 cells (f), and the proportion of FOXP3+CD25+ Tregs (g) from splenic total CD4+ T cells. Data are representative of four independent experiments. (h-i) In vitro CD4+ T cell differentiation assay on naive T cells cultured under Th1, Th2, Th17, or iTreg-polarizing conditions and analyzed d3 by flow cytometry (h) to measure expression of Th cell transcription factors in CD25+CD69+ activated T cells and on FOXP3+ activated T cells for iTreg cultures (i). Statistics were calculated by Student’s t-test, n.s., not significant; Dot symbols, individual mice; columns, median.
Figure 1—figure supplement 3
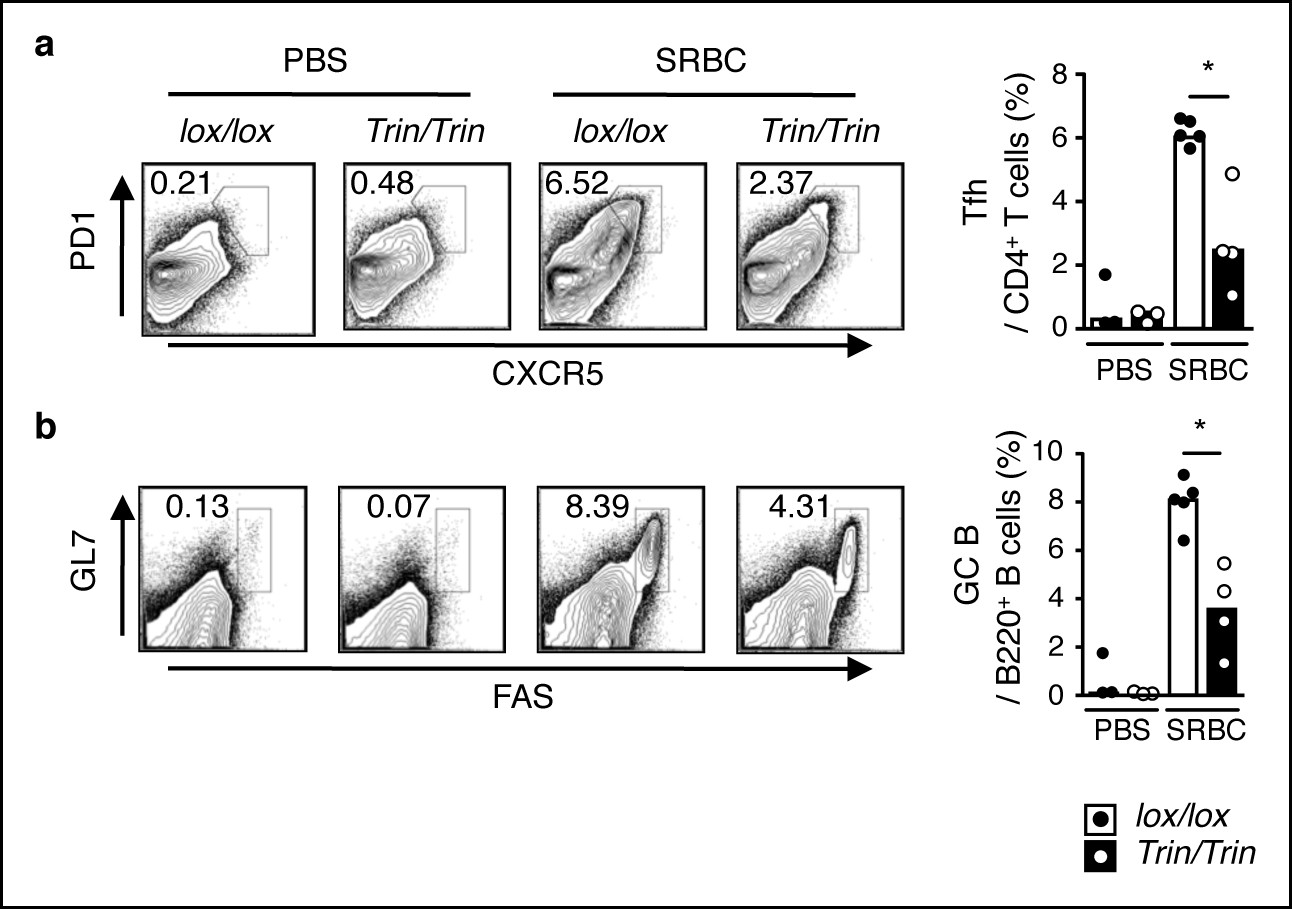
Phenotype of SRBC-immunized mice with a T cell-specific ROQUIN RING deletion.
(a-c) Flow cytometric analysis of d8 post-sheep red blood cell (SRBC) immunized mice showing the frequency of PD1highCXCR5high Tfh cells from total CD4+ T cells (a), GL7highFAShigh germinal center (GC) B cells from total B220+ B cells in the spleen (b) compared to phosphate-buffered saline (PBS) injected control animals. Data are representative of four independent experiments. Statistics were calculated by Student’s t-test, *p <0.05; Dot symbols, individual mice; columns, median.
Figure 2
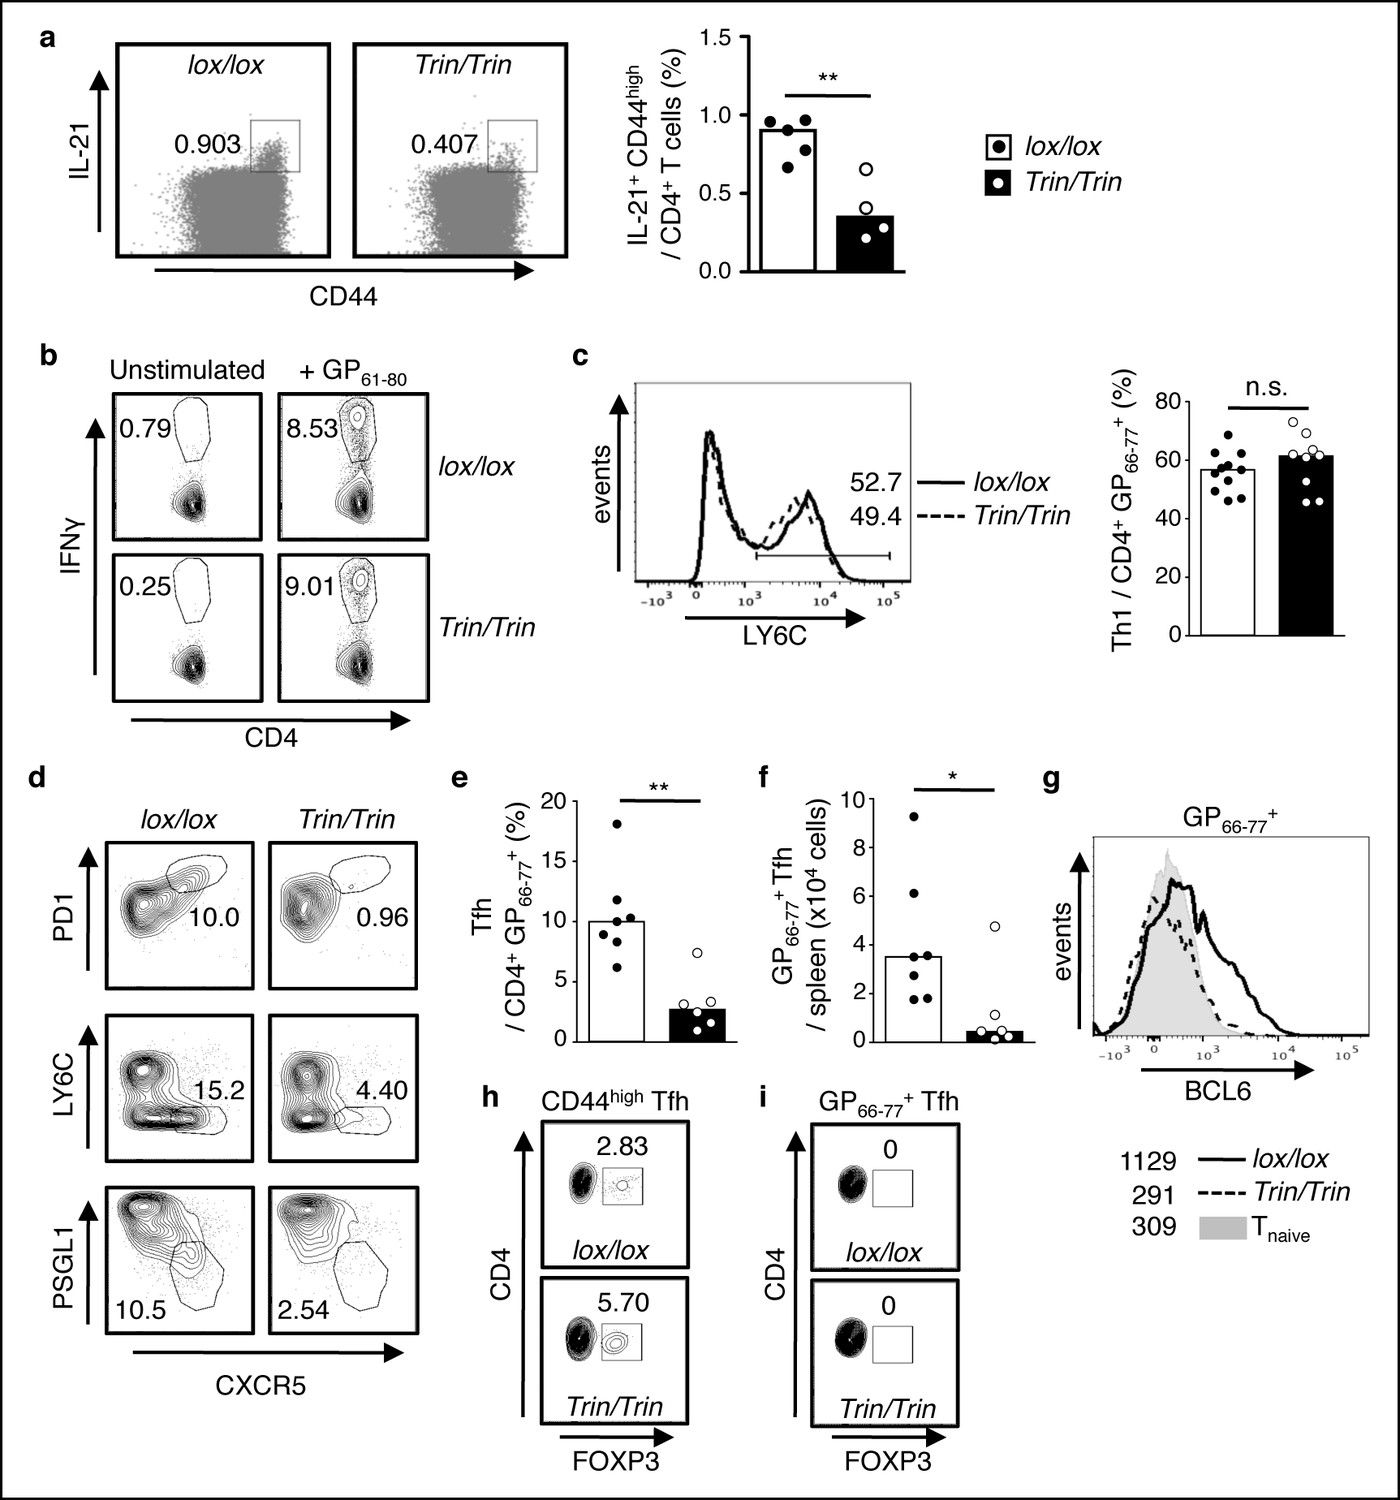
Functional competency of ROQUIN RING deleted Tfh cell responses.
(a) Flow cytometric analysis of mice 8d after sheep red blood cell (SRBC) immunization showing the proportion of IL-21+CD44high effectors from total CD4+ T cells in the spleen. Data are representative of two independent experiments. (b-i) Flow cytometric examination of mice d10 post-lymphocytic choriomeningitis virus (LCMV) infection. (b) Proportion of IFNγ+ Th1 cells gated from total CD4+ T cells after GP61-80 peptide stimulation ex vivo. (c) Proportion of LY6C+ Th1 cells from virus-specific CD4+GP66-77+ T cells. (d) Identification of virus-specific Tfh cells pre-gated on CD4+GP66-77+ T cells. (e) Proportion of PD1highCXCR5high Tfh cells from virus-specific CD4+GP66-77+ T cells. (f) Virus-specific CD4+PD1highCXCR5highGP66-77+ Tfh cell numbers in spleen. (g) Representative histograms of BCL6 expression in virus-specific CD4+GP66-77+ T cells. Values included show median MFI for each genotype. (h) Proportion of FOXP3+ Tfr cells within the total CD4+CD44highPD1highCXCR5high Tfh gate. (i) Proportion of FOXP3+ Tfr cells within the virus-specific CD4+GP66-77+PD1highCXCR5high Tfh gate. Data are pooled from three independent experiments (n = 2–3). Statistics were calculated by Student’s t-test, n.s., not significant; *p<0.05; **p<0.005; Dot symbols, individual mice; columns, median.
Figure 3 with 1 supplement
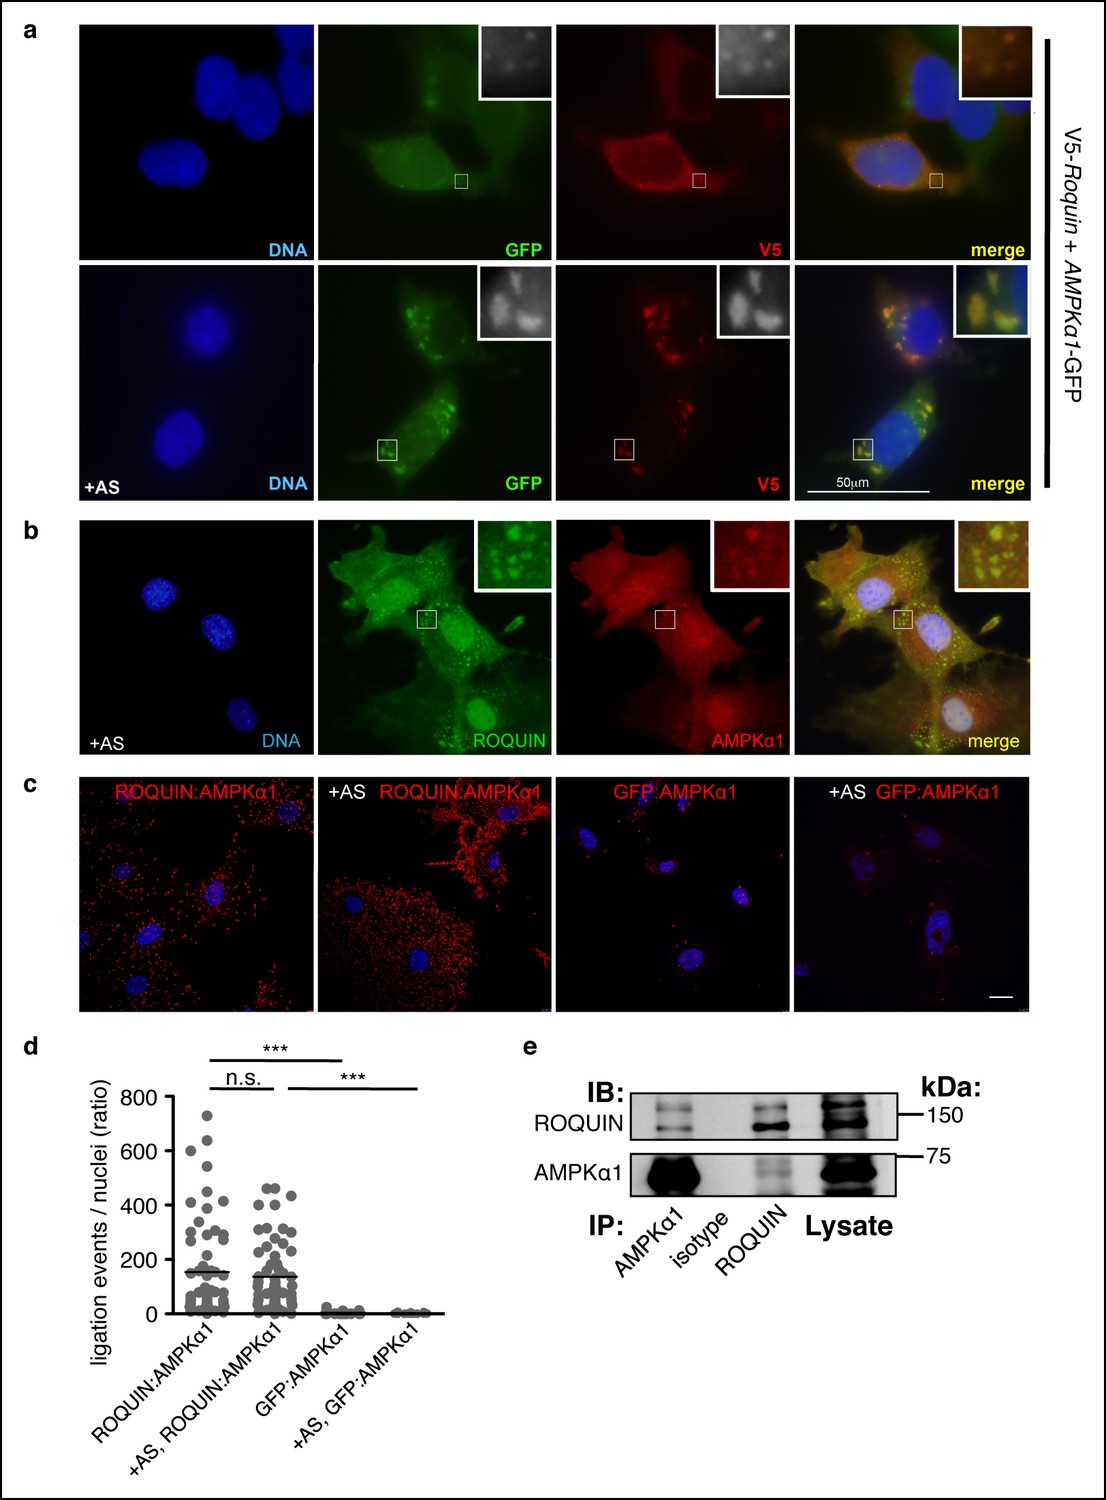
ROQUIN preferentially colocalizes and binds with the α1 subunit of AMPK.
(a) Colocalization of V5-ROQUIN and AMPKα1-GFP ectopically expressed in resting (top) and 1 mM arsenite (AS)-treated (bottom) HEK293T cells. Representative of three independent experiments. (b) Colocalization of endogenous ROQUIN and AMPKα1 in primary (mouse embryonic fibroblasts) MEFs post-arsenite (AS) treatment. Representative of three independent experiments. (c) Proximity ligation assays (PLAs) performed on primary C57BL/6 MEFs showing interactions between endogenously expressed ROQUIN and AMPKα1 in resting cells (ROQUIN:AMPKα1) and in cells stressed with 1 mM arsenite (+AS, ROQUIN:AMPKα1). Negative control PLAs (GFP:AMPKα1) detecting non-expressed GFP and endogenous AMPKα1 background are also displayed. Blue, DAPI stained nuclei; Red, ligation events, Scale bar, 20 μm. Representative of three independent experiments. (d) Quantitative analysis of PLAs showing mean ligation events per cell (nucleus) for each field of view on a confocal microscope. Individual dots represent a single field of view; bar per column represents the sample mean. Statistics were calculated by one-way ANOVA with Bonferroni’s multiple comparisons test after log transformation of ratio values, n.s., not significant; ***p<0.0005. (e) Reciprocal coimmunoprecipitation of ROQUIN and AMPKα1 endogenously expressed in EL4 cells. IB, immunoblot; IP, immunoprecipitated.
Figure 3—figure supplement 1
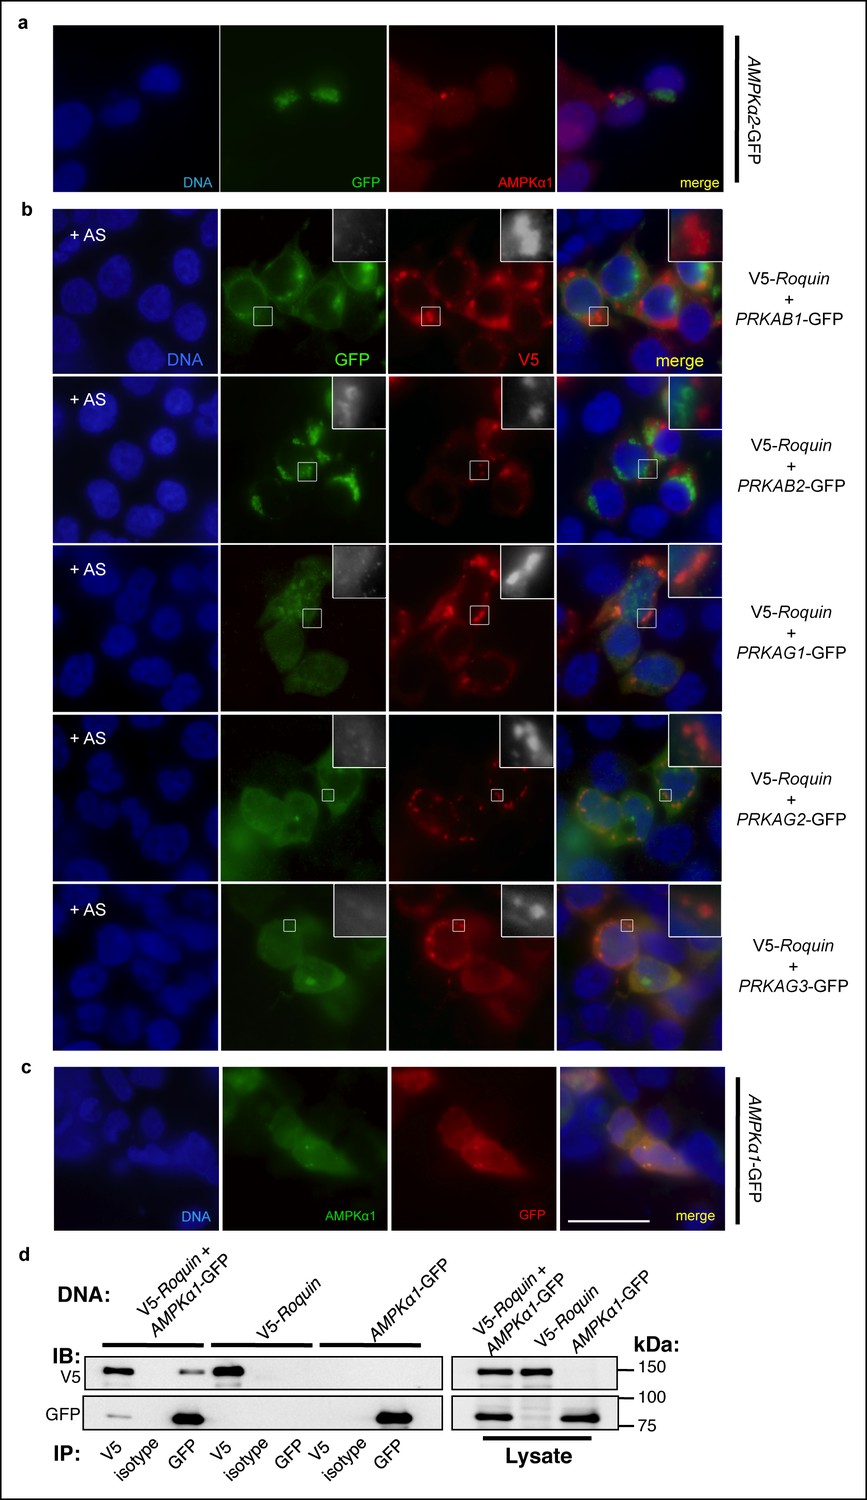
Association of AMPK subunits with ROQUIN.
(a) Detection of AMPKα1 by immunostaining primary MEFs (as shown in main Figure 3b) was achieved using an α1 isoform-specific immunofluorescence-grade antibody exhibiting no cross-reactivity with AMPKα2-GFP expressed in HEK293T cells. (b) Protein localization of V5-ROQUIN and carboxy terminal GFP fusion constructs of AMPK regulatory subunits ectopically expressed in HEK293T cells and analyzed by immunofluorescence microscopy. Data are representative of two independent experiments. (c) Detection of negative control PLAs (GFP:AMPKα1; as shown in main Figure 3c) was achieved using anti-GFP antibody titrated by immunostaining transfected HEK293T cells expressing AMPKα1-GFP fusion protein. Blue, DAPI-stained nuclei; Red, anti-GFP stain; Green, anti-AMPKα1 stain; Scale bar, 50 μm. (d) Reciprocal coimmunoprecipitation of V5-ROQUIN and AMPKα1-GFP over-expressed in HEK293T cells. Data are representative of four independent experiments. IB, immunoblot; IP, immunoprecipitated.
Figure 4
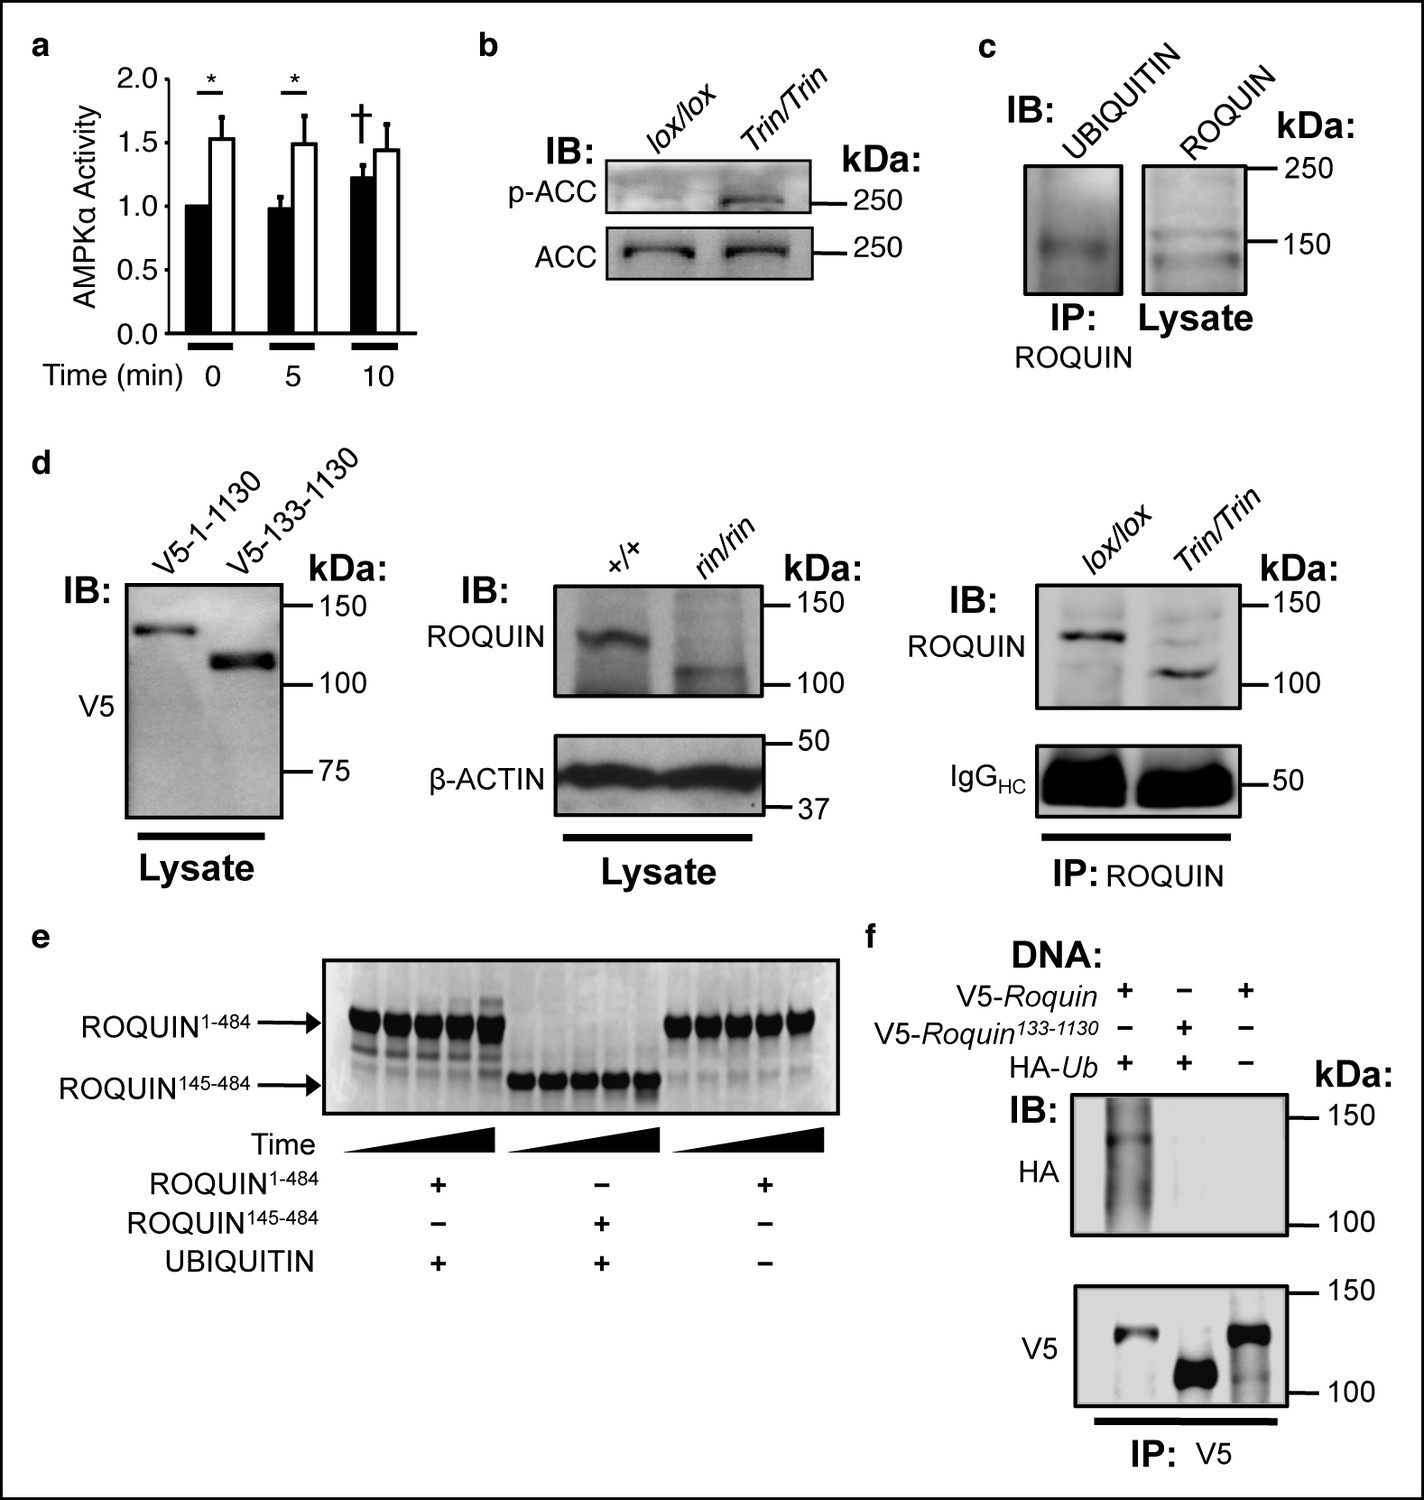
The ROQUIN RING finger is required for autoubiquitination and negative regulation of AMPK.
(a) In vitro kinase assay of AMPKα in isolated CD4+ T cells during an anti-CD3 and -CD28 activation time-course. Data are pooled from two independent experiments and normalized to unstimulated wild-type (n = 5). Black columns, floxed wild-type; white columns, Tringless. Statistics were calculated by Student’s t-test, *p<0.05. †p <0.05 for wild-type at 10 min vs. wild-type at 0 and 5 min. columns, mean; error bars, s.e.m. (b) Phospho-blot of endogenous ACC Ser79 in resting CD4+ T cells. Representative of three independent experiments. IB, Immunoblot. (c) Ubiquitin immunobDot of endogenous ROQUIN immunoprecipated from EL4 cells (d) Immunoblot of V5-tagged ROQUIN1-1130 and ROQUIN133-1130 in transfected HEK293T cells (left), endogenous ROQUIN in ringless primary MEFs (center), immunoprecipitated ROQUIN in Tringless thymocytes (right). (e) In vitro autoubiquitination assay for ROQUIN wild-type peptide (residues 1–484) and RING finger deleted peptide (residues 145–484). Five consecutive lanes show the extent of ROQUIN autoubiquitination of the same in vitro reaction at 0, 1, 2, 4, and 16 h. (f) Cellular ubiquitination assay for full length V5-ROQUIN and RING-deleted V5-ROQUIN133-1130 ectopically expressed in HEK293T cells with HA-Ub. Data are representative of three independent experiments. IB, immunoblot; IP, immunoprecipitated.
Figure 5
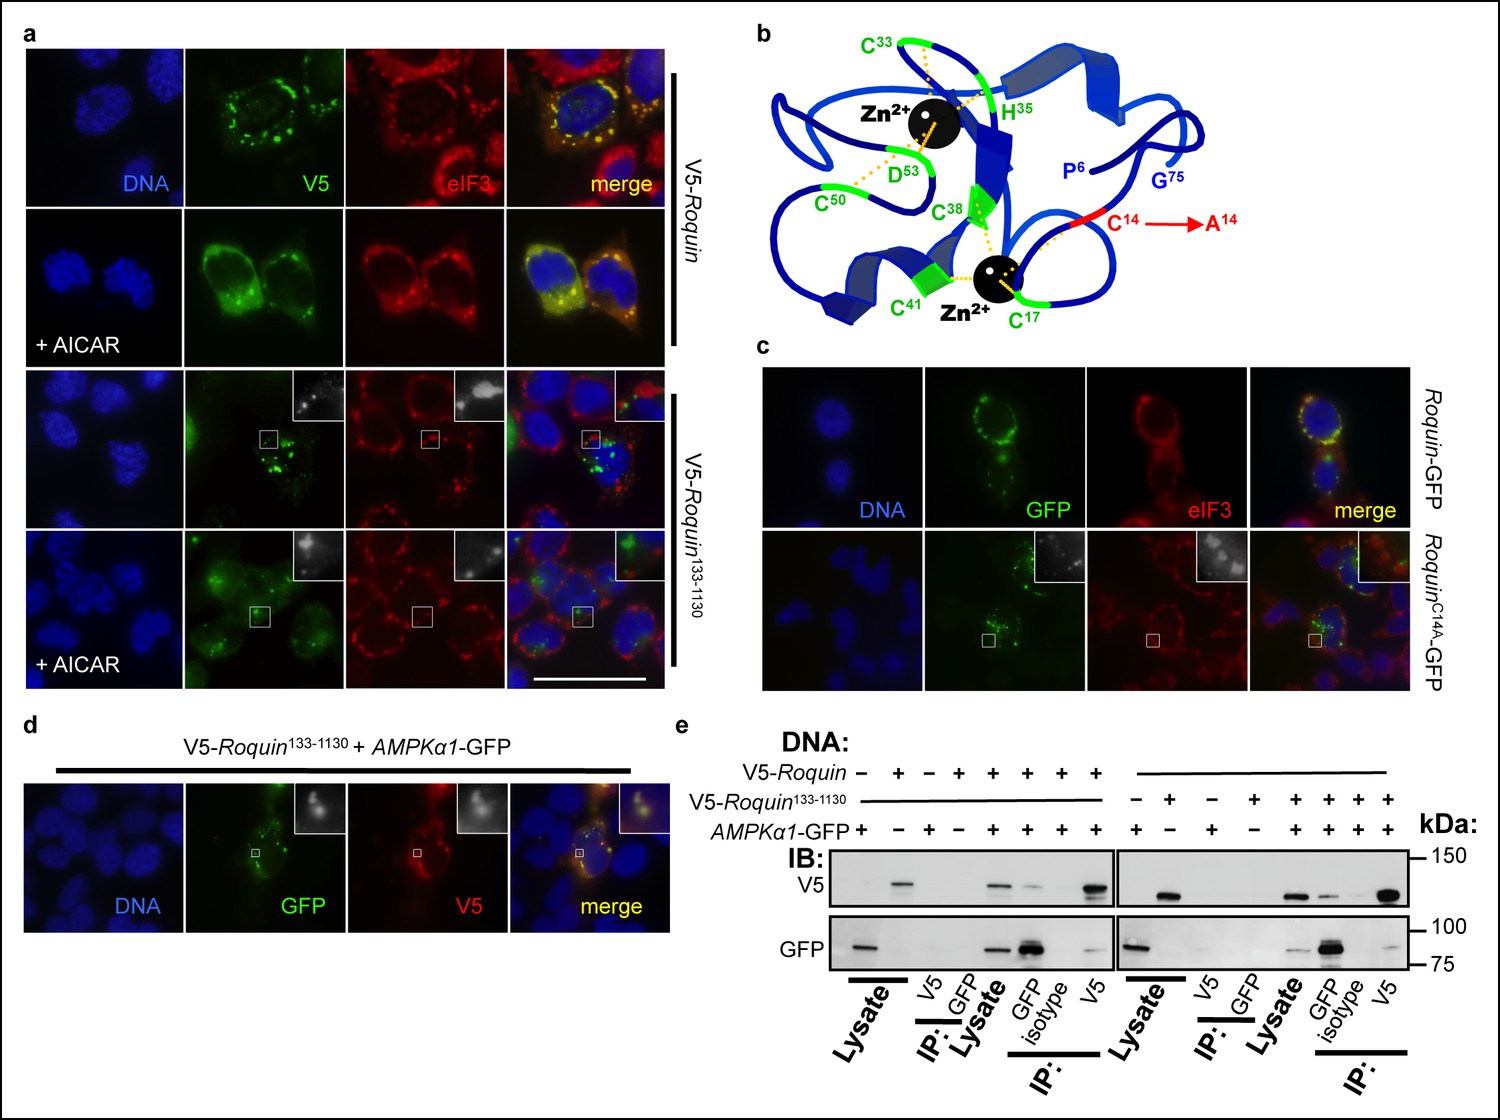
ROQUIN RING activity controls its localization to stress granules.
(a) Colocalization of over-expressed full length V5-tagged ROQUIN or ROQUIN133-1130 with endogenous eIF3 in HEK293T cells stressed with 1 mM arsenite (AS) for 1 hr with or without 2 mM AICAR. Scale bar, 50 μm. (b) Crystal structure of ROQUIN peptide showing amino terminal residues 6 to 75 incorporating the RING domain. Black, zinc cation; green, zinc-coordinating residue, red, zinc-coordinating Cys14 targeted for mutagenesis; yellow, zinc-chelating interaction. Data are based on structural coordinates we had previously determined (Srivastava et al., 2015) and deposited in the Protein Data Bank, accession code 4TXA. (c) Colocalization of over-expressed full length GFP-tagged ROQUIN or ROQUINC14A mutant with endogenous eIF3 in HEK293T cells stressed with 1 mM arsenite for 1 hr. (d) Colocalization of ROQUIN133-1130 with AMPKα1 when over-expressed in HEK293T cells immediately after 1 mM arsenite exposure for 1 hr. (e) Reciprocal coimmunoprecipitation of full length ROQUIN or ROQUIN133-1130 and AMPKα1 over-expressed in HEK293T cells. IB, immunoblot; IP, immunoprecipitated.
Figure 6 with 2 supplements
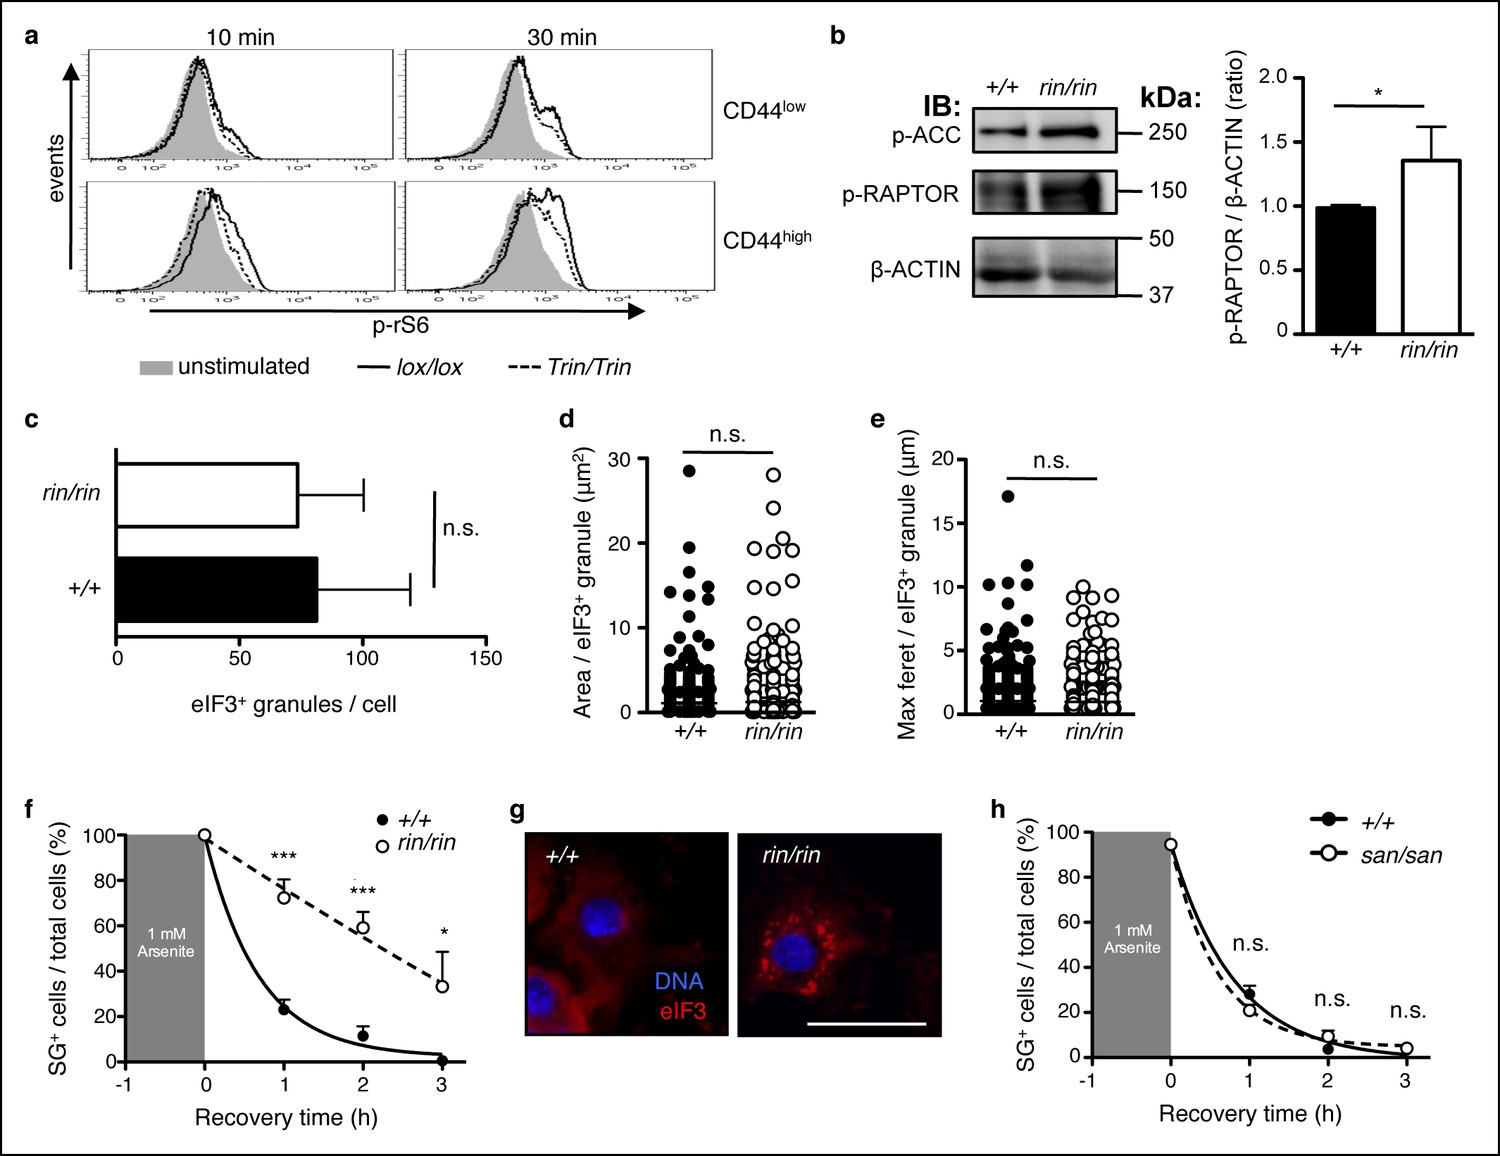
ROQUIN RING signaling regulates stress granule responses to promote mTOR.
(a) Flow cytometric analysis of phospho-rS6 Ser235/236 in CD44low or CD44high anti-CD3 and anti-CD28 stimulated CD4+ T cells (n = 4–6). (b) Phosphoblot of ACC Ser70 and RAPTOR Ser792 in primary mouse embryonic fibroblasts (MEFs) recovered in complete DMEM for 3 hr after 1 hr of 1 mM arsenite treatment (left). Quantitative ratios of phosphorylated RAPTOR to β-ACTIN input based in phosphoblot MFI readings (right). IB, immunoblot. (c-e) Analysis of stress granule induction in primary MEFs analyzed by fluorescence microscopy after 1 hr of 1 mM arsenite stress treatment showing counts of eIF3+ granules per cell (c), and size of individual eIF3+ granules in freshly arsenite-stressed primary MEFs based on area (d) and maximum feret (e). (f) Proportion of recovering primary MEFs exhibiting cytoplasmic eIF3+ stress granules (SG) after arsenite-mediated stress (n >30 per time point, with each n replicate representing a single field of view displaying 1–7 adherent cells). Columns, mean; error bars, s.d. (g) Representative micrographs displaying recovered primary MEFs at 3 hr post-arsenite stress. Scale bar, 50 μm. Statistics were calculated by Student’s t-test, n.s., not significant; *p<0.05; ***p<0.0005. Data are representative of three independent double blind experiments. (h) Proportion of primary MEFs with eIF3+ stress granules after 1 hr of 1 mM arsenite treatment comparing wild-type and sanroque MEFs recovering in complete DMEM media. Data are representative of two independent experiments (n >30 per time point, with each n replicate representing a single field of view displaying 1–6 adherent cells). Error bars, s.d. Statistics were calculated by Student’s t-test, n.s., not significant.
Figure 6—figure supplement 1
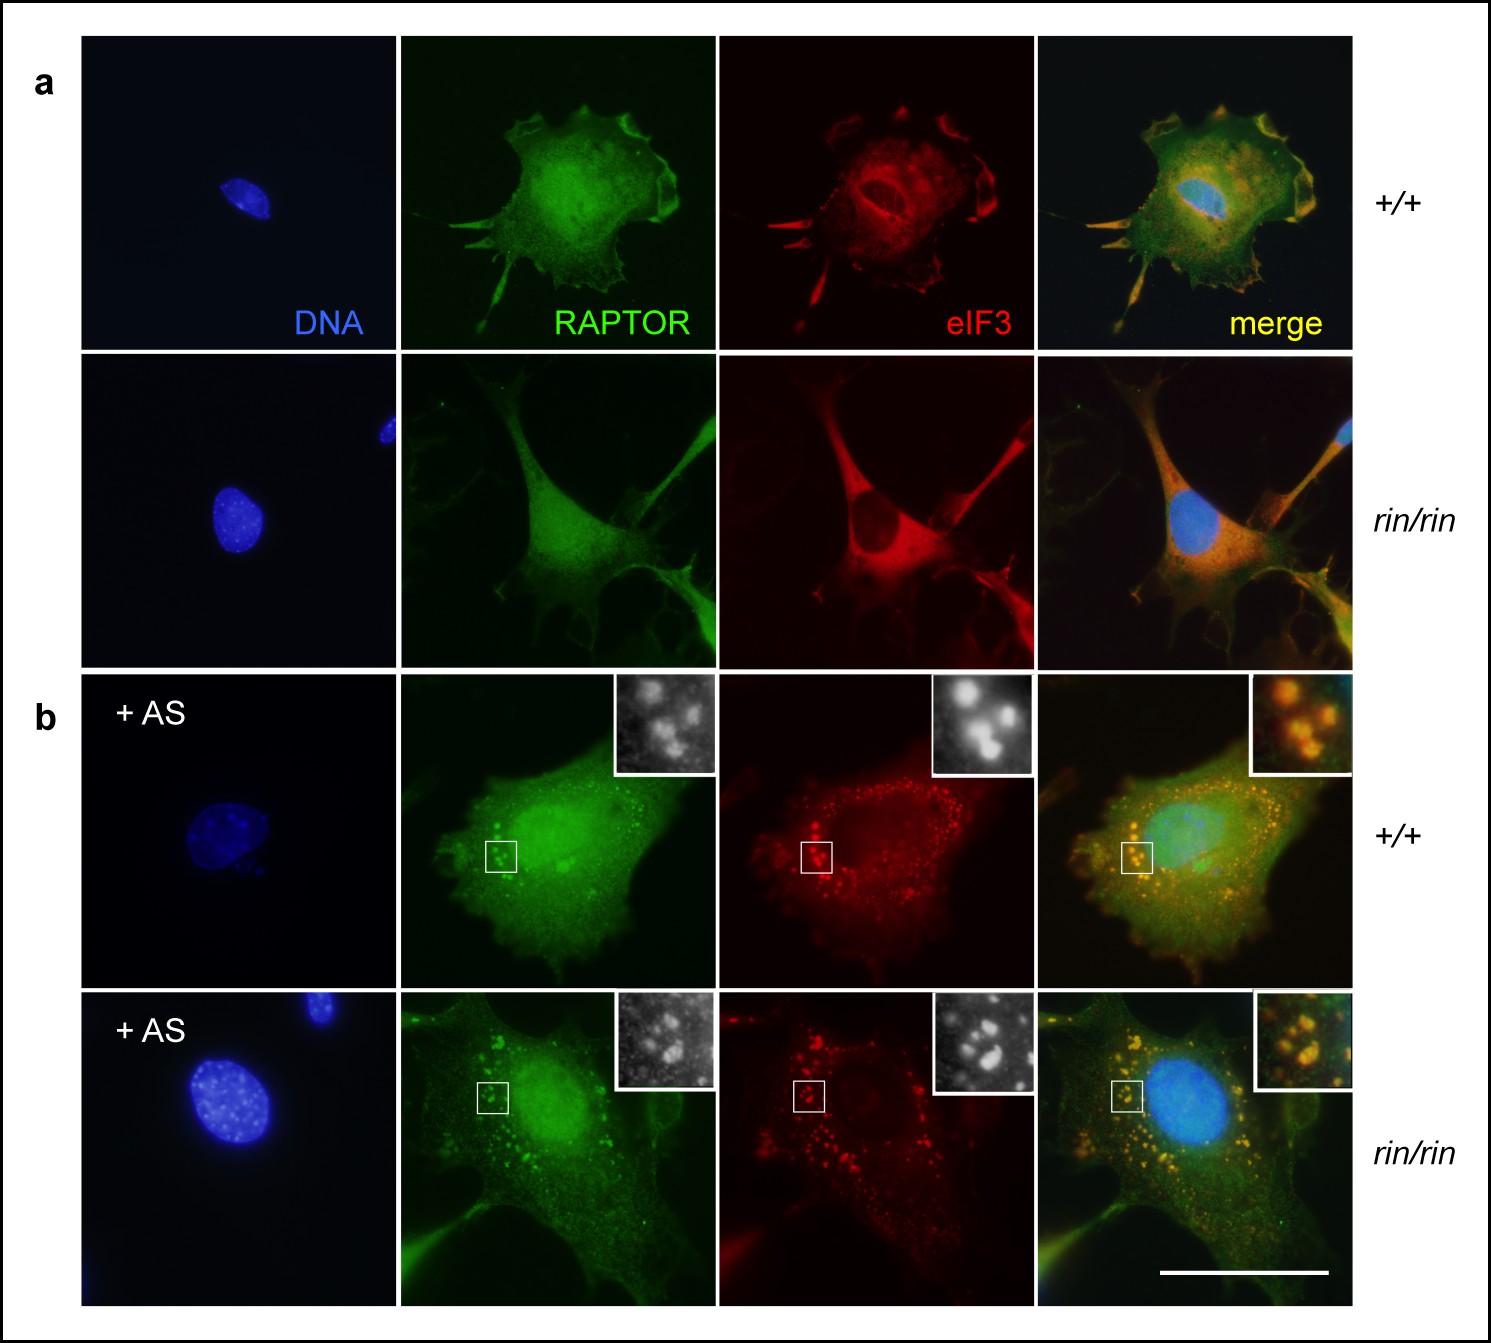
Stress granule sequestration of RAPTOR.
(a,b) Colocalization of RAPTOR and eIF3+ stress granules in resting (a) and 1 mM arsenite (AS)-stressed (b) primary mouse embryonic fibroblasts derived from C57BL/6 timed matings. Data are representative of three independent experiments.
Figure 6—figure supplement 2
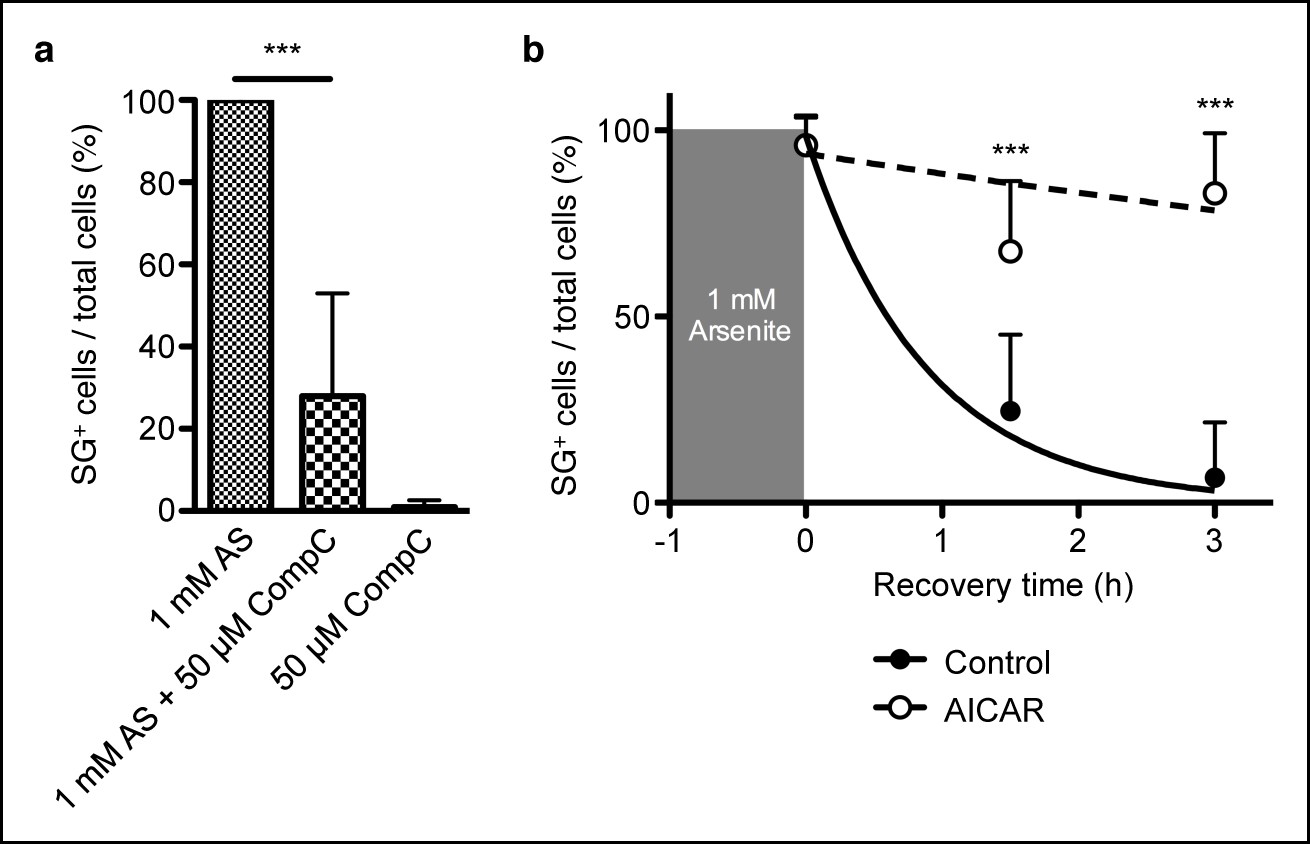
AMPK controls stress granule formation and maintenance.
(a) Proportion of C57BL/6 primary mouse embryonic fibroblasts (MEFs) showing cytoplasmic eIF3+ stress granules (SG) immediately after cellular exposure to 1 mM arsenite (AS) for 30 min with or without 50 μM Compound C (CompC). (b) Proportion of primary MEFs with eIF3+ stress granules recovering in complete DMEM media after 1 hr of 1 mM AS treatment comparing cultures with or without 2 mM AICAR added during both AS treatment and recovery period. Data are representative of three independent experiments (n >30 per time point, with each n replicate representing a single field of view displaying 1–6 adherent cells). Error bars, s.d. Statistics were calculated by Student’s t-test, ***p<0.0005.
Figure 7 with 1 supplement
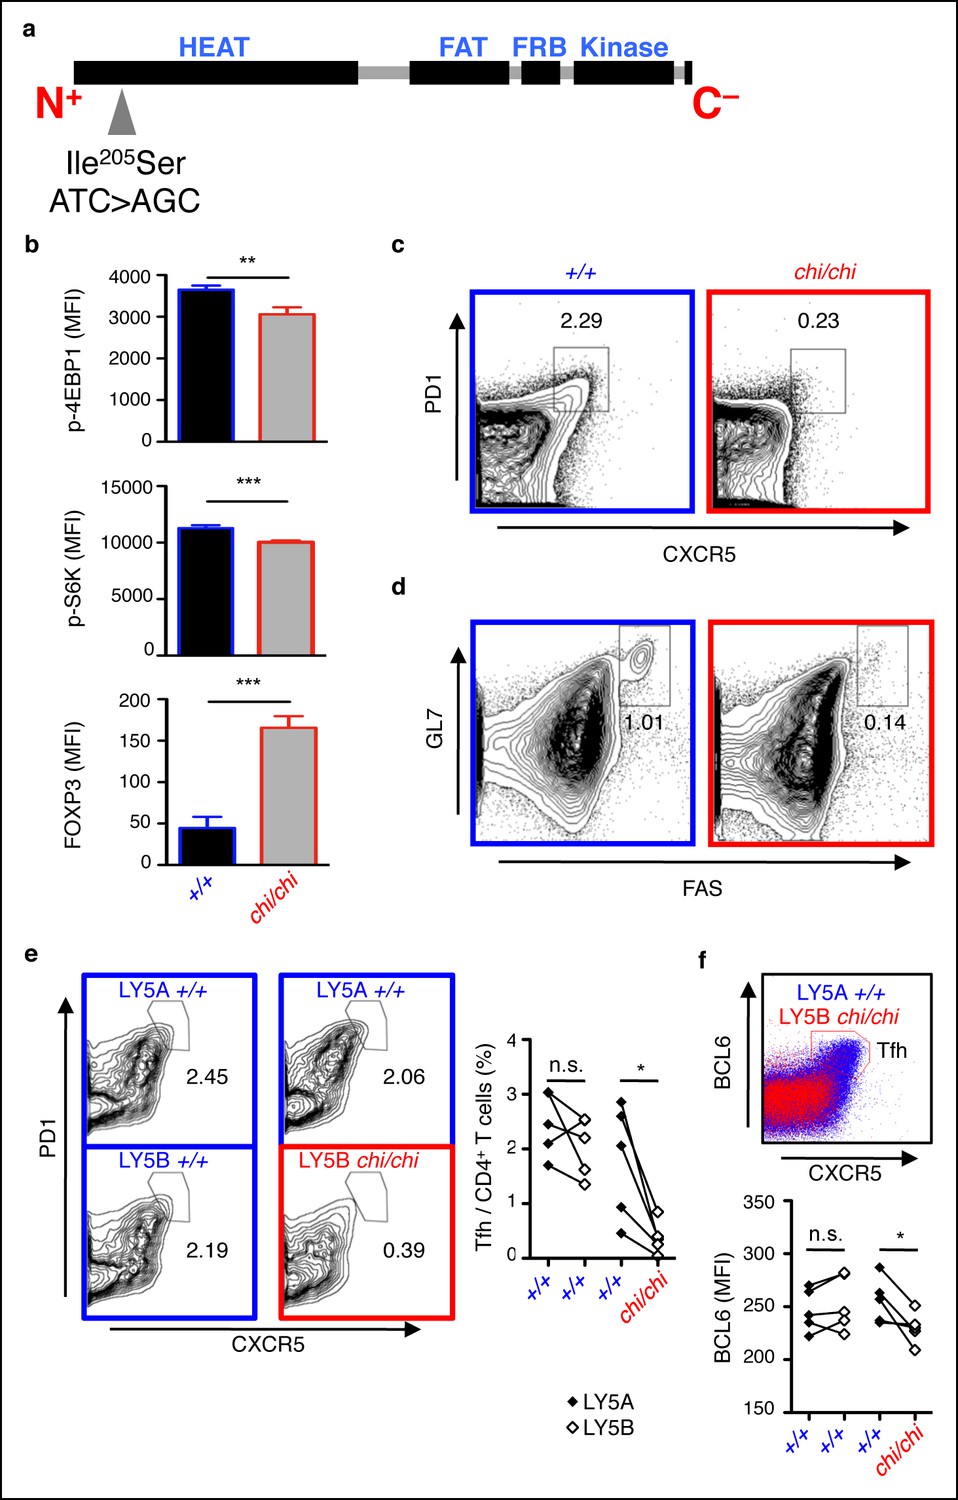
mTOR signaling is required for optimal Tfh cell formation.
(a) chino mutation causes a I205S substitution in the mTOR protein. (b) Flow cytometric measurements of intracellular phospho-4EBP1 Thr37/46, phospho-S6K Thr389, and FOXP3 in CD4+ T cells stimulated with anti-CD3 and -CD28 for 30 min (n = 4–6). MFI, mean fluorescence intensity; column, group mean, error bars, s.d. (c, d) chino mutants were immunized with sheep red blood cells (SRBC) and taken down 5 days later to analyze the proportion of PD1highCXCR5high Tfh cells from CD4+ T cells (c), and the proportion of GL7highFAShigh GC B cells from B220+ B cells (d) in the spleen. Data are representative of three independent experiments. Statistics were calculated by Student’s t-test, **p<0.005; ***p<0.0005. (e, f) Flow cytometric analysis 50:50 mixed LY5A wild-type:LY5B chino bone marrow chimeras d7 post-SRBC immunization showing the proportion of PD1highCXCR5high Tfh cells (e), and expression of intracellular BCL6 (f) from the LY5A and LY5B CD4+B220− T cells. Linked dot symbols, congenic cells from same animal; MFI, mean fluorescence intensity. Data are representative of two independent experiments. Statistics were calculated by Paired Student’s t-test between congenically marked cells of the same animal, *p<0.05.
Figure 7—figure supplement 1
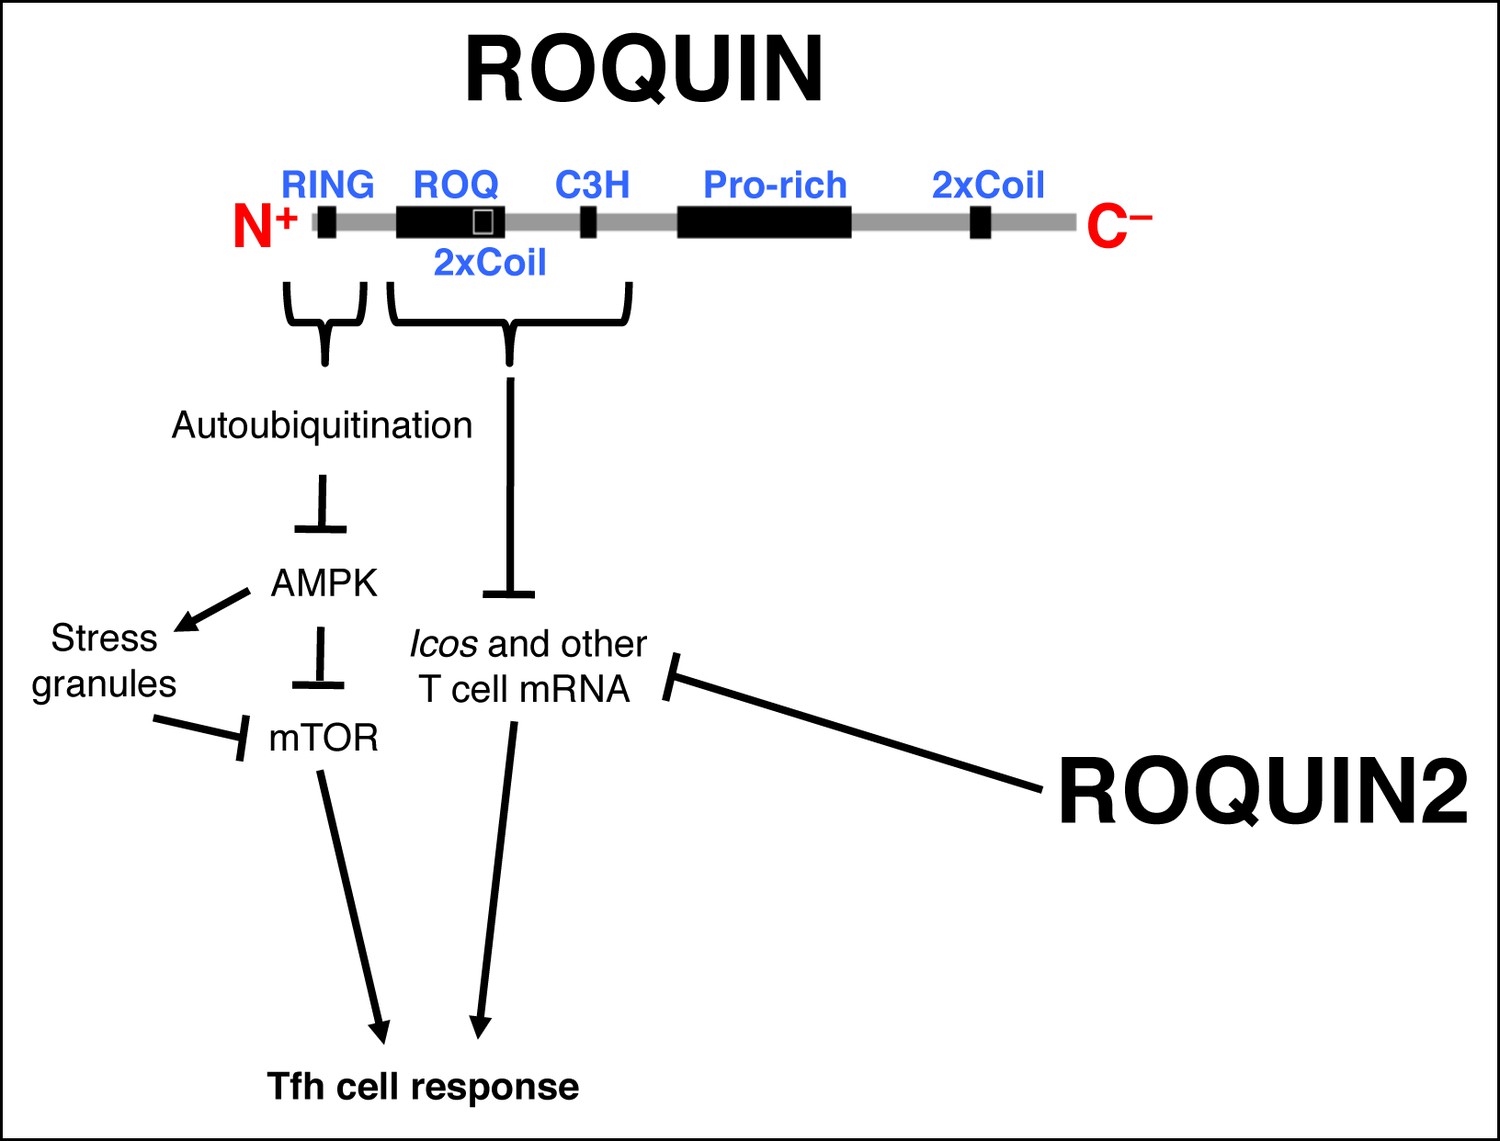
Schematic representation of ROQUIN signaling in Tfh cell ontogeny Secondary structure of the ROQUIN protein depicting the molecular function of its distinct domains in Tfh cells.
The RING zinc finger mediates autoubiquitination of ROQUIN, thereby attenuating its interacting partner AMPK which otherwise facilitates stress granule formation and maintenance, and limits both mTOR signaling and Tfh cell responses. The ROQ domain and its adjacent C3H zinc finger act in synergy to destabilize mRNA targets important in T cell activation. ROQUIN2 shares overlapping mRNA regulatory functions with ROQUIN. Pro-rich, proline rich region; 2xCoil, coiled-coil domain; AMPK, Adenosine monophosphate-activated protein kinase; Tfh cell, T follicular helper cell; mTOR, Mechanistic target of rapamycin.
Author response image 1
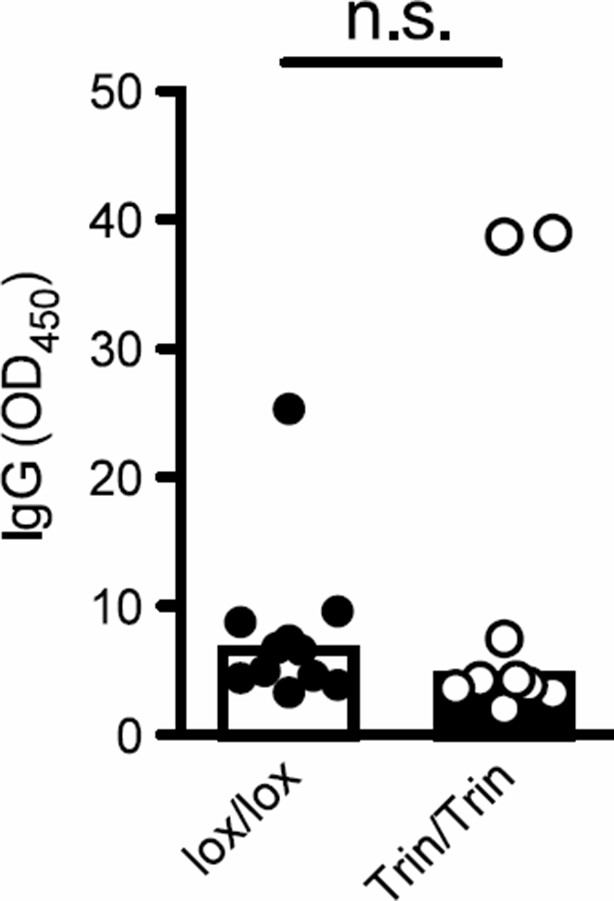
Tringless mice inoculated with LCMV and sera collected d10 post-infection to measure the anti-LCMV specific IgG response. n.s., not significant.
https://doi.org/10.7554/eLife.08698.017Download links
A two-part list of links to download the article, or parts of the article, in various formats.
Downloads (link to download the article as PDF)
Open citations (links to open the citations from this article in various online reference manager services)
Cite this article (links to download the citations from this article in formats compatible with various reference manager tools)
Attenuation of AMPK signaling by ROQUIN promotes T follicular helper cell formation
eLife 4:e08698.
https://doi.org/10.7554/eLife.08698


