Modulation of GABA and resting state functional connectivity by transcranial direct current stimulation
- University of Oxford, United Kingdom
- McGill University, Canada
Figures
Figure 1
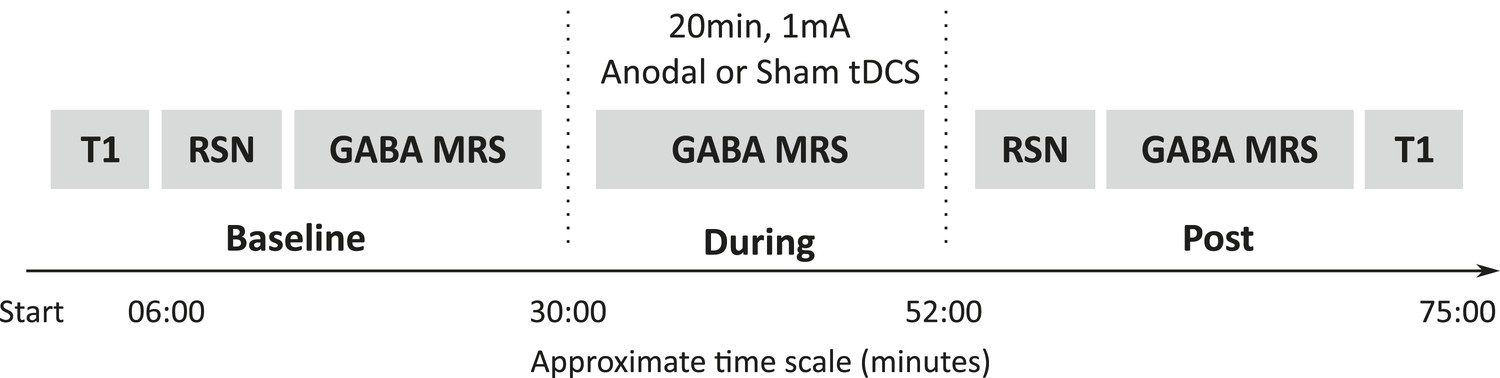
Experimental design.
All subjects participated in two testing sessions with either anodal or sham tDCS, the order of which was counterbalanced across the group. GABA was measured at three time points (baseline, during, post) and resting state connectivity was measured at two time points (baseline, post). Timeline shown is an estimate of the length of the scans in minutes.
Figure 2
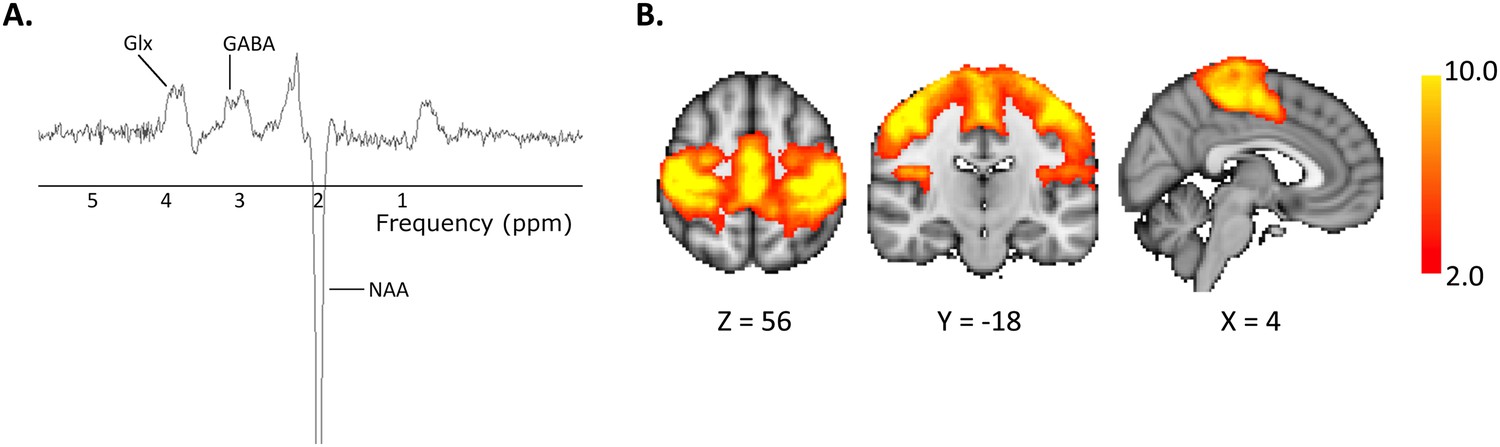
Representative (A) MR spectrum and (B) Group mean motor resting state network.
https://doi.org/10.7554/eLife.08789.003
Figure 3
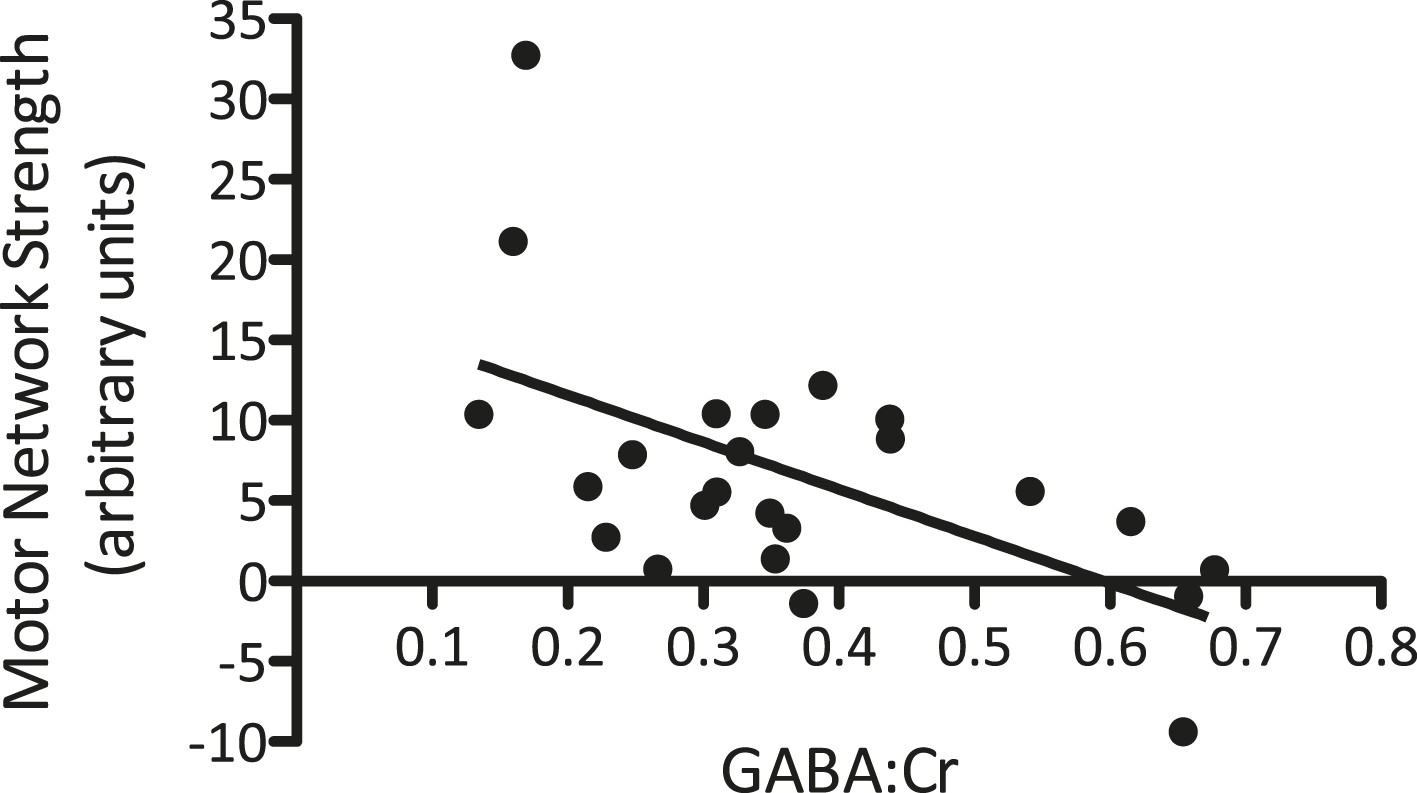
A significant relationship between M1-GABA and the strength of the motor network measured from the same region was identified at baseline (r = −0.62, p < 0.01).
https://doi.org/10.7554/eLife.08789.004
Figure 4
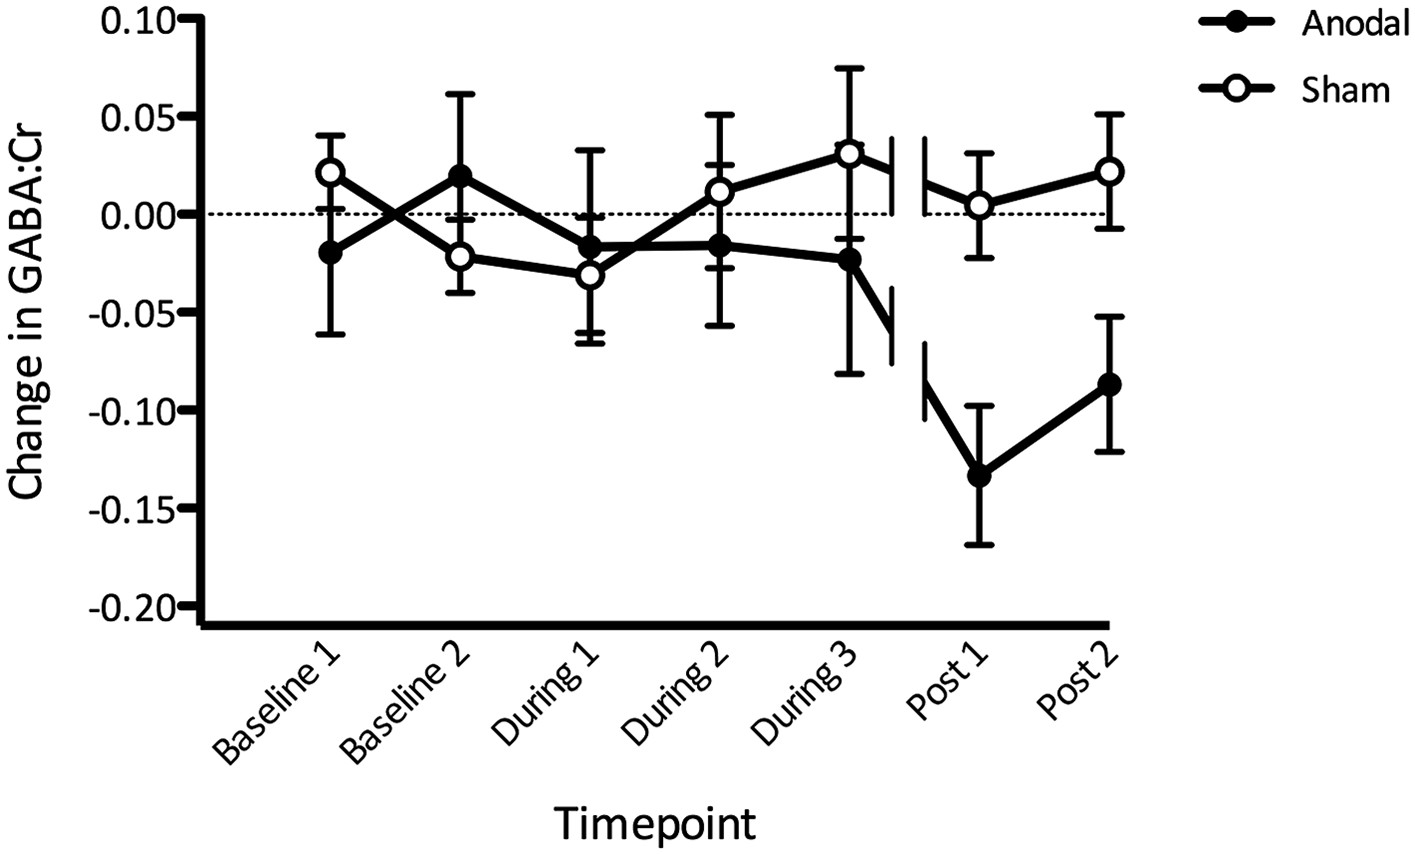
Change in GABA before, during, and after anodal tDCS relative to the sham condition.
(A) Gradual decrease in GABA levels was observed during anodal stimulation with the most prominent decrease approximately 10–15 min after stimulation has finished (Post1). Break in the lines indicate a time gap when approximately 7 min of resting state acquisition was performed immediately after tDCS stimulation. Timescale shows the approximate time from the beginning of the scan session. (Post 1: t(11) = −4.14, p < 0.01; Post 2: t(11) = −2.86, p = 0.02).
Figure 5
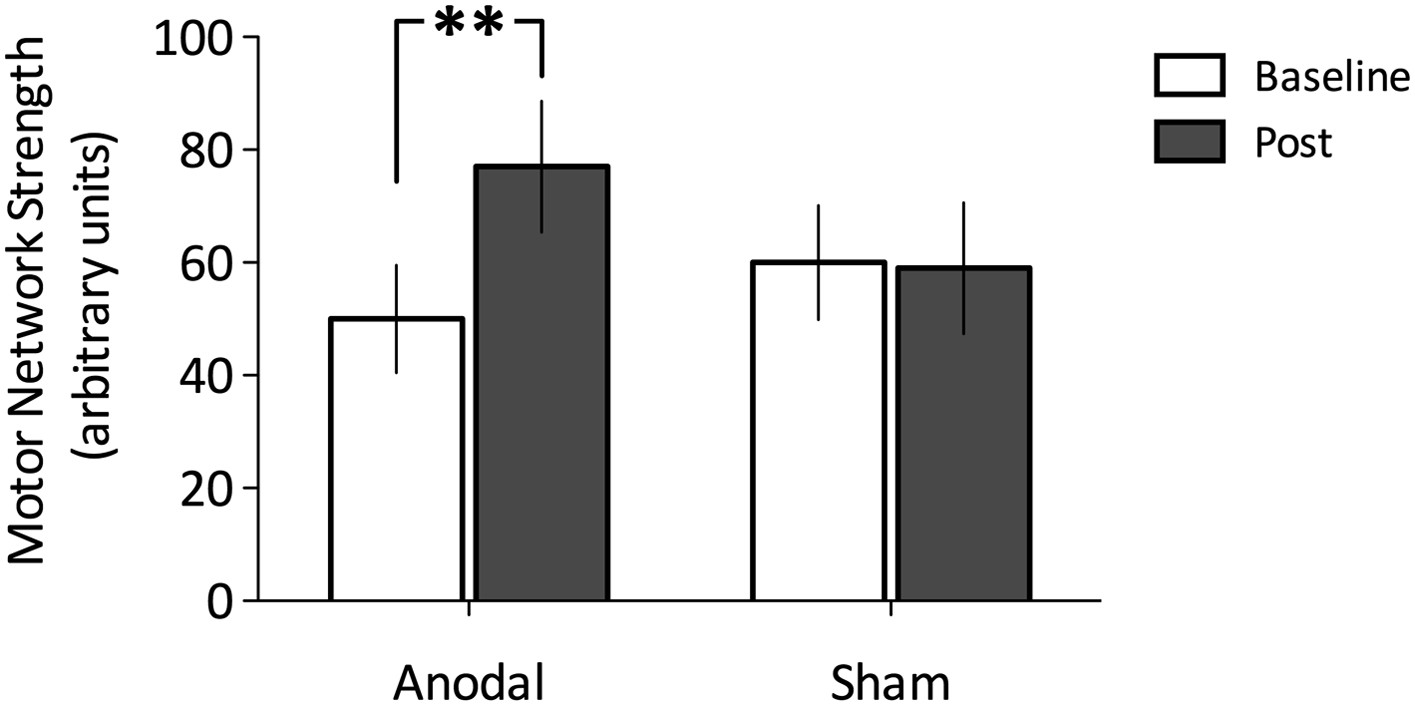
Change in functional connectivity before and after Anodal tDCS and the Sham condition.
(A) Anodal tDCS applied to M1, significantly increased functional connectivity within M1 of the motor network (t (11) = −2.45, p = 0.03). (B) There were no differences in the sham condition (t(11) = 0.07, p = 0.95).
Figure 6
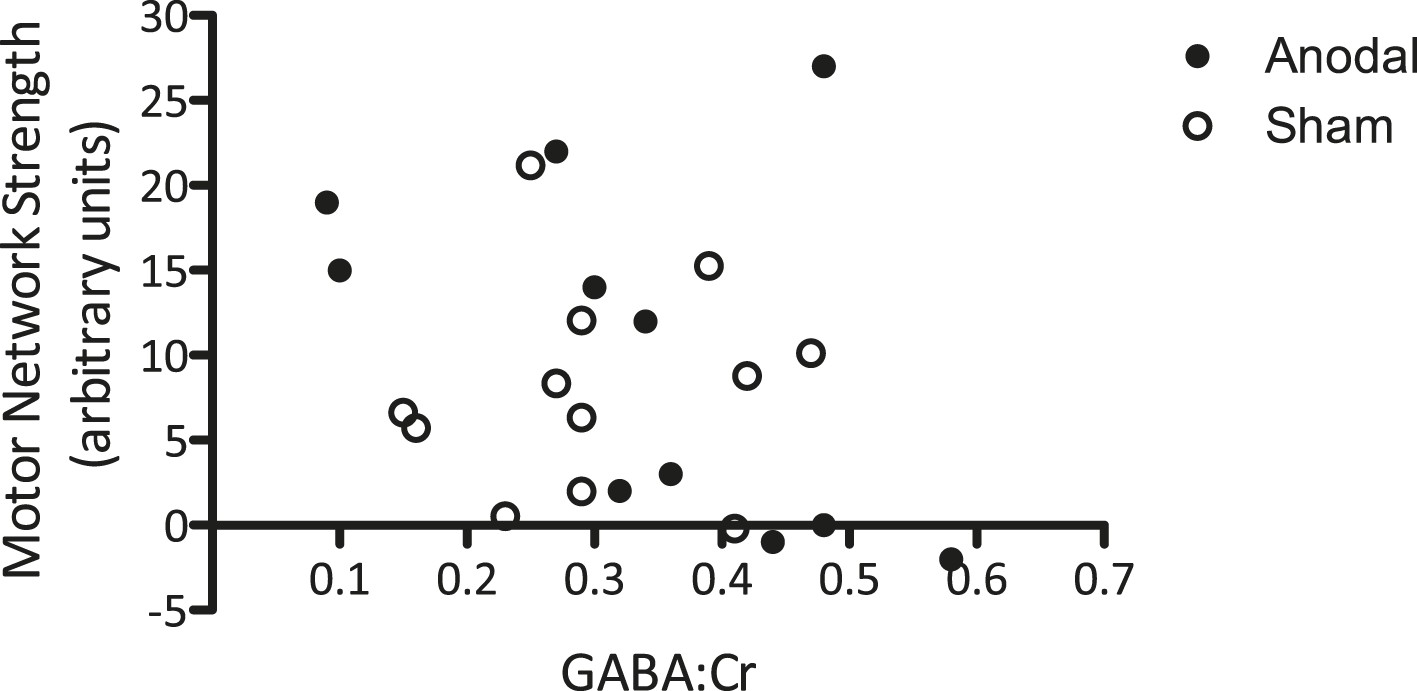
No significant relationship was demonstrated between GABA levels after tDCS and the strength of the motor network.
https://doi.org/10.7554/eLife.08789.007Download links
A two-part list of links to download the article, or parts of the article, in various formats.
Downloads (link to download the article as PDF)
Open citations (links to open the citations from this article in various online reference manager services)
Cite this article (links to download the citations from this article in formats compatible with various reference manager tools)
Modulation of GABA and resting state functional connectivity by transcranial direct current stimulation
eLife 4:e08789.
https://doi.org/10.7554/eLife.08789


