Tubulin cofactors and Arl2 are cage-like chaperones that regulate the soluble αβ-tubulin pool for microtubule dynamics
- University of California, Davis, United States
- University of California, San Diego, United States
- University of Colorado School of Medicine, United States
Figures
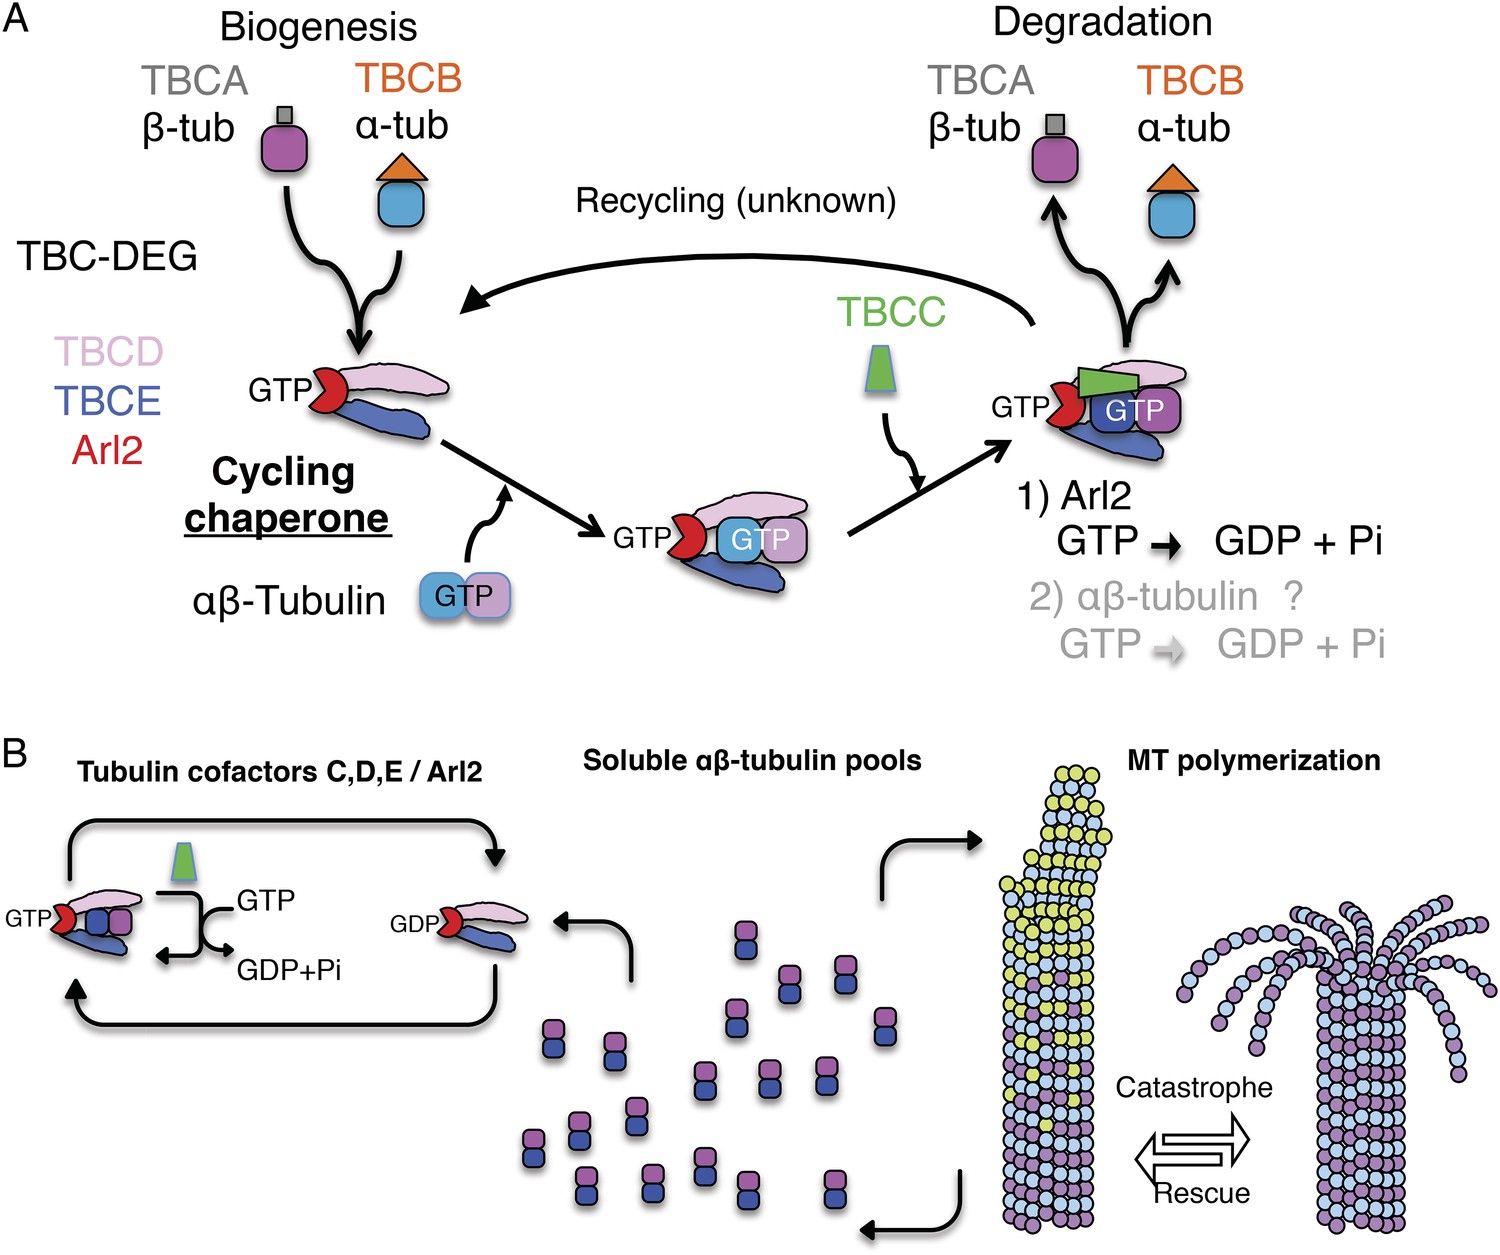
Figure 1
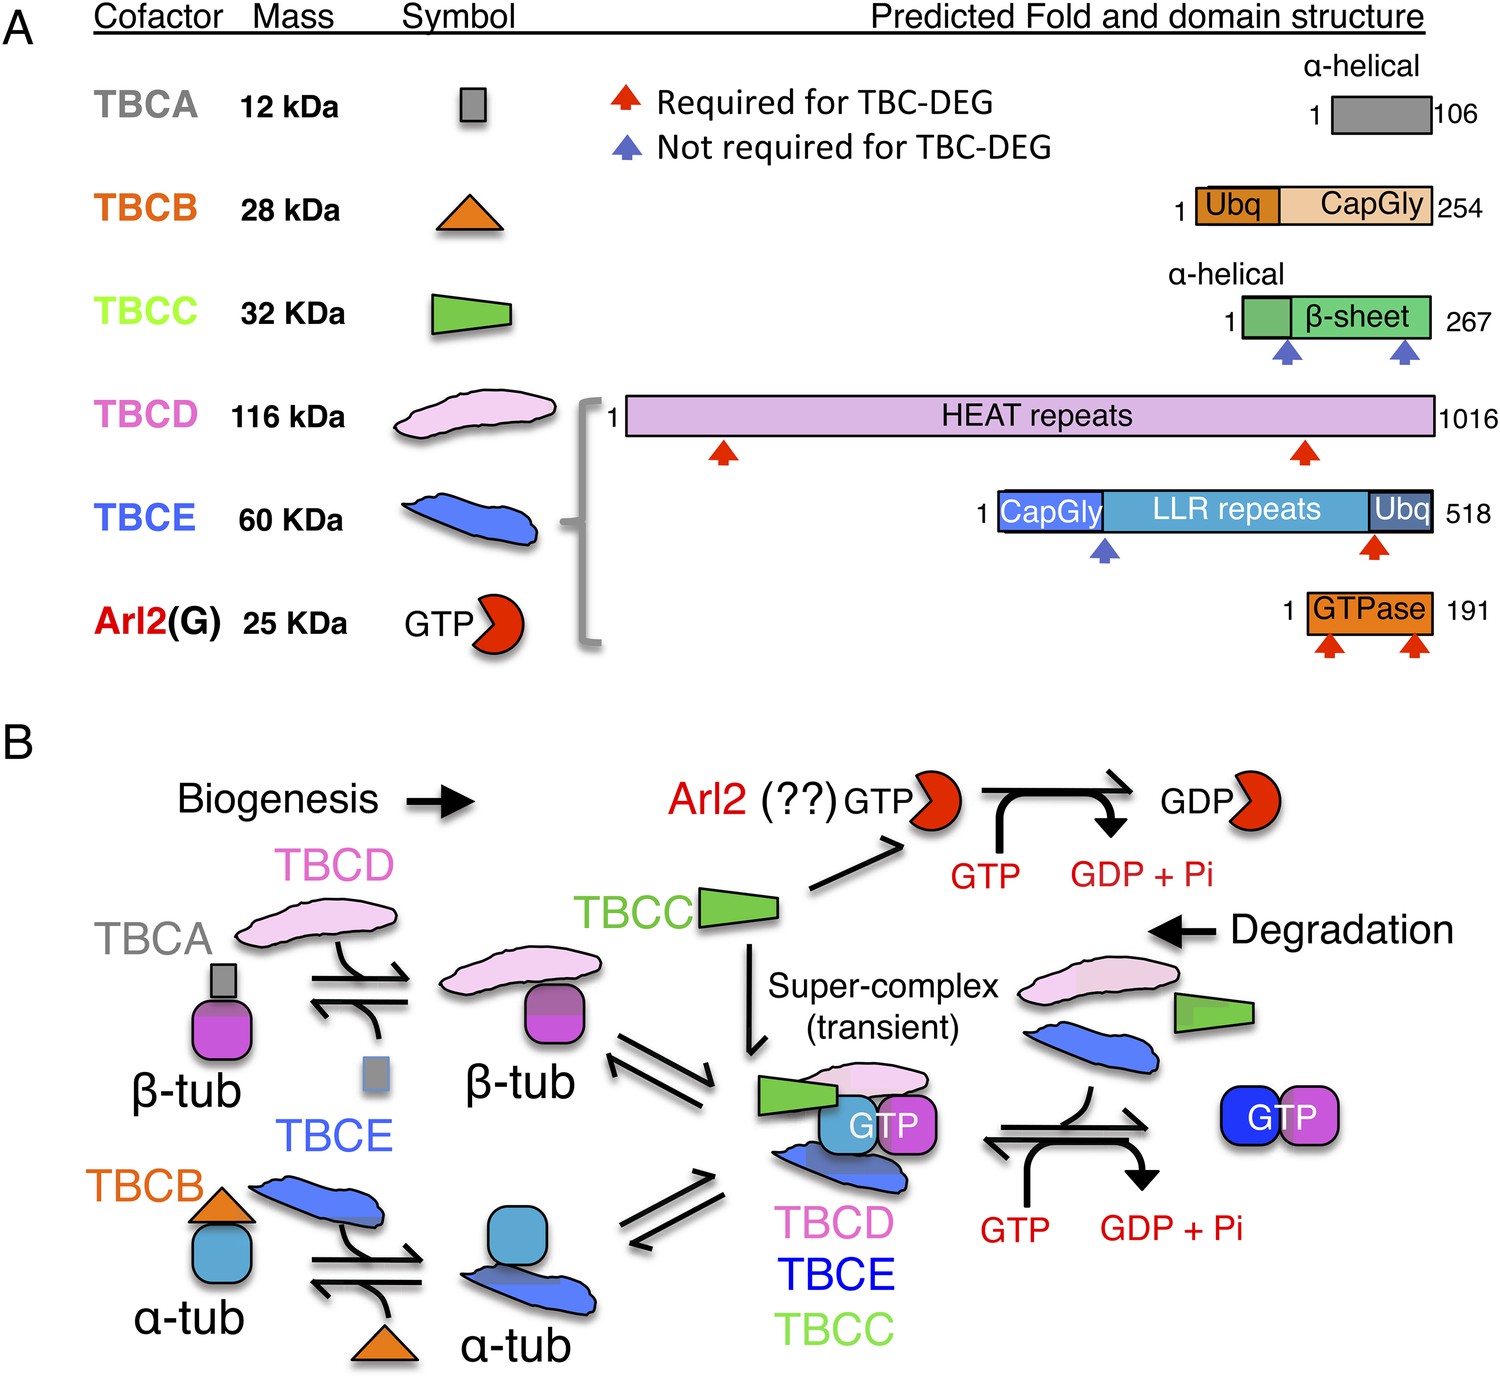
Tubulin cofactors and Arl2 GTPase: domain organization and paradigm for function.
(A) Tubulin cofactors A–E, Arl2 GTPase masses, and domain organization. TBCA and TBCB co-expression is not required for TBC-DEG expression. Red arrowheads mark domains required for forming TBC-DEG complex assembly. Blue arrowheads mark domains not required for TBC-DEG complex assembly. (B) Initial paradigm for tubulin cofactors and Arl2 activities based on previous studies. Each of the molecules is suggested to be monomeric, and only assemble into complexes to drive αβ-tubulin biogenesis or degradation, via interactions regulated by dynamic equilibria. TBCA binds nascent β-tubulin and TBCB binds nascent α-tubulin. TBCA and TBCB are replaced by TBCD and TBCE, respectively. TBCC drives TBCE-α-tubulin and TBCD-β-tubulin to form a supercomplex. GTP hydrolysis in Arl2 is activated by TBCC in a parallel pathway to tubulin assembly. Tubulin biogenesis and degradation intermediate bind and form tubulin dimers, a process that requires Arl2 and tubulin to undergo GTP hydrolysis as an energy source. (Adopted from Lewis et al., 1997.)
Figure 2 with 1 supplement
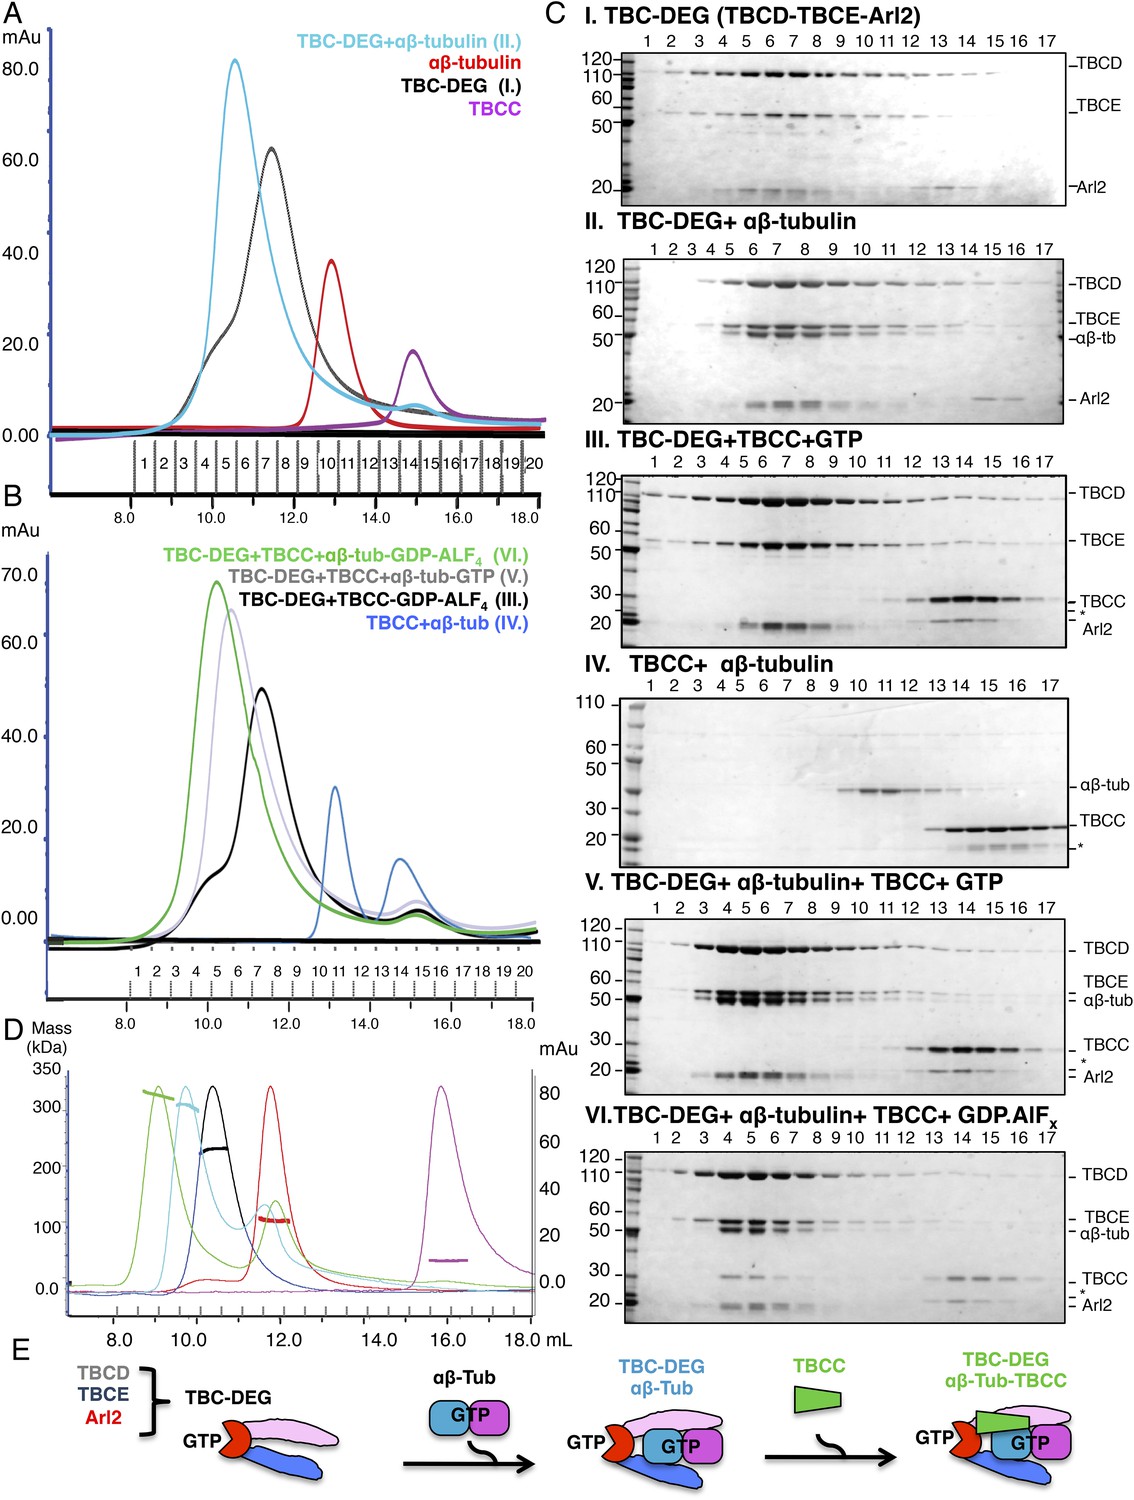
Hierarchical assembly of TBCC with TBC-DEG and soluble αβ-tubulin dimer binding in the GDP·Pi state.
(A) Size exclusion chromatography (SEC) intensity traces of TBC-DEG (black), TBC-DEG:αβ-tubulin (cyan), αβ-tubulin (red), and TBCC (purple). (B) SEC intensity traces of TBC-DEG+TBCC+αβ-tubulin-GDP·ALFx (green), TBC-DEG+TBCC+αβ-tubulin-GTP (gray), TBC-DEG+TBCC-GTP-ALFx (black), TBCC+αβ-tubulin (blue), and αβ-tubulin+TBCC (blue). Additional states are described in Figure 2—figure supplement 1C,D. (C) Composition of SEC fractions shown in A and B using SDS-PAGE. Panel I, TBC-DEG; panel II, TBC-DEG:αβ-tubulin; panel III, TBC-DEG+TBCC-GDP·ALFx; panel IV, TBCC+αβ-tubulin; panel V, TBC-DEG+TBCC+αβ-tubulin-GTP; and panel VI, TBC-DEG+TBCC+αβ-tubulin-GDP·ALFx. TBC-DEG forms an active heterotrimeric complex, and TBCC forms a complex that co-migrates with TBC-DEG upon αβ-tubulin binding in the presence of GDP·ALFx (panel IV). The protein standard is shown on the left and proteins are marked on the right. TBC-DEG complexes interact weakly with the resin media leading to wide elution SEC profiles in most conditions. (D) Molecular masses of TBC-DEG, αβ-tubulin, TBCC, and their complexes measured using size exclusion chromatography with multi-angle light scattering (SEC-MALS). Solid lines represent SEC intensity traces on an intensity scale shown on the right y-axis, and dotted lines represent masses calculated on the mass scale shown on the left y-axis; TBC-DEG (black), αβ-tubulin (red), TBCC (purple), TBC-DEG:αβ-tubulin (cyan), and TBC-DEG:αβ-tubulin:TBCC-GDP·ALFx (green). Masses and elution volumes are detailed in Table 2. (E) Scheme for the hierarchical assembly of TBC-DEG with TBCC and αβ-tubulin and the role of nucleotide. TBCD, TBCE, and Arl2 form TBC-DEG complexes (TBC-DEG) and bind a single αβ-tubulin dimer (αβ-tub) to form TBC-DEG:αβ-tubulin (TBC-DEG:αβ-tub), which recruits TBCC in the GTP-like state to form TBC-DEG:αβ-tubulin:TBCC (TBC-DEG:αβ-tub:TBCC).
Figure 2—figure supplement 1
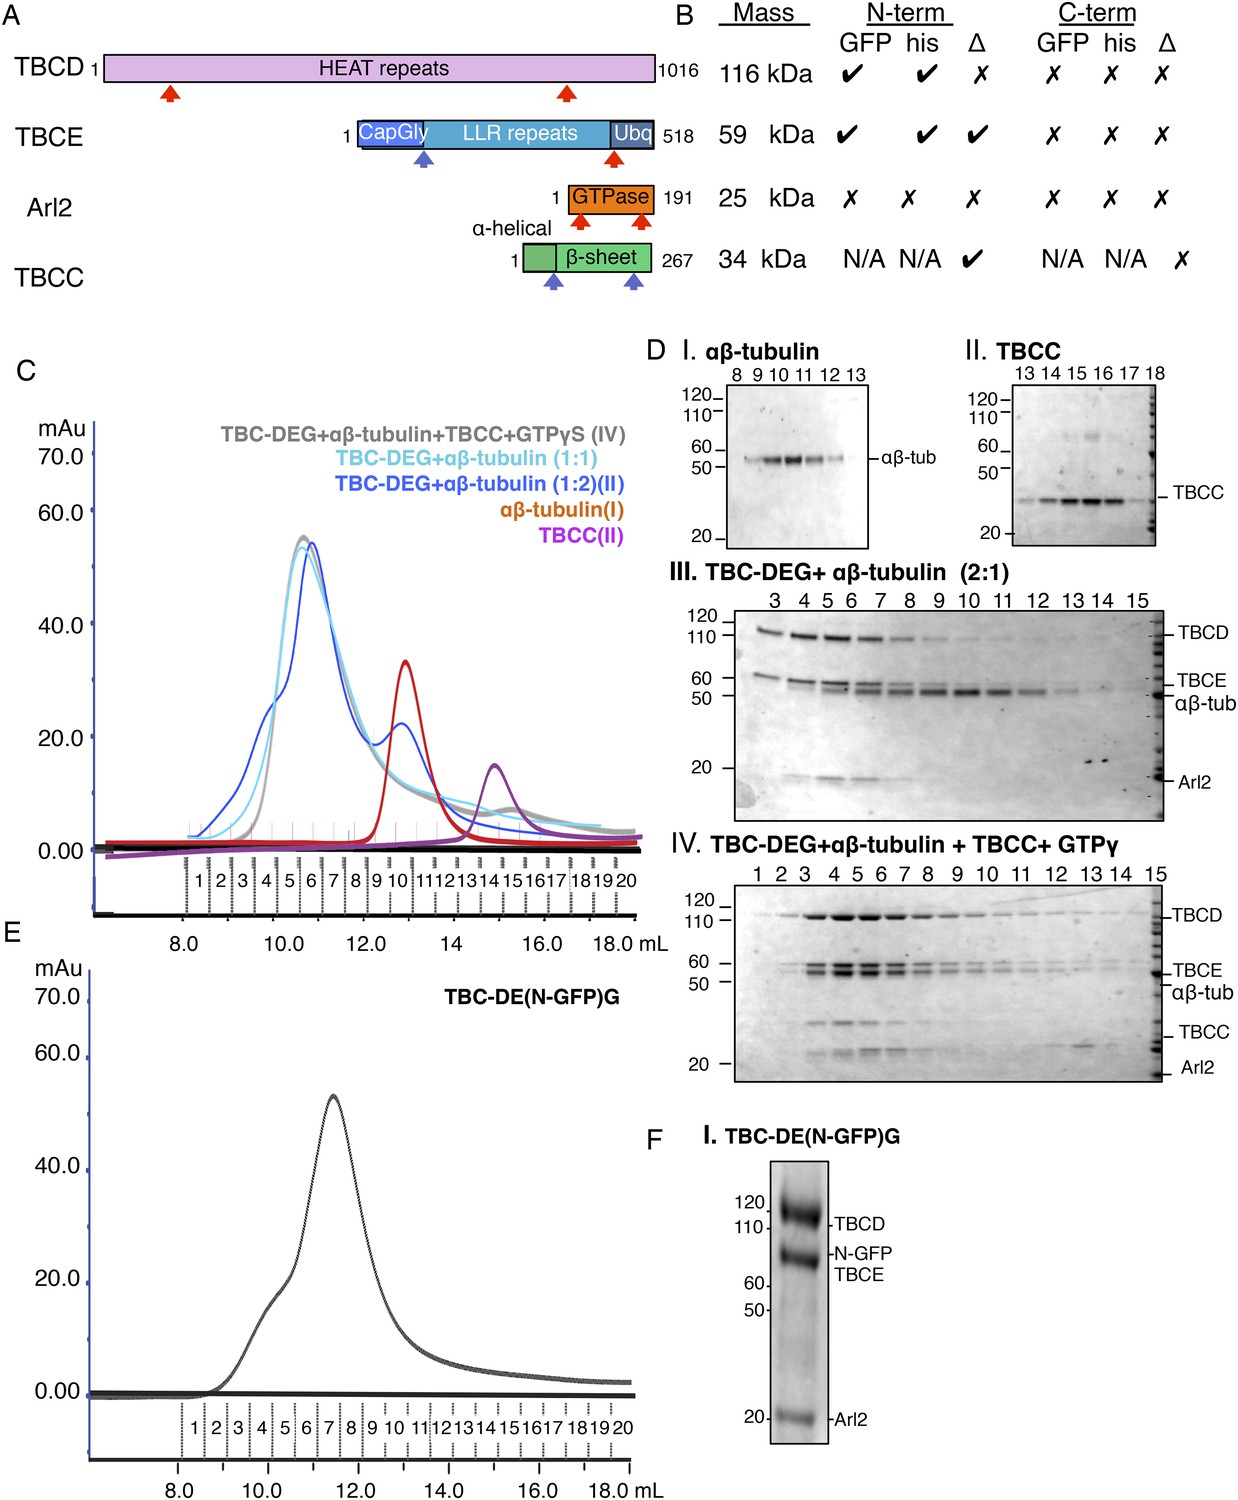
Tubulin cofactor-Arl2 co-expression and biochemical studies on TBC-DEG constructs.
(A) Domain structures of tubulin cofactors and Arl2. Top, TBCD (gray) composed of HEAT repeats. Second, TBCE, composed of Cap-Gly (blue), LRR (cyan), and ubiqutin-like (light blue) domains. Third, the Arl2-GTPase composed of ARF-like G protein fold (red) and outer unique termini (orange). Fourth, TBCC composed of an N-terminal spectrin homology domain (light green), and a β-sheet domain (dark green). (B) Summary of co-expression experiments, TBC, and Arl2 proteins. The masses of each of the proteins are shown on the left and correspond to the order shown in A. The effects of deletion (Δ) or addition of GFP (GFP) or 6Xhis-tags (his) at the N-termini and C-termini of each of the TBC and Arl2 proteins on TBC-DEG complexes are described, where check marks describe no effect on TBC-DEG expression, while a cross mark describes loss of TBC-DEG expression. (C) Size exclusion chromatography (SEC) intensity traces of TBC-DEG:αβ-tubulin (cyan), TBC-DEG:αβ-tubulin 1:2 molar ratio (blue), αβ-tubulin (red), and TBCC (purple). (D) Composition of SEC fractions shown in C using SDS-PAGE. Panel I, αβ-tubulin; panel II, TBCC; panel III, TBC-DEG+αβ-tubulin 2:1 molar ratio; and panel IV, TBC-DEG+αβ-tubulin+TBCC+GTPγS. The protein standard is shown on the left and proteins are marked on the right. (E) Size exclusion chromatography (SEC) intensity traces of TBC-DE(N-GFP)G (black). (F) Composition of SEC fractions shown in E using SDS-PAGE for TBC-DE(N-GFP)G. The protein standard is shown on the left and protein positions are marked on the right.
Figure 3 with 1 supplement

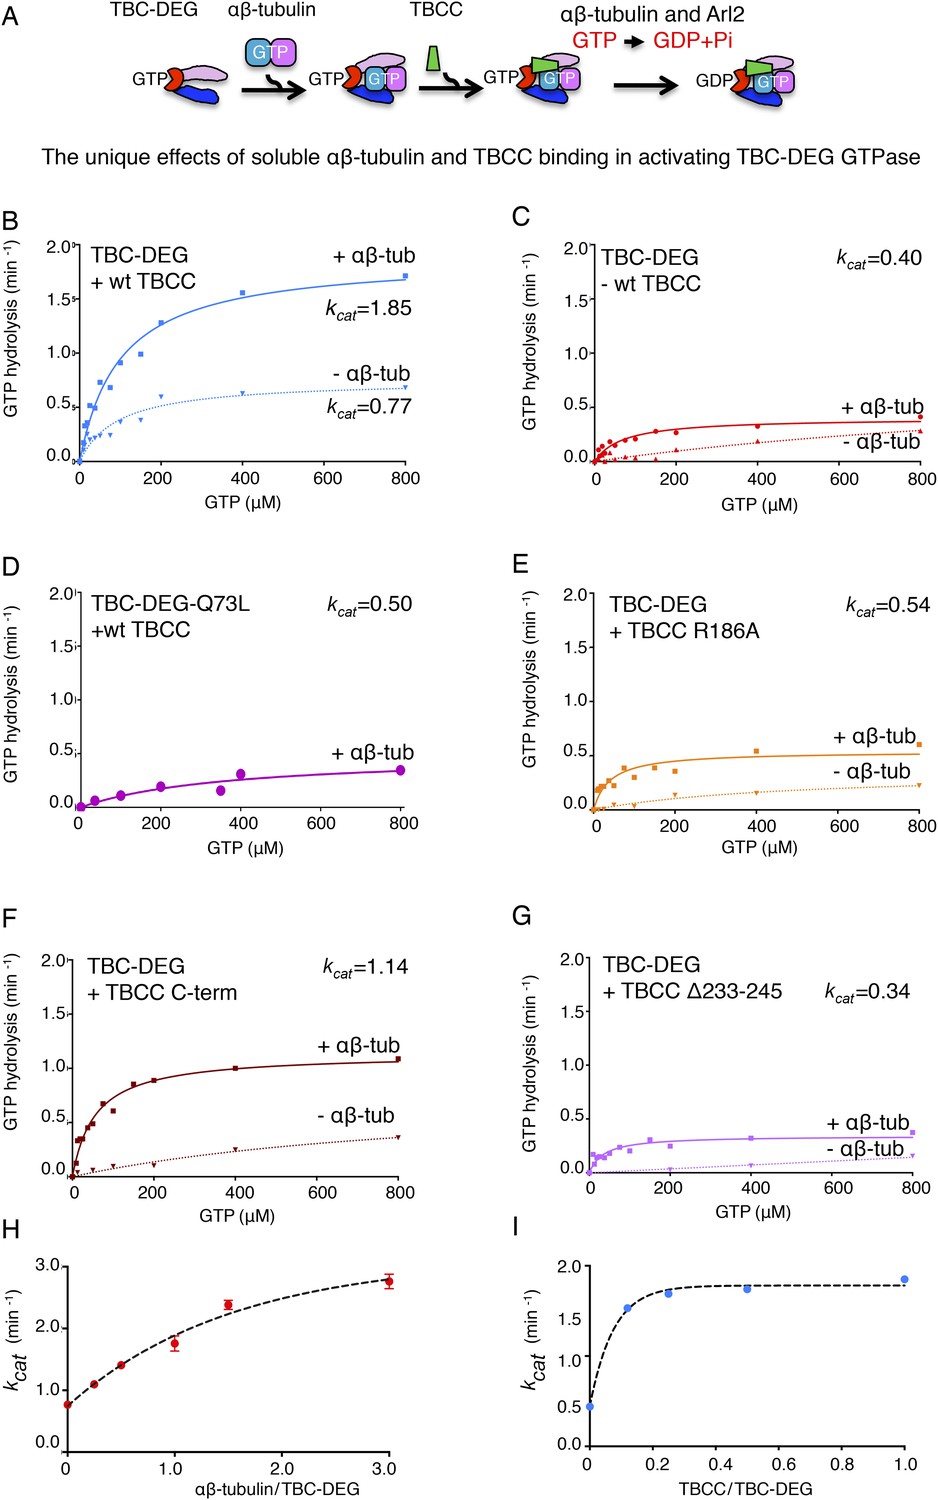
TBCC activates dual GTP hydrolyses in Arl2 and αβ-tubulin on TBC-DEG: αβ-tubulin complexes.
(A) Size exclusion chromatography (SEC) intensity traces of TBC-DEG-Arl2-Q73L (TBC-DEG-Q73L) assembly with TBCC and αβ-tubulin; TBC-DEG-Q73L+TBCC (black), TBC-DEG-Q73L+αβ-tubulin+TBCC (green), αβ-tubulin (red), and TBCC (purple). (B) Analysis of SEC fractions described in A by SDS-PAGE. Panel I, TBC-DEG-Q73L+TBCC+GTP; panel II, TBC-DEG-Q73L+TBCC+αβ-tubulin-GTP. (C) Scheme for GTP hydrolysis by TBC-DEG and the effect of αβ-tubulin binding and TBCC on the GTP hydrolysis pathway. (D) Steady-state GTP hydrolysis assays of different 1 μM TBC-DEG, αβ-tubulin, and TBCC assemblies. TBC-DEG (red) and TBC-DEG+αβ-tubulin (orange) hydrolyze GTP very slowly. TBCC+αβ-tubulin (black) hydrolyzes negligible amounts of GTP. TBC-DEG+αβ-tubulin+TBCC hydrolyzes GTP (blue; 1.8 min−1) at a rate roughly twofold higher than TBC-DEG+TBCC (green; 0.8 min−1). Km and kcat values are reported in Table 3. (E) The effect of αβ-tubulin binding on TBC-DEG GTP hydrolysis. Top panel, scheme for GTP hydrolysis by TBC-DEG and the effect of limiting or varying the αβ-tubulin concentration on GTP hydrolysis. Bottom panel, titrating αβ-tubulin concentrations (0–3.0 μM) to 1 μM TBC-DEG and 1 μM TBCC. The curves are labeled with the concentration at the plateau point for each curve. (F) The effect of TBCC concentration on TBC-DEG GTP hydrolysis. Top panel, scheme for GTP hydrolysis by TBC-DEG and the effect of limiting or varying the TBCC concentration on GTP hydrolysis. Bottom panel, titrating TBCC concentration (0.12–1.0 μM) to 1 μM TBC-DEG and 1 μM αβ-tubulin. The curves are labeled with the concentration at the plateau point for each curve. (G) The effect of Arl2-Q73L on TBC-DEG GTP hydrolysis. Top panel, scheme for GTP hydrolysis by TBC-DEG-Q73L and the effect of αβ-tubulin binding and TBCC on the GTP hydrolysis reaction. Bottom panel, steady-state GTP hydrolysis assays of 1 μM TBC-DEG+αβ-tubulin+TBCC (blue) compared to TBC-DEG-Q73L+αβ-tubulin+TBCC (purple). Km and kcat values are reported in Table 3.
Figure 3—figure supplement 1
Summary of the catalytic GTP hydrolysis rates for different reconstitutions of TBC-DEG with TBCC and αβ-tubulin and the effects of Arl2 and TBCC mutations.
(A) The TBC-DEG, αβ-tubulin, and TBCC assembly reaction and activation of GTP hydrolysis. (B) TBCC activates TBC-DEG GTP hydrolysis in a soluble tubulin dependent manner. (C) The binding of αβ-tubulin to TBC-DEG leads to low but robust GTP hydrolysis. (D) A GTP locked Arl2 mutant in TBC-DEG-Q73L has very poor GTP hydrolysis. (E) The TBCC arginine finger R186A mutant has robust GTP hydrolysis. (F) The TBCC C-terminal β-helix domain activates TBC-DEG GTP hydrolysis with loss of the αβ-tubulin independent phase. (G) The TBCC Δ233-245 loop deleted mutant displays low but robust GTP hydrolysis. (H) The effect of the αβ-tubulin to TBC-DEG molar ratio on GTP hydrolysis (kcat). (I) The effect of the TBCC to TBC-DEG molar ratio on GTP hydrolysis (kcat).
Figure 4 with 3 supplements
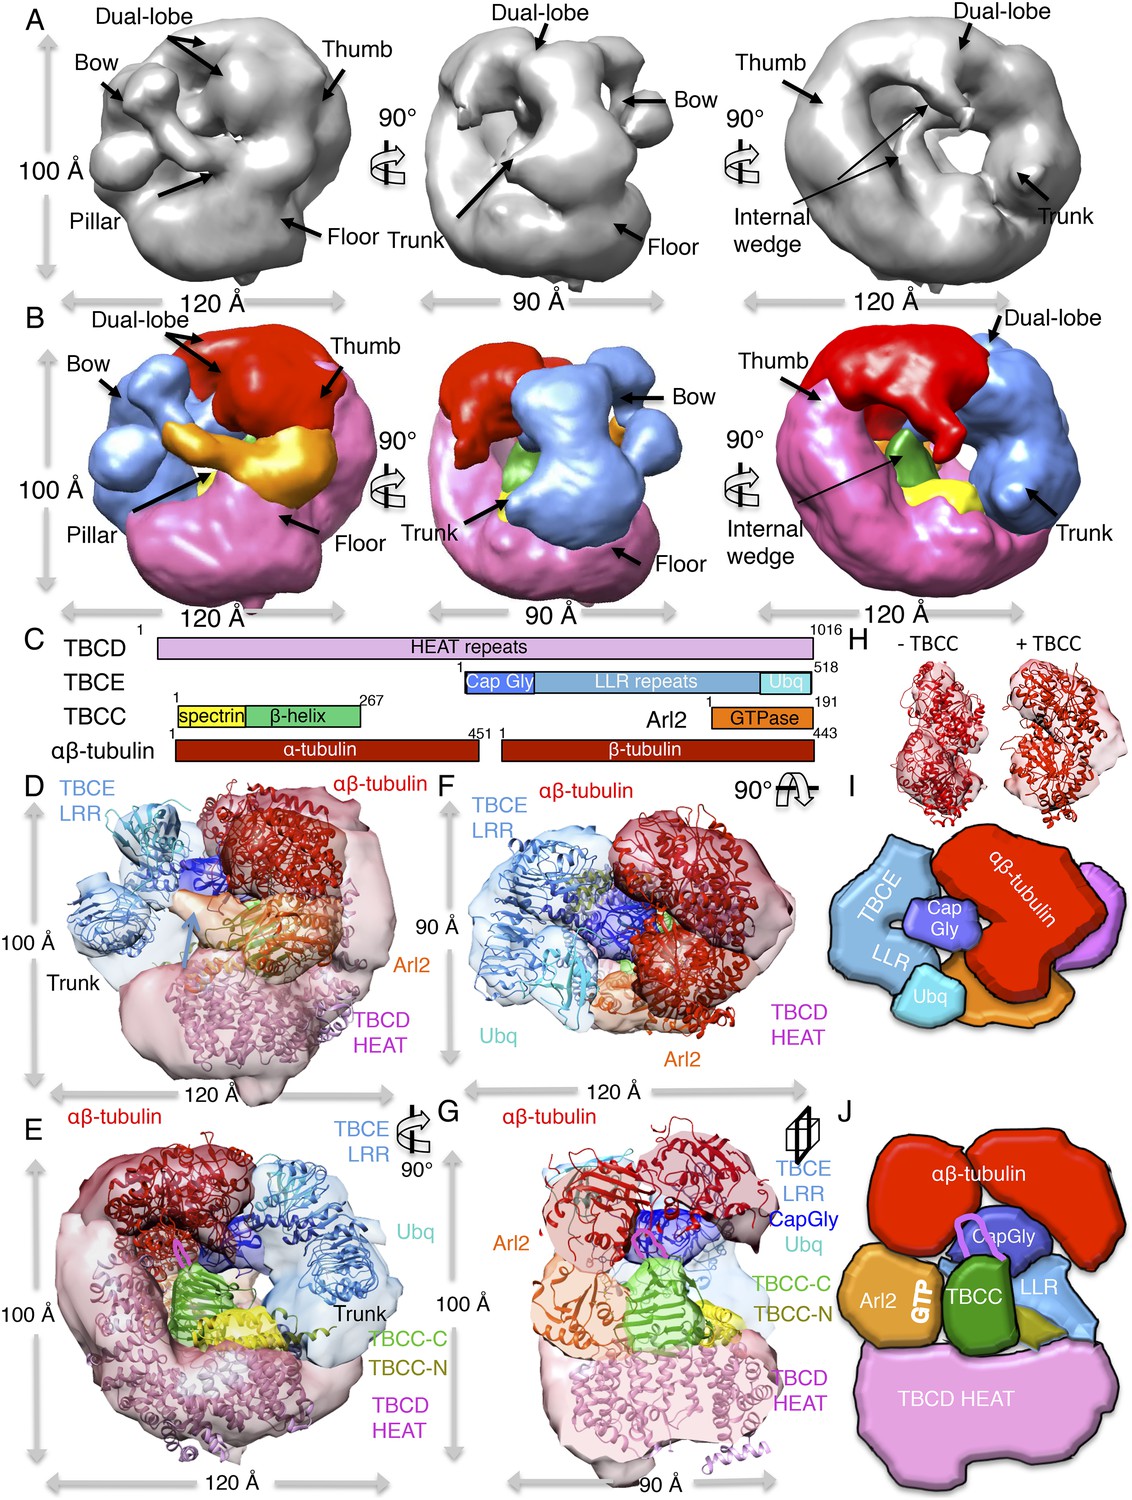
TBC-DEG complexes are compact cage-like chaperone assemblies with hollow cores.
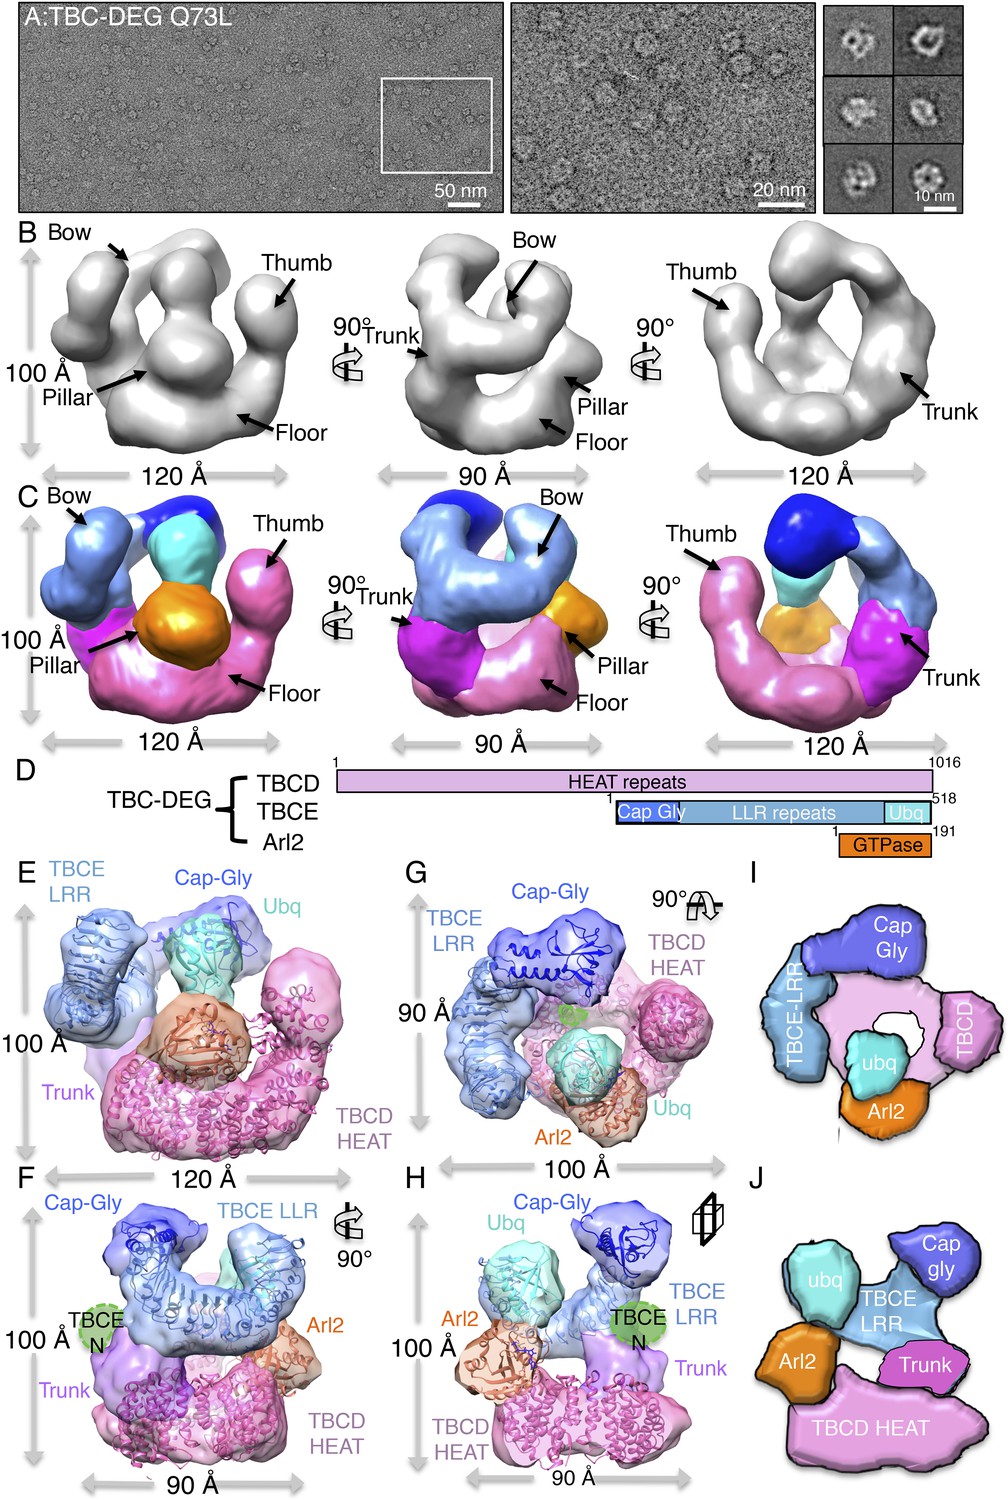
(A) Left panel, an expanded negative-stain image of TBC-DEG Q73L showing the cage-like assemblies. Middle panel, higher magnification view of the TBC-DEG-Q73L. Right panel, reference-free class averages (from Figure 4—figure supplement 1C) of TBC-DEG Q73L showing the variety of views. (B) A refined 24 Å TBC-DEG-Q73L 3D map shown in three rotated views. The floor, bow, trunk, pillar, and thumb regions are marked in each view. (C) Segmented 24 Å TBC-DEG map with all unique segmented domains based on tagging assignment of the TBCE N-termini (Figure 4—figure supplement 2B). The bow region (blue) includes two globular ends: the ubiquitin domain (cyan) and the Cap-Gly domain (deep blue). Three interfaces stabilize the TBC-DEG cage: the bow pillar, the pillar floor, and the bow floor via the trunk. Video 1 shows the A and B views. (D) A TBC-DEG subunit domain map shown to length scale. TBCD (pink, top panel) is predicted to consist of HEAT repeats. TBCE (middle panel) consists of an N-terminal Cap-Gly domain (dark blue), a leucine rich repeat (LRR) domain (blue), and a C-terminal ubiquitin-like domain (cyan). Arl2 (bottom panel) consists of a GTPase fold (orange). Colors correspond to subunits shown in D–I. (E) Pseudo-atomic TBC-DEG cage model showing the TBCD, TBCE, and Arl2 domain organization in assembling the cage structure. Each 3D map region is shown in a glossy color, and x-ray structures for orthologs fitted are shown as ribbons in the same color. The floor and thumb segments (pink) were fitted by the Cse1 crystal structure. The bow segment (blue) was fitted by the TLR4 LRR domain x-ray structure. The pillar segment (orange) was fitted by the x-ray structure of Arl2 (orange). The positions N-GFP-TBCE (dark green) and N-GFP-TBCD (light green) are shown. The trunk region (purple) was not fit with any atomic model. (F) A 90° vertically rotated view of that shown in D. (G) A 90° horizontally rotated view of that shown in D. (H) A central slice view of a 90° counterclockwise horizontally rotated view of that shown in D. Video 1 shows the C–F views. (I) Cartoon view of TBC-DEG domain organization comparable to the view shown in F. (J) Cartoon view of TBC-DEG domain organization comparable to the view shown in G.
Figure 4—figure supplement 1
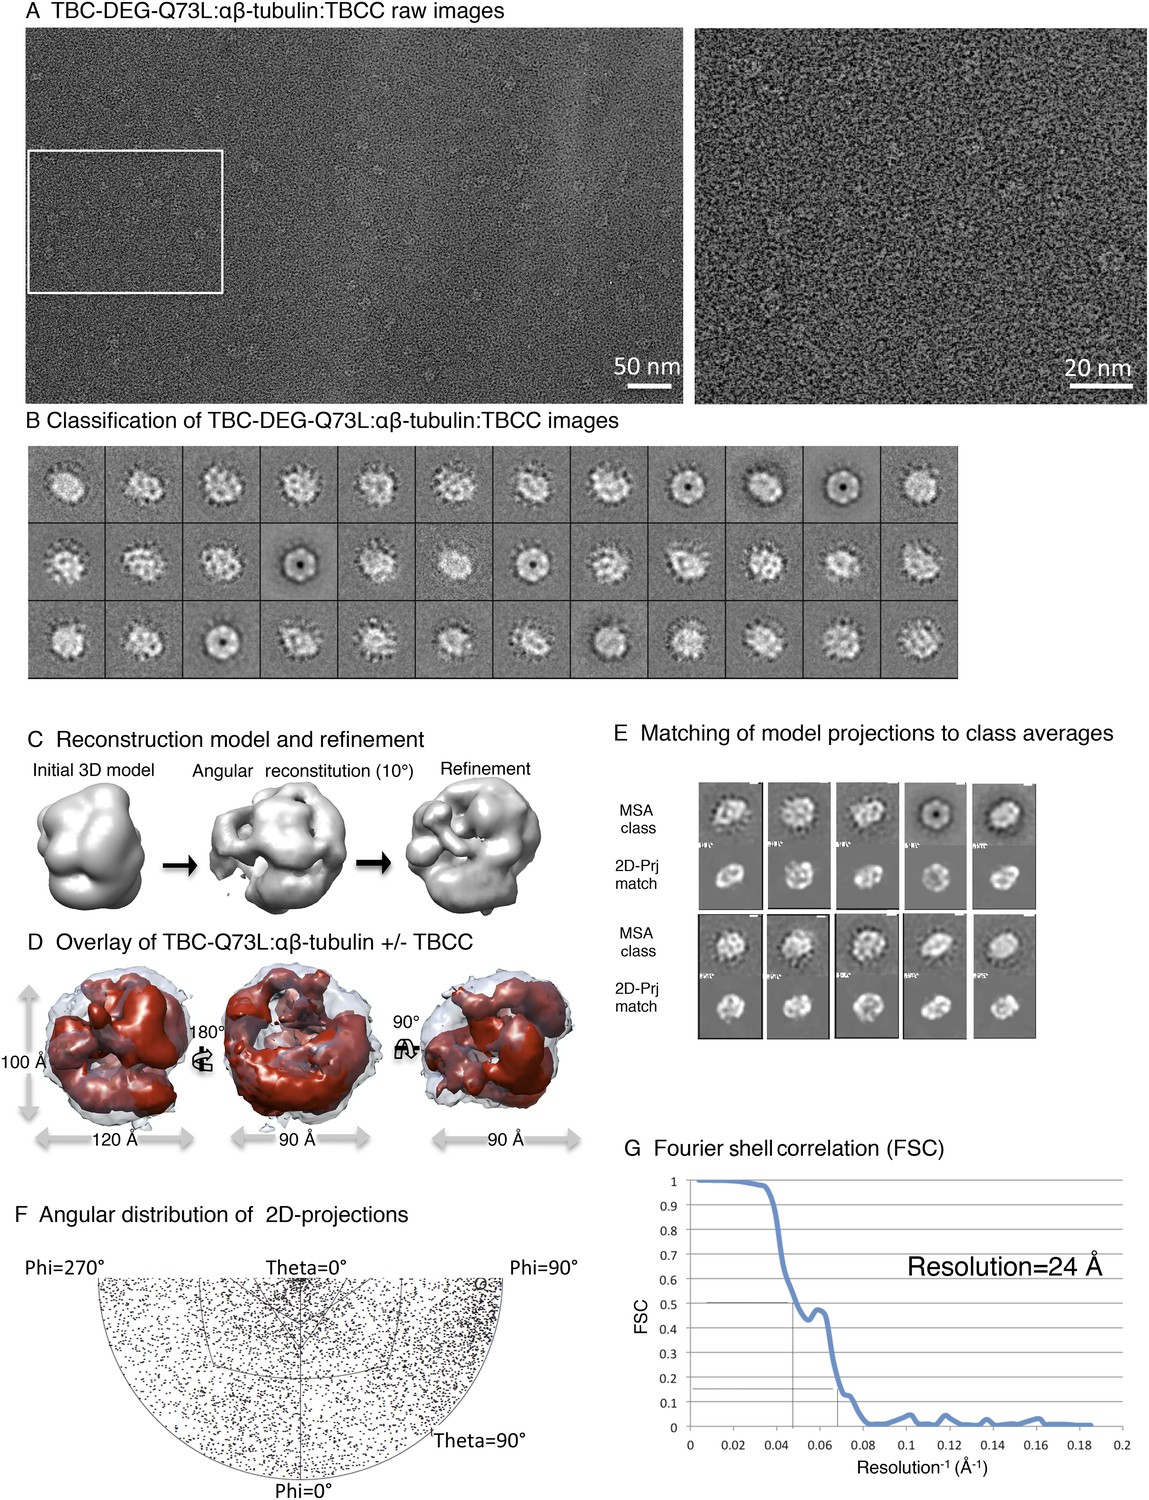
Electron microscopy and 3D reconstruction of the TBC-DEG-Q73L cage-like chaperones.
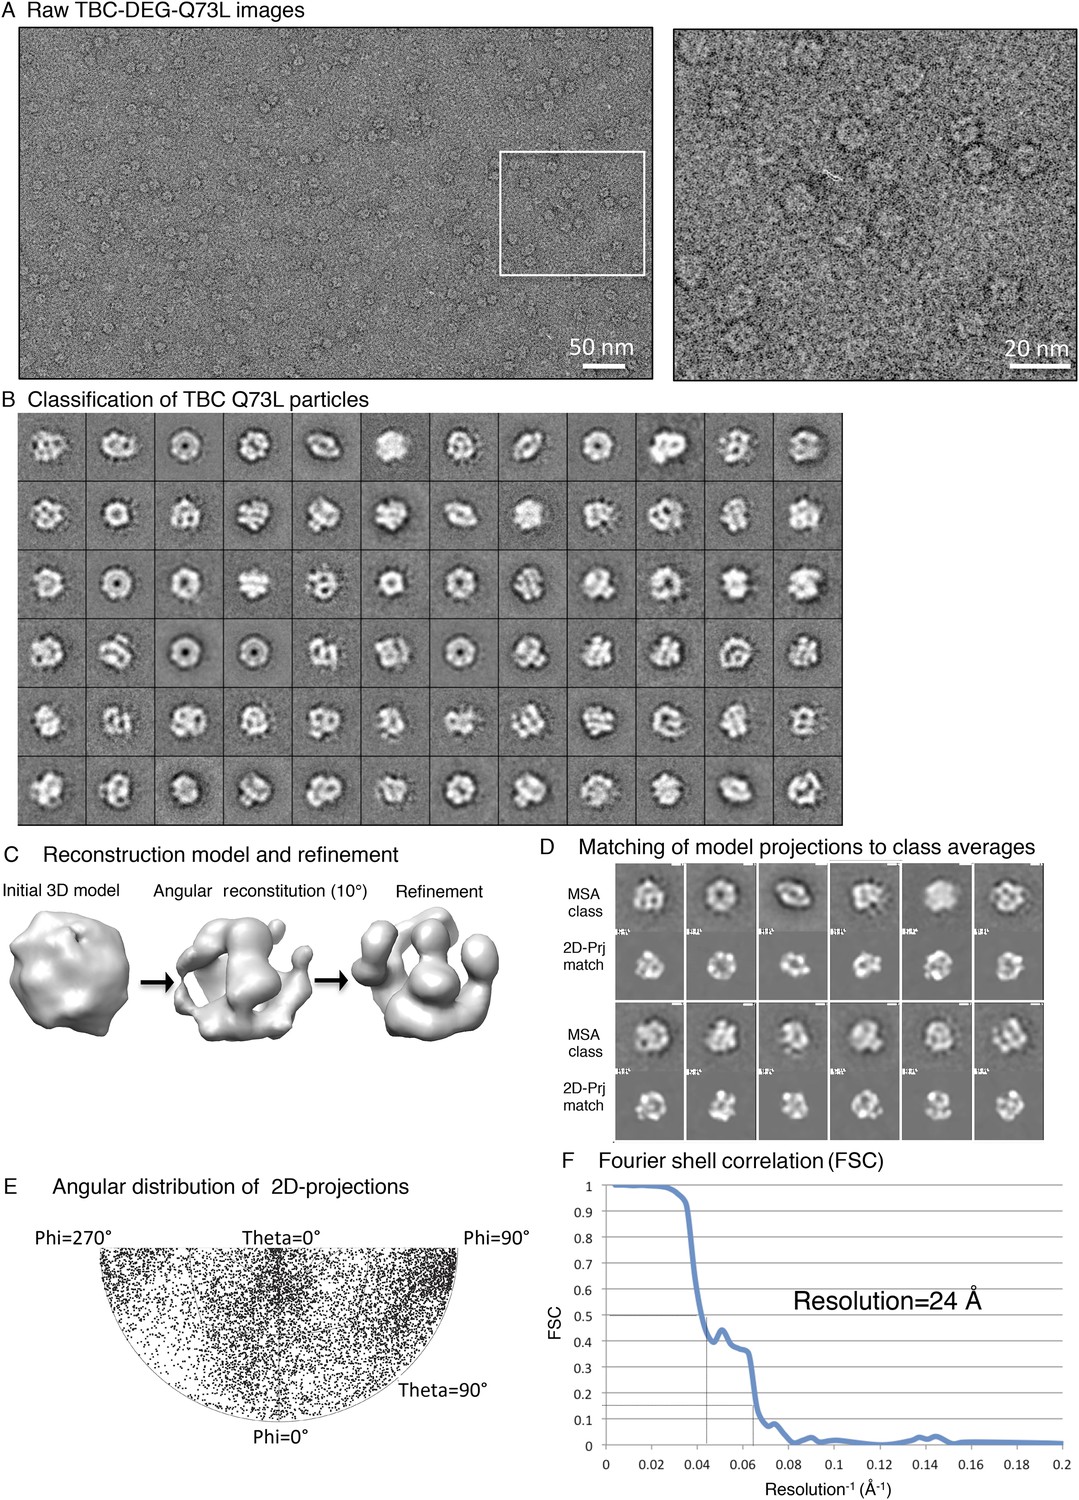
(A) Left panel, expanded view of a raw negative-stain EM image showing TBC-DEG Q73L globular particles with hollow cores. Right panel, higher magnification view of TBC-DEG particles showing the variety of orientations. (B) Multivariant statistical analysis (MSA) reference-free class averages of TBC-DEG-Q73L show a variety of commonly observed particle views. Few class averages appear off-center due the large mask size, which has no effect on classification or further analyses. (C) 3D reconstruction for the TBC-DEG-Q73L complex is initiated with a 50 Å resolution starting model (left), then iterative projecting matching (middle), followed by refinement (right). (D) Comparison of the reference-free class averages to 2D projections of the refined structure. Each panel shows a comparison between two images through projection matching: reference-free class averages (MSA, on top) and 2D projection from a 3D map of TBC-DEG Q73L:αβ-tubulin (2D Prj match). (E) Plot for phi and theta angular distribution for each individual TBC-DEG Q73L image used in the final reconstruction; the plot is using Angplot_dp. (F) Fourier shell correlation analysis of the TBC-DEG-Q73L reconstruction.
Figure 4—figure supplement 2

Mapping the TBCE N-terminal Cap-Gly domain using TBC-DE(N-GFP) fusion and 3D reconstructions.
(A) Multivariant statistical analysis based reference-free class averages for TBC-DE(NGFP) (middle panels) compared to TBC-DEG-Q73L (left panels); positions of GFPs are highlight in green in the TBC-DE(N-GFP)G class averages. Six comparable views are shown to describe the added density of GFP, marked by blue arrows. Some views, such as those on the bottom right, show GFP density on the TBC-DEG cage mass. (B) The TBC-DE(N-GFP)G raw map (green) in three different orientations rotated by 90° compared to the native TBC-DEG-Q73L map (gray) showing the N-GFP position.
Figure 4—figure supplement 3
Cumulative docking of atomic models for TBCD, TBCE paralogs, and Arl2 without segmentation using low-resolution model filtering.
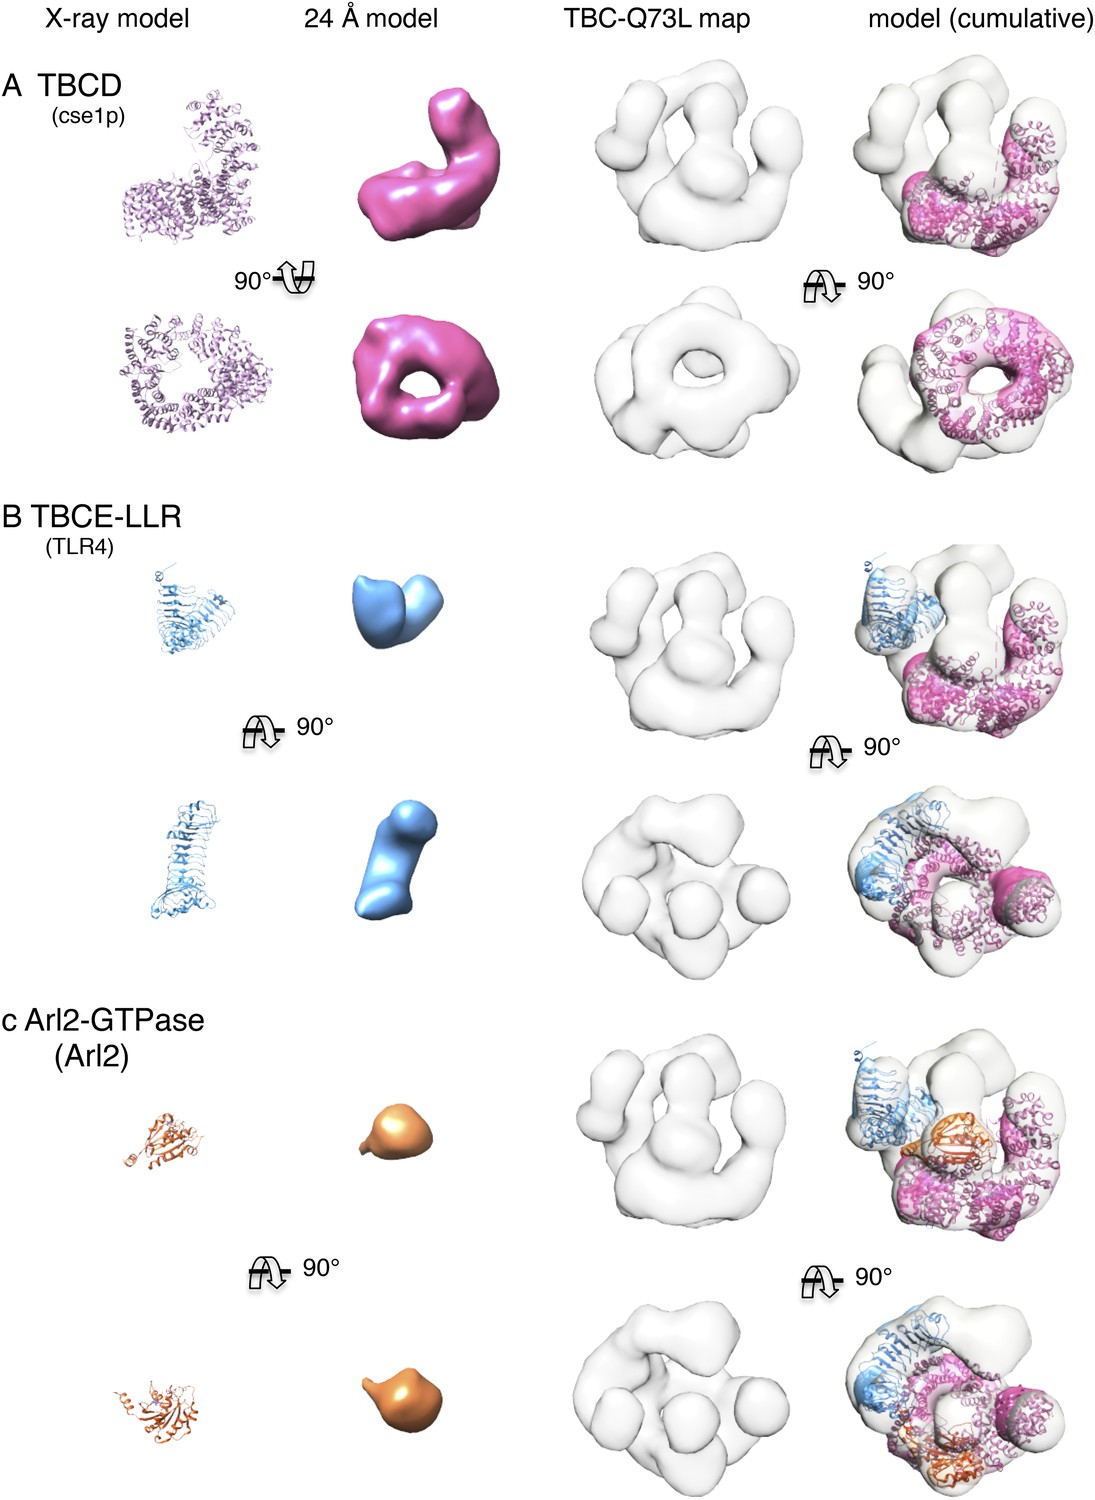
(A) The TBCD paralog (Cse1p) was docked into the TBC-DEG EM map. Panels (left to right): two orthogonal views of the TBCD paralog (Cse1) atomic model, 24 Å resolution filtered model, 24 Å TBC-DEG Q73L map, and TBCD model positioned into the TBC-DEG Q73L map. (B) The TBCE LLR domain paralog (TLR4) was docked into the TBC-DEG EM map. Panels (left to right): two orthogonal views of the TBCE LLR domain paralog (TLR4) atomic model, 24 Å resolution filtered model, 24 Å TBC-DEG Q73L map, and TBCE model positioned into the TBC-DEG Q73L map after TBCD paralog docking. Arrows point to the locations of globular densities that likely represent TBCE N and C-terminal domains. (C) Arl2 GTPase (Arl2) was docked into the TBC-DEG EM map. Panels (left to right): two orthogonal views of the Arl2 GTPase (Arl2) atomic model, 24 Å resolution filtered model, 24 Å TBC-DEG Q73L map, and Arl2 model positioned into the TBC-DEG Q73L map after TBCD and TBCE paralog docking.
Figure 5 with 1 supplement

TBC-DEG platforms engage the αβ-tubulin dimer asymmetrically, placing it in contact with Arl2 GTPase above the hollow core.
(A) A refined TBC-DEG-Q73L:αβ-tubulin 3D map shown in three rotated views. The map shows the presence of dual regions at the top of the TBC-DEG cage density. (B) A segmented TBC-DEG-Q73L:αβ-tubulin map shown in three rotated views. A dual lobed density (red) assigned to αβ-tubulin is bound by domains at the top side of the TBC-DEG-Q73L cage. Video 3 shows the A and B views. (C) A TBC-DEG-αβ-tubulin linear domain map shown to length scale. TBCD (pink, top panel) is composed of HEAT repeats. TBCE (second panel) includes a Cap-Gly domain (dark blue), a leucine rich repeat (LRR) domain (blue), and a ubiquitin-like domain (cyan). Arl2 (third panel) consists of a G-domain or GTPase fold (orange). αβ-tubulin (red) is shown in the bottom panel. Colors correspond to subunits shown in D–I. (D) A Pseudo-atomic model of the TBC-DEG-Q73L:αβ-tubulin complex showing the interfaces of TBCD, TBCE, and Arl2 engaging the intact αβ-tubulin asymmetrically. The model is built by fitting the densities of TBC-DEG segments as described in Figure 4 in addition to αβ-tubulin structure into the dual lobed density. (E) A 90° vertically rotated view of that shown in D. (F) A 90° horizontally rotated view of that shown in D. Video 2 shows the C–F views. (G) A central slice view of 90° counterclockwise horizontally rotated view of that shown in D. (H) Cartoon view of TBC-DEG domain organization comparable to the view shown in F (I) Cartoon view of TBC-DEG domain organization comparable to the view shown in G.
Figure 5—figure supplement 1
Electron microscopy and 3D reconstruction of the TBC-DEG-Q73L:αβ-tubulin complex.
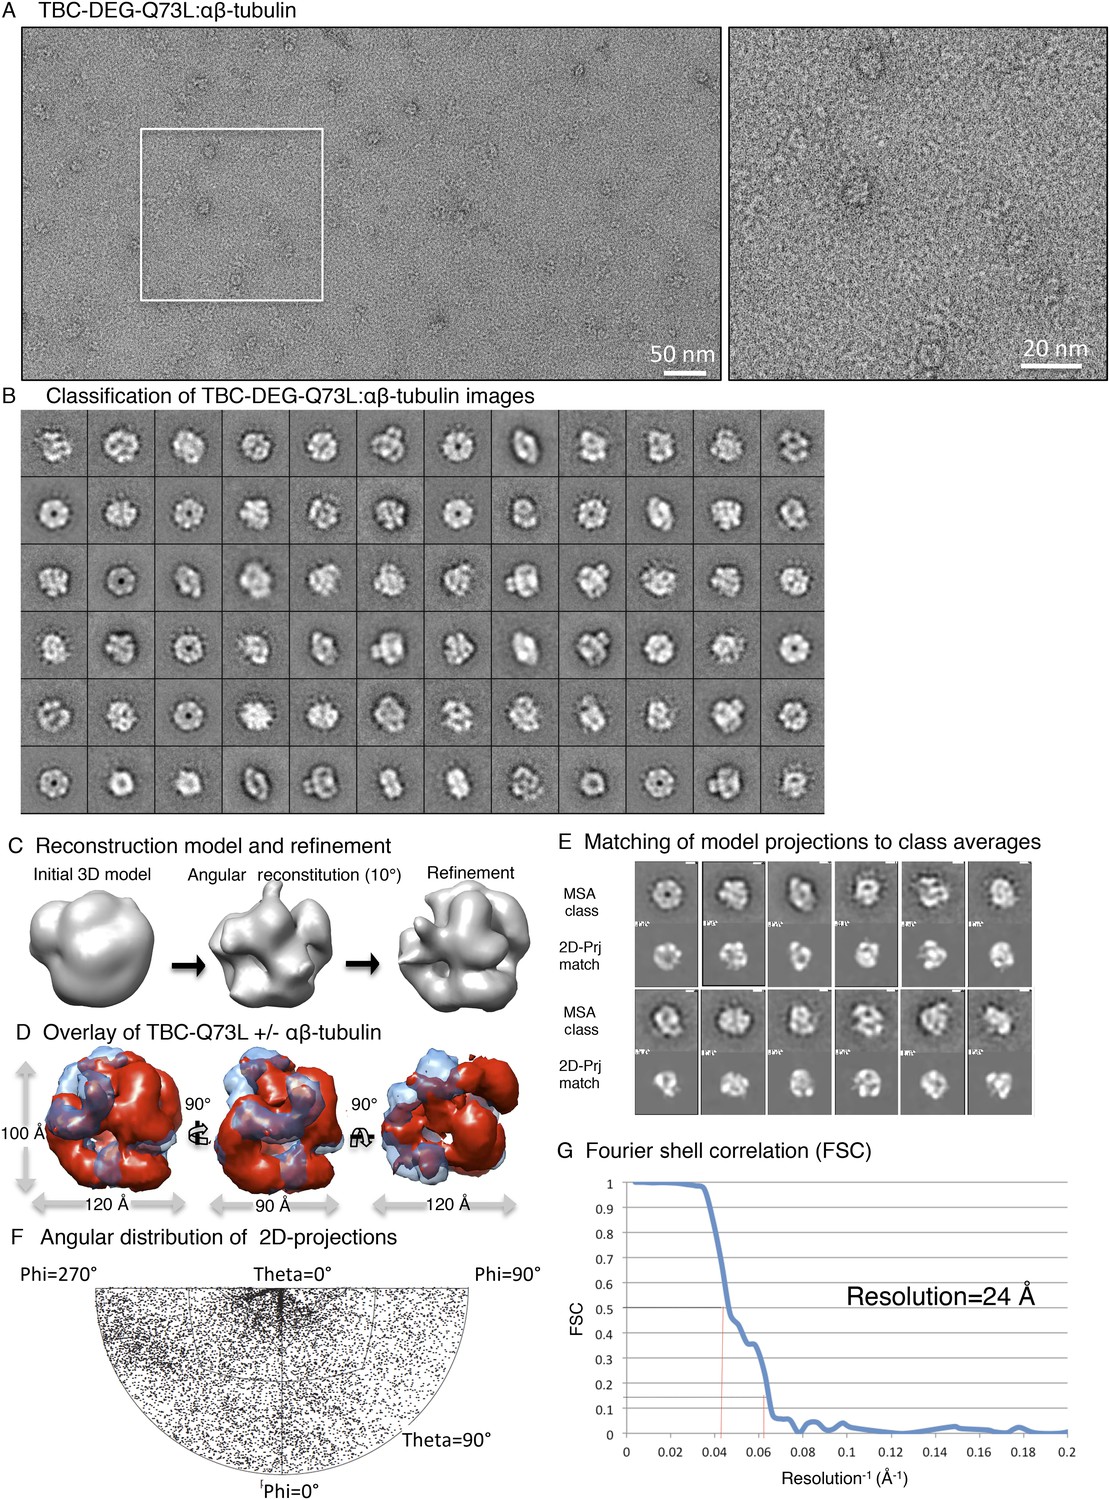
(A) Left panel, expanded view of a raw negative-stain EM image showing the TBC-DEG Q73L:αβ-tubulin complex. Right panel, higher magnification view of TBC-DEG particles showing the variety of orientations. (B) Multivariant statistical analysis (MSA) reference-free class averages of TBC-DEG-Q73L:αβ-tubulin show a variety of commonly observed particle views. (C) 3D reconstruction for TBC-DEG:αβ-tubulin is initiated with a 50 Å resolution starting model (left), then iterative projecting matching (middle), followed by refinement (right). (D) Overlay of the TBC-DEG-Q73L:αβ-tubulin map (red) over the TBC-Q73L map (transparent blue). (E) Comparison of the reference-free class averages to 2D projections of the refined reconstruction. Each panel shows a comparison between two images through projection matching: reference-free class averages (MSA, top) and 2D projection from a 3D map of TBC-DEG Q73L:αβ-tubulin (2D Prj match). (F) Phi and theta angular distribution plot for each individual TBC-DEG Q73L:αβ-tubulin image used in the final reconstruction; the plot is using Angplot_dp. (G) Fourier shell correlation analysis of the TBC-DEG-Q73L:αβ-tubulin reconstruction.
Figure 6 with 1 supplement
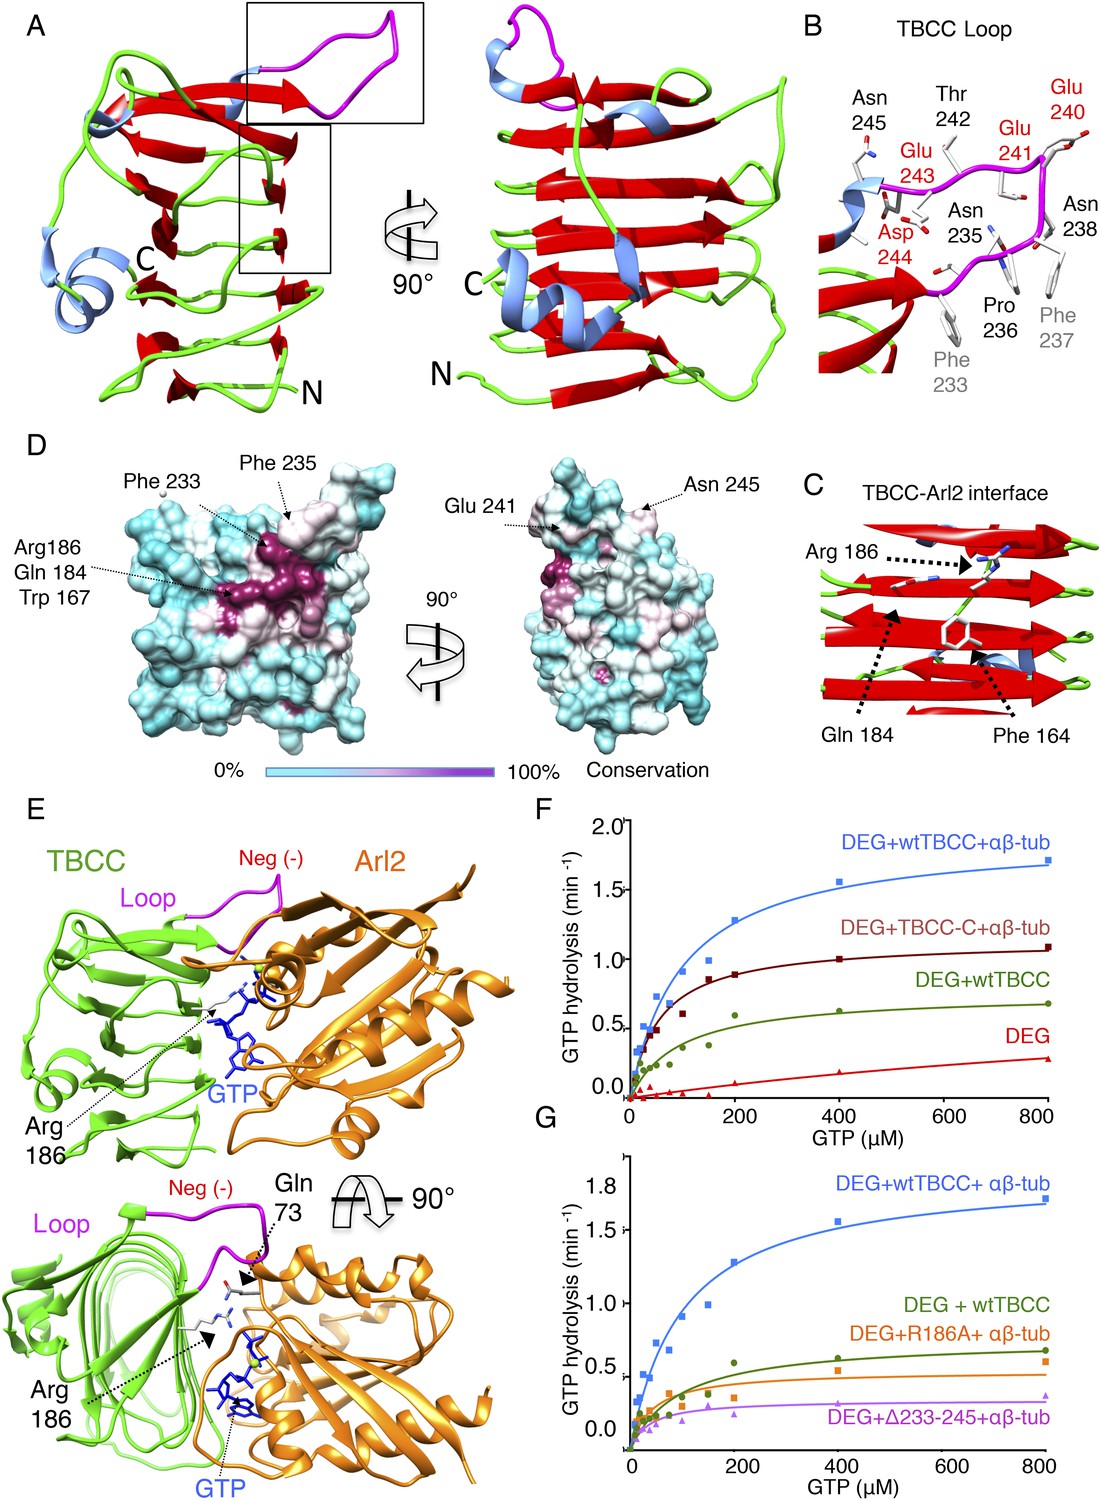
TBCC catalytic C-terminal domain x-ray structure suggests a TBCC-Arl2 binding interface to dissect the Arl2 contribution TBC-DEG GTP hydrolysis.
(A) The 2.0 Å x-ray structure of the TBCC C-terminal β-helix domain (100–267) in two rotated views. β-sheets (red) form a narrow helical structure in which turns (green) lie at the ends and a large conserved and structured loop (purple) is presented on top of the structure. (B) A close-up view of the TBCC conserved residues in the structured loop showing the hydrophobic (Phe233, 237) and acidic (Glu240, 241, 243 and Asp244) residues. (C) A close-up view of the Arl2 catalytic interface showing Glu184, Arg186, and Phe164. (D) TBCC β-helix surface conservation showing the high conservation of the Arl2 catalytic site on one side of the TBCC β-helix domain. The left panel, front view, and 90° rotated view are shown. A color key gradient describing the conservation is shown below, with purple denoting highest and cyan denoting lowest conservation. (E) An interface model for TBCC-β-helix domain-Arl2, based on a superimposition onto the RP2-Arl2 structures, which is described in detail in Figure 6—figure supplement 1, panel D. The model shows Arg186 to be the arginine finger activating GTP hydrolysis in Arl2. The Arl2 Gln73 interacts with a water molecule required for GTP nucleotide (shown in blue) during hydrolysis. The model shows the TBCC loop resides above Arl2 during the catalytic interface. (F) Steady-state GTP hydrolysis activity of TBC-DEG+αβ-tubulin+TBCC β-helix C-terminal domain 100–267, TBCC-C (DEG+TBCC-C+αβ-tub, brown) compared to TBC-DEG+αβ+tubulin+wild type TBCC (DEG+wtTBCC+αβ-tub, blue), showing the TBCC C-terminal domain is sufficient for GTP hydrolysis. TBC-DEG alone (DEG, shown in red) has very low basal GTP hydrolysis activity. Parameters are described in Table 3. (G) Steady-state GTP hydrolysis activity of TBC-DEG+αβ-tubulin+TBCC Arg186Ala (DEG+R186+αβ-tub, orange) compares well to wild type TBCC+TBC-DEG (DEG+wtTBCC; green), suggesting similar GTP hydrolysis parameters. TBC-DEG+αβ+tubulin+TBCC (DEG+Δ233-245+αβ-tub, pink) shows a similar defect in GTP hydrolysis. TBC-DEG+TBCC+αβ-tubulin (DEG+wtTBC+αβ-tub; blue) has a twofold higher GTP hydrolysis rate. Parameters are described in Table 3.
Figure 6—figure supplement 1
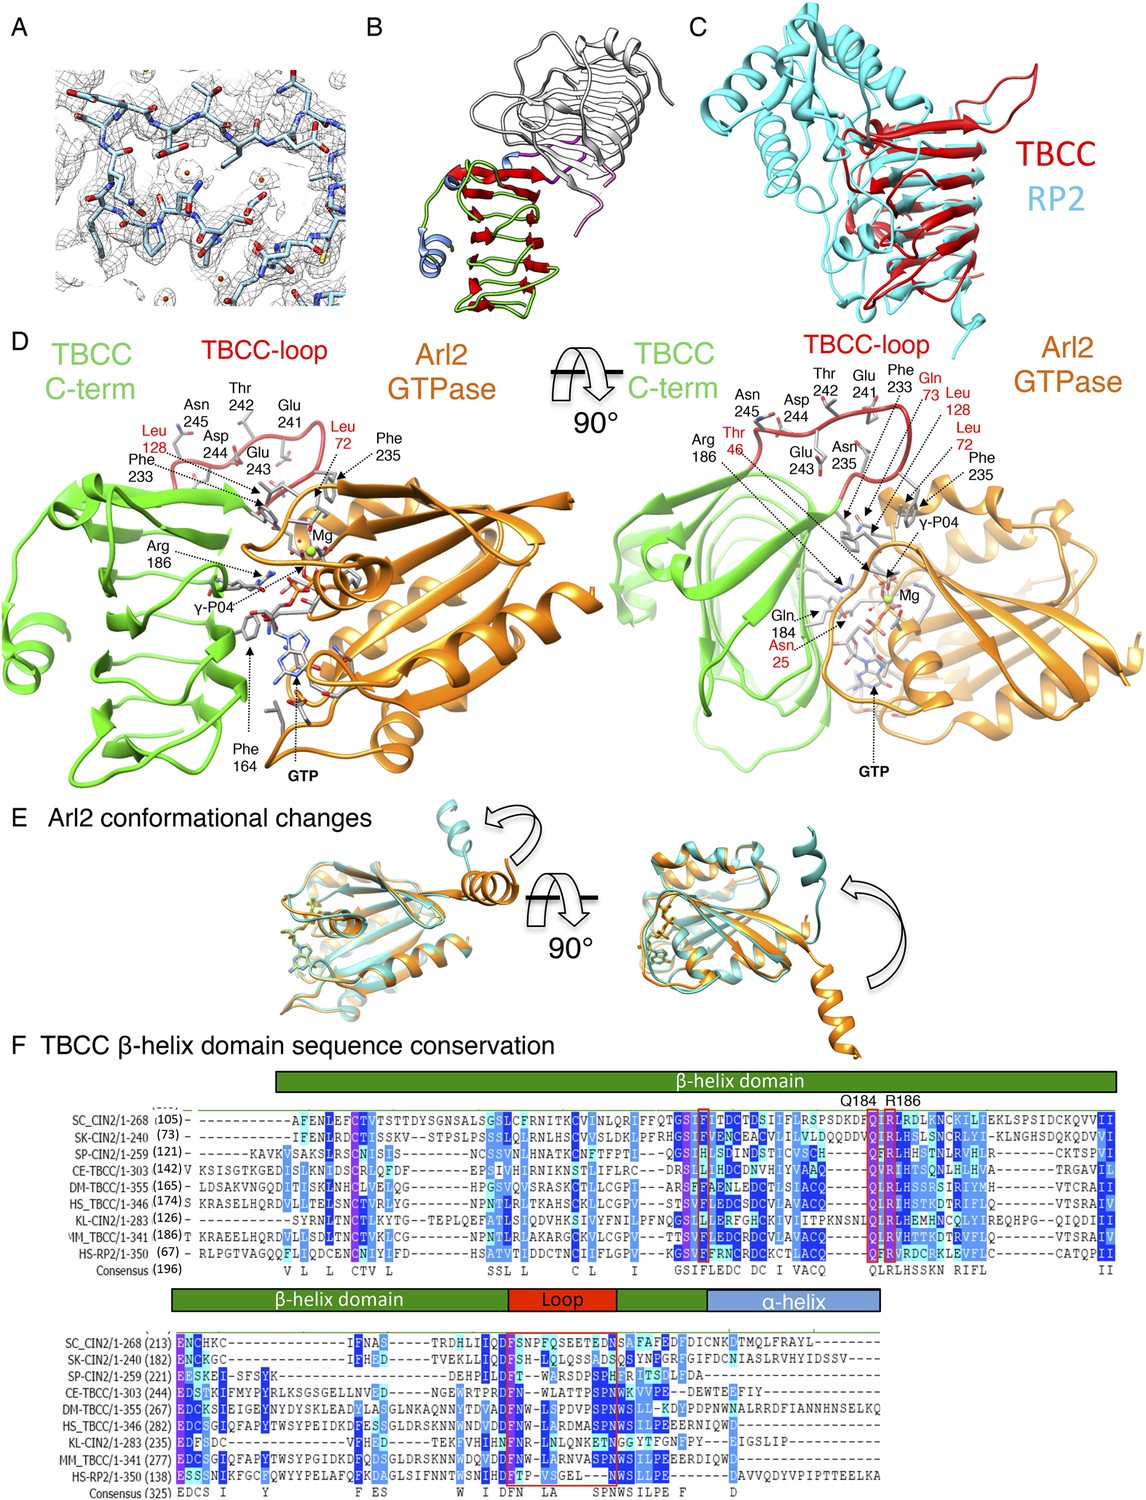
TBCC C-terminal domain is a β-helix structure with dual interfaces.
(A) Refined electron density map (1.0 σ) for the TBCC extended loop showing the hydrophobic and acidic residues. (B) Two TBCC C-terminal domain structures in the asymmetric crystallographic unit of space group P43. The structure described here is shown in red, while the second copy is shown in gray. (C) Structural overlay of the β-helix domain of TBCC (red) C-terminal domain with the RP2 domain (blue). (D) Detailed TBCC-Arl2 interface model showing catalytic role of Arg186 (Arg finger) and selectivity role of Phe233 and Phe235. Gln73 is required to catalyze the water residue that is necessary for catalysis. Acidic residues Glu241, Asn241, and Asp245 likely interact with other molecules in the TBC-DEG:αβ-tubulin complex. (E) Conformational changes in the Arl2 N-terminal domain upon nucleotide hydrolysis (Valtel et al., 2008) leading to αβ-tubulin catalysis activities observed in TBC-DEG:αβ-tubulin:TBCC ternary complexes. (F) Sequence alignments of TBCC β-helix domain showing the conserved residues. TBCC is predicted to consist of an N-terminal α-helical domain (yellow) and a C-terminal β-sheet domain (green) with its unique loop highlighted in red and its C-terminal helix (blue). The alignment includes TBC and Arl2 orthologs from Saccharomyces cerevisae (SC), Saccharomyces kluyveri (SK), Schizosacchromyces pombe (SP), Kluyveromyces lactis (Kl), Drosophila melanogaster (DM), Caenorhabdits elegans (CE), and Human (HS).
Figure 7 with 1 supplement
A TBC-DEG:αβ-tubulin:TBCC ternary complex structure shows TBCC engages both Arl2 and αβ-tubulin dimer, deforming its intra-dimer interface.
(A) A refined 24 Å TBC-DEG-Q73L:αβ-tubulin:TBCC 3D map shown in three rotated views. The map shows conformational changes in tubulin density and the presence of new densities in the hollow core of the cage. (B) A segmented 24 Å TBC-DEG-Q73L:αβ-tubulin:TBCC map shown in three rotated views. The tubulin dimer density (red) is deformed by two new densities: a TBCC wedge shaped density engages the Arl2 interface (green), and a second density (cyan) is wedging between the two αβ-tubulin dimer lobes (red). (C) A TBC-DEG:αβ-tubulin:TBCC linear domain map shown to length scale. TBCD (pink, top panel) is composed of HEAT repeats. TBCE (second panel) includes a Cap-Gly domain (dark blue), a leucine rich repeat (LRR) domain (blue), and a ubiquitin-like domain (cyan). TBCC consists of a spectrin domain (yellow) and a C-terminal β-helix domain (green) (described in Figure 5), and Arl2 (third panel) consists of a GTPase fold (orange). αβ-tubulin (red) is shown in the bottom panel. Colors correspond to subunits shown in D–I. (D) A pseudo-atomic model of the TBC-DEG-Q73L:αβ-tubulin:TBCC ternary complex showing the interfaces of the TBCC β-helix catalytic domain (described in Figure 5, green) engaging Arl2 (orange) on top of TBCD (pink) while bound by the TBCE LRR bow (blue), while the α and β-tubulins are wedged by the ubiquitin domain (cyan). The α and β-tubulin coordinates were fit individually due to deformation in the tubulin intra-dimer interface in this map. The TBCC N-terminal spectrin domain (yellow) was fit into a density added to the floor segment. (E) A 90° vertically rotated view of that shown in D. (F) A 90° horizontally rotated view of that shown in D. (G) A central slice view of a 90° counterclockwise horizontally rotated view of that shown in D. The TBCC C-terminal catalytic domain engages Arl2 and binds the αβ-tubulin at the deformed intra-dimer interface with its unique loop (pink ribbon). Video 3 shows the C–F views. (H) Comparison of αβ-tubulin conformation based on αβ-tubulin coordinates fit into the αβ-tubulin density from the TBC-DEG-Q73L:αβ-tubulin map shown in the left panel (−TBCC) compared to the αβ-tubulin coordinates fit into the αβ-tubulin density in the TBC-DEG-Q73L:αβ-tubulin:TBCC map shown on the right (+TBCC), showing the conformational change at its intra-dimer interface that is associated with TBCC binding. (I) Cartoon view of TBC-DEG domain organization comparable to the view shown in E. (J) Cartoon view of TBC-DEG domain organization comparable to the view shown in F.
Figure 7—figure supplement 1
Electron microscopy and 3D reconstruction of the TBC-DEG-Q73L:αβ-tubulin:TBCC complex.
(A) Left panel, expanded view of a raw negative-stain EM image showing TBC-DEG Q73L:αβ-tubulin:TBCC complex. Right panel, higher magnification view of TBC-DEG-Q73L:αβ-tubulin:TBCC particles showing the variety of orientations. (B) Multivariant statistical analysis (MSA) reference-free class averages of TBC-DEG-Q73L:αβ-tubulin show a variety of commonly observed particle views. (C) 3D reconstruction for the TBC-DEG complex is initiated with a 50 Å resolution starting model (left), then iterative projecting matching (middle), followed by refinement (right). (D) Overlay of the TBC-DEG-Q73L:αβ-tubulin map (red) over the TBC-Q73L map (transparent blue). (E) Comparison of the reference-free class averages to 2D projections of the refined structure. Each panel shows a comparison between two images through projection matching: reference-free class averages (MSA, on top) and 2D projection from the 3D map of TBC-DEG Q73L:αβ-tubulin:TBCC (2D Prj match). (F) Phi and theta angular distribution plot for each individual TBC-DEG Q73L:αβ-tubulin:TBCC image used in the final reconstruction; the plot is using Angplot_dp. (G) Fourier shell correlation analysis of the TBC-DEG-Q73L:αβ-tubulin:TBCC reconstruction.
Figure 8
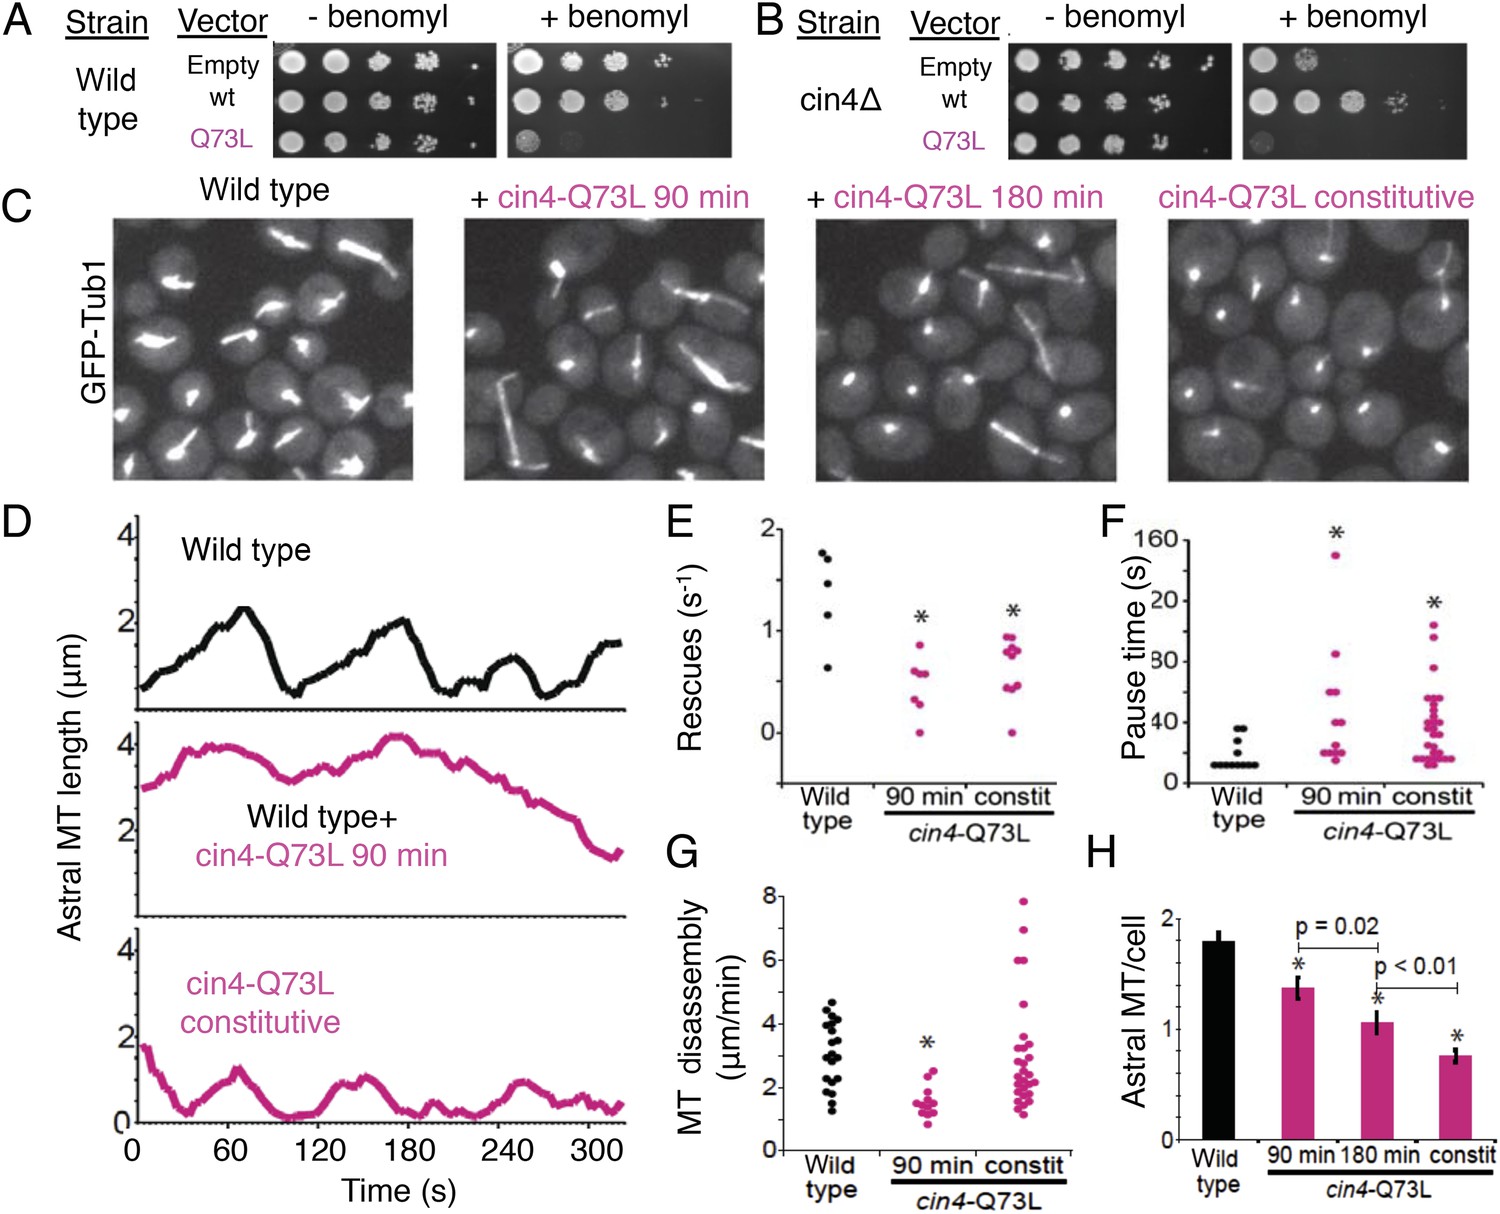
Introducing the Arl2 GTP-locked Q73L mutation induced pausing of dynamic MTs in vivo.
(A) Expression of cin4-Q73L elicits dominant benomyl sensitivity and MT polymerization defects. Wild type or cin4∆ mutant cells transformed with plasmids expressing the indicated genes under galactose-inducible promoters were plated on inducing media without benomyl or with 10 µg/ml benomyl, and grown at 30°C for 4 days. (B) Expression of cin4-Q73L interferes with MT dynamics and activates pausing. Right panel, wild type cells expressing MT labeled with Tub1-GFP. Strain: yJM0562. Second panel, wild type yeast cells expressing Tub1-GFP transformed with a cin4-Q73L expression plasmid and treated with galactose to induce expression for 90 min before imaging. Third panel, a separate population of wild type cells transformed with a cin4-Q73L expression plasmid and induced for 180 min before imaging. Right panel, cells constitutively expressing cin4-Q73L from the chromosomal locus. Images are 2D projections of 13 Z planes separated by 400 nm. (C) Representative raw fields of yeast cells in each condition with MTs labeled with GFP-tub. Videos 4–7 accompany these panels. (D) Representative lifeplots of astral MT dynamics in wild type cells (top panel), wild type cells expressing cin4-Q73L for 90 min (middle panel), and cin4-Q73L mutants (bottom panel). Astral MT length was measured over time by plotting the distance between the spindle and the distal end of the MT. Strains: wild type, yJM0562; cin4-Q73L, yJM1375. (E) MT rescue frequencies from time-lapse imaging of wild type (n = 5), wild type expressing cin4-Q73L for 90 min (n = 7), and constitutive cin4-Q73L mutant (n = 10) cells. Asterisks indicate statistical significance (p<0.01) determined by t-test, compared to wild type. Strains: wild type, yJM0562; cin4-Q73L, yJM1375. (F) Durations of pause events from time-lapse imaging of wild type (black), wild type expressing cin4-Q73L for 90 min, and constitutive cin4-Q73L mutant cells (shown in pink). Asterisks indicate statistical significance (p<0.01) determined by t-test, compared to wild type. Strains: wild type, yJM0562; cin4-Q73L, yJM1375. (G) Average MT disassembly rates from time-lapse imaging of wild type (black), wild type expressing cin4-Q73L for 90 min, and constitutive cin4-Q73L mutant cells (shown in pink). Asterisks indicate statistical significance (p<0.01) determined by t-test, compared to wild type. Strains: wild type, yJM0562; cin4-Q73L, yJM1375. (H) Average length of astral MTs (aMT) per yeast cell measured, for wild type (black), wild type expressing cin4-Q73L for 90 min, and constitutive cin4-Q73L mutant cells (shown in pink). Asterisks indicate statistical significance (p<0.01) determined by t-test, compared to wild type. Strains: wild type, yJM0562; cin4-Q73L, yJM1375.
Figure 9
A revised scheme for tubulin factors and Arl2 as a chaperone multi-subunit machine in regulating soluble αβ-tubulin.
(A) Revised paradigm, based on data from this study for tubulin cofactors and Arl2 as a multi-subunit chaperone that cycles to regulate soluble αβ-tubulin through GTP hydrolysis catalytic cycles, while providing sites for α and β-tubulin dissociation for biogenesis and degradation. Through this model, dual GTP hydrolyses in Arl2 and possibly in αβ-tubulin sequentially induce tubulin dimer dissociation without release. We suggest that αβ-tubulin is reassembled and then released. (B) An overall model for how TBC-DEG/TBCC activity cycles may regulate slowly decaying tubulin by binding along the TBC-DEG platform, recruiting TBCC, and then dissociating α and β-tubulin from each other, without dissociation from the TBC-DEG/TBCC platform.
Videos
Video 1
The video shows a 360° rotation of the raw TBC-DEG-Q37L map (Figure 4A ) and a 360° rotation of the segmented TBC-DEG-Q73L map (accompanies Figure 4).
The color scheme is described in Figure 3B. This is followed by a 360° rotation of the raw TBC-DEG-Q37L segmented and coordinate fitted map (Figure 4D–G), followed by a clipping view slicing across a segmented and fitted TBC-DEG-Q73L map (Figure 4G).
Video 2
The video shows a 360° rotation of the raw TBC-DEG-Q37L:αβ-tubulin map (Figure 5A) and a 360° rotation of the segmented TBC-DEG-Q73L:αβ-tubulin map (accompanies Figure 5).
This is followed by 360° rotation of the overlaid TBC-DEG-Q73L (blue) and TBC-DEG-Q73L:αβ-tubulin maps (red) as shown in Figure 5—figure supplement 1D. This is followed by 360° rotation of the raw TBC-DEG-Q37L:αβ-tubulin segmented and coordinate fitted map (Figure 5D–G), followed by a clipping view slicing across the segmented and fitted TBC-DEG-Q73L:αβ-tubulin map.
Video 3
The video shows a 360° rotation of the raw TBC-DEG-Q37L:αβ-tubulin:TBCC map (Figure 7A)
followed by a 360° rotation of the overlaid TBC-DEG-Q73L:αβ-tubulin:TBCC map (blue) with the TBC-DEG-Q73L:αβ-tubulin map (red) as shown in Figure 7—figure supplement 1D (accompanies Figure 7). This is next followed by a 360° rotation of the segmented TBC-DEG-Q73L:αβ-tubulin:TBCC map (accompanies in Figure 7), followed by a 360° rotation of the TBC-DEG-Q37L:αβ-tubulin:TBCC segmented and fitted map (Figure 7D–G), and followed by a clipping view slicing across the segmented and fitted TBC-DEG-Q73L:αβ-tubulin:TBCC map.
Video 4
Microtubule dynamics in wild type cells (accompanies Figure 8C).
Time-lapse images of wild type cells expressing Tub1-GFP were captured on a spinning disk confocal microscope at 4 s intervals for 10 min. Each image represents a composite of 13 planes separated by 400 nm. Video plays at 60 times real time. Strain yJM0562.
Video 5
Microtubule dynamics after 90 min of cin4-Q73L expression (accompanies Figure 8C).
Time-lapse images of wild type cells expressing Tub1-GFP containing a cin4-Q73L expression plasmid after 90 min of induction. Images were captured on a spinning disk confocal microscope at 5 s intervals for 10 min. Each image represents a composite of 15 planes separated by 400 nm. Video plays at 60 times real time. Strain yJM0562, with plasmid pJM0231.
Video 6
Microtubule dynamics after 180 min of cin4-Q73L expression (accompanies Figure 8C).
Time-lapse images of wild type cells expressing Tub1-GFP containing a cin4-Q73L expression plasmid after 180 min of induction. Images were captured on a spinning disk confocal microscope at 5 s intervals for 10 min. Each image represents a composite of 15 planes separated by 400 nm. Video plays at 60 times real time. Strain yJM0562, with plasmid pJM0231.
Video 7
Microtubule dynamics in cin4-Q73L mutant cells (accompanies Figure 8C).
Time-lapse images of cells constitutively expressing cin4-Q73L from the chromosomal locus and Tub1-GFP were captured on a spinning disk confocal microscope at 4 s intervals for 10 min. Each image represents a composite of 13 planes separated by 400 nm. Video plays at 60 times real time. Strain yJM1375.
Tables
Table 1
Identification of tubulin cofactor subunits* using nano-LC-MS/MS
| Protein name | Molecular mass | pI | Peptide coverage |
|---|---|---|---|
| Yeast TBCD (cin1p) | 116,647.8 Da | 8.53 | 82.1% |
| Yeast TBCE (pac2p) | 59,257.6 Da | 8.77 | 79.3% |
| Yeast Arl2 (cin4p) | 22,066.6 Da | 5.70 | 85.9% |
| Yeast TBCC (cin2p) | 34,045.4 Da | 7.05 | 9.0% |
-
*
Identified from His-TBCD TBCE, TBCC, TBCB, TBCA, and Arl2 co-expression.
Table 2
Size exclusion chromatography (SEC) and SEC with multi-angle light scattering (SEC-MALS) parameters for tubulin cofactor and αβ-tubulin complexes
| Protein complex | Elution volume | Predicted | Apparent | SEC-MAL | Stokes R |
|---|---|---|---|---|---|
| TBC-DEG | 11.5 ml | 198 kDa | 213 kDa | 215 ± 10 kDa | ∼50 Å |
| TBC-DEG:αβ-tub | 10.7 ml | 308 kDa | 322 kDa | 310 ± 10 kDa | ∼56 Å |
| TBC-DEG:C:αβ-tub-GDP.ALFx | 10.2 ml | 342 kDa | 376 kDa | 335 ± 10 kDa | ∼59 Å |
| TBC-DEG-Q73L | 10.6 ml | 198 kDa | 218 kDa | N/A | ∼50 Å |
| TBC-DEG-Q73L:αβ-tub | 10.7 ml | 308 kDa | 322 kDa | N/A | ∼56 Å |
| TBC-DEGQ73L:C:αβ-tub | 10.2 ml | 342 kDa | 376 kDa | 340 ± 10 kDa | ∼59 Å |
| αβ-tubulin dimer | 12.9 ml | 100 kDa | 103 kDa | 100 ± 5 kDa | ∼39 Å |
| TBCC | 15.0 ml | 34 kDa | 35 kDa | 30 ± 5 kDa | ∼27 Å |
Table 3
Steady-state GTP hydrolysis parameters for TBC-DEG, TBCC, and αβ-tubulin
| GTP hydrolysis reactions | Km (GTP) | kcat (min−1/μM) |
|---|---|---|
| 1 μM TBC-DEG | 400 ± 30 μM | 0.06 ± 0.01 |
| 1 μM TBCC:1 μM αβ-tub | 20 ± 15 μM | 0.00 ± 0.01 |
| 1 μM TBC-DEG:1 μM αβ-tub | 69 ± 12 μM | 0.40 ± 0.01 |
| 1 μM TBC-DEG:1 μM TBCC | 94 ± 10 μM | 0.77 ± 0.04 |
| 1 μM TBC-DEG:1 μM TBCC:1 μM αβ-tub | 99 ± 10 μM | 1.88 ± 0.03 |
| 1 μM TBC-DEG-Q73L:1 μM TBCC:1 μM αβ-tub | 371 ± 20 μM | 0.50 ± 0.05 |
| 1 μM TBC-DEG:1 μM TBCC:0.25 μM αβ-tub | 87 ± 5 μM | 1.10 ± 0.06 |
| 1 μM TBC-DEG:1 μM TBCC:0.5 μM αβ-tub | 112 ± 4 μM | 1.41 ± 0.05 |
| 1 μM TBC-DEG:1 μM TBCC:1.5 μM αβ-tub | 98 ± 8 μM | 2.38 ± 0.08 |
| 1 μM TBC-DEG:1 μM TBCC:3.0 μM αβ-tub | 88 ± 9 μM | 2.77 ± 0.11 |
| 1 μM TBC-DEG:0.12 μM TBCC:1 μM αβ-tub | 149 ± 7 μM | 1.53 ± 0.04 |
| 1 μM TBC-DEG:0.25 μM TBCC:1 μM αβ-tub | 129 ± 3 μM | 1.69 ± 0.02 |
| 1 μM TBC-DEG:0.50 μM TBCC:1 μM αβ-tub | 108 ± 5 μM | 1.74 ± 0.04 |
| 1 μM TBC-DEG:1 μM TBCC-R186A:1 μM αβ-tub | 40 ± 10 μM | 0.54 ± 0.04 |
| 1 μM TBC-DEG:1 μM TBCC-Δ233-245:1 μM αβ-tub | 35 ± 8 μM | 0.34 ± 0.03 |
| 1 μM TBC-DEG:1 μM TBCC-Cterm:1 μM αβ-tub | 56 ± 7 μM | 1.13 ± 0.07 |
Table 4
Electron microscopy Fourier shell correlation (FSC) resolution analyses
| Complex | Particle images | Resolution (Å)* |
|---|---|---|
| TBC-DEG-Q73L | 16,000 | 24.0 |
| TBC-DEG-Q73L-αβ-tub | 19,000 | 24.0 |
| TBC-DEG-Q73L-αβ-tub:TBCC | 18,000 | 24.0 |
| TBC-DE(N-GFP)G | 15,000 | 24.0 |
-
*
Resolution cross-correlation criterion cut-off set at 0.5.
Table 5
Crystallographic statistics table for TBCC structure determination
| TBCC native | TBCC Pt-peak | TBCC Pt-inflection | TBCC Pt-remote | |
|---|---|---|---|---|
| Data collection | ||||
| Resolution range (Å) | 34.90–2.00 (2.07–2.00)* | 41.80–2.18 (2.30–2.18)* | 35.01–2.18 (2.30–2.18)* | 31.94–2.18 (2.30–2.18)* |
| Space group | P 43 | P 43 | P 43 | P 43 |
| Wavelength (Å) | 0.9795 | 1.0715 | 1.0719 | 0.9537 |
| Unit cell (Å): a, b, c | 69.79, 69.79, 78.18 | 70.03, 70.03, 77.95 | 70.03, 70.03, 77.95 | 70.03, 70.03, 77.95 |
| Total reflections | 193,620 | 198,772 | 198,980 | 199,576 |
| Unique reflections | 25,377 (2504)* | 19,716 (2871)* | 19,752 (2879)* | 19,748 (2877)* |
| Average mosaicity | 0.29 | 0.40 | 0.40 | 0.42 |
| Anomalous multiplicity | – | 5.1 (5.0)* | 5.1 (5.0)* | 5.2 (5.1)* |
| Multiplicity | 7.6 (7.6)* | 10.1 (10.0)* | 10.1 (9.9)* | 10.1 (10.1)* |
| Anomalous completeness (%) | – | 100.0 (100.0)* | 100.0 (100.0)* | 100.0 (100.0)* |
| Completeness (%) | 100.0 (100.0)* | 100.0 (100.0)* | 100.0 (100.0)* | 100.0 (100.0)* |
| <I/σ (I)> | 13.4 (2.7)* | 28.6 (9.0)* | 28.4 (8.8)* | 28.1 (8.5)* |
| Rmerge† | 0.082 (0.72)* | 0.046 (0.23)* | 0.046 (0.23)* | 0.046 (0.25)* |
| f′ | – | 17.40 | 23.23 | 4.70 |
| f′′ | – | 15.67 | 10.29 | 11.30 |
| Structure refinement | ||||
| Rwork | 0.20 (0.26)* | – | – | – |
| Rfree | 0.24 (0.28)* | – | – | – |
| Molecules per asymmetric unit | 2 | – | – | – |
| Number of atoms | 2744 | – | – | – |
| Protein residues | 329 | – | – | – |
| Number of water molecules | 93 | – | – | – |
| RMS bond lengths (Å) | 0.007 | – | – | – |
| RMS bond angles (°) | 1.00 | – | – | – |
| Ramachandran favored (%) | 96.0 | – | – | – |
| Ramachandran allowed (%) | 0.0 | – | – | – |
| Ramachandran outliers (%) | 0.0 | – | – | – |
| Clashscore | 4.6 | – | – | – |
| Mean B values (Å2) | ||||
| Overall | 50.4 | – | – | – |
| Main-chain atoms | 46.2 | – | – | – |
| Side-chain atoms | 54.6 | – | – | – |
| Solvent | 49.4 | – | – | – |
-
*
Numbers represent the highest-resolution shell.
-
†
Rmerge = ΣhklΣi|Ii(hkl) − Iav(hkl)|/ΣhklΣiIi(hkl).
Table 6
Microtubule (MT) dynamics in cin4-Q73L mutant yeast cells
| MT length (µm) | Assembly rate (µm/min) | Assembly duration (s) | Disassembly rate (µm/min) | Disassembly duration (s) | Catastrophes (min−1) | Rescues (min−1) | Pause duration (s) | |
|---|---|---|---|---|---|---|---|---|
| Wild type | 0.90 ± 0.02 | 1.4 ± 0.06 | 46 ± 3 | 3.06 ± 0.24 | 27 ± 2 | 0.90 ± 0.12 | 1.5 ± 0.18 | 18 ± 3 |
| Wild type + cin4-Q73L (90 min) | 2.69 ± 0.05 | 1.4 ± 0.18 | 58 ± 12 | 1.56 ± 0.12 | 53 ± 10 | 0.66 ± 0.12 | 0.48 ± 0.12 | 36 ± 11 |
| cin4-Q73L | 0.71 ± 0.02 | 1.5 ± 0.06 | 41 ± 4 | 3.00 ± 0.36 | 24 ± 4 | 0.78 ± 0.06 | 0.66 ± 0.12 | 37 ± 4 |
-
Values are mean ± SEM of measurements from at least five cells imaged for 600 s. Values in boldface are significantly different from wild type (p<0.05), determined by t-test.
Download links
A two-part list of links to download the article, or parts of the article, in various formats.
Downloads (link to download the article as PDF)
Open citations (links to open the citations from this article in various online reference manager services)
Cite this article (links to download the citations from this article in formats compatible with various reference manager tools)
Tubulin cofactors and Arl2 are cage-like chaperones that regulate the soluble αβ-tubulin pool for microtubule dynamics
eLife 4:e08811.
https://doi.org/10.7554/eLife.08811


