Endothelial Ca2+ oscillations reflect VEGFR signaling-regulated angiogenic capacity in vivo
- National Cerebral and Cardiovascular Center Research Institute, Japan
- National Institute of Genetics, Japan
- Japan Agency for Medical Research and Development, Japan
Figures
Figure 1 with 2 supplements
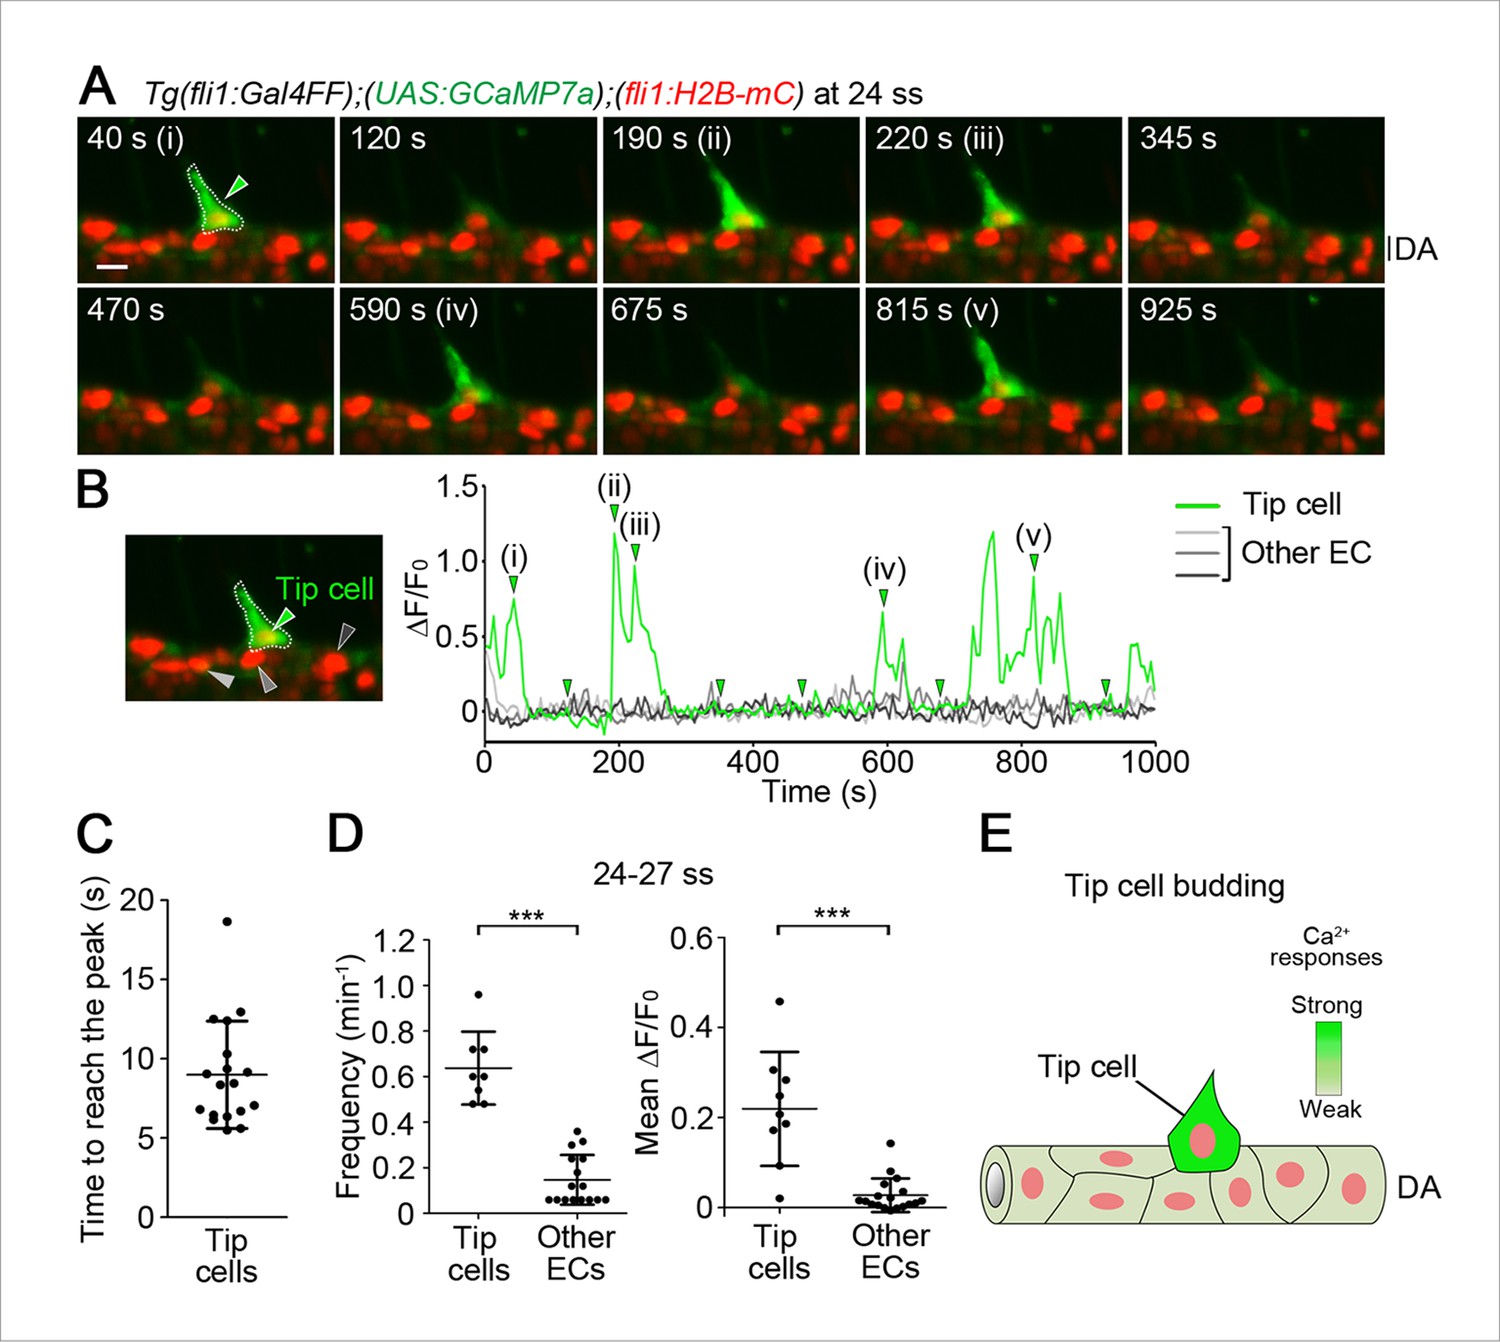
Ca2+ oscillations in tip cells during budding from the dorsal aorta (DA).
(A) 3D-rendered time-sequential images of the trunk regions of Tg(fli1:Gal4FF);(UAS:GCaMP7a);(fli1:H2B-mC) embryos during vessel sprouting from the DA (24 somite stage (ss)). 3D images were acquired using a light sheet microscope. The merged images of GCaMP7a (green) and H2B-mC (red) images are shown in the following images, unless otherwise described. All the zebrafish images are lateral views and displayed as anterior to the left. A green arrowhead indicates a tip cell outlined by a dashed line. (i)-(v) and other images are those indicated by the arrowheads indicated at a graph in B. (B) The fluorescence changes in GCaMP7a (ΔF/F0) of individual ECs from A indicated by arrowheads (green, light gray, dark gray, and black) at the left panel are shown as a graph. To measure the fluorescence intensity of GCaMP7a (green) in individual EC, the cell nucleus (red) was tracked over time (see ‘Materials and methods’). (C) Dot-plot graphs depicting the time to reach the peak of each Ca2+-oscillation in tip cells. Time-lapse 2D slice images of Tg(fli1:Gal4FF);(UAS:GCaMP7a);(fli1:H2B-mC) embryos taken every 100 ms as in Figure 1—figure supplement 2B were analyzed for quantification. Horizontal lines represent mean ± s.d. (n = 18). (D) Quantification of Ca2+ oscillation frequency (left) and mean ΔF/F0 (right) in tip cells and other ECs within the DA during tip cell budding (24–27 ss) (see ‘Materials and methods’). Each dot represents the value for a single cell. Horizontal lines represent mean ± s.d. (n ≥ 8). (E) Schematic model of tip cells showing Ca2+ oscillations when they sprout from the DA. Intensity of green reflects the frequency of Ca2+ oscillations. Scale bar, 10 μm in A. ***p < 0.001. DA, dorsal aorta.
Figure 1—figure supplement 1
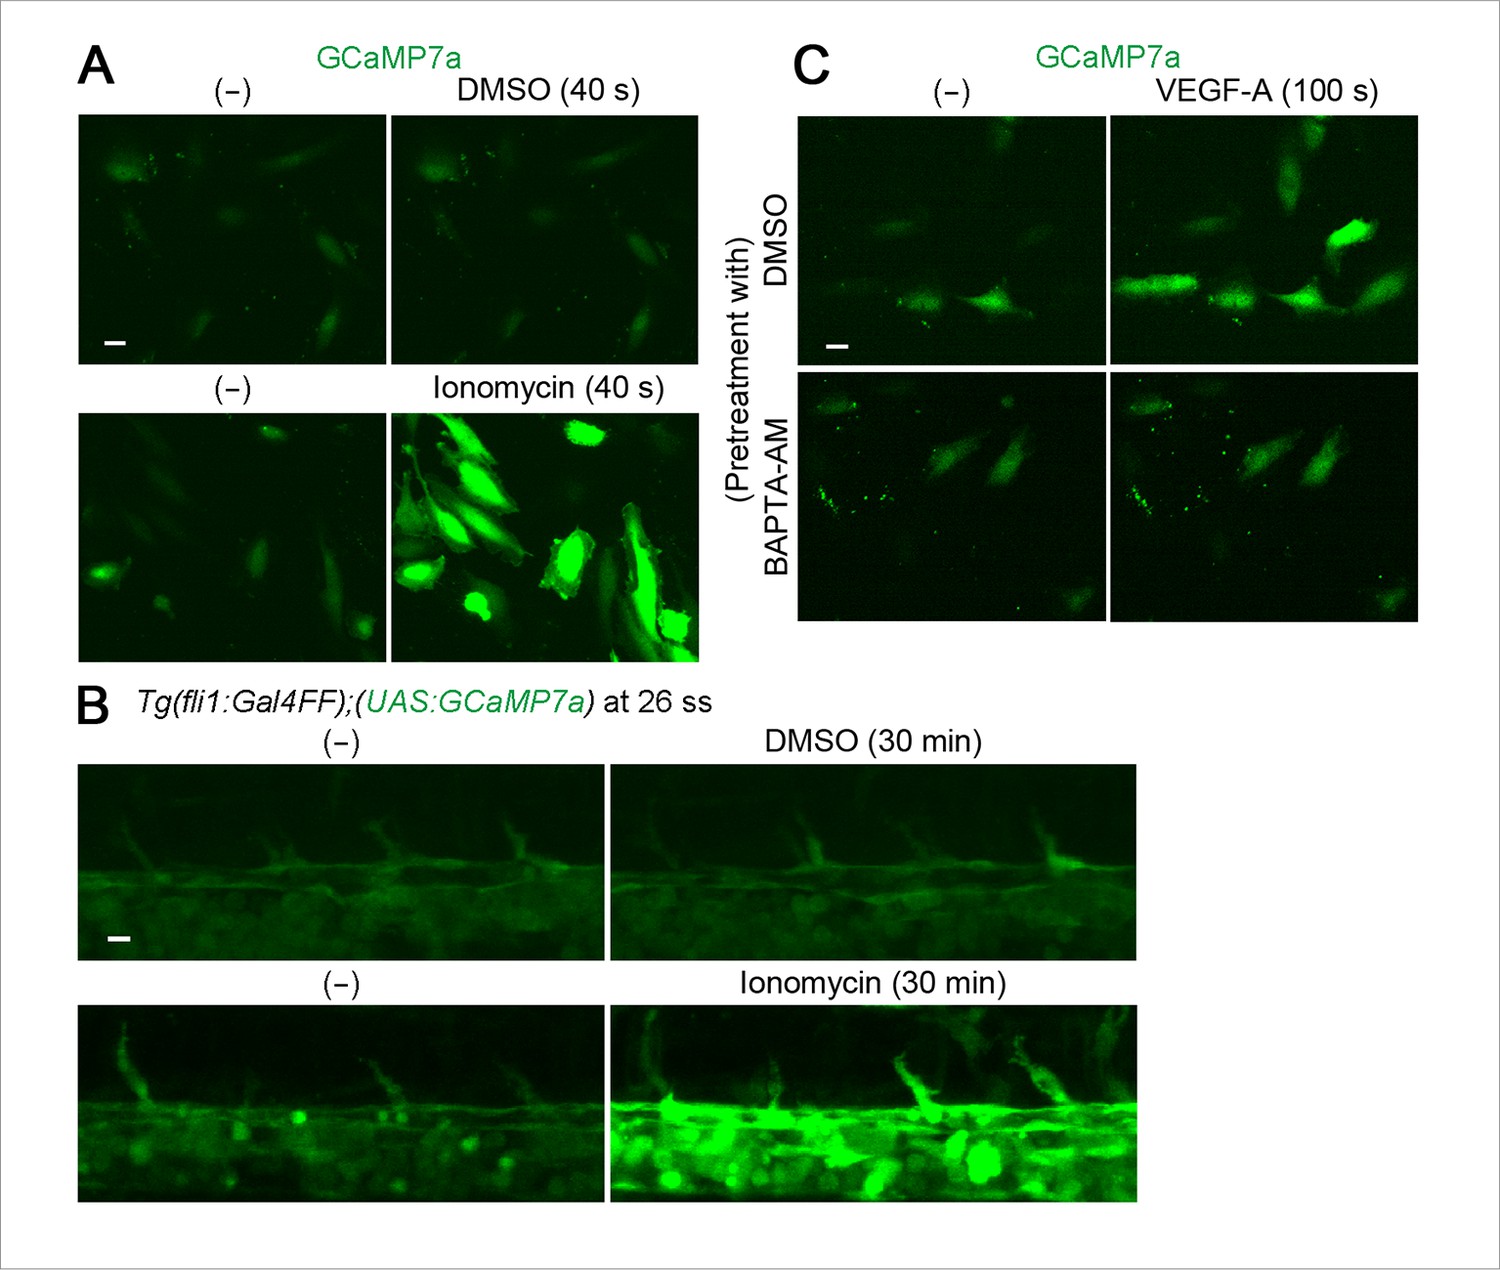
GCaMP7a works as a Ca2+ indicator in endothelial cells (ECs).
(A) HUVECs transfected with GCaMP7a expression plasmids were treated with DMSO (upper) or ionomycin (lower). GCaMP7a images before (-) and after the treatment (40 s) are shown. (B) Confocal stack fluorescence images of Tg(fli1:Gal4FF);(UAS:GCaMP7a) embryos at 26 ss treated with DMSO (upper) or 25 μM ionomycin (lower). GCaMP7a images before (-) and after the treatment (30 min) are shown. (C) Fluorescence images of HUVECs transfected with GCaMP7a expression plasmids pretreated with DMSO or 25 μM BAPTA-AM for 30 min and treated with 50 ng/ml VEGF-A before (-) and after the treatment (100 s). Note that enhancement of GCaMP7a fluorescence by VEGF-A is blocked by pretreatment with BAPTA-AM. Scale bars, 10 μm in A-C.
Figure 1—figure supplement 2
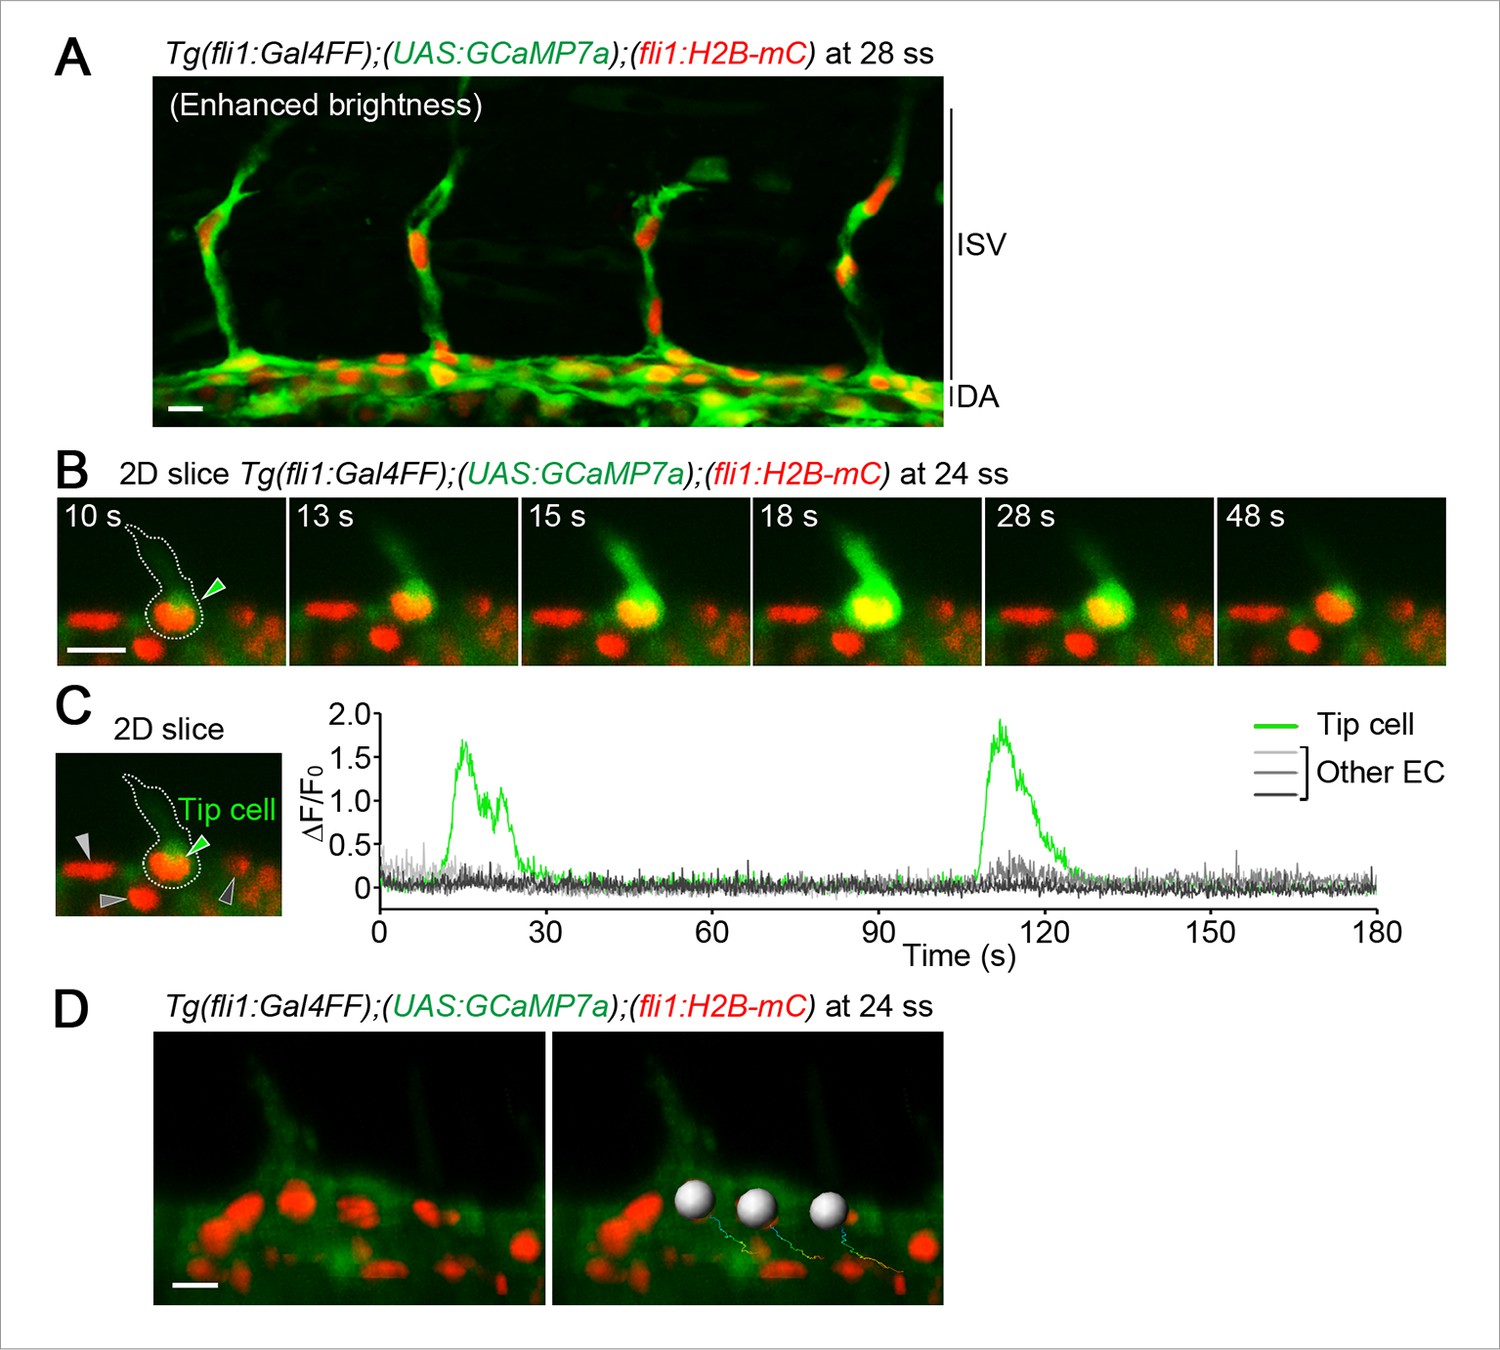
Quantitative analyses of intracellular Ca2+ dynamics in ECs.
(A) Confocal stack fluorescence images of Tg(fli1:Gal4FF);(UAS:GCaMP7a);(fli1:H2B-mC) embryos at 28 ss. The merged images of GCaMP7a (green) and H2B-mC (red) images are shown with enhanced brightness. Note that almost all ECs express GCaMP7a in developing trunk vessels. (B) Time-lapse 2D slice images of Tg(fli1:Gal4FF);(UAS:GCaMP7a);(fli1:H2B-mC) embryos taken every 100 ms at 24 ss using a light sheet microscope. A green arrowhead indicates a budding tip cell outlined by a dashed line. The elapsed time (s) after starting imaging of an embryo is indicated at the left upper corner. (C) The fluorescence changes in GCaMP7a (ΔF/F0) of individual ECs from B indicated by arrowheads (green, light gray, dark gray, and black) at the left panel are shown as a graph. (D) Quantification analyses for intracellular Ca2+ levels in individual EC. Time-lapse 3D images of Tg(fli1:Gal4FF);(UAS:GCaMP7a);(fli1:H2B-mC) embryos were analyzed for quantification using IMARIS software. The merged images of GCaMP7a (green) and H2B-mC (red) images are shown in the left panel. To quantify intracellular Ca2+ of individual EC at each time point, the cell nucleus was tracked over time. Trajectories of individual nuclei were shown in the right panel. To mark the individual EC which we analyze, we set a spherical region of interest (ROI) as shown in the right panel (see ‘Materials and methods’). We then defined the highest voxel intensity of the GCaMP7a fluorescence (green) within the ROI as the fluorescence intensity (F) in the EC. Scale bars, 10 μm in A, B, and D. ISV, intersomitic vessel; DA, dorsal aorta.
Figure 2 with 3 supplements
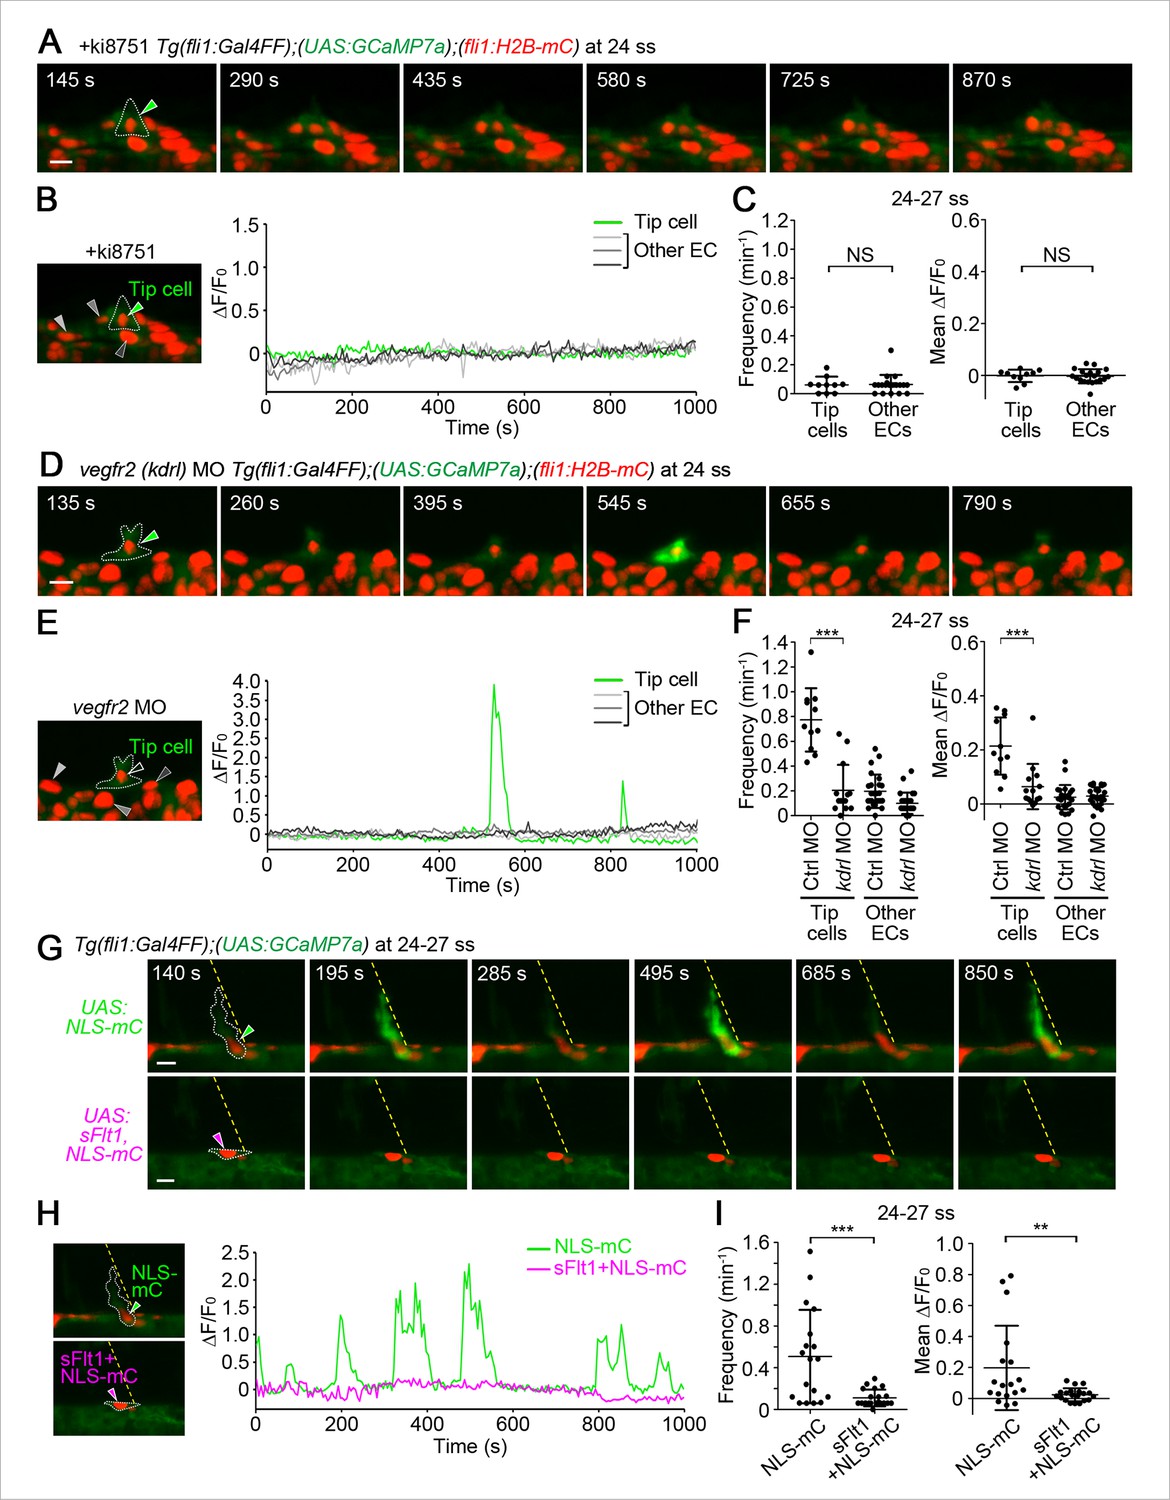
The Ca2+ oscillations during tip cell budding depend upon Vegfa/Vegfr2 signaling.
(A) 3D-rendered time-sequential images of Tg(fli1:Gal4FF);(UAS:GCaMP7a);(fli1:H2B-mC) embryos treated with a Vegfr inhibitor, ki8751, during tip cell budding. The embryos were treated from 22 ss with ki8751 and time-lapse imaged at 24 ss. A green arrowhead indicates a tip cell outlined by a dashed line. The elapsed time (s) after starting imaging of an embryo is indicated at the left upper corner. (B) The fluorescence changes in GCaMP7a (ΔF/F0) of individual ECs from A indicated by arrowheads (green, light gray, dark gray, and black) at the left panel are shown as a graph. (C) Quantification of Ca2+ oscillation frequency (left) and mean ΔF/F0 (right) as in Figure 1D in ki8751-treated embryos. The embryos were treated from 22 ss with ki8751 and imaged at 24–27 ss (n ≥ 10). (D) 3D-rendered time-sequential images of Tg(fli1:Gal4FF);(UAS:GCaMP7a);(fli1:H2B-mC) embryos during tip cell budding (24 ss) injected with vegfr2 (kdrl) morpholino (MO). (E) The fluorescence changes in GCaMP7a (ΔF/F0) of individual ECs from D indicated by arrowheads at the left panel are shown as a graph. (F) Quantification of Ca2+ oscillation frequency (left) and mean ΔF/F0 (right) in tip cells and other ECs within the DA in control MO- or vegfr2 MO-injected embryos during tip cell budding at 24–27 ss (n ≥ 11). (G) 3D-rendered time-sequential images of Tg(fli1:Gal4FF);(UAS:GCaMP7a) embryos at 24–27 ss injected with control UAS:NLS-mC plasmid (upper) or UAS:sFlt1,NLS-mC plasmid (lower) which drives the expression of NLS-mC or both sFlt1 and NLS-mC simultaneously in ECs in a mosaic manner, respectively. Green and red arrowheads indicate NLS-mC-expressing ECs and both sFlt1- and NLS-mC-expressing ECs, respectively. Yellow dashed lines indicate positions of somite boundaries. (H) The fluorescence changes in GCaMP7a (ΔF/F0) of individual ECs from G indicated by arrowheads at the left panel are shown as a graph. (I) Quantification of Ca2+ oscillatory activity in ECs expressing NLS-mC and both sFlt1 and NLS-mC at 24–27 ss. Graphs show Ca2+ oscillation frequency (left) and mean ΔF/F0 (right) of NLS-mC-positive ECs within the DA close to somite boundaries (NLS-mC, n = 18; sFlt1+ NLS-mC, n = 20). Horizontal lines represent mean ± s.d.. Scale bars, 10 μm in A, D and G. **p < 0.01, ***p < 0.001; NS, not significant.
Figure 2—figure supplement 1

Defects in blood vessels and lymphatic vessels found in Vegfr2- or Vegfr3-inhibited embryos.
(A) Confocal 3D images of Tg (fli1:GFP) embryos at 24 ss (first column), and the corresponding subsequent time-lapse images at the indicated time after treatment with DMSO or ki8751. Note that tip cell migration is blocked by treatment with ki8751. (B) Confocal stack fluorescence images of Tg(fli1:Gal4FF);(UAS:GCaMP7a) embryos at 36 ss injected with UAS:sFlt1,NLS-mC plasmid which drives the expression of both sFlt1 and NLS-mC simultaneously in ECs in a mosaic manner via a Gal4/UAS-based bidirectional expression system. GCaMP7a (green) and NLS-mC (red) images are shown. ISV sprouting from the DA was inhibited in the region close to sFlt1- and NLS-mC-co-expressing ECs (arrow). (C) Confocal stack fluorescence images of Tg (fli1:Myr-mC);(UAS:GFP);SAGFF(LF)27C embryos at 50 hr postfertilization (hpf) uninjected or injected with vegfr3 morpholino (MO). These Tg embryos express myristoylation signal (Myr)-tagged mCherry (red) in all ECs and GFP (green) in venous ECs. Note that the secondary sprouts (arrowheads) and secondary sprout-derived venous vessels (arrows) from the PCV were observed in uninjected embryos but not in vegfr3 morphants. Scale bars, 10 μm in A–C. ISV, intersomitic vessel; DA, dorsal aorta; PCV, posterior cardinal vein.
Figure 2—figure supplement 2
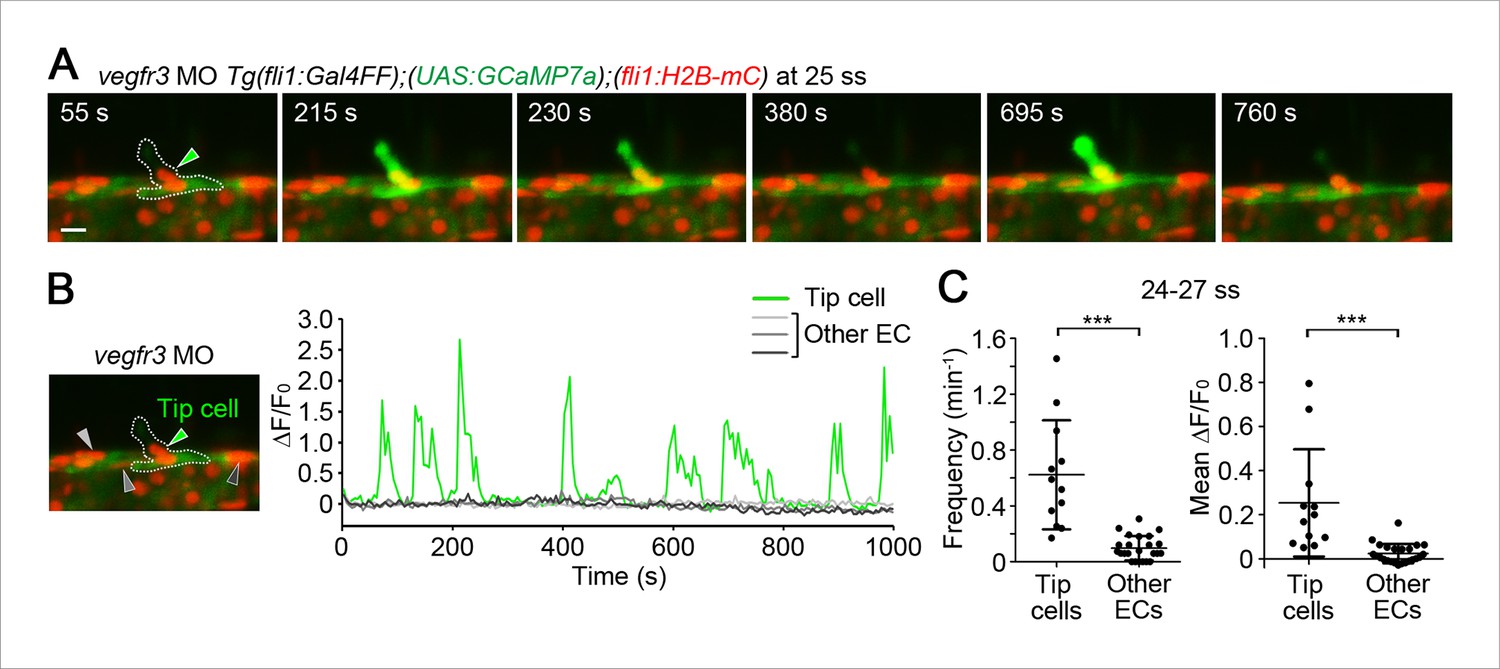
Vegfr3 is not involved in Ca2+ oscillations in tip cells budding from the dorsal aorta (DA).
(A) 3D-rendered time-sequential images of Tg(fli1:Gal4FF);(UAS:GCaMP7a);(fli1:H2B-mC) embryos injected with vegfr3 MO at 25 ss. A green arrowhead indicates a budding tip cell. (B) The fluorescence changes in GCaMP7a (ΔF/F0) of individual ECs from A indicated by arrowheads at the left panel are shown as a graph. (C) Quantification of Ca2+ oscillatory activity of vegfr3 morphants at 24–27 ss. Graphs show Ca2+ oscillation frequency (left) and mean ΔF/F0 (right) of tip cells and other ECs within the DA during tip cell budding (n ≥ 12). Scale bar, 10 μm in A. **p < 0.01, ***p < 0.001; NS, not significant.
Figure 2—figure supplement 3
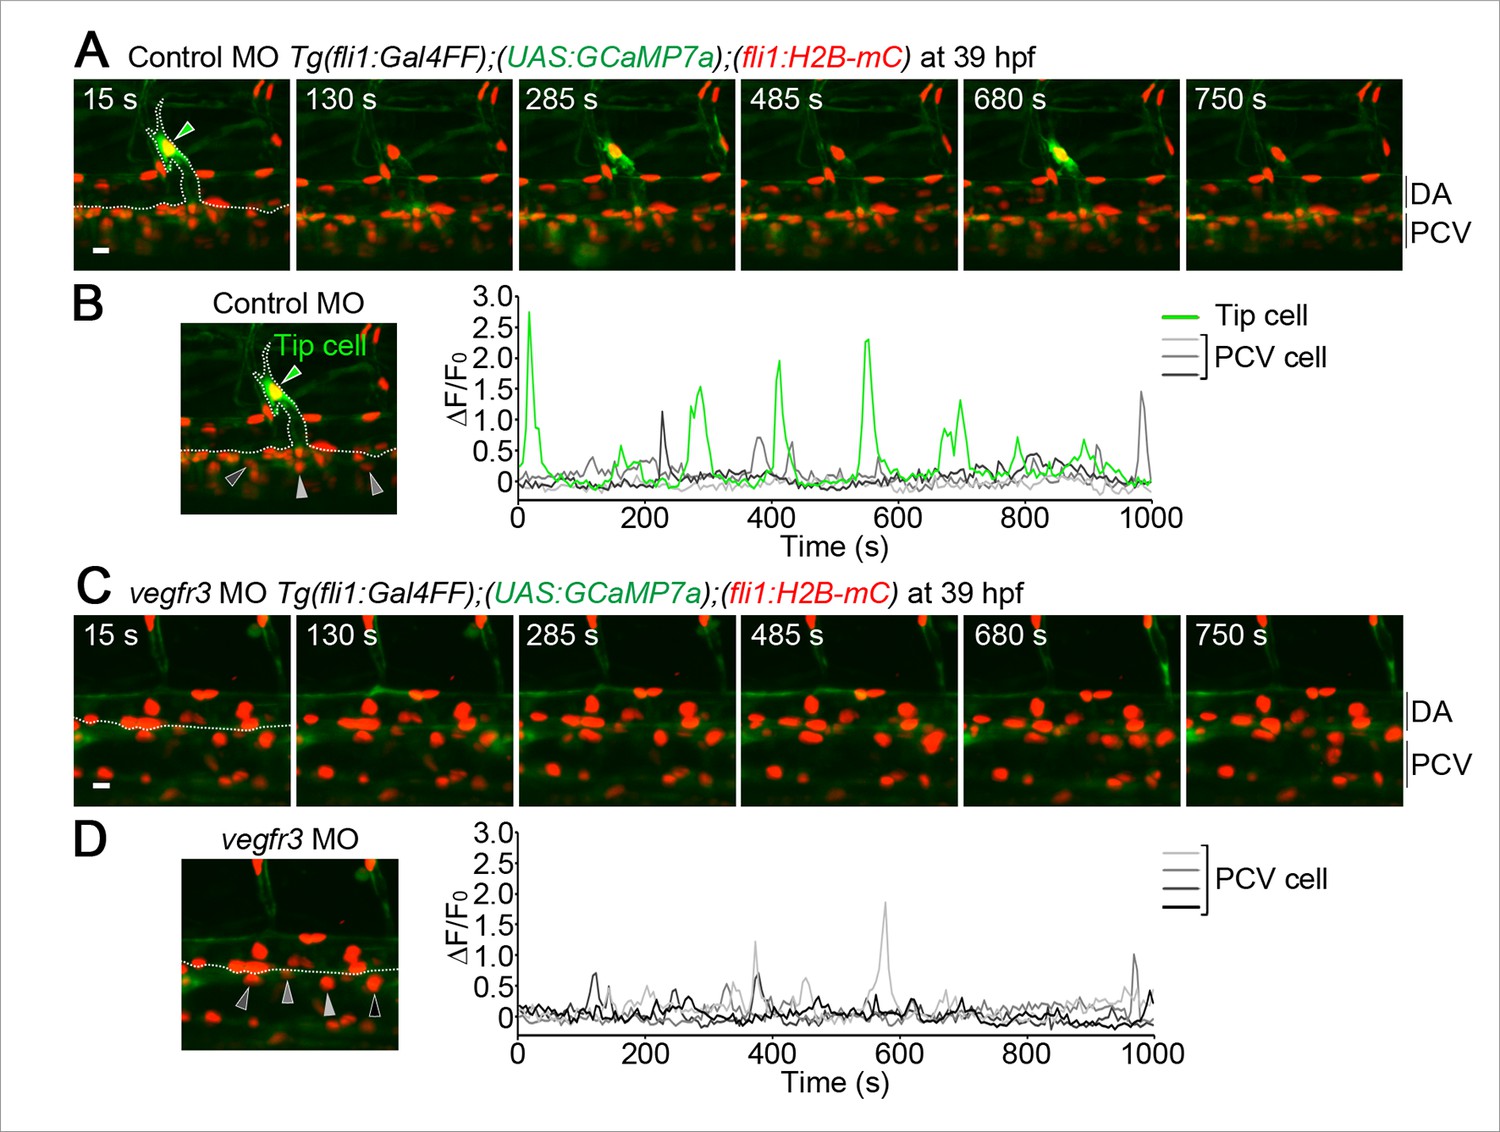
Ca2+ oscillations in the venous sprouts from the posterior cardinal vein (PCV).
(A) 3D-rendered time-sequential images of Tg(fli1:Gal4FF);(UAS:GCaMP7a);(fli1:H2B-mC) embryos during vessel sprouting from the PCV injected with control MO (39 hpf). A green arrowhead indicates a tip cell of a venous sprout. A dashed line outlines the PCV and the venous sprout. (B) The fluorescence changes in GCaMP7a (ΔF/F0) of individual ECs from A indicated by arrowheads (green, orange, light gray, dark gray, and black) at the left panel are shown as a graph. (C) 3D-rendered time-sequential images of Tg(fli1:Gal4FF);(UAS:GCaMP7a);(fli1:H2B-mC) embryos injected with vegfr3 MO (39 hpf). (D) The fluorescence changes in GCaMP7a (ΔF/F0) of individual ECs from C indicated by arrowheads at the left panel are shown as a graph. Scale bars, 10 μm in A and C. DA, dorsal aorta; PCV, posterior cardinal vein.
Figure 3 with 1 supplement
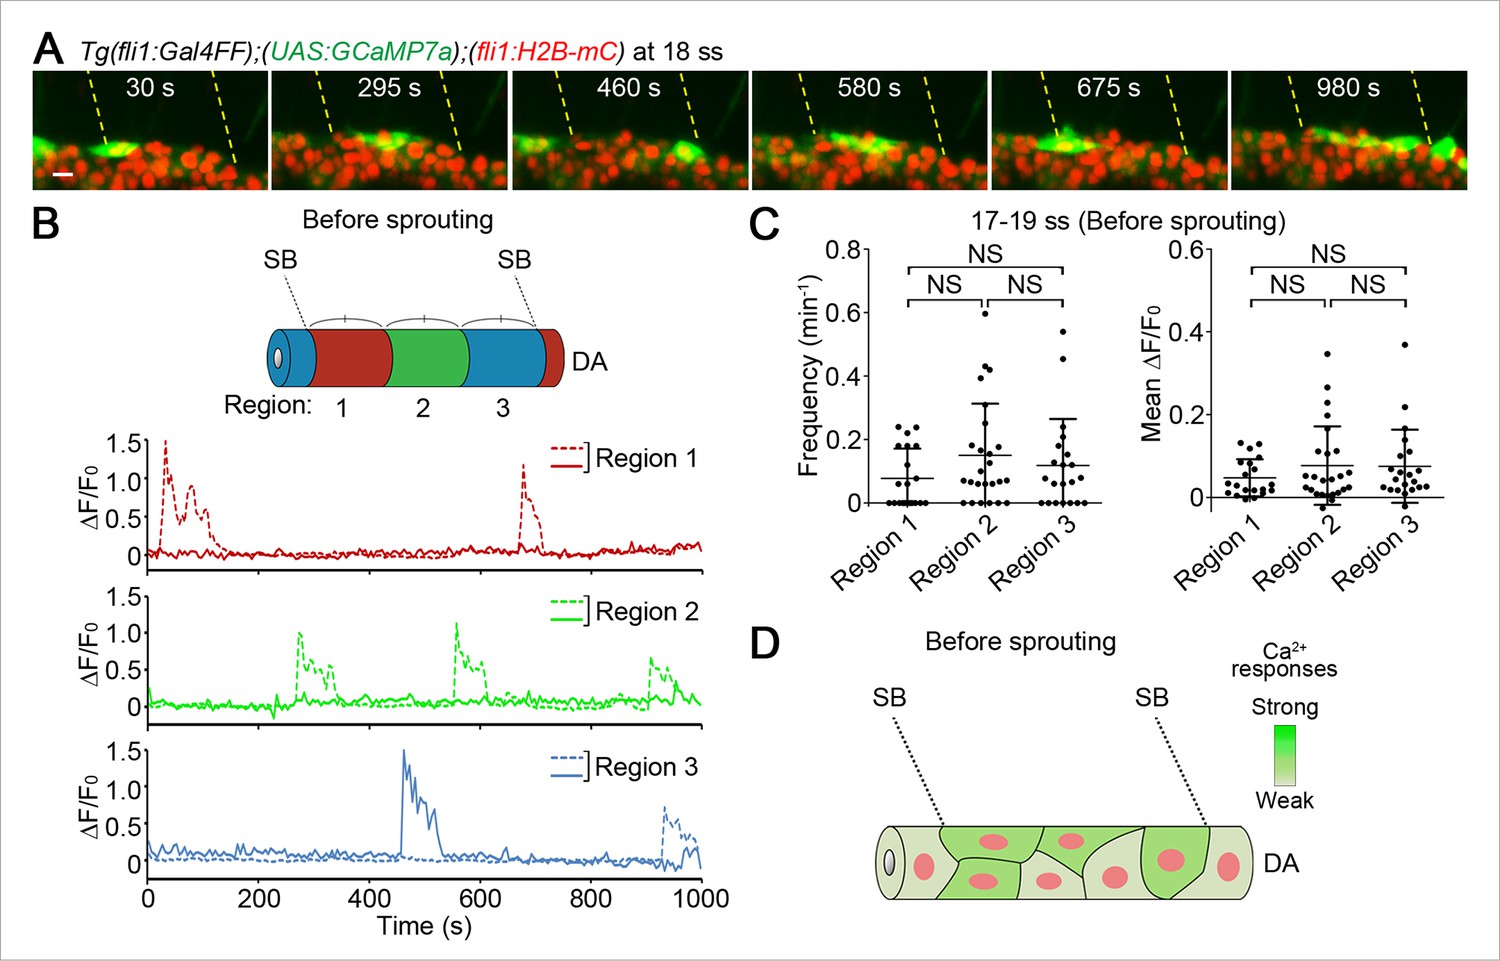
Ca2+-oscillating cells were not restricted to specific regions within the DA before vessel sprouting.
(A) 3D-rendered time-sequential images of Tg(fli1:Gal4FF);(UAS:GCaMP7a);(fli1:H2B-mC) embryos before ISV sprouting (18 ss). Yellow dashed lines indicate positions of somite boundaries. (B) The DA is subdivided into three regions (Region 1–3) between two somite boundaries (SBs) as illustrated in the scheme (upper). The fluorescence changes in GCaMP7a (ΔF/F0) of individual ECs from A are shown as separate graphs (Region 1–3), determining the region to which individual EC belongs by the location based on the position of the nucleus at the start of time-lapse imaging. A representative graph of two ECs at each region is shown. (C) Quantification of Ca2+ oscillation frequency (left) and mean ΔF/F0 (right) in ECs of the indicated regions within the DA before vessel sprouting (17–19 ss). Horizontal lines represent mean ± s.d. (n ≥ 20). (D) Schematic illustration of Ca2+ dynamics before tip cell budding. Before tip cells sprout from the DA, Ca2+ oscillations are found broadly in ECs within the DA. Scale bar, 10 μm in A. NS, not significant. SB, somite boundary; DA, dorsal aorta.
Figure 3—figure supplement 1
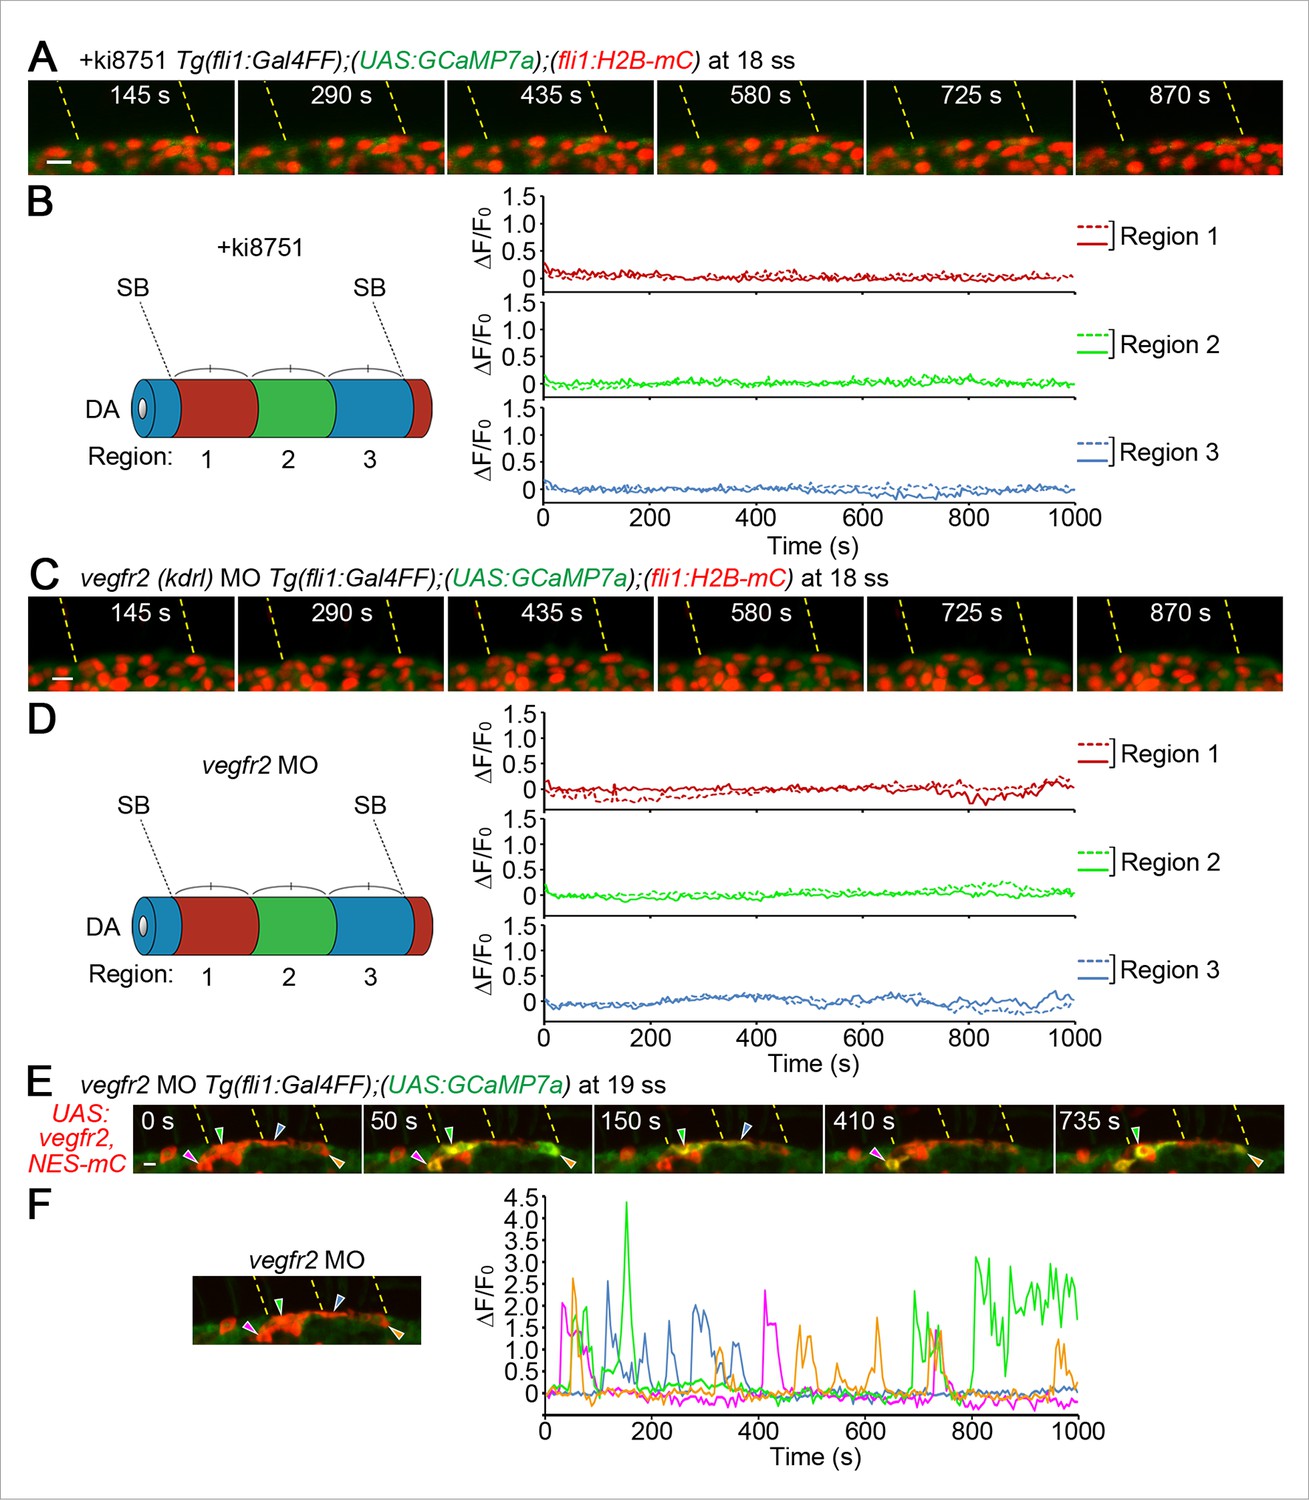
Vegfr2 is responsible for Ca2+ responses before ISVs sprouting from the DA.
(A) 3D-rendered time-sequential images of Tg(fli1:Gal4FF);(UAS:GCaMP7a);(fli1:H2B-mC) embryos treated with ki8751 to inhibit Vegfr before ISV sprouting. The embryos were treated with ki8751 from 17 ss and time-lapse imaged at 18 ss using a light sheet microscope. Yellow dashed lines indicate positions of somite boundaries. (B) The DA is subdivided into three regions (Region 1–3) between two somite boundaries (SBs) as illustrated in the schematics (left). The fluorescence changes in GCaMP7a (ΔF/F0) of individual ECs from A are shown as separated graphs (Region 1–3) as in Figure 3B. Where individual EC belong to is determined by the location based on the position of the nucleus at the start of time-lapse imaging. A representative graph of two ECs at each region is shown. (C) 3D-rendered time-sequential images of Tg(fli1:Gal4FF);(UAS:GCaMP7a);(fli1:H2B-mC) embryos before ISV sprouting injected with vegfr2 (kdrl) morpholino (MO) (18 ss). (D) The fluorescence changes in GCaMP7a (ΔF/F0) of individual ECs from C are shown as separated graphs (Region 1–3) as in B. (E) 3D-rendered time-sequential images of Tg(fli1:Gal4FF);(UAS:GCaMP7a) embryos before ISV sprouting injected with vegfr2 MO and UAS:Vegfr2,NES-mC plasmid which drives the expression of full length Vegfr2 and NES-mC simultaneously in ECs in a mosaic manner (19 ss). Note that Ca2+ oscillations are recovered in NES-mC-positive ECs (arrowheads). (F) The fluorescence changes in GCaMP7a (ΔF/F0) of individual ECs expressing NES-mC from E indicated by arrowheads (green, blue, orange and magenta) at the left panel are shown as a graph. Scale bars, 10 μm in A, C and E. DA, dorsal aorta; SB, somite boundary.
Figure 4 with 3 supplements
Iinitial tip cell selection in the DA.
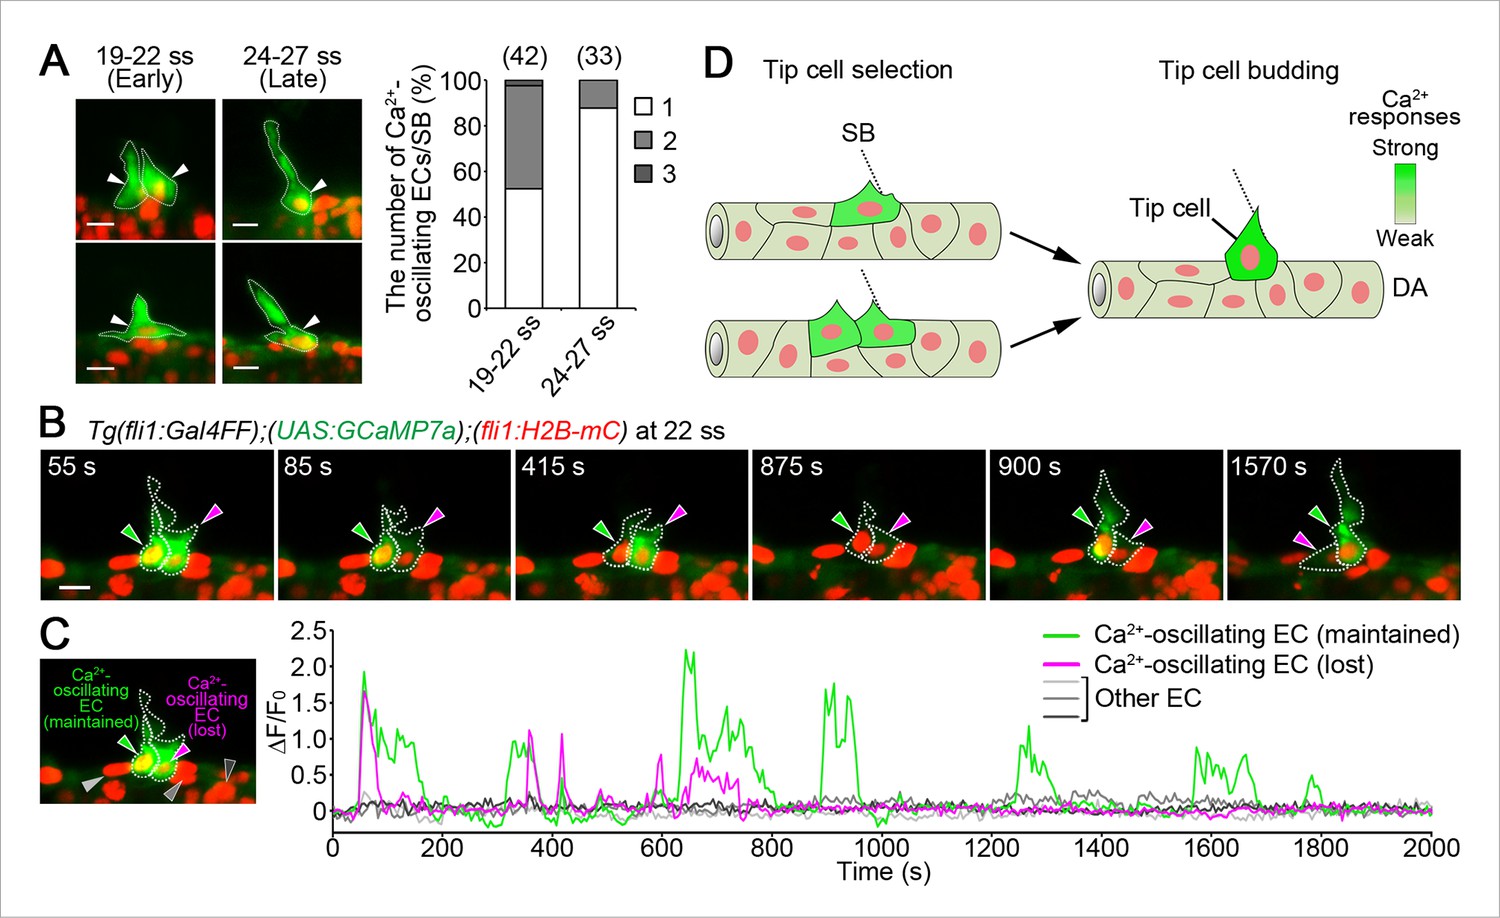
(A) The number of Ca2+-oscillating ECs within the DA at each somite boundary of Tg(fli1:Gal4FF);(UAS:GCaMP7a);(fli1:H2B-mC) embryos at 19–22 and 24–27 ss. Graph shows percentage of the number of a Ca2+-oscillating cell (1), two cells (2), and three cells (3) at a somite boundary among the total number of somite boundaries (indicated at the top) observed. Two each representative 3D-rendered images of Tg(fli1:Gal4FF);(UAS:GCaMP7a);(fli1:H2B-mC) at 19–22 and 24–27 ss are shown in the left. Arrowheads indicate Ca2+-oscillating cells. (B) 3D-rendered time-sequential images of Tg(fli1:Gal4FF);(UAS:GCaMP7a);(fli1:H2B-mC) embryos from 22 ss. Green arrowheads indicate an EC which maintained Ca2+ oscillations, whereas red arrowheads indicate an EC which lost Ca2+ oscillations. Similar results were obtained in five independent experiments. (C) The fluorescence changes in GCaMP7a (ΔF/F0) of the ECs indicated by arrowheads in B and indicated at the left panel are shown as a graph. (D) Schematic illustration of Ca2+ dynamics during tip cell budding. Ca2+ oscillations are detected mostly in a single or two-neighboring EC(s) at the onset of vessel sprouting. Finally, only single budding tip cell exhibits Ca2+-oscillation at later stages. Scale bars, 10 μm in A and B. SB, somite boundary; DA, dorsal aorta.
Figure 4—figure supplement 1

ECs close to somite boundaries have potential to sprout.
Light-sheet z-stack fluorescence images of Tg(fli1:Gal4FF);(UAS:GCaMP7a) (lower) and corresponding 2D-slice bright-field (BF) images at the level of somite boundary (upper) just after vessel sprouting (22 ss). Yellow arrowheads indicate somite boundaries. Yellow dashed lines indicate positions of somite boundaries. White arrowheads indicate Ca2+-oscillating cells, either of which extends protrusions dorsally. Note that double (left) or single (right) Ca2+-oscillating cells are located at somite boundary. Scale bar, 10 μm.
Figure 4—figure supplement 2
Tip cell selection between two neighboring ECs exhibiting Ca2+ oscillations.
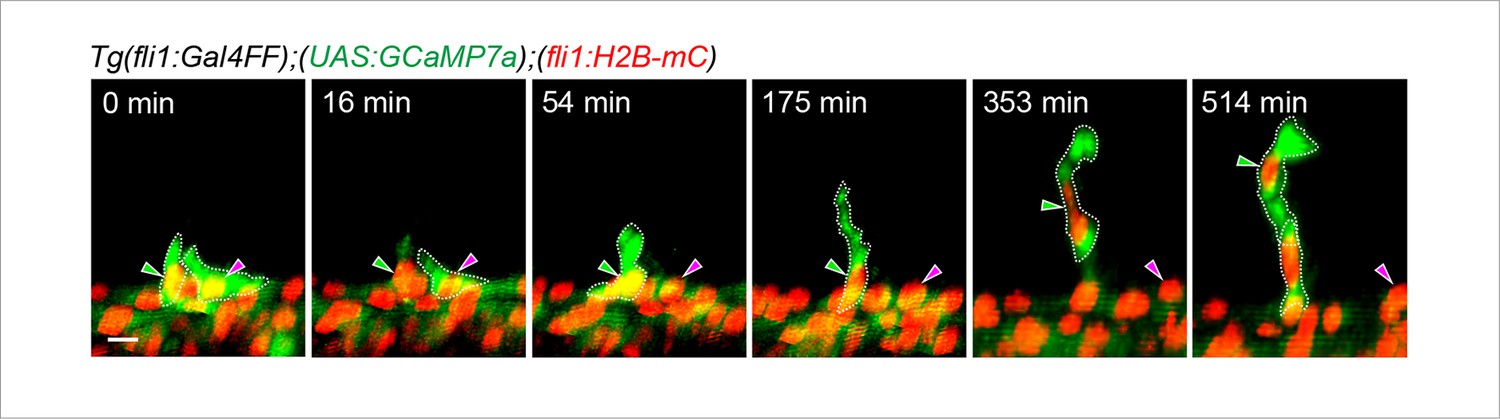
3D-rendered time-sequential images of Tg(fli1:Gal4FF);(UAS:GCaMP7a);(fli1:H2B-mC) embryos during tip selection between two neighboring cells exhibiting Ca2+ oscillations. An EC maintaining Ca2+ oscillations became tip cell (green arrowheads), whereas an EC losing Ca2+ oscillations stayed in the DA (magenta arrowheads). A representative case among those we observed are shown (n = 18). Scale bar, 10 μm.
Figure 4—figure supplement 3
PlexinD1 is necessary to confine Ca2+-oscillating sprouts in the vicinity of somite boundaries.
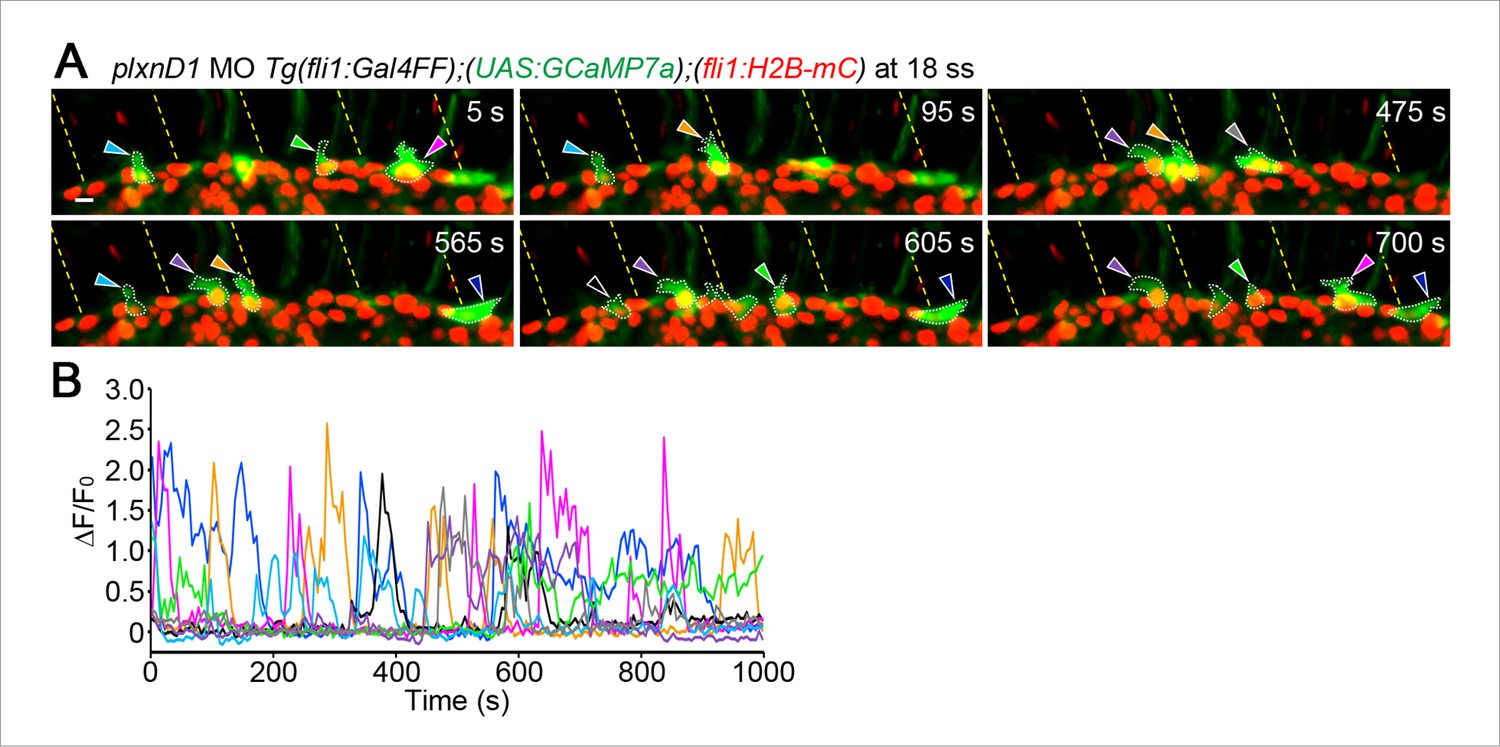
(A) 3D-rendered time-sequential images of Tg(fli1:Gal4FF);(UAS:GCaMP7a);(fli1:H2B-mC) embryos during tip cell budding injected with plxnD1 MO (18 ss). Arrowheads indicate Ca2+-oscillating ECs budding from the DA. Yellow dashed lines indicate positions of somite boundaries. Note that plxnD1 morphants display ectopic EC sprouts that exhibit Ca2+ oscillations. (B) Fluorescence changes in GCaMP7a (ΔF/F0) of individual ECs indicated by arrowheads in A are shown as a graph. Scale bar, 10 mm in A.
Figure 5 with 1 supplement
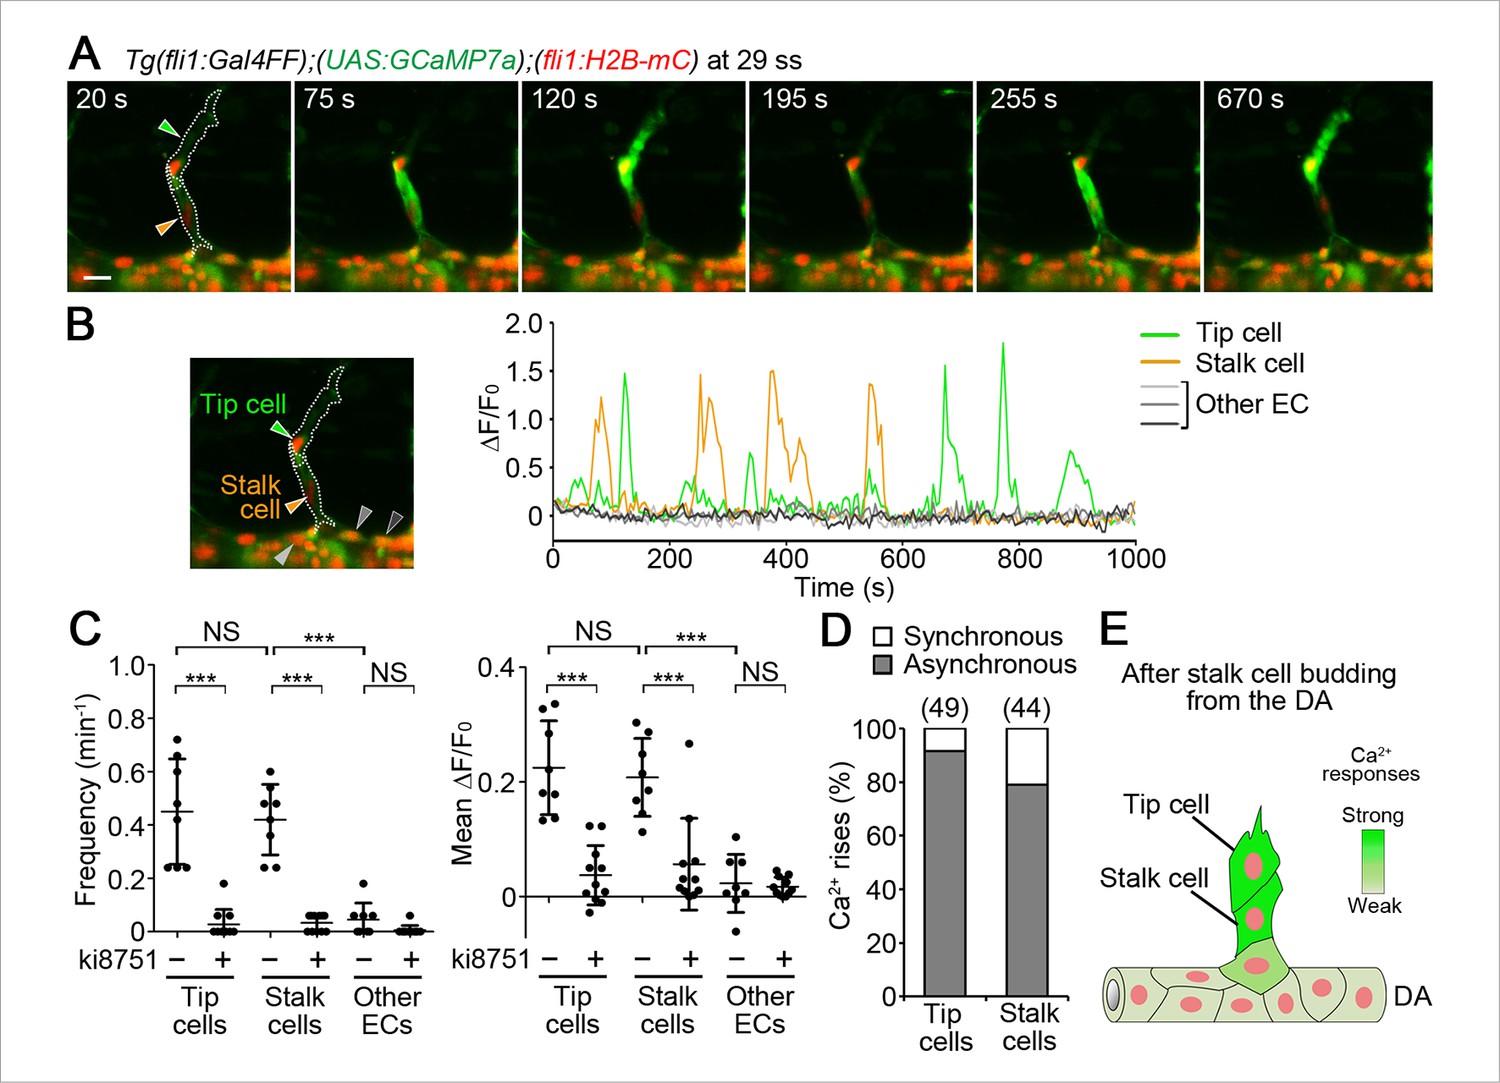
Ca2+ oscillations in stalk cells during budding from the DA.
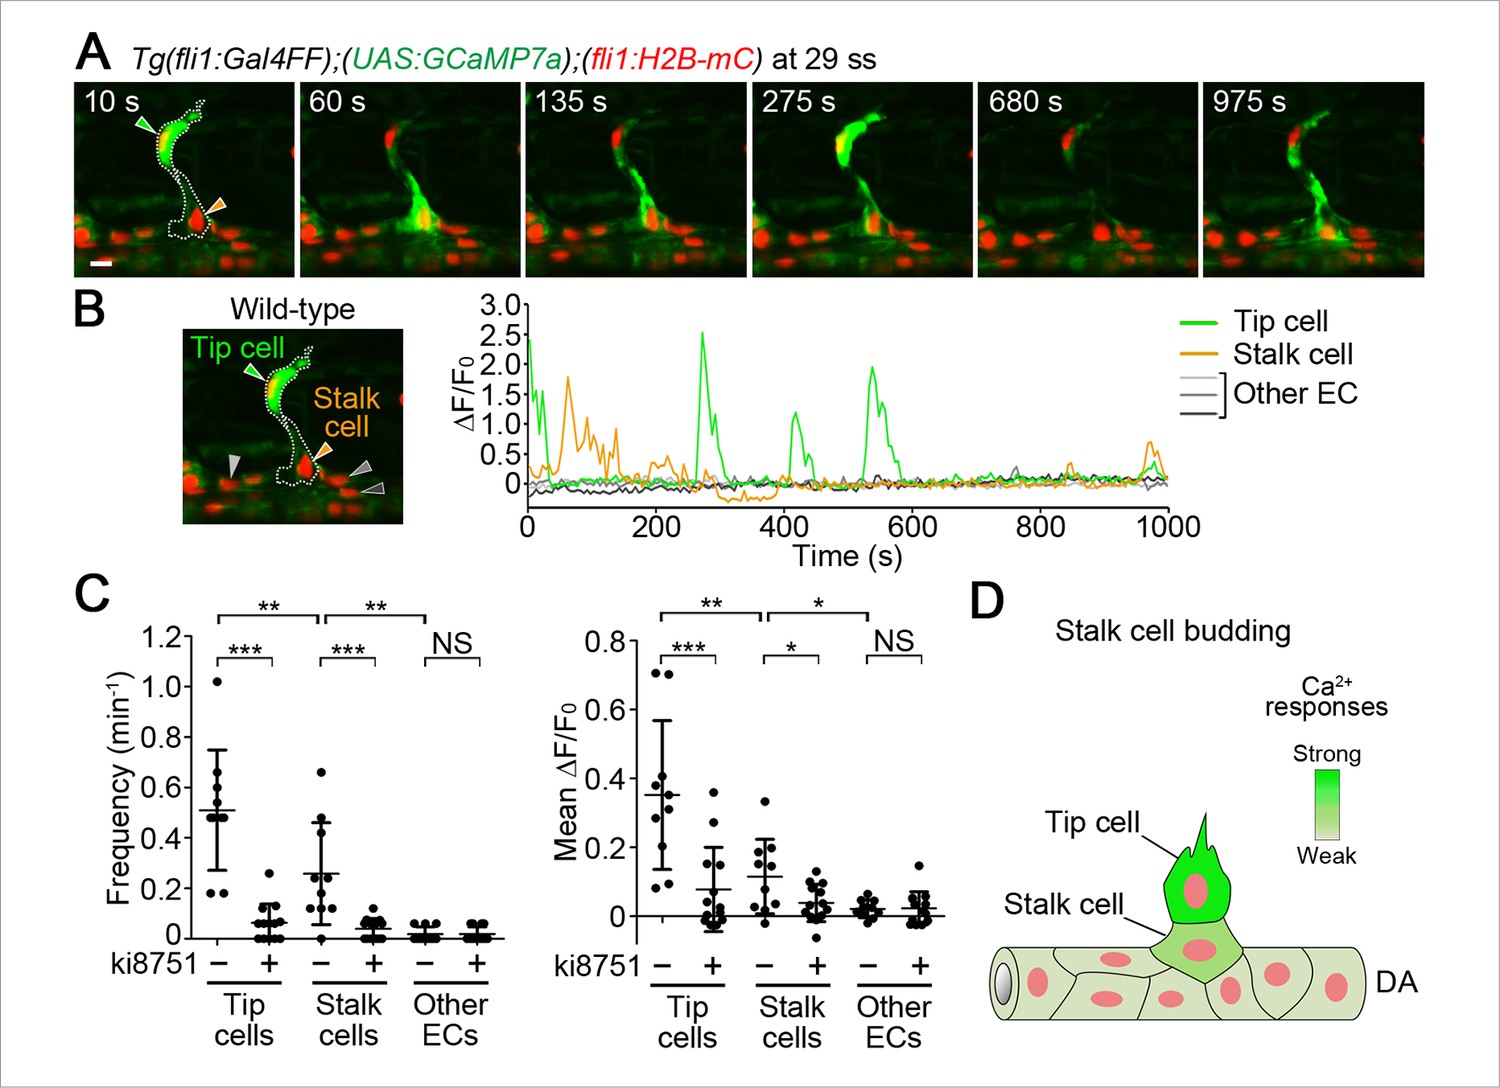
(A) 3D-rendered time-sequential images of Tg(fli1:Gal4FF);(UAS:GCaMP7a);(fli1:H2B-mC) embryos during stalk cell budding from the DA (29 ss). Green and orange arrowheads indicate tip and stalk cells, respectively. (B) The fluorescence changes in GCaMP7a (ΔF/F0) of individual ECs from A indicated by arrowheads (green, orange, light gray, dark gray, and black) at the left panel are shown as a graph. (C) Quantification of Ca2+ oscillatory activity in untreated and ki8751-treated embryos during stalk cell budding from the DA as in A and Figure 5—figure supplement 1A, respectively. Graphs show Ca2+ oscillation frequency (left) and mean ΔF/F0 (right) in tip cells, stalk cells and other ECs within the DA in untreated and ki8751-treated embryos (Untreated, n ≥ 10; ki8751-treated, n ≥ 13). (D) Stalk cells that are budding from the DA have significant Vegfr2 activity, albeit weaker than that in tip cells. Scale bar, 10 μm in A. *p < 0.05, **p < 0.01, ***p < 0.001; NS, not significant. DA, dorsal aorta.
Figure 5—figure supplement 1
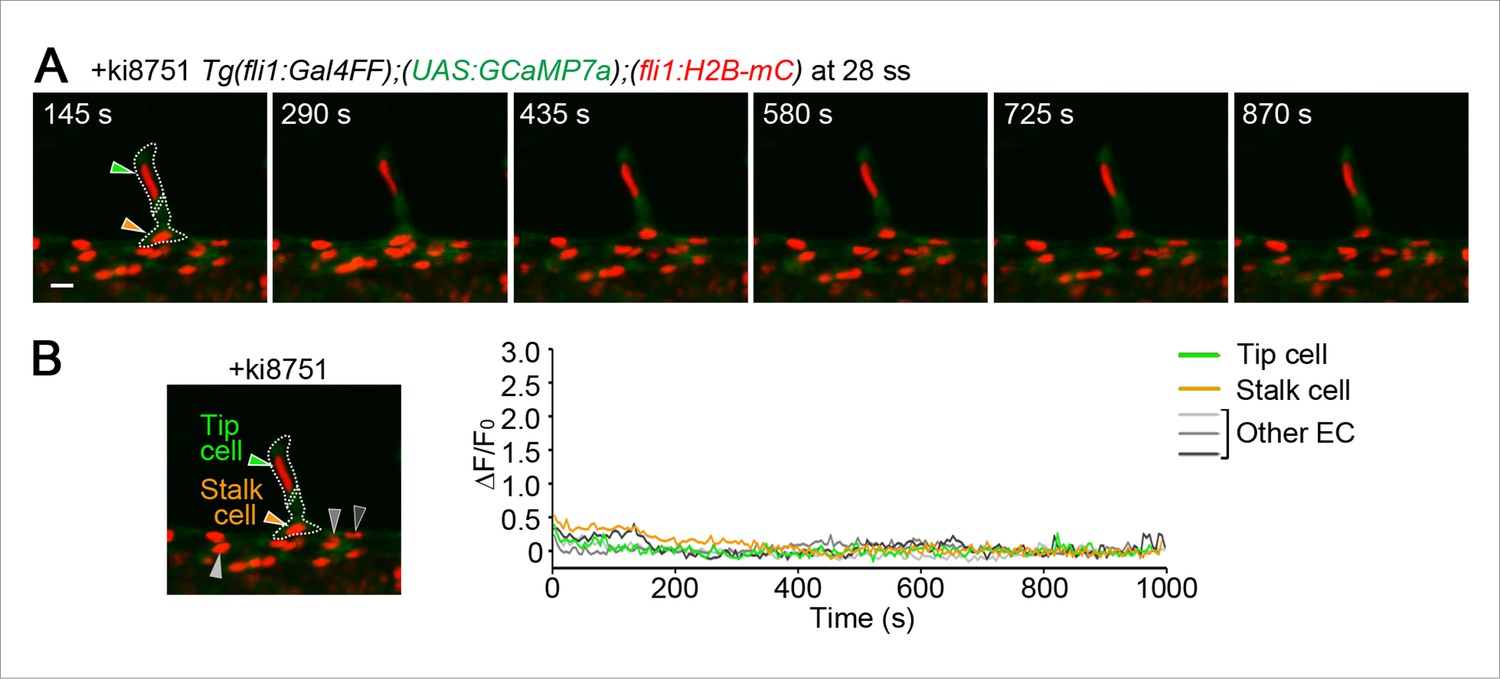
Ca2+ responses during stalk cell budding from the DA are dependent upon Vegfr.
(A) 3D-rendered time-sequential images of Tg(fli1:Gal4FF);(UAS:GCaMP7a);(fli1:H2B-mC) embryos treated with ki8751 during stalk cell budding from the DA as in Figure 5A. The embryos were treated from 27 ss with ki8751 and time-lapse imaged at 28 ss. Green and orange arrowheads indicate tip and stalk cells, respectively. (B) The fluorescence changes in GCaMP7a (ΔF/F0) of individual ECs from A indicated by arrowheads (green, orange, light gray, dark gray, and black) at the left panel are shown as a graph.
Figure 6
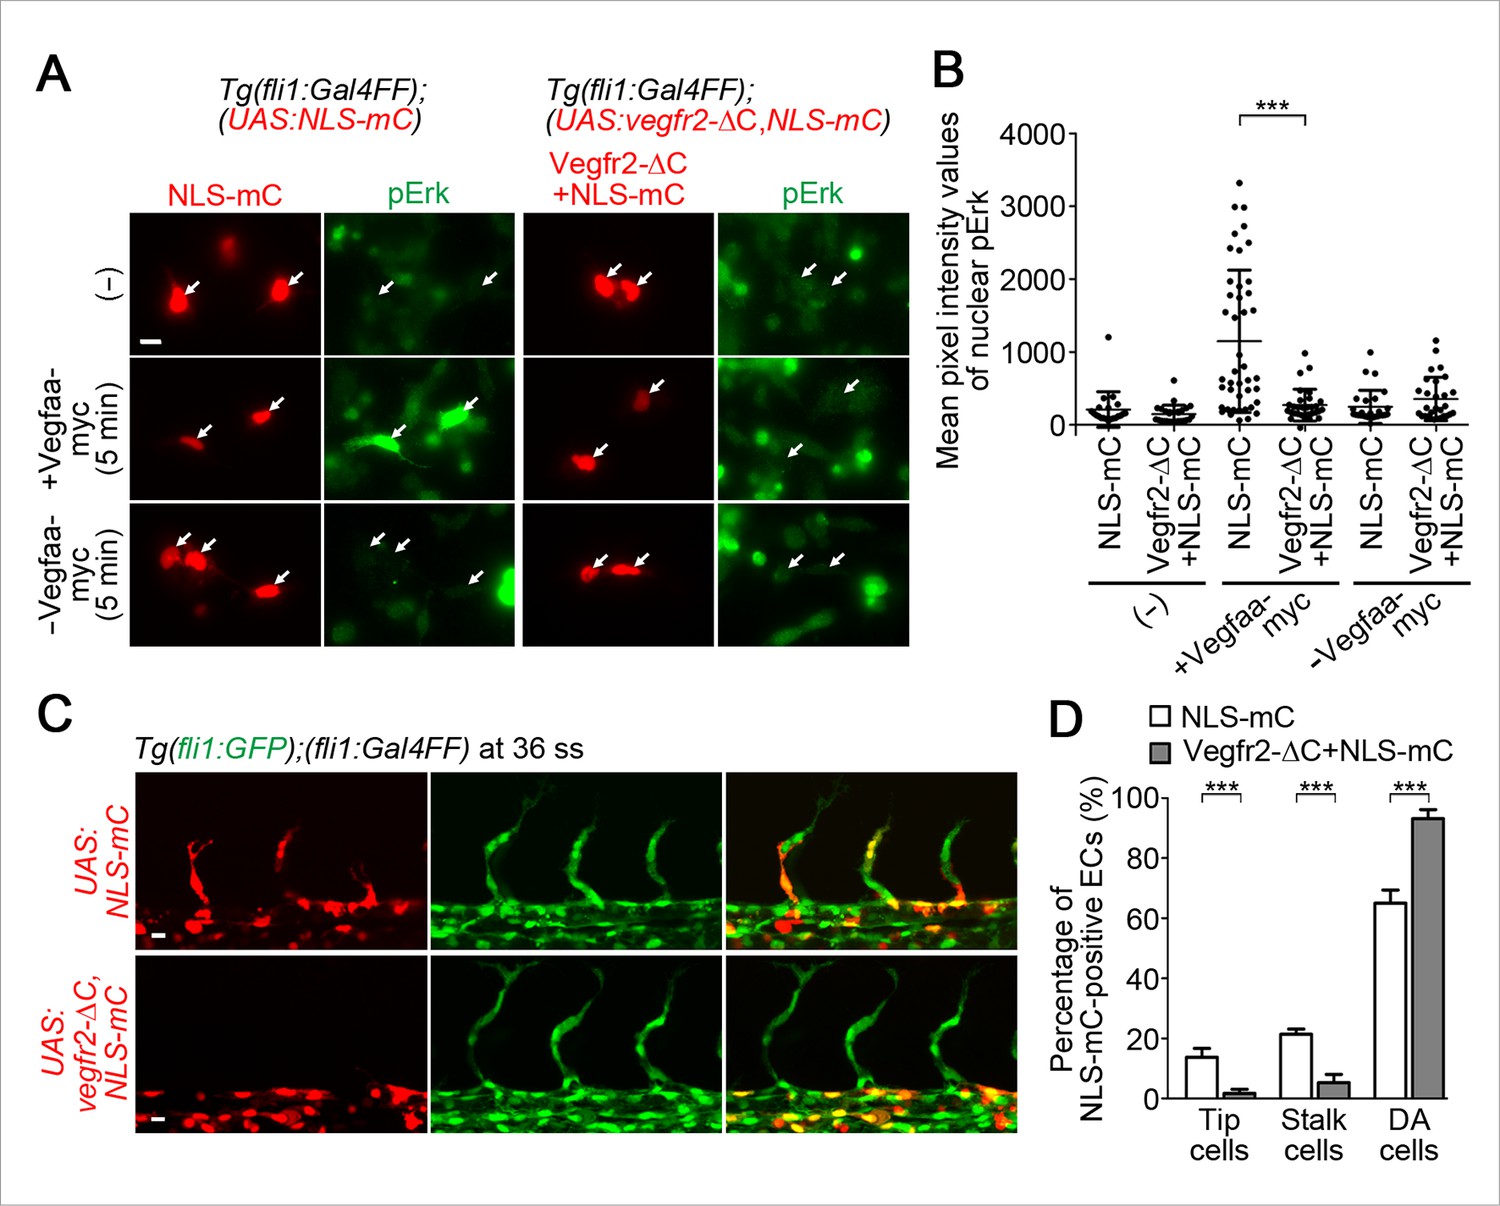
Vegfr2 activation in stalk cells is crucial for their migration from the DA.
(A) The cells dissociated from Tg(fli1:Gal4FF);(UAS:NLS-mC) or Tg(fli1:Gal4FF);(UAS:Vegfr2-ΔC,NLS-mC) embryos (34 hpf) cultured on laminin-coated dish were kept untreated (-) or treated for 5 min with the supernatants from HEK293T cells transfected with (+) or without (-) Vegfaa-myc. The cells were immunostained with anti-phospho-Erk (pErk) antibody. mC images (red) and pErk images (green) are shown. Arrows indicate NLS-mC-positive ECs. (B) Quantitative analyses by the results of A are shown as dot-plot graphs depicting mean pixel intensity values with ± s.d. of nuclear pErk in NLS-mC-positive ECs. Each dot represents the value of single cell (n > 20). Similar results were obtained in four independent experiments. (C) Confocal stack fluorescence images of Tg(fli1:GFP);(fli1:Gal4FF) embryos at 36 ss injected with control UAS:NLS-mC plasmid (upper) or UAS:Vegfr2-ΔC,NLS-mC plasmid (lower) which drives the expression of NLS-mC or both Vegfr2-ΔC and NLS-mC simultaneously in ECs in a mosaic manner, respectively. (D) By counting the numbers of NLS-mC-positive ECs constituting tip cells, stalk cells, and DA cells as observed in C in an embryo, the percentage of each group among total number of NLS-mC-positive ECs is indicated. The data are derived from five independent experiments, in each of which ≥ 26 NLS-mC-positive cells were measured. Scale bars, 10 μm in A and C. ***p < 0.001.
Figure 7 with 2 supplements
Ca2+ oscillations in tip and stalk cells that completely come out from the DA.
(A) 3D-rendered time-sequential images of Tg(fli1:Gal4FF);(UAS:GCaMP7a);(fli1:H2B-mC) embryos after stalk cells migrate out of the DA (29 ss). Green and orange arrowheads indicate tip and stalk cells, respectively. (B) The fluorescence changes in GCaMP7a (ΔF/F0) of individual ECs from A indicated by arrowheads (green, orange, light gray, dark gray, and black) at the left panel are shown as a graph. (C) Quantification of Ca2+ oscillatory activity in untreated and ki8751-treated embryos after stalk cells migrate out of the DA as in A and Figure 7—figure supplement 1A, respectively. Graphs show Ca2+ oscillation frequency (left) and mean ΔF/F0 (right) in tip cells, stalk cells and other ECs within the DA in untreated and ki8751-treated embryos. (Untreated, n ≥ 8; ki8751-treated, n ≥ 11). (D) Quantification of the number of synchronous and asynchronous Ca2+ rise between tip and stalk cells. We here define the case, in which a Ca2+ rise in one cell occurs within 10 s late behind a Ca2+ rise in the other cell, as synchronous. The number of synchronous and asynchronous Ca2+ rise were quantified in tip and stalk cells. Percentages of synchronous and asynchronous Ca2+ increase to total Ca2+ increase are shown. The total number of Ca2+ rise analyzed in tip cells and stalk cells is indicated at the top. (E) Schematic illustration of Ca2+-oscillatory activity in stalk cells. Frequency of Ca2+ oscillations found in stalk cells are comparable to that in tip cells after stalk cells have completely come out from the DA. Scale bar, 10 mm in A. ***p < 0.001; NS, not significant. DA, dorsal aorta.
Figure 7—figure supplement 1
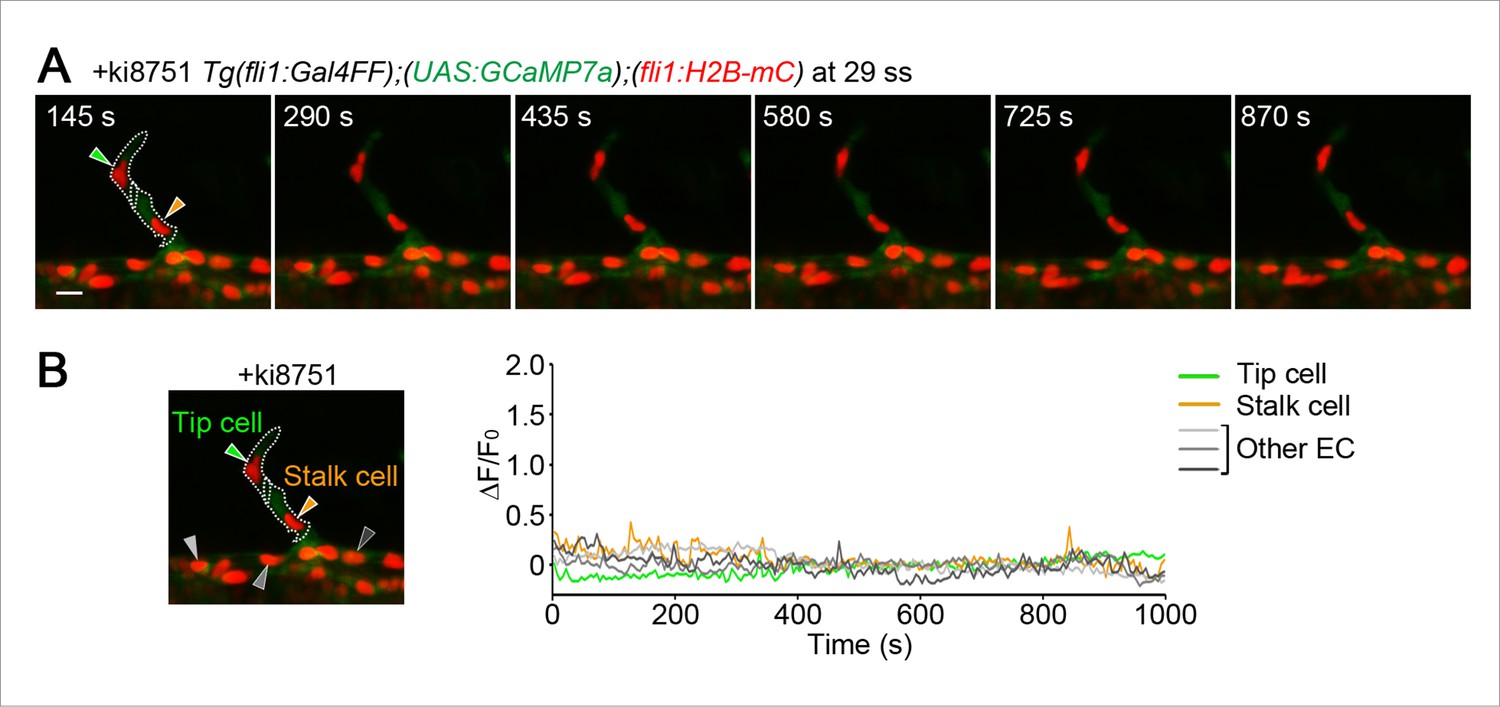
Ca2+ responses after stalk cell budding from the DA are dependent upon Vegfr.
(A) 3D-rendered time-sequential images of Tg(fli1:Gal4FF);(UAS:GCaMP7a);(fli1:H2B-mC) embryos treated with ki8751 after stalk cells completely migrate out of the DA as in Figure 7A. The embryos were treated from 28 ss with ki8751 and time-lapse imaged at 29 ss. Green and orange arrowheads indicate tip and stalk cells, respectively. (B) The fluorescence changes in GCaMP7a (ΔF/F0) of individual ECs from A indicated by arrowheads at the left panel are shown as a graph. Scale bar, 10 μm in A.
Figure 7—figure supplement 2

An EC following a stalk cell exhibits significant Ca2+ oscillations.
(A) 3D-rendered time-sequential images of Tg(fli1:Gal4FF);(UAS:GCaMP7a);(fli1:H2B-mC) embryos at 31 ss when a EC following tip and stalk cells is budding from the DA. Green and orange arrowheads indicate tip and stalk cells, respectively. A blue arrowhead indicates an EC following a stalk cell. (B) The fluorescence changes in GCaMP7a (ΔF/F0) of individual ECs from A indicated by arrowheads (green, blue, orange, light gray, dark gray, and black) at the left panel are shown as a graph. Scale bar, 10 μm in A.
Figure 8

Dll4 attenuates Ca2+ oscillations in the entire DA before ISV sprouting.
(A) 3D-rendered time-sequential images of Tg(fli1:Gal4FF);(UAS:GCaMP7a);(fli1:H2B-mC) embryos before ISV sprouting injected with dll4 MO (17 ss). Yellow dashed lines indicate positions of somite boundaries. (B) The DA is subdivided into three regions (Region 1–3) as illustrated in the scheme (left). The fluorescence changes in GCaMP7a (ΔF/F0) of individual ECs from A are shown as separated graphs (Region 1–3) as in Figure 3B. A representative graph of two ECs at each region is shown. (C) Quantification of Ca2+ oscillation frequency (upper) and mean ΔF/F0 (lower) in ECs of the indicated regions within the DA in control MO- or dll4 MO-injected embryos before vessel sprouting (17–19 ss). Horizontal lines represent mean ± s.d. (n ≥ 16). Scale bar, 10 mm in A. *p < 0.05, **p < 0.01, ***p < 0.001. DA, dorsal aorta.
Figure 9 with 4 supplements
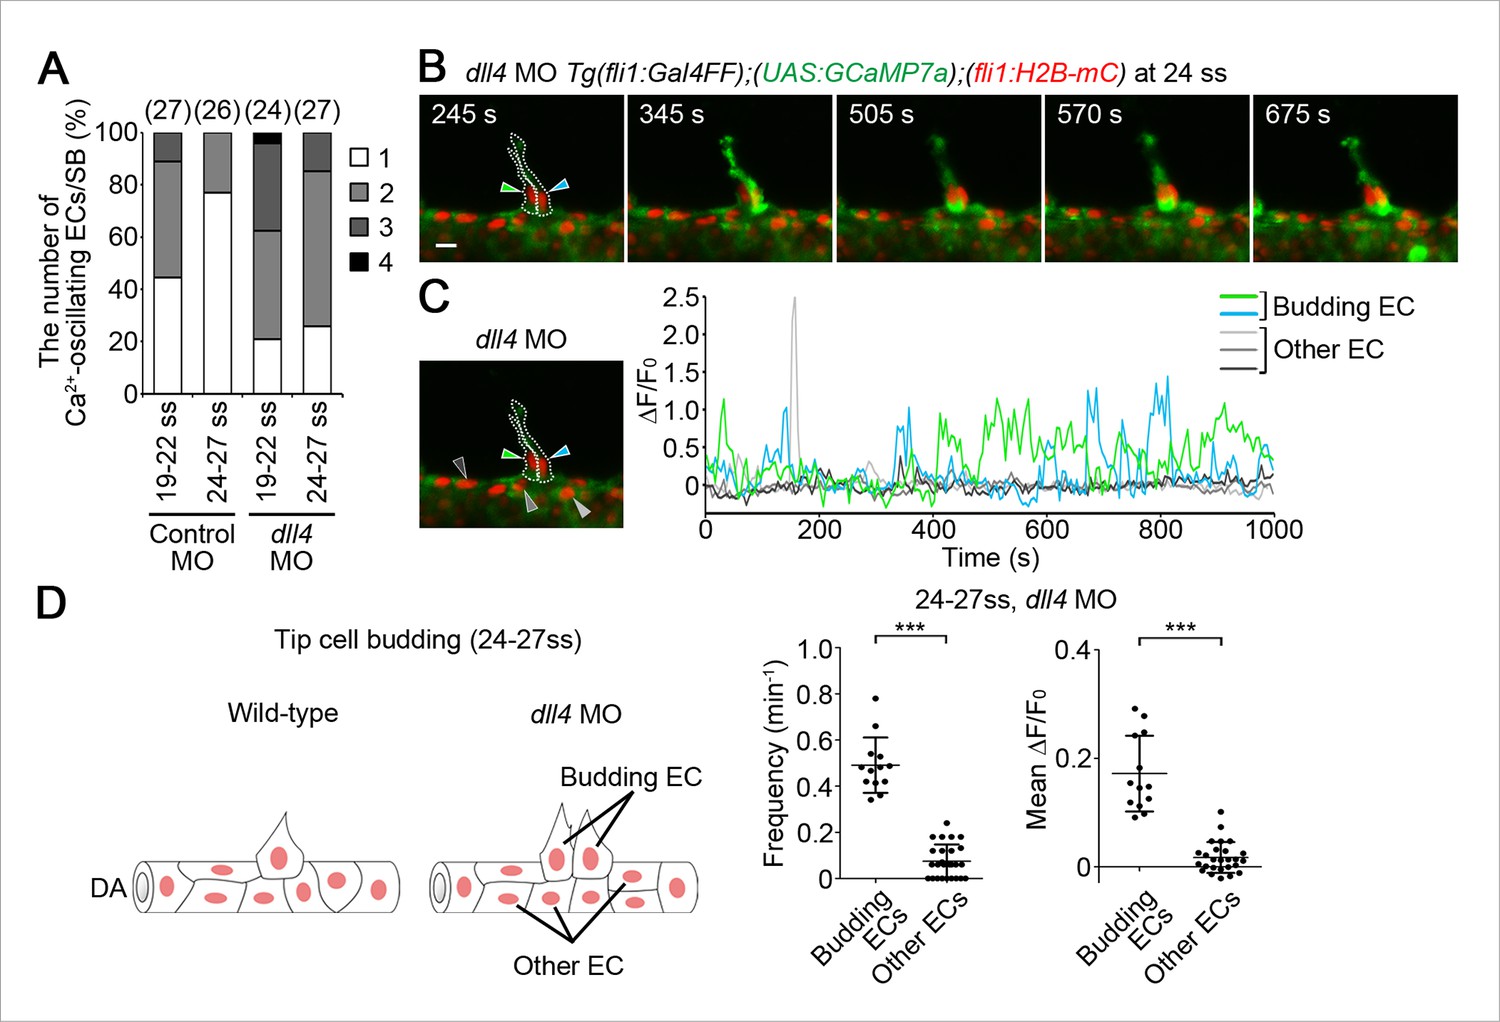
Dll4 is involved in suppressing Ca2+ responses in ECs adjacent to tip cells.
(A) The number of Ca2+-oscillating ECs at each somite boundary of the embryo injected with control MO or dll4 MO was quantified as in Figure 4A. (B) 3D-rendered time-sequential images of Tg(fli1:Gal4FF);(UAS:GCaMP7a);(fli1:H2B-mC) embryos during tip cell budding injected with dll4 MO (24 ss). Green and blue arrowheads indicate two neighboring Ca2+-oscillating ECs, both of which are budding from the DA. (C) The fluorescence changes in GCaMP7a (ΔF/F0) of individual ECs from B indicated by arrowheads at the left panel are shown as a graph. (D) Ca2+ oscillation frequency (left) and mean ΔF/F0 (right) in budding ECs and other ECs within the DA in dll4 morphants during tip cell budding at 24–27 ss as illustrated at the left panel (n ≥ 13). Scale bar, 10 mm in B. ***p < 0.001. DA, dorsal aorta.
Figure 9—figure supplement 1
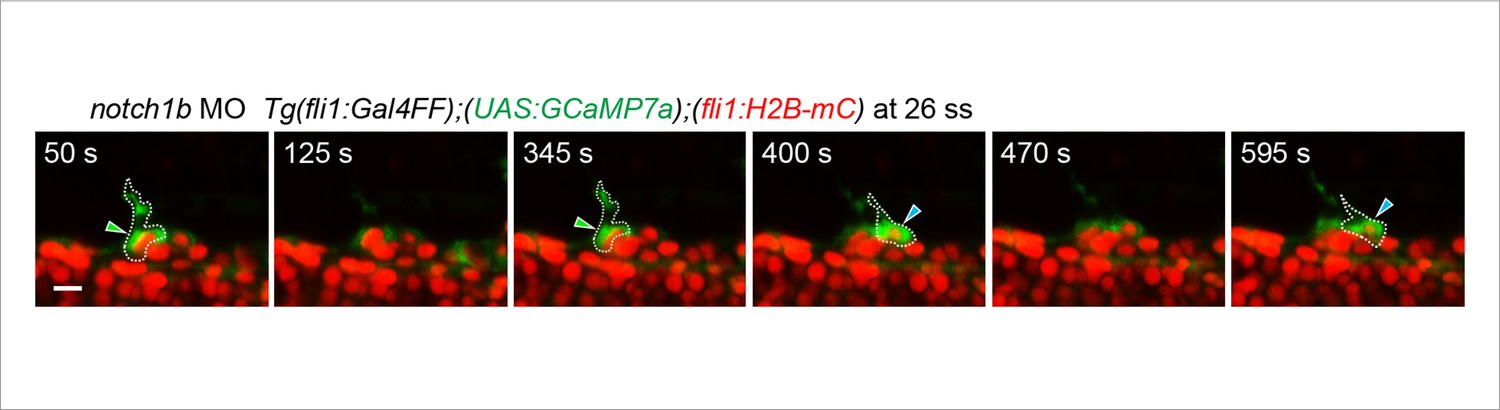
Ca2+ oscillations were maintained in two neighboring ECs in notch1b morphants during tip cell budding from the DA.
3D-rendered time-sequential images of Tg(fli1:Gal4FF);(UAS:GCaMP7a);(fli1:H2B-mC) embryos during tip cell budding injected with notch1b MO (26 ss). Green and blue arrowheads indicate the two neighboring Ca2+-oscillating ECs, both of which are budding from the DA. Scale bar, 10 mm.
Figure 9—figure supplement 2
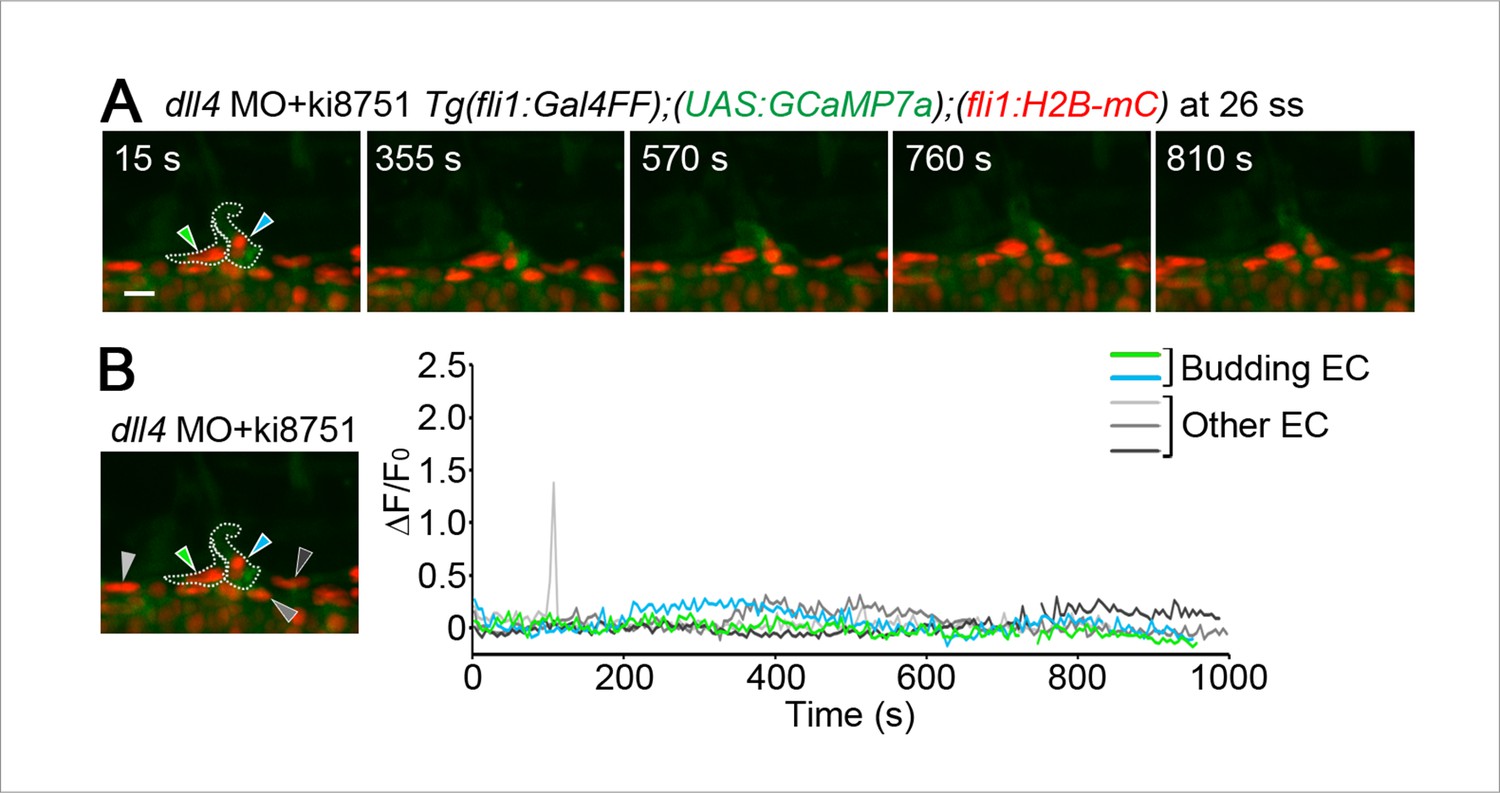
Vegfr is responsible for ectopic Ca2+ oscillations observed in dll4 morphants.
(A) 3D-rendered time-sequential images of Tg(fli1:Gal4FF);(UAS:GCaMP7a);(fli1:H2B-mC) embryos injected with dll4 MO and treated with ki8751 during tip cell budding (26 ss). (B) The fluorescence changes in GCaMP7a (ΔF/F0) of individual ECs from A indicated by arrowheads at the left panel are shown as a graph. Scale bar, 10 mm in A.
Figure 9—figure supplement 3
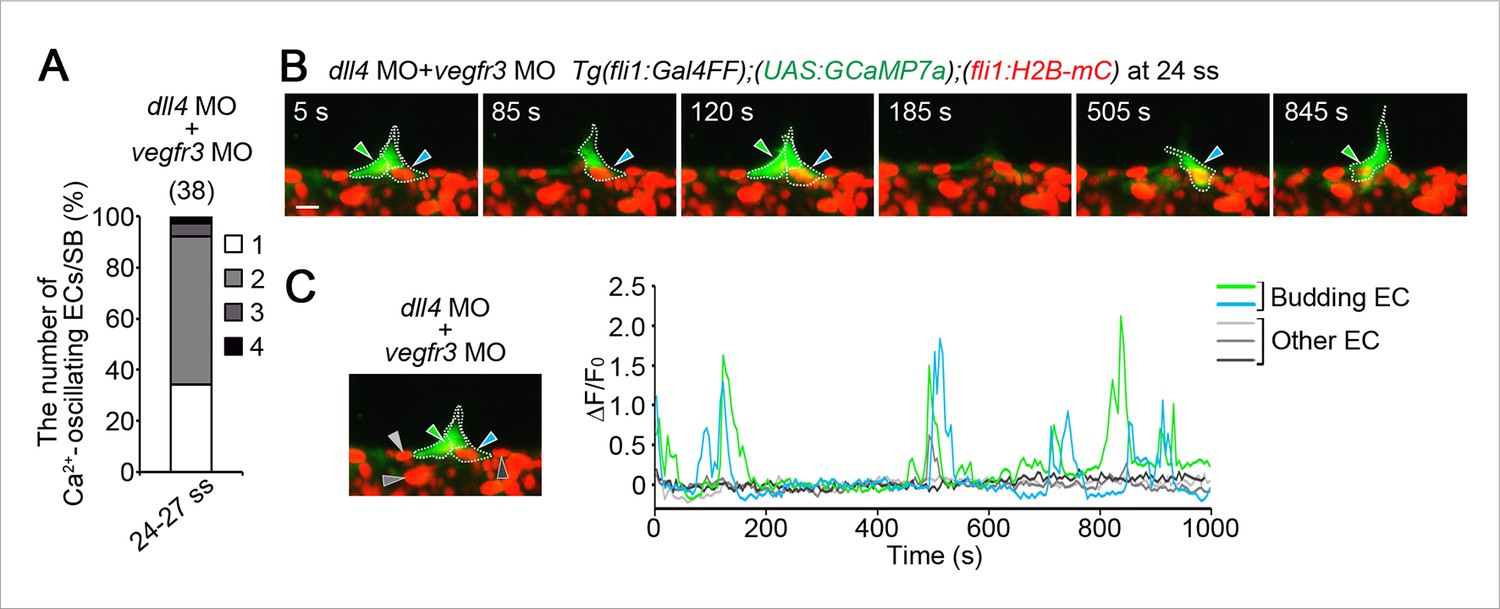
Vegfr3 is partially involved in increases in oscillating cells in dll4 morphants.
(A) The number of Ca2+-oscillating ECs at each somite boundary of Tg(fli1:Gal4FF);(UAS:GCaMP7a);(fli1:H2B-mC) embryos injected with both dll4 and vegfr3 MOs was quantified at somite boundaries (total 38) at 24–27 ss as in Figure 4A. (B) 3D-rendered time-sequential images of Tg(fli1:Gal4FF);(UAS:GCaMP7a);(fli1:H2B-mC) embryos injected with both dll4 and vegfr3 MOs during tip cell budding (24 ss). Green and blue arrowheads indicate two neighboring Ca2+-oscillating ECs, both of which are budding from the DA. (C) Fluorescence changes in GCaMP7a (ΔF/F0) of individual ECs from B indicated by arrowheads at the left panel are shown as a graph. Scale bar, 10 mm in B.
Figure 9—figure supplement 4
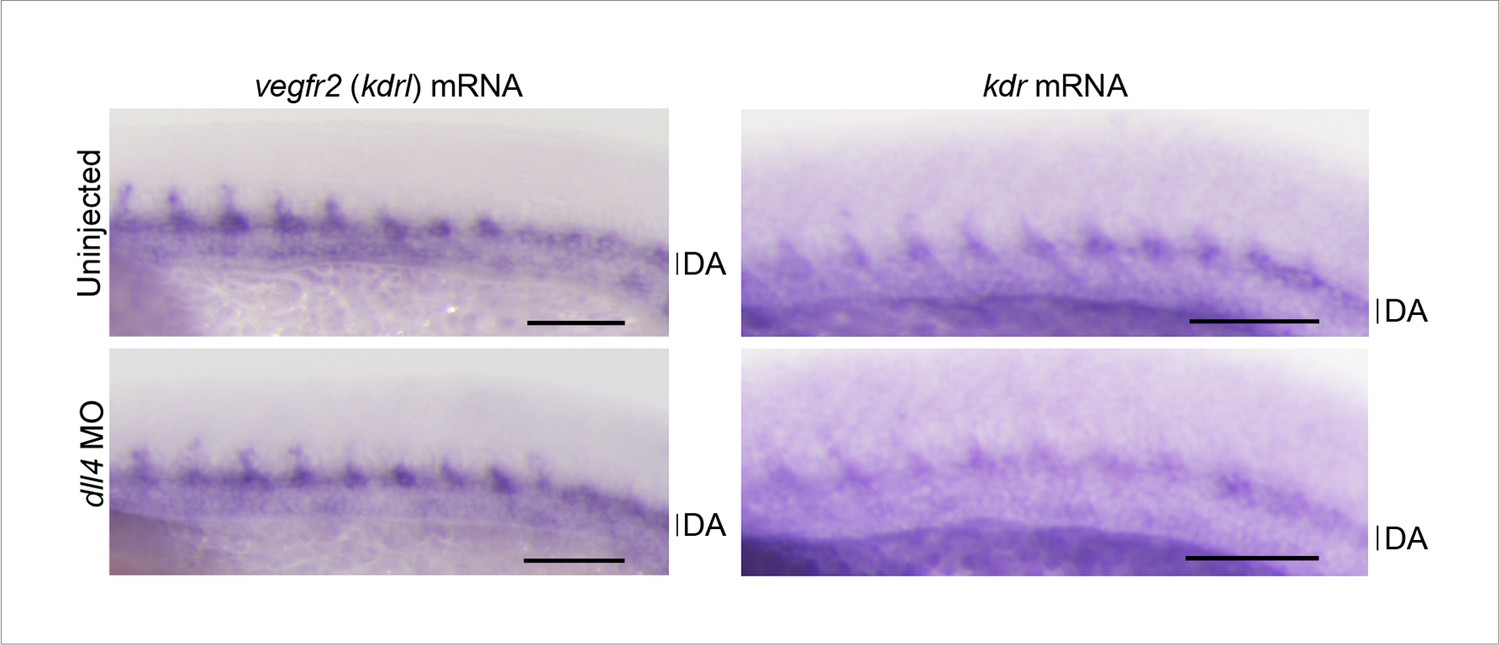
The expression of neither vegfr2 nor kdr is not altered in the trunk vessels of dll4 morphants.
Whole-mount in situ hybridization (WISH) analyses of the embryos (26–27 ss) uninjected or injected with dll4 MO using antisense probe for vegfr2 (also termed kdrl) and kdr (kdrb), a paralog of vegfr2. Note that the expression of vegfr2 and kdr mRNA in the DA and the sprouting ISVs observed in wild-type embryos is not altered in dll4 morphants. A set of representative images of two independent experiments is shown. Scale bar, 100 μm. DA, dorsal aorta.
Figure 10
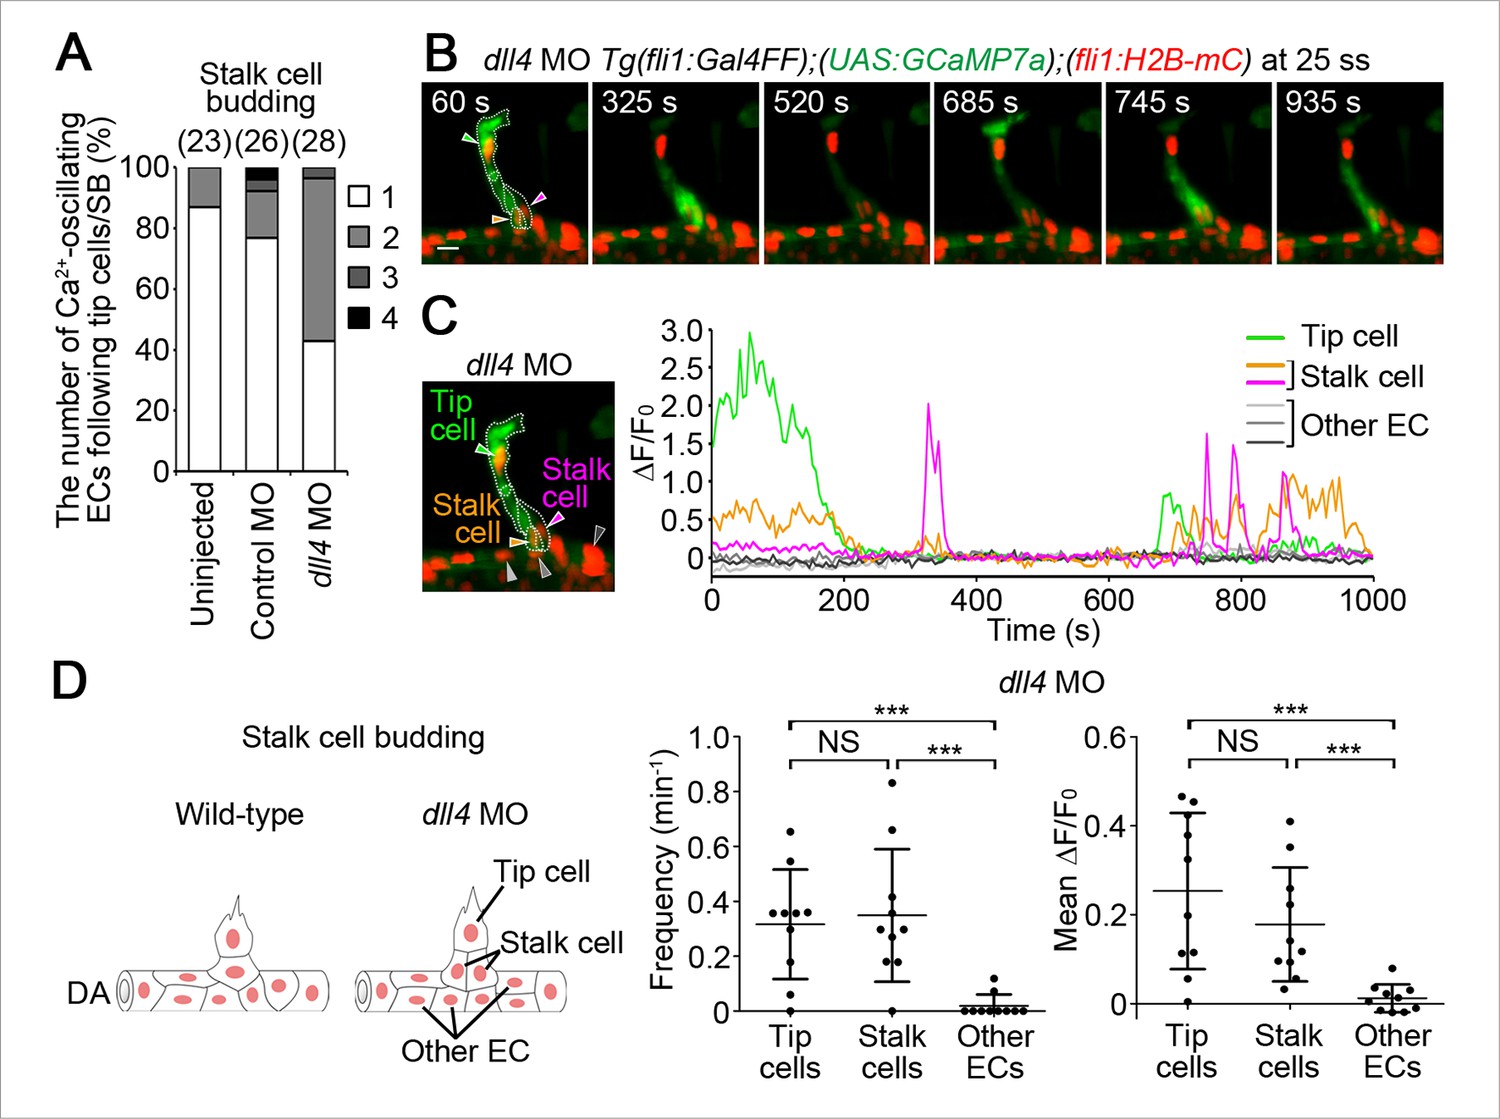
Dll4 is involved in the selection of single stalk cells.
(A) The number of Ca2+-oscillating ECs following tip cells in each ISV of uninjected, or control MO- or dll4 MO-injected Tg(fli1:Gal4FF);(UAS:GCaMP7a);(fli1:H2B-mC) embryos during stalk cell budding when an EC/ECs following a tip cell is/are budding from the DA. Graph shows the occurrence rate of the indicated numbers of Ca2+-oscillating cells in each ISV among the total number of ISVs observed (indicated at the top). (B) 3D-rendered time-sequential images of Tg(fli1:Gal4FF);(UAS:GCaMP7a);(fli1:H2B-mC) embryos during stalk cell budding from the DA injected with dll4 MO (25 ss). A green arrowhead indicates tip cell. Orange and red arrowheads indicate budding stalk cells following tip cell. (C) The fluorescence changes in GCaMP7a (ΔF/F0) of individual ECs from B indicated by arrowheads at the left panel are shown as a graph. (D) Ca2+ oscillation frequency (left) and mean ΔF/F0 (right) in tip cells, stalk cells, and other ECs within the DA in dll4 morphants during stalk cell budding (n ≥ 10). As illustrated at the left panel, we designated budding ECs that follow tip cells as stalk cells. Scale bar, 10 mm in B. ***p < 0.001; NS, not significant. DA, dorsal aorta.
Figure 11

Dll4 does not regulate Ca2+ oscillations in stalk cells after they completely migrate out of the DA.
(A) 3D-rendered time-sequential images of Tg(fli1:Gal4FF);(UAS:GCaMP7a);(fli1:H2B-mC) embryos after stalk cell budding from the DA injected with dll4 MO (27 ss). Green and orange arrowheads indicate tip and stalk cells, respectively. (B) The fluorescence changes in GCaMP7a (ΔF/F0) of individual ECs from A indicated by arrowheads at the left panel are shown as a graph. (C) Ca2+ oscillation frequency (left) and mean ΔF/F0 (right) in tip cells, stalk cells, and other ECs within the DA in control MO- or dll4 MO-injected embryos after stalk cell budding from the DA as illustrated at the left panel. (n ≥ 9). Scale bar, 10 mm in A.
Figure 12
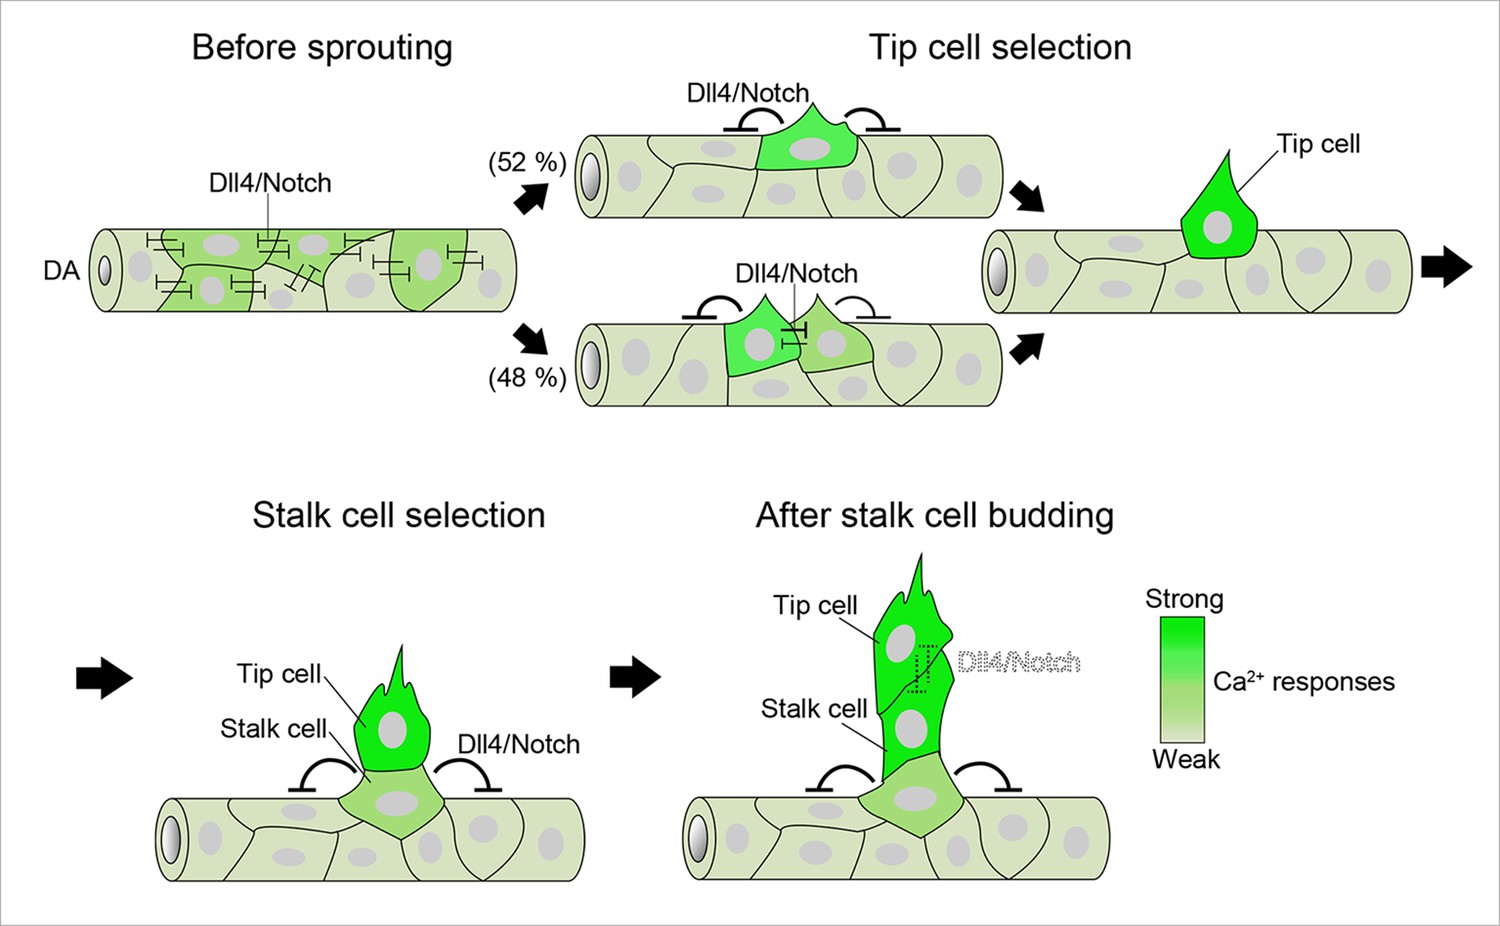
A schematic representation of endothelial Ca2+ responses during sprouting angiogenesis from the DA.
Ca2+ oscillations occur widely within the DA before ISV sprouting. Dll4/Notch signaling attenuates Ca2+ responses in the entire DA at this stage. Ca2+ oscillations are restricted to single or two neighboring ECs just after vessel sprouting and then further restricted to single ECs that eventually become tip cells. Dll4/Notch signaling is required for the selection of single tip cells. During stalk cell budding, tip cells and stalk cells exhibit Ca2+ oscillations, although the Ca2+-oscillatory activity in stalk cells is weaker than that in tip cells. Dll4/Notch signaling regulates the selection of single stalk cells. After stalk cells completely come out from the DA, strong Ca2+ oscillations occur both in tip cells and stalk cells. Intensity of green reflects the frequency of Ca2+ oscillations. DA, dorsal aorta.
Videos
Video 1
Ca2+ oscillations in tip cell during budding from the dorsal aorta (DA).
Time-lapse recording of 3D-rendered light sheet images of the Tg(fli1:Gal4FF);(UAS:GCaMP7a);(fli1:H2B-mC) embryos at 24 somite stage (ss). Green, GCaMP7a fluorescence; red, H2B-mC fluorescence. Elapsed time from the start point of imaging is in seconds (s). Lateral view, anterior to the left. Scale bar, 10 μm.
Video 2
Ca2+ oscillations occur widely within the DA before vessel sprouting.
Time-lapse recording of 3D-rendered light sheet images of the Tg(fli1:Gal4FF);(UAS:GCaMP7a);(fli1:H2B-mC) embryos at 18 ss. Green, GCaMP7a fluorescence; red, H2B-mC fluorescence. Elapsed time is in seconds (s). Scale bar, 10 μm.
Video 3
The process of tip cell selection.
Time-lapse recording of 3D-rendered light sheet images of the Tg(fli1:Gal4FF);(UAS:GCaMP7a);(fli1:H2B-mC) embryos just after vessel sprouting from the DA (22 ss). Elapsed time is in seconds (s). Scale bar, 10 μm.
Video 4
Ca2+ oscillations occur in stalk cell during budding from the DA.
Time-lapse recording of 3D-rendered light sheet images of the Tg(fli1:Gal4FF);(UAS:GCaMP7a);(fli1:H2B-mC) embryos at 29 ss. Elapsed time is in seconds (s). Scale bar, 10 μm.
Video 5
Ca2+ oscillations occur both in tip and stalk cells after stalk cell migrates out of the DA.
Time-lapse recording of 3D-rendered light sheet images of the Tg(fli1:Gal4FF);(UAS:GCaMP7a);(fli1:H2B-mC) embryos at 29 ss. Elapsed time is in seconds (s). Scale bar, 10 μm.
Video 6
Ca2+ oscillations are maintained in two neighboring cells in the absence of dll4 during tip cell budding.
Time-lapse recording of 3D-rendered light sheet images of the Tg(fli1:Gal4FF);(UAS:GCaMP7a);(fli1:H2B-mC) embryos during tip cell budding from the DA injected with dll4 morpholino antisense oligo (MO). The recording started at 24 somite stage. Elapsed time is in seconds (s). Scale bar, 10 μm.
Download links
A two-part list of links to download the article, or parts of the article, in various formats.
Downloads (link to download the article as PDF)
Open citations (links to open the citations from this article in various online reference manager services)
Cite this article (links to download the citations from this article in formats compatible with various reference manager tools)
Endothelial Ca2+ oscillations reflect VEGFR signaling-regulated angiogenic capacity in vivo
eLife 4:e08817.
https://doi.org/10.7554/eLife.08817


